Professor of Engineering Systems and Civil and Environmental Engineering Massachusetts … · Dr....
24
Garage Case – Flexible Design / RdN © Value of Flexibility Dr. Richard de Neufville Professor of Engineering Systems and Civil and Environmental Engineering Massachusetts Institute of Technology
Transcript of Professor of Engineering Systems and Civil and Environmental Engineering Massachusetts … · Dr....
Garage Case – Flexible Design / RdN ©
Value of Flexibility
Dr. Richard de Neufville
Professor of Engineering Systems andCivil and Environmental Engineering
Massachusetts Institute of Technology

Garage Case – Flexible Design / RdN ©
an introductionusing a spreadsheet analysis
of a multi-story parking garageDeveloped from
“Valuing Options by Spreadsheet: Parking Garage Case Example,”
ASCE J. of Infrastructure Systems, 2006R. de Neufville, S. Scholtes, and T. Wang
Value of Flexibility
Garage Case – Flexible Design / RdN ©
Intended “Take-Aways”
Design for fixed objective (mission or specifications) is engineering base case
Recognizing variability => different design (because of system non-linearities)
Recognizing flexibility => even better design (it avoids costs, expands only as needed)
Garage Case – Flexible Design / RdN ©
Value at Risk and Gain
Value at Risk and Gain (VARG) recognizes fundamental reality: value of any design can only be known probabilistically
Because of inevitable uncertainty inFuture demands on systemFuture performance of technologyMany other market, political factors

Garage Case – Flexible Design / RdN ©
Value at Risk and Gain Definition
Value at Risk definition:A loss that will not be exceeded at some specified confidence level“We are p percent certain that we will not lose more than V dollars for this project.”
Value at Gain similar – on the upside
VARG easy to see on cumulative probability distribution (see next figure)
Garage Case – Flexible Design / RdN ©
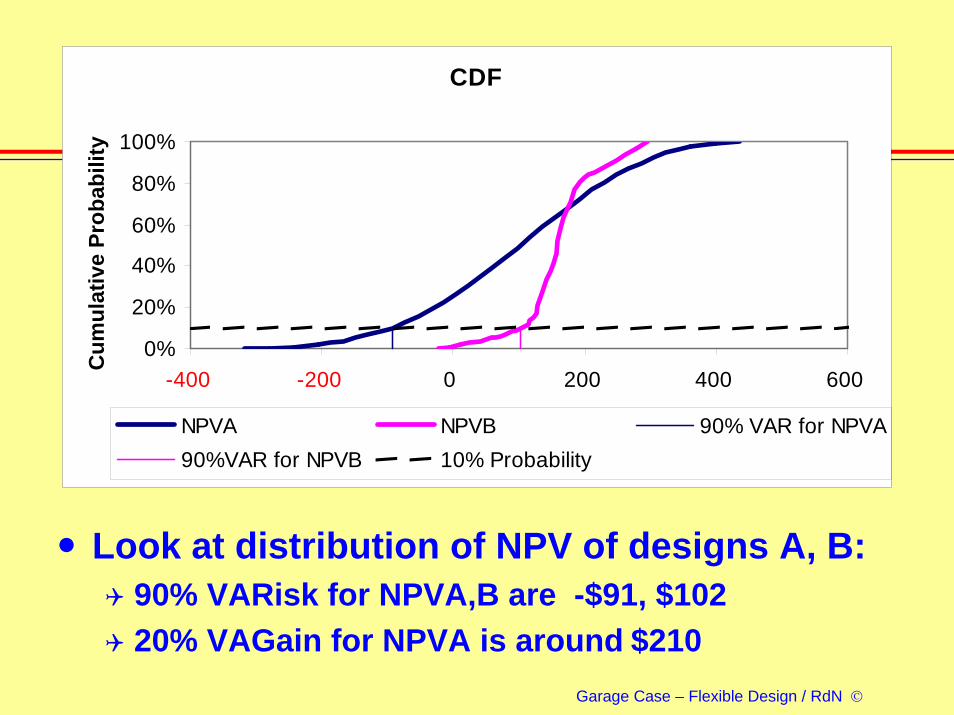
Look at distribution of NPV of designs A, B:90% VARisk for NPVA,B are -$91, $10220% VAGain for NPVA is around $210
CDF
0%
20%
40%
60%
80%
100%
-400 -200 0 200 400 600
NPV
Cum
ulat
ive
Prob
abili
ty
NPVA NPVB 90% VAR for NPVA90%VAR for NPVB 10% Probability

Garage Case – Flexible Design / RdN ©
Cumulative distribution function (CDF) shows the probability that the value of a variable is < or = to quantity on x axis
VARG can be found on the CDF curve:90% VARisk => 10% probability the value is less or equalNPV corresponding to the 10% CDF is 90% VARiskNPV for 90% CDF is 10% Value at Gain
Notes

Garage Case – Flexible Design / RdN ©
VAR and Flexibility
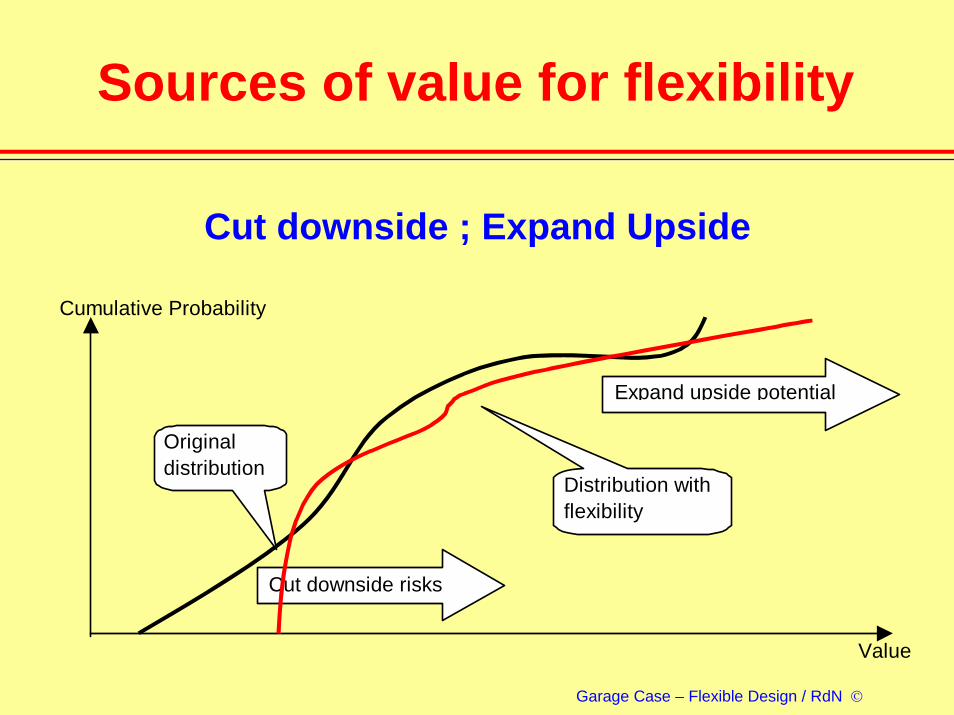
VAR is a common financial conceptIt stresses downside losses, risks However, designers also need to look at upside potential: “Value of Gain”
Flexible design provides value by both:Decreasing downside riskIncreasing upside potentialSee next figure
Garage Case – Flexible Design / RdN ©
Sources of value for flexibility
Cumulative Probability
Value
Original distribution
Distribution with flexibility
Cut downside risks
Expand upside potential
Cut downside ; Expand Upside
Garage Case – Flexible Design / RdN ©
Excel Analysis Sequence toillustrate value of flexibility
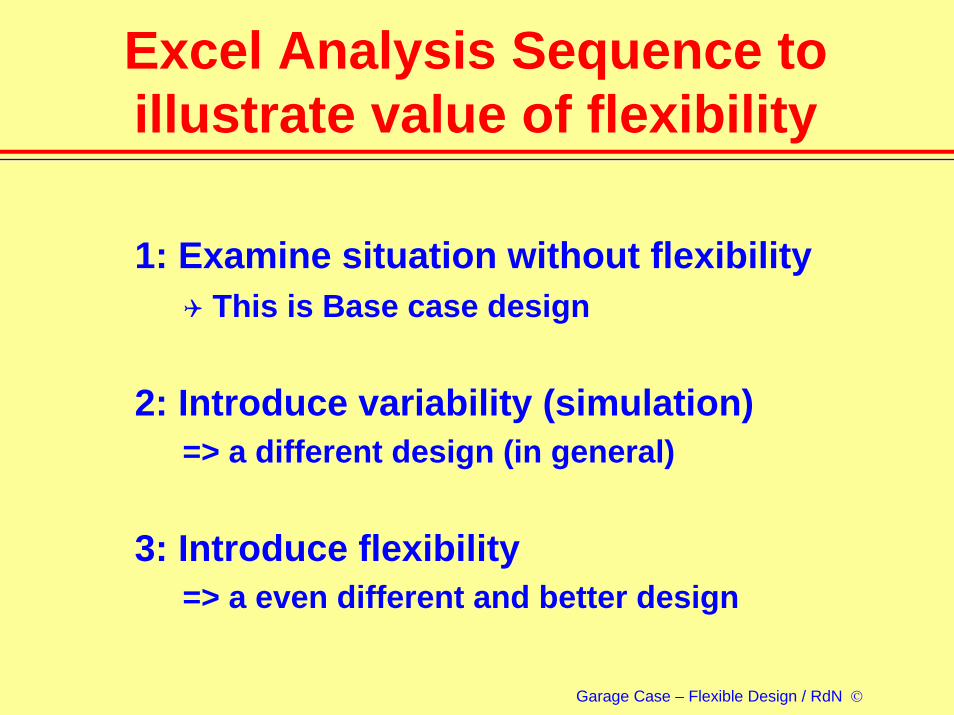
1: Examine situation without flexibilityThis is Base case design
2: Introduce variability (simulation)=> a different design (in general)
3: Introduce flexibility=> a even different and better design
Garage Case – Flexible Design / RdN ©
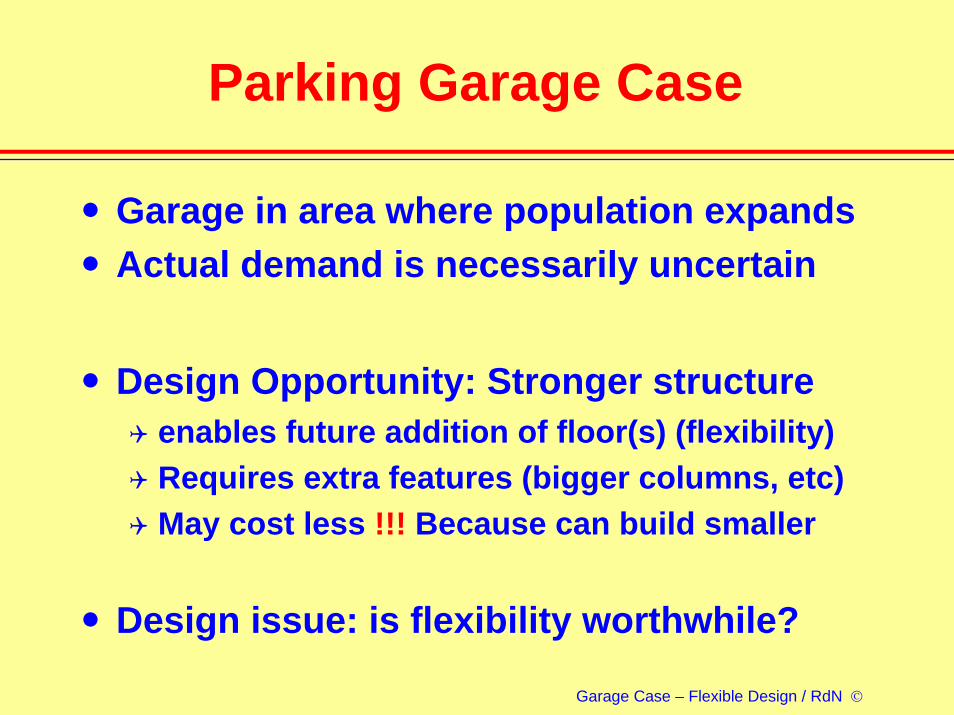
Parking Garage Case
Garage in area where population expandsActual demand is necessarily uncertain
Design Opportunity: Stronger structureenables future addition of floor(s) (flexibility)Requires extra features (bigger columns, etc)May cost less !!! Because can build smaller
Design issue: is flexibility worthwhile?

Garage Case – Flexible Design / RdN ©
Parking Garage Case details
DemandAt start is for 750 spacesOver next 10 years is expected to rise exponentially by another 750 spacesAfter year 10 may be 250 more spacescould be 50% off the projections, either way;Annual volatility for growth is 10%
Average annual revenue/space used = $10,000
The discount rate is taken to be 12%
Garage Case – Flexible Design / RdN ©
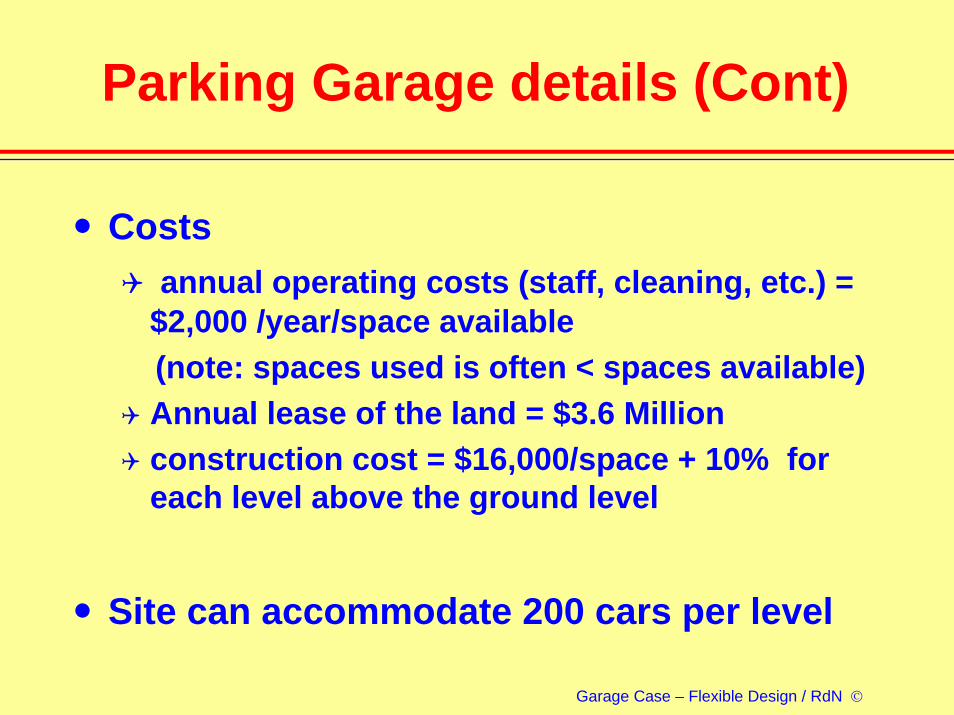
Parking Garage details (Cont)
Costsannual operating costs (staff, cleaning, etc.) =
$2,000 /year/space available (note: spaces used is often < spaces available)Annual lease of the land = $3.6 Million construction cost = $16,000/space + 10% for each level above the ground level
Site can accommodate 200 cars per level
Garage Case – Flexible Design / RdN ©
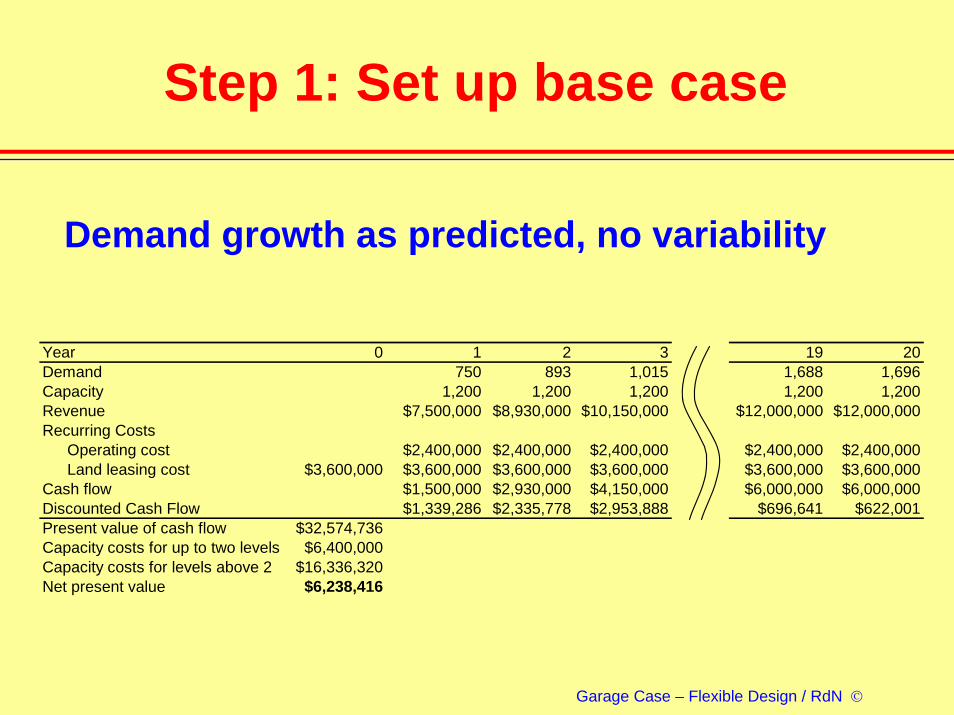
Step 1: Set up base case
0 1 2 3 19 20Demand 750 893 1,015 1,688 1,696Capacity 1,200 1,200 1,200 1,200 1,200Revenue $7,500,000 $8,930,000 $10,150,000 $12,000,000 $12,000,000Recurring Costs
Operating cost $2,400,000 $2,400,000 $2,400,000 $2,400,000 $2,400,000Land leasing cost $3,600,000 $3,600,000 $3,600,000 $3,600,000 $3,600,000 $3,600,000
Cash flow $1,500,000 $2,930,000 $4,150,000 $6,000,000 $6,000,000Discounted Cash Flow $1,339,286 $2,335,778 $2,953,888 $696,641 $622,001Present value of cash flow $32,574,736Capacity costs for up to two levels $6,400,000Capacity costs for levels above 2 $16,336,320Net present value $6,238,416
Year
Demand growth as predicted, no variability

Garage Case – Flexible Design / RdN ©
Optimal design for base case (no uncertainty) is 6 floors
-15
-10
-5
0
5
10
2 3 4 5 6 7 8 9
NUMBER OF LEVELS
TRADITIONAL NPV
Garage Case – Flexible Design / RdN ©
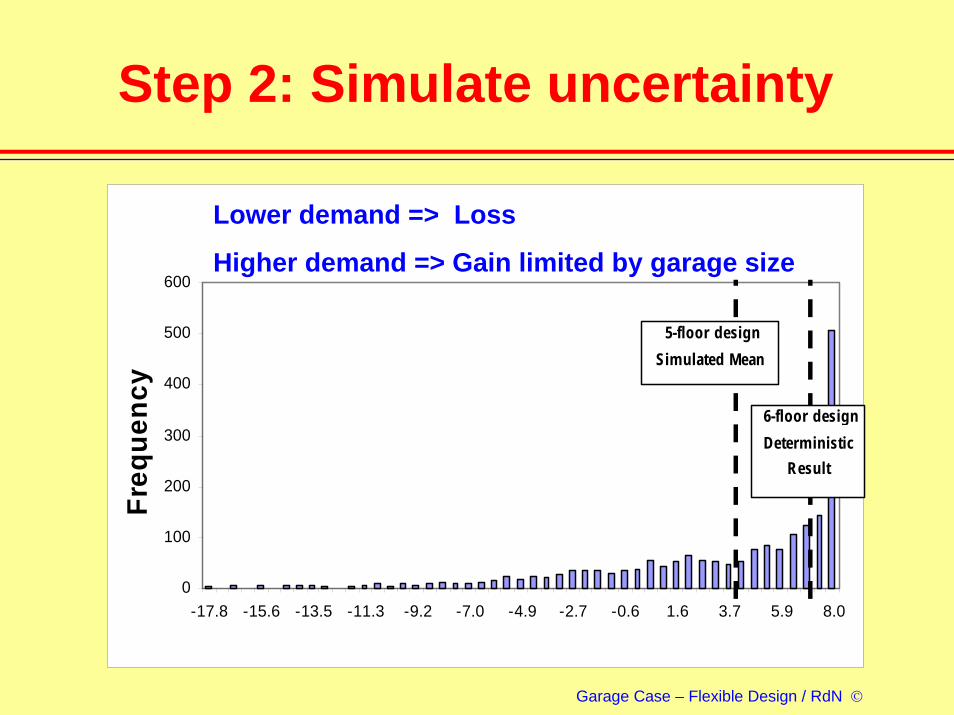
Step 2: Simulate uncertainty
0
100
200
300
400
500
600
-17.8 -15.6 -13.5 -11.3 -9.2 -7.0 -4.9 -2.7 -0.6 1.6 3.7 5.9 8.0
Freq
uenc
y
5-floor design Sim ulated Mean
6-floor design Determ inistic
Result
Lower demand => Loss
Higher demand => Gain limited by garage size

Garage Case – Flexible Design / RdN ©
NPV Cumulative Distributions
0
0.1
0.2
0.3
0.4
0.5
0.6
0.7
0.8
0.9
1
-20 -15 -10 -5 0 5 10
Prob
abili
ty
CDF for Result of Simulation Analysis (5-
floor) Implied CDF for Result of
Deterministic NPV A l i (6 fl )
Compare Actual (5 Fl) with unrealistic fixed 6 Fl design
Garage Case – Flexible Design / RdN ©
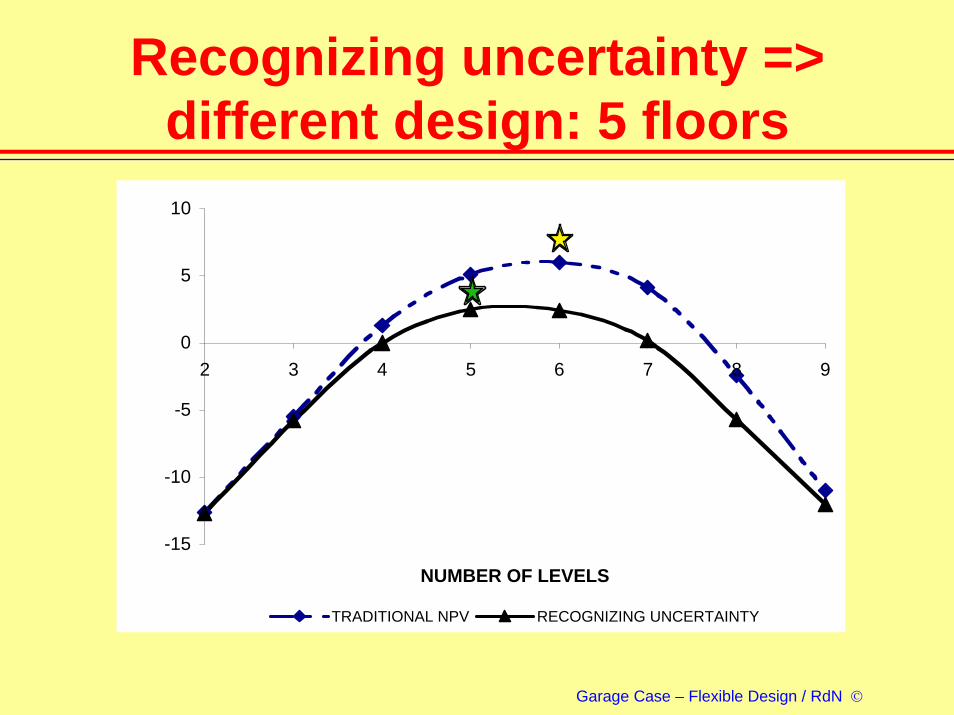
Recognizing uncertainty => different design: 5 floors
-15
-10
-5
0
5
10
2 3 4 5 6 7 8 9
NUMBER OF LEVELS
TRADITIONAL NPV RECOGNIZING UNCERTAINTY

Garage Case – Flexible Design / RdN ©
Step 3: Introduce flexibility into design (expand when needed)
0 1 2 3 19 20Demand 820 924 1,044 1,519 1,647Capacity 800 800 1,200 1,600 1,600
Decision on expansion expandExtra capacity 400
Revenue $8,000,000 $8,000,000 $10,440,000 $15,190,000 $16,000,000Recurring Costs
Operating cost $1,600,000 $1,600,000 $2,400,000 $3,200,000 $3,200,000Land leasing cost $3,600,000 $3,600,000 $3,600,000 $3,600,000 $3,600,000 $3,600,000Expansion cost $8,944,320
Cash flow $2,800,000 -$6,144,320 $4,440,000 $8,390,000 $9,200,000Discounted Cash Flow $2,500,000 -$4,898,214 $3,160,304 $974,136 $953,734Present value of cash flow $30,270,287Capacity cost for up to two levels $6,400,000Capacity costs for levels above 2 $7,392,000Price for the option $689,600Net present value $12,878,287
Year
Including Flexibility => Another, better design:
4 Fl with stronger structure enabling expansion

Garage Case – Flexible Design / RdN ©
Summary of design results from different perspectives
Why is the optimal design much better when we design with flexibility?
Perspective Simulation Option Embedded Design Estimated Expected NPVDeterministic No No 6 levels $6,238,416
Recognizing Uncertainty Yes No 5 levels $3,536,474
Incorporating Flexibilty Yes Yes 4 levels with strengthened structure $10,517,140

Garage Case – Flexible Design / RdN ©
Sources of value for flexibility:
0
0.1
0.2
0.3
0.4
0.50.6
0.7
0.8
0.9
1
-20 -15 -10 -5 0 5 10
Prob
abili
ty
5-Floor Design 4-Floor Design
1) Minimize exposure to downside risk
Garage Case – Flexible Design / RdN ©
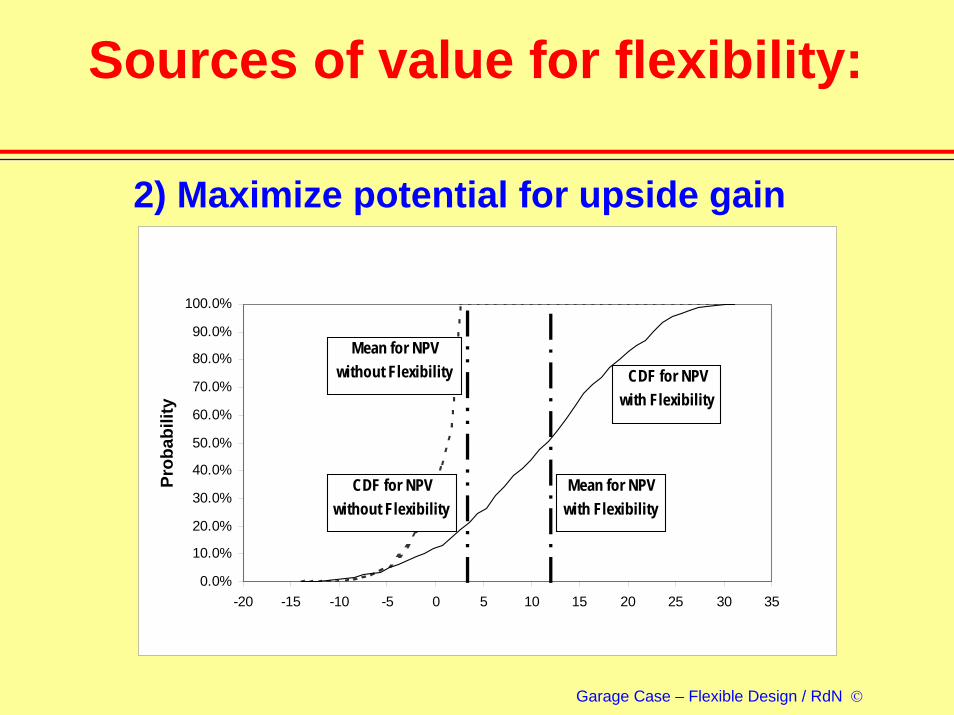
Sources of value for flexibility:
0.0%
10.0%
20.0%
30.0%
40.0%
50.0%
60.0%
70.0%
80.0%
90.0%
100.0%
-20 -15 -10 -5 0 5 10 15 20 25 30 35
Prob
abili
ty
CDF for NPV with Flexibility
CDF for NPV without Flexibility
Mean for NPV without Flexibility
Mean for NPV with Flexibility
2) Maximize potential for upside gain
Garage Case – Flexible Design / RdN ©
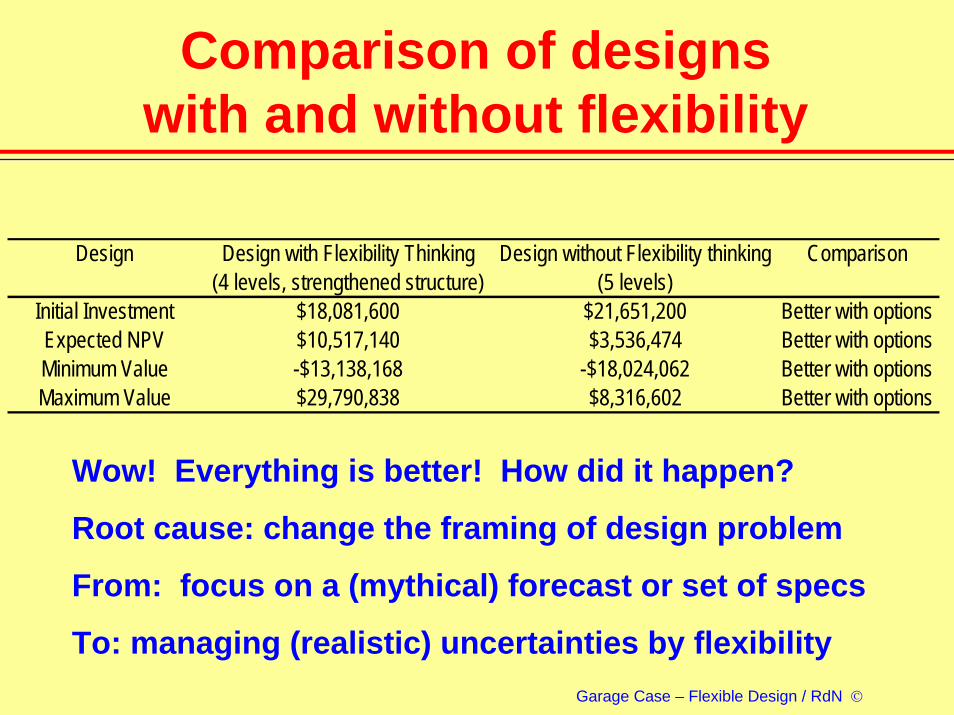
Comparison of designswith and without flexibility
Wow! Everything is better! How did it happen?
Root cause: change the framing of design problem
From: focus on a (mythical) forecast or set of specs
To: managing (realistic) uncertainties by flexibility
Design Design with Flexibility Thinking Design without Flexibility thinking Comparison(4 levels, strengthened structure) (5 levels)
Initial Investment $18,081,600 $21,651,200 Better with optionsExpected NPV $10,517,140 $3,536,474 Better with optionsMinimum Value -$13,138,168 -$18,024,062 Better with optionsMaximum Value $29,790,838 $8,316,602 Better with options

Garage Case – Flexible Design / RdN ©
Summary
Flexibility Adds great value
Sources of value for flexibilityCut downside risk; Expand upside potential
VARG chart is a neat way to represent the sources of value for flexibility
Spreadsheet with simulation is a powerful tool for estimating value of flexibility