AIRPORT LOCAL AIR QUALITY MODELLING: ZURICH AIRPORT EMISSIONS INVENTORY …€¦ · ·...
19
1 AIRPORT LOCAL AIR QUALITY MODELLING: ZURICH AIRPORT EMISSIONS INVENTORY USING THREE METHODOLOGIES Ayce Celikel, Nicolas Duchene, ENVISA, [email protected] , [email protected] Paris, France Ian Fuller, EUROCONTROL, [email protected] , Brétigny, France Emanuel Fleuti, Peter Hofmann UNIQUE, [email protected] , [email protected] , Zurich Airport, Switzerland Classification: Environmental Impacts and Mitigation Abstract Airport operators and airlines face pressure from two fronts – the impact of increasing air traffic on the environment and the growing public awareness of local air quality around airports. This pressure translates to additional constraints on airport capacity (Local Air Quality mainly) on top of other constraints already in place (e.g. noise restrictions). This paper describes the Zurich Airport Local Air Quality case study which compares 3 different emissions inventory tools: ALAQS-AV (Eurocontrol), LASPORT (German based) and EDMS (FAA). Following this comparison a preliminary set of guidelines defining airport modelling best practises is also expressed. In the end initial results from LASPORT dispersion calculation are presented. The study highlighted the importance of reliable and realistic parameters (especially aircraft engine emission indices and aircraft profiles) to provide accurate figures of the pollution around airports. The results of the comparison showed that all the models have similar global results for aircraft and stationary source emissions. However, vehicle related emissions showed some degree of variation due to differences in the methodologies and emission parameters. 1 EEC ALAQS Project 1.1 Introduction It is acknowledged that aviation industry is experiencing the quickest growth compared with other transport modes [1, 2]. Recent research has shown that air pollution caused by cars and industries show a tendency to decline while pollution coming from aircraft still continues to increase. Some European airports are already subject to pressure on their expansion plans due to air quality and other environmental concerns (e.g. Heathrow, Amsterdam…). Even though all the benefits that the airport brings; they have significant impacts on those living nearby. One of the constraints of Heathrow airport is to comply with the mandatory air quality limit values for NO 2 that will apply from 2010 (as set down in EU Directive 1999/30/EC) [3]. As a consequence, accurate air quality studies are becoming more important widespread in Europe. The environmental issues arising from airport operations have a direct impact on Air Traffic Management. Air Traffic generates activity at an airport (aircraft, vehicles, fixed sources, etc.) which
Transcript of AIRPORT LOCAL AIR QUALITY MODELLING: ZURICH AIRPORT EMISSIONS INVENTORY …€¦ · ·...
1
AIRPORT LOCAL AIR QUALITY MODELLING:
ZURICH AIRPORT EMISSIONS INVENTORY
USING THREE METHODOLOGIES Ayce Celikel, Nicolas Duchene, ENVISA, [email protected], [email protected] Paris, France
Ian Fuller, EUROCONTROL, [email protected], Brétigny, France
Emanuel Fleuti, Peter Hofmann UNIQUE, [email protected], [email protected], Zurich Airport, Switzerland
Classification: Environmental Impacts and Mitigation Abstract Airport operators and airlines face pressure from two fronts – the impact of increasing air traffic on the environment and the growing public awareness of local air quality around airports. This pressure translates to additional constraints on airport capacity (Local Air Quality mainly) on top of other constraints already in place (e.g. noise restrictions).
This paper describes the Zurich Airport Local Air Quality case study which compares 3 different emissions inventory tools: ALAQS-AV (Eurocontrol), LASPORT (German based) and EDMS (FAA). Following this comparison a preliminary set of guidelines defining airport modelling best practises is also expressed. In the end initial results from LASPORT dispersion calculation are presented.
The study highlighted the importance of reliable and realistic parameters (especially aircraft engine emission indices and aircraft profiles) to provide accurate figures of the pollution around airports. The results of the comparison showed that all the models have similar global results for aircraft and stationary source emissions. However, vehicle related emissions showed some degree of variation due to differences in the methodologies and emission parameters.
1 EEC ALAQS Project
1.1 Introduction It is acknowledged that aviation industry is experiencing the quickest growth compared with other transport modes [1, 2]. Recent research has shown that air pollution caused by cars and industries show a tendency to decline while pollution coming from aircraft still continues to increase.
Some European airports are already subject to pressure on their expansion plans due to air quality and other environmental concerns (e.g. Heathrow, Amsterdam…). Even though all the benefits that the airport brings; they have significant impacts on those living nearby. One of the constraints of Heathrow airport is to comply with the mandatory air quality limit values for NO2 that will apply from 2010 (as set down in EU Directive 1999/30/EC) [3]. As a consequence, accurate air quality studies are becoming more important widespread in Europe.
The environmental issues arising from airport operations have a direct impact on Air Traffic Management. Air Traffic generates activity at an airport (aircraft, vehicles, fixed sources, etc.) which
2
in turn generate emissions (combustion, evaporation, spraying) that reduce air quality and adversely affect human health. If the amount of pollution in the air quality exceeds legislated levels the airport operations will be constrained. Consequently it is becoming more important to estimate airport contribution to the overall degradation of the air quality. At the same time it’s a common approach for airports to provide emissions inventories or pollutant concentrations as input to city models for predicting changes in pollution concentrations. But at the moment there are no harmonized air quality methodologies that can be used in Europe. As a consequence EUROCONTROL initiated the ALAQS (Airport Local Air Quality Studies) Project which aims at addressing strategic, methodological and practical issues surrounding air quality assessment around airports. The project will provide to airports and practitioners the ‘best practice’ emissions inventory and dispersion modelling methods, guidelines and a supporting toolset that can be applied at Pan-European level.
1.2 Context Transport plays an essential role in economic and social development as well as in the creation of wealth of our societies. It ensures access to jobs, housing, goods and services and answer to the need of people for mobility [5]. However, the continuing expansion of air transport raises serious concerns about long-term sustainability of the industry. According to IATA, European passenger air traffic more than doubled during the 1985 – 1998 period (an average growth of almost 7% a year) and the overall demand is expected to continue to rise. Similar trends have been reported by the ICAO and the IPCC (International Panel on Climate Change) [6, 7]. Additionally it is forecasted by Eurocontrol that the number of flight in Europe 2025 will be between 1.6 and 2.1 times the traffic of 2003, up to 17 millions flights in the case of a fast growth scenario [8]. As a consequence, environmental issues became serious constraints for the growth of the industry and the capacity.
For an airport the first step for conducting an air quality study consists in producing an emissions inventory [9]. In general term, emissions inventories provide with the total amount of pollutants generated from defined emission sources for a selected period (e.g. tons of NOx per year). Airport air pollution does not depend only on aircraft movements in the air and on the ground. Other sources of pollution are as important; such as the emissions from airport induced road traffic, the ground support equipment (e.g. Belt Loaders, Passenger Coaches, Auxiliary Power Units, etc.) and stationary sources (e.g. fuel tanks, fire trainings, maintenance etc).
A detailed emissions inventory contains geographical information on the spatial distribution of the pollutants exhausted from the major pollution sources. However most of the airports only conduct very basic inventories (total emissions per year). Only few airports performed detailed 4 Dimensions Emissions Inventories (4D, i.e. x and y for horizontal displacement, z for the vertical one and t for time), even though they are necessary prior to any dispersion modelling. One of the underlying reasons is the lack of a harmonised pan-European methodology. Depending on the level of accuracy to reach (and on the availability of data), the appropriate methodology to perform the study varies. It is critical to bear in mind that all airport emissions sources should be accounted in the modelling process. That is because the inventory must provide a complete picture of the emissions especially if a dispersion model is to be applied. Finally, such airport models can be used to test future emission scenarios and therefore are important tools for decision making when dealing with environmental concerns [9].
3
1.3 Objectives As a part of the ALAQS project the aim of the present case study is first:
• To develop a best practice on methodological and practical issues about the use of emission inventories for airports
And then:
• To validate and compare different methodologies and emission factors This study compares three modelling tools (EDMS, LASPORT and ALAQS-AV) with the aim of identifying potential improvements. A complementary objective is to provide guidelines towards the use of emission inventories and dispersion modelling tools.
For the scope of the present work, Zurich airport was chosen as a case study as it was easy to obtain real operational data. That is because Zurich airport was involved in the development of the LASPORT tool and thus the gathering of the data was complete and thorough.
In order to achieve the above objectives, comparisons of (i) the tools (in terms of assumptions, default databases, etc…) and (ii) their results will be achieved. Following this comparison a set guidelines for emissions inventories best practices are issued. In the end considerations about dispersion modelling with the LASPORT/LASAT tool are expressed.
2 Tools and Methods Three models are being used to calculate Zurich Airport emissions:
• EDMS (version 4.12) Emission and Dispersion Model System developed the FAA; • LASPORT Emission Calculation and Dispersion Model (version 1.3), developed on behalf of the German Airport Association; • ALAQS-AV version 1, Emissions Inventory, developed by the EUROCONTROL Experimental Centre (EEC).
2.1 EDMS EDMS was developed by the United States Federal Aviation Administration (FAA) in co-operation with the United States Air Force (USAF). EDMS was designed to assess the air quality impacts of airport emission sources, particularly aviation sources, which consist of aircraft, auxiliary power units, and ground support equipment. EDMS also offers a limited capability to model other airport emission sources that are not aviation-specific, such as ground access vehicles and stationary sources [10].
2.2 LASPORT LASPORT Emission Calculation and Dispersion Models were developed in collaboration with the ADV (German Airport Association). LASPORT/LASAT is a program package for dispersion calculations in the context of air pollutant emissions from airports. In particular, LASPORT calculates emissions for aircraft (complete LTO cycles), auxiliary power unit (APU), ground power units (GPU), airside and landside vehicle traffic [11]. Once LASPORT emissions are known, results are processed in LASAT which undertakes the dispersion modelling.
4
2.3 ALAQS-AV ALAQS-AV is a customized Geographical Information System (GIS) application for the detailed capturing of airport pollution sources and for the processing of the subsequent emissions into a standard format as a preliminary step to dispersion modelling. The ALAQS-AV toolset forms a test-bed of the ALAQS project [12]. It is used for evaluating different emissions and dispersion modelling methods.
ALAQS-AV was implemented as a customized ArcView 8 application using Microsoft Visual Basic for Applications. The application inspired some of its concept and system data from EDMS (Emission and Dispersion Modelling System).
2.4 Tools comparison Table 1 summarises the features of the three emission models used in the present study. Additional considerations will be made in the discussion section concerning the features that generate differences in the results.
Table 1: Comparison of the parameters considered in the three tools
EDMS LASPORT ALAQS-AV AC groups Zurich specific Zurich specific ICAO AC/engine match 1 per AC type 1 per AC 1 per AC type AC engine start ignition no yes yes Implementation of emission factors by users no yes yes
Emission factors for aircraft ICAO ICAO ICAO Emission factors for stand equipment & stationary sources US based Zurich airport data Zurich airport data
Emission factors for road vehicles US based EU based EU based Geographical Information System no no yes Dispersion model yes yes no
3 General Approach
3.1 Choice of the Airport A previous emissions inventory was held in 2003 for Lyon Saint Exupery airport [13]. One outcome of this study highlighted the importance of using realistic input data to model accurately the airport operations. Such data collection has to be exhaustive to ensure of the reliability of the 4D representation of the emissions especially if dispersion modelling is foreseen.
Zurich airport intensive experience in conducting emission inventories and air quality studies [14] ensured of a data collection wide enough so that an evaluation of the applicability of the methodologies was made possible.
5
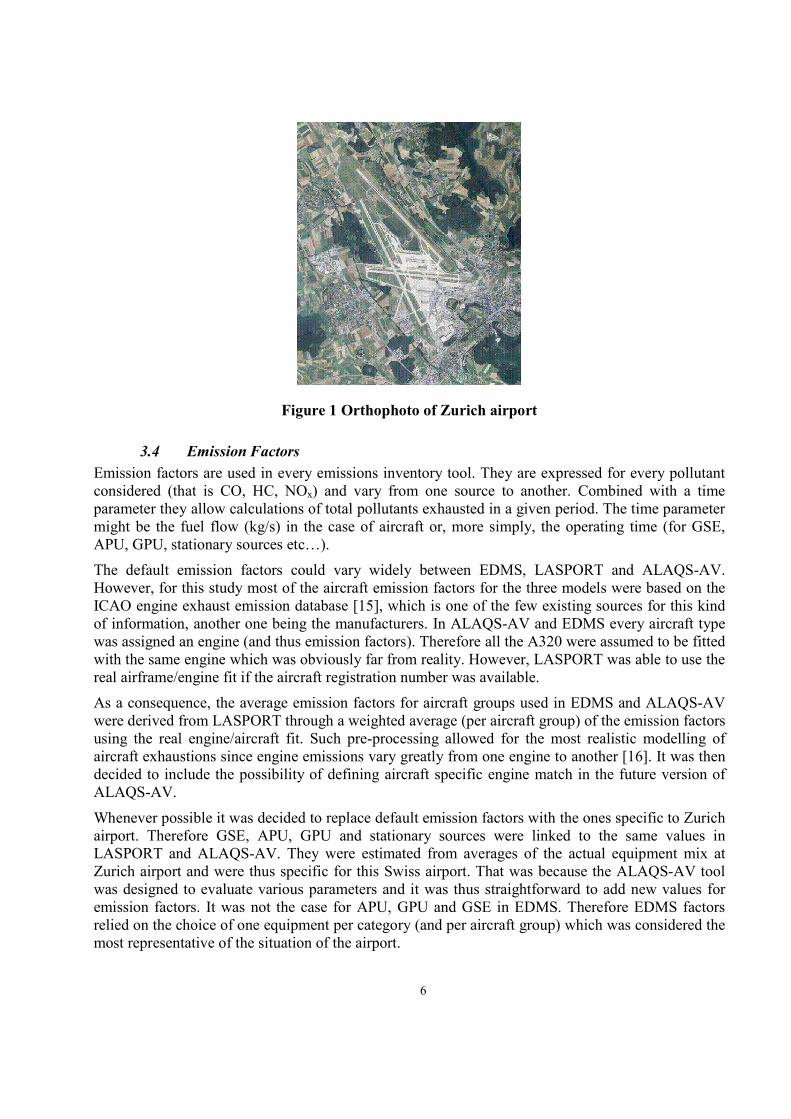
3.2 Airport graphical representation The present case study was based on Zurich airport 2003 operational data since those were the most up-to-date. The accurate representation of the airport presented in Figure 1 was the basis for the capturing of the airport features within the tools. Emissions sources gathered runways, taxiways, queues, aircraft stands, roadways and parking lots, and finally stationary sources. Such capturing followed different processes depending on the tool considered which logically lead to different models. The differences in Zurich airport models when using EDMS, LASPORT and ALAQS-AV are shown in Table 2 below. The modelling of runways, stands, parking lots and stationary sources was similar in the three models. On the contrary, roadways and taxiways presented large variations. The great number of taxiways and roadways required in EDMS (1212 and 166 resp.) was a result of EDMS 4.12 properties: such segments were not able to cope neither with changes in direction nor with two ways traffic which multiplied the number of drawings necessary to depict the airport. The same trend was observed in the ALAQS-AV model even though in a fewer extent (228 taxiways and 76 roadways). LASPORT was the tool that needed the fewer drawings with 204 taxiways and 34 roadways.
Table 2: Airport modeling features
Features Operated Required in the model Runways 6 6 Stands 17 17
Taxiways 96 EDMS: 1212 LASPORT: 204 ALAQS-AV: 228
Roadways (airside and landside) 28
EDMS: 166 LASPORT: 34 ALAQS-AV: 76
Parking lots 6 6 Stationary sources 20 20
3.3 Airport Operational Data Zurich Airport provided detailed operational data for all the groups of sources: Air traffic, Handling (APU, GPU, GSE - Ground Support Equipment - , refuelling etc…), infrastructures (Power and Heating plants, Aircraft and airport maintenance, Engine test run etc…) and road traffic (landside and airside). Most of the data required by the three tools was available therefore no shortage in data will question the validity of the results.
Only two emission sources were not included in the emissions inventory. One was the de-icing activity (both aircraft and runways) and the second was the fuel farms. However a previous study [13] showed the impact of de-icing on local air quality was limited. Zurich airport fuel tanks have been equipped with membranes which act as a floating roof. Emissions from such devices are very low and were therefore neglected.
6
Figure 1 Orthophoto of Zurich airport
3.4 Emission Factors Emission factors are used in every emissions inventory tool. They are expressed for every pollutant considered (that is CO, HC, NOx) and vary from one source to another. Combined with a time parameter they allow calculations of total pollutants exhausted in a given period. The time parameter might be the fuel flow (kg/s) in the case of aircraft or, more simply, the operating time (for GSE, APU, GPU, stationary sources etc…).
The default emission factors could vary widely between EDMS, LASPORT and ALAQS-AV. However, for this study most of the aircraft emission factors for the three models were based on the ICAO engine exhaust emission database [15], which is one of the few existing sources for this kind of information, another one being the manufacturers. In ALAQS-AV and EDMS every aircraft type was assigned an engine (and thus emission factors). Therefore all the A320 were assumed to be fitted with the same engine which was obviously far from reality. However, LASPORT was able to use the real airframe/engine fit if the aircraft registration number was available.
As a consequence, the average emission factors for aircraft groups used in EDMS and ALAQS-AV were derived from LASPORT through a weighted average (per aircraft group) of the emission factors using the real engine/aircraft fit. Such pre-processing allowed for the most realistic modelling of aircraft exhaustions since engine emissions vary greatly from one engine to another [16]. It was then decided to include the possibility of defining aircraft specific engine match in the future version of ALAQS-AV.
Whenever possible it was decided to replace default emission factors with the ones specific to Zurich airport. Therefore GSE, APU, GPU and stationary sources were linked to the same values in LASPORT and ALAQS-AV. They were estimated from averages of the actual equipment mix at Zurich airport and were thus specific for this Swiss airport. That was because the ALAQS-AV tool was designed to evaluate various parameters and it was thus straightforward to add new values for emission factors. It was not the case for APU, GPU and GSE in EDMS. Therefore EDMS factors relied on the choice of one equipment per category (and per aircraft group) which was considered the most representative of the situation of the airport.
7
4 Results Results from the simulations of Zurich airport traffic in 2003 with the three tools evaluated are presented in this section (and in Figure 2). The number of aircraft considered reached nearly 266 000. Pollutants considered were CO, HC and NOx. The following of this section will analyse the results for every pollutant separately.
4.1 CO emissions It can be seen in Table 3 that CO emissions ranged between 1465 and 3166 tons per year. EDMS resulted in the largest amount of CO exhausted with more than twice the results from LASPORT and ALAQS. That was due to the roadways emissions which totalised 1805 tons as opposed to 184 and 168 tons in LASPORT and ALAQS respectively. In the same way the GSE emissions calculated by EDMS were overestimated by around 40 tons.
Table 3: Zurich airport 2003 CO emissions
CO (t/y) EDMS LASPORT ALAQS Aircraft 1225.5 1204.8 1269.1 Stationary Sources 15.3 12.1 12.0 Roadways 1805.5 184.0 167.8 APU, GPU, Engine Start 65.7 41.2 45.0 GSE 54.2 14.0 12.1 Total 3166.2 1456.1 1506.0
4.2 HC emissions HC emissions (Table 4) showed a similar pattern to the CO ones with the largest difference experimented for roadways emissions. EDMS results were greater than the LASPORT and ALAQS ones by at least 150 tons. On the contrary, APU/GPU emissions calculated by EDMS were ten to eleven times smaller than the totals calculated by the two other models.
Table 4: Zurich airport 2003 HC emissions
HC (t/y) EDMS LASPORT ALAQS Aircraft 150.9 146.6 161.7 Stationary sources 89.1 90.6 90.5 Roadways 179.6 29.2 23.9 APU, GPU, Engine Start 5.4 60.3 54.9 GSE 8.1 3.0 2.6 Total 433.1 329.7 333.6
4.3 NOx emissions Considering NOx the largest source of difference was the aircraft with as much as 164 tons (LASPORT/EDMS) and 88 tons (LASPORT/ALAQS) overall the year. Additionally EDMS GSE results were at least five times greater than for LASPORT and ALAQS. Finally a large overestimation of NOx from roadways was observed in EDMS results (56 tons).
8
Table 5: Zurich airport 2003 NOx emissions
NOx (t/y) EDMS LASPORT ALAQS Aircraft 949.8 1114.1 1025.9 Stationary sources 71.4 69.5 69.1 Roadways 166.6 109.1 111.4 APU, GPU, Engine Start 46.3 48.5 53.0 GSE 77.3 14.6 12.6 Total 1311.4 1355.8 1272.0
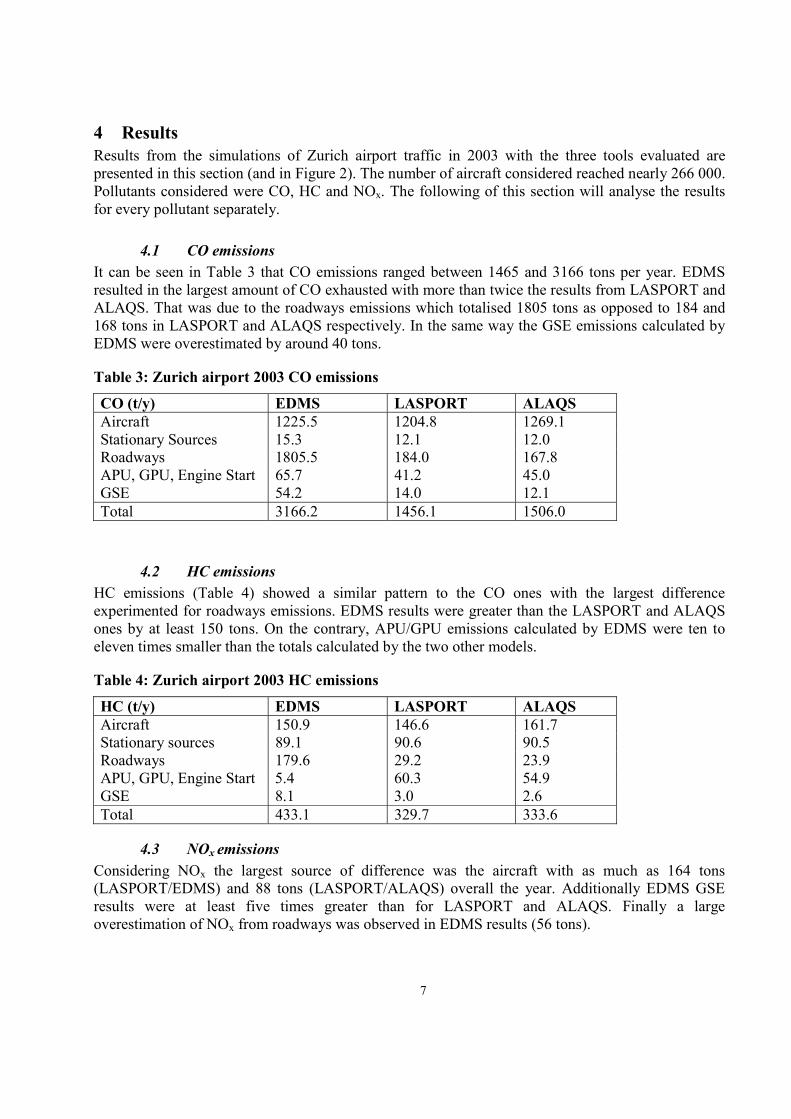
4.4 Global emissions (without roadways) It can be seen from table 3 that vehicle related emissions (roadways and GSE) were the largest differences. To explain the differences it was useful to analyse the results without vehicle emissions (Figure 2). The 5% error bars shown symbolize a 5% difference (positive and negative). It appeared obvious that when roadways were not considered global emissions from the three models were much closer (within 10% for EDMS/LASPORT and 5% for ALAQS-AV/LASPORT in most cases). The largest differences were observed as follows:
• COEDMS -COLASPORT = 88.6 tons (7% of LASPORT total)
• HCALAQS - HCEDMS = 56.2 tons (19% of LASPORT total)
• NOx LASPORT-NOz EDMS = 101.9 tons (8% of LASPORT total)
0
200
400
600
800
1000
1200
1400
1600
CO HC NOx
Met
ric
tons
per
yea
r
EDMSLASPORTALAQS
Figure 2: Comparison of the results from the three models without considering road traffic
5 Results comparison and discussion
5.1 Aircraft emissions
Table 6: Aircraft emissions comparison
EDMS LASPORT ALAQS-AV CO (tons) 1225.5 1204.8 1269.1 HC (tons) 150.9 146.6 161.7 NOx (tons) 949.8 1114.1 1025.9
9
For CO ALAQS-AV and EDMS results lay within 5% of LASPORT. ALAQS-AV calculated 10% more HC than LASPORT and EDMS 3% more. For NOx both ALAQS-AV and EDMS underestimated the emissions by large margins – 8% for ALAQS-AV and 15% for EDMS.
The results were surprising as we expected to obtain similar results because the parameters used in the three programs were the same.
5.1.1 Aircraft emissions calculation methodology The methodology applied in the three models presented similarities in the calculation of aircraft emissions. Aircraft emissions were based on the following formula:
ACe = FFmode * EFmode * T * N (1) Where:
ACe = the Aircraft engine total emissions FFmode = Fuel flow rate (kg/s) per engine in mode EFmode = Emission factor (kg/kg) per engine in mode T = Time-in-mode (s) N= Number of engines
However the EDMS methodology was based on the total number of LTO cycles occurring over a year rather than actual aircraft movements (LASPORT and ALAQS-AV). Although not of direct interest in this study because we looked at global values, the LTO method has the limitation that an arrival and departure will use the same runway – not always true at airports with more than one runway. The LTO method is most useful for overall inventory studies and ‘what-if’ analyses but has limitations when applied to dispersion modelling where geographical distribution of the emissions is essential.
5.1.2 Parameters impacting aircraft emissions Aircraft emissions were dependent upon two main parameters: the emission factors obtained from the aircraft/engine combination and the vertical flight profile. The definition of two profiles for each aircraft group was necessary in LASPORT and ALAQS-AV: one for arrival and one for departure. The EDMS methodology relied on the times in mode defined by the US Environmental Protection Agency.
An indirectly important factor was the aircraft grouping. This was due to the fact that the flight profiles were defined on an aircraft group basis in EDMS, LASPORT and ALAQS-AV as well as the emission factors.
As the same emission factors were applied in the three models, they were thus not responsible for the differences. The differences arose from the flight profiles and, more specifically, the time-in-mode values.
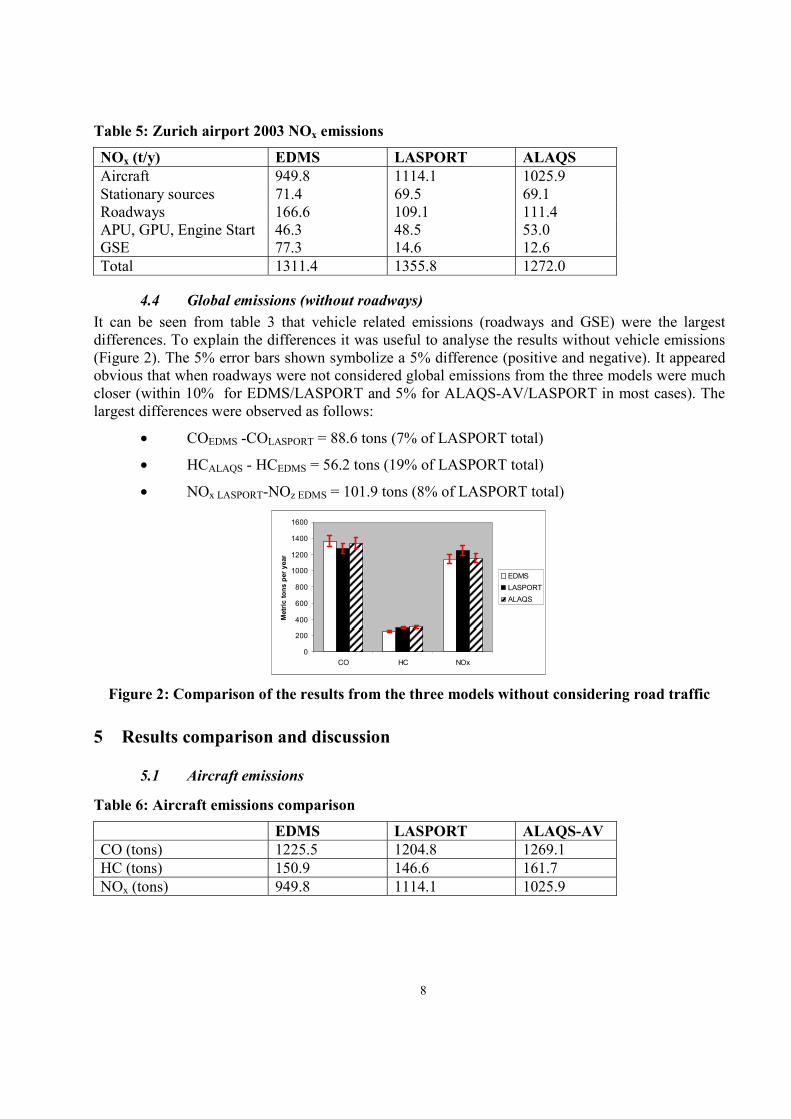
Comparison of the subsequent times in mode for the three models was pursued in Table 7. It appeared that times in mode were very different with the ALAQS-AV/LASPORT times being greater than the EDMS ones (except for Take Off). Emissions calculated by EDMS would have been expected to be greater which was not the case (Figure 2). The other factor to consider was the aircraft grouping (Figure 3).
Aircraft grouping was used in LASPORT to derive emission factors (for each pollutant and each aircraft group) that could be applied in ALAQS-AV and EDMS considering the real aircraft/engine
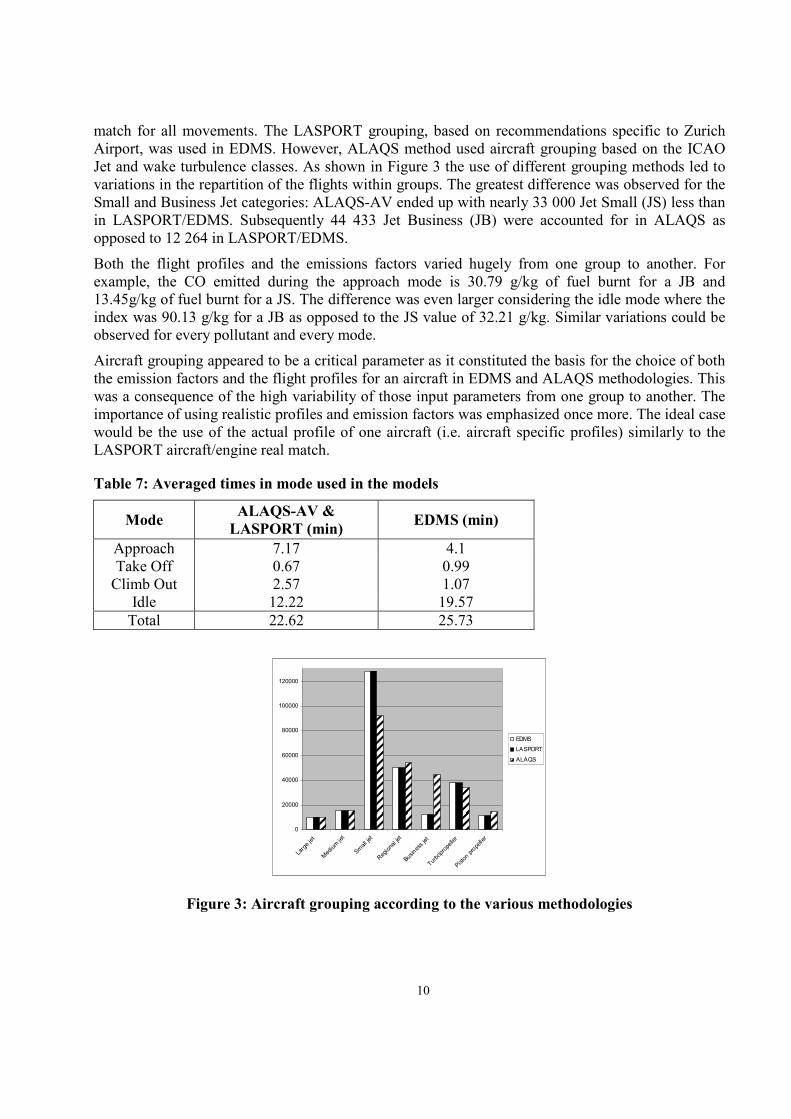
10
match for all movements. The LASPORT grouping, based on recommendations specific to Zurich Airport, was used in EDMS. However, ALAQS method used aircraft grouping based on the ICAO Jet and wake turbulence classes. As shown in Figure 3 the use of different grouping methods led to variations in the repartition of the flights within groups. The greatest difference was observed for the Small and Business Jet categories: ALAQS-AV ended up with nearly 33 000 Jet Small (JS) less than in LASPORT/EDMS. Subsequently 44 433 Jet Business (JB) were accounted for in ALAQS as opposed to 12 264 in LASPORT/EDMS.
Both the flight profiles and the emissions factors varied hugely from one group to another. For example, the CO emitted during the approach mode is 30.79 g/kg of fuel burnt for a JB and 13.45g/kg of fuel burnt for a JS. The difference was even larger considering the idle mode where the index was 90.13 g/kg for a JB as opposed to the JS value of 32.21 g/kg. Similar variations could be observed for every pollutant and every mode.
Aircraft grouping appeared to be a critical parameter as it constituted the basis for the choice of both the emission factors and the flight profiles for an aircraft in EDMS and ALAQS methodologies. This was a consequence of the high variability of those input parameters from one group to another. The importance of using realistic profiles and emission factors was emphasized once more. The ideal case would be the use of the actual profile of one aircraft (i.e. aircraft specific profiles) similarly to the LASPORT aircraft/engine real match.
Table 7: Averaged times in mode used in the models
Mode ALAQS-AV & LASPORT (min) EDMS (min)
Approach 7.17 4.1 Take Off 0.67 0.99
Climb Out 2.57 1.07 Idle 12.22 19.57
Total 22.62 25.73
0
20000
40000
60000
80000
100000
120000
Larg
e jet
Medium
jet
Small je
t
Region
al jet
Busines
s jet
Turbop
ropell
er
Piston
prope
ller
EDMS
LASPORT
ALAQS
Figure 3: Aircraft grouping according to the various methodologies
11
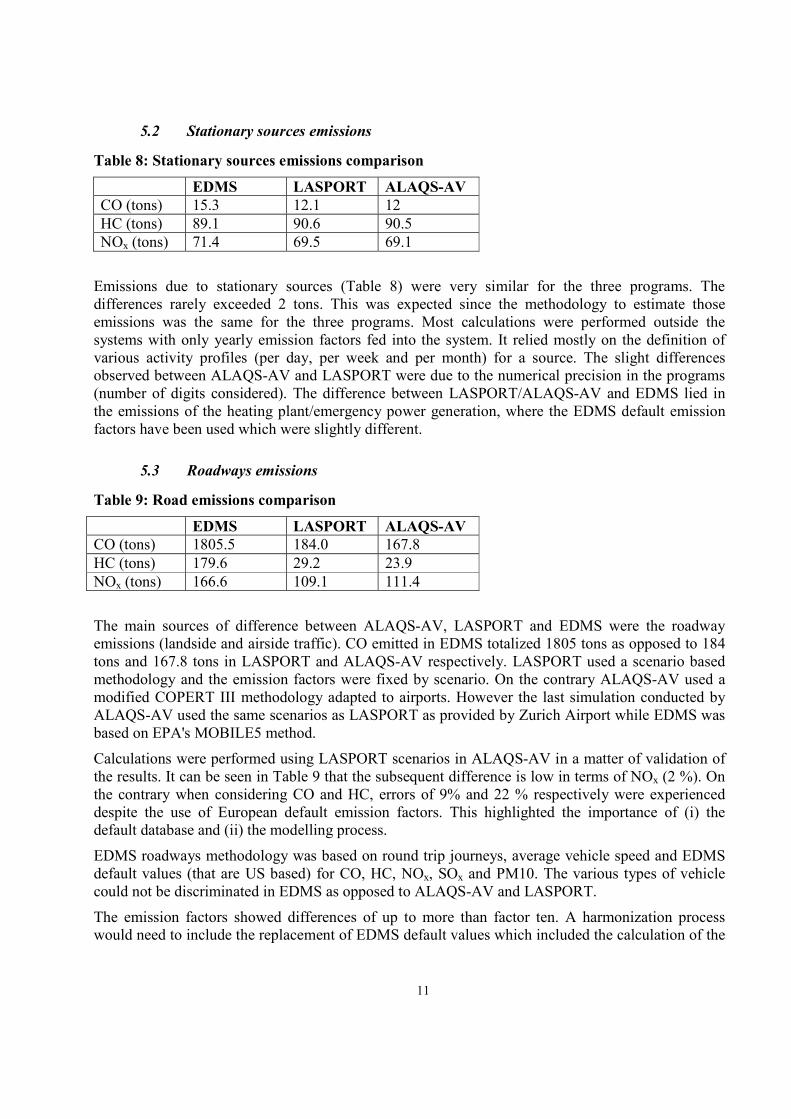
5.2 Stationary sources emissions
Table 8: Stationary sources emissions comparison
EDMS LASPORT ALAQS-AV CO (tons) 15.3 12.1 12 HC (tons) 89.1 90.6 90.5 NOx (tons) 71.4 69.5 69.1
Emissions due to stationary sources (Table 8) were very similar for the three programs. The differences rarely exceeded 2 tons. This was expected since the methodology to estimate those emissions was the same for the three programs. Most calculations were performed outside the systems with only yearly emission factors fed into the system. It relied mostly on the definition of various activity profiles (per day, per week and per month) for a source. The slight differences observed between ALAQS-AV and LASPORT were due to the numerical precision in the programs (number of digits considered). The difference between LASPORT/ALAQS-AV and EDMS lied in the emissions of the heating plant/emergency power generation, where the EDMS default emission factors have been used which were slightly different.
5.3 Roadways emissions
Table 9: Road emissions comparison
EDMS LASPORT ALAQS-AV CO (tons) 1805.5 184.0 167.8 HC (tons) 179.6 29.2 23.9 NOx (tons) 166.6 109.1 111.4
The main sources of difference between ALAQS-AV, LASPORT and EDMS were the roadway emissions (landside and airside traffic). CO emitted in EDMS totalized 1805 tons as opposed to 184 tons and 167.8 tons in LASPORT and ALAQS-AV respectively. LASPORT used a scenario based methodology and the emission factors were fixed by scenario. On the contrary ALAQS-AV used a modified COPERT III methodology adapted to airports. However the last simulation conducted by ALAQS-AV used the same scenarios as LASPORT as provided by Zurich Airport while EDMS was based on EPA's MOBILE5 method.
Calculations were performed using LASPORT scenarios in ALAQS-AV in a matter of validation of the results. It can be seen in Table 9 that the subsequent difference is low in terms of NOx (2 %). On the contrary when considering CO and HC, errors of 9% and 22 % respectively were experienced despite the use of European default emission factors. This highlighted the importance of (i) the default database and (ii) the modelling process.
EDMS roadways methodology was based on round trip journeys, average vehicle speed and EDMS default values (that are US based) for CO, HC, NOx, SOx and PM10. The various types of vehicle could not be discriminated in EDMS as opposed to ALAQS-AV and LASPORT.
The emission factors showed differences of up to more than factor ten. A harmonization process would need to include the replacement of EDMS default values which included the calculation of the
12
emission factors for each road type and vehicle fleet mix individually. In 1993/94, the share of passenger cars with an engine size of >2.5 litres was 62% (of all passenger cars) [17]. In Switzerland, the same share in 1993/95 was only 4% [18].
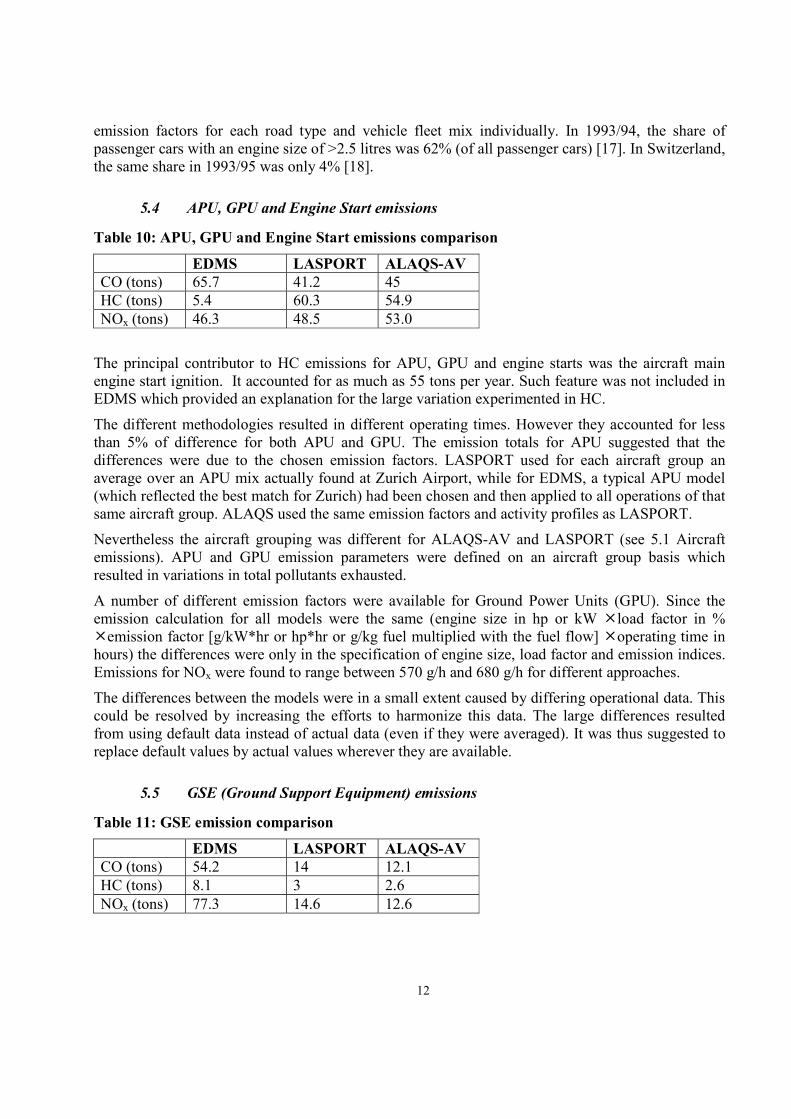
5.4 APU, GPU and Engine Start emissions
Table 10: APU, GPU and Engine Start emissions comparison
EDMS LASPORT ALAQS-AV CO (tons) 65.7 41.2 45 HC (tons) 5.4 60.3 54.9 NOx (tons) 46.3 48.5 53.0
The principal contributor to HC emissions for APU, GPU and engine starts was the aircraft main engine start ignition. It accounted for as much as 55 tons per year. Such feature was not included in EDMS which provided an explanation for the large variation experimented in HC.
The different methodologies resulted in different operating times. However they accounted for less than 5% of difference for both APU and GPU. The emission totals for APU suggested that the differences were due to the chosen emission factors. LASPORT used for each aircraft group an average over an APU mix actually found at Zurich Airport, while for EDMS, a typical APU model (which reflected the best match for Zurich) had been chosen and then applied to all operations of that same aircraft group. ALAQS used the same emission factors and activity profiles as LASPORT.
Nevertheless the aircraft grouping was different for ALAQS-AV and LASPORT (see 5.1 Aircraft emissions). APU and GPU emission parameters were defined on an aircraft group basis which resulted in variations in total pollutants exhausted.
A number of different emission factors were available for Ground Power Units (GPU). Since the emission calculation for all models were the same (engine size in hp or kW load factor in %
emission factor [g/kW*hr or hp*hr or g/kg fuel multiplied with the fuel flow] operating time in hours) the differences were only in the specification of engine size, load factor and emission indices. Emissions for NOx were found to range between 570 g/h and 680 g/h for different approaches.
The differences between the models were in a small extent caused by differing operational data. This could be resolved by increasing the efforts to harmonize this data. The large differences resulted from using default data instead of actual data (even if they were averaged). It was thus suggested to replace default values by actual values wherever they are available.
5.5 GSE (Ground Support Equipment) emissions
Table 11: GSE emission comparison
EDMS LASPORT ALAQS-AV CO (tons) 54.2 14 12.1 HC (tons) 8.1 3 2.6 NOx (tons) 77.3 14.6 12.6
13
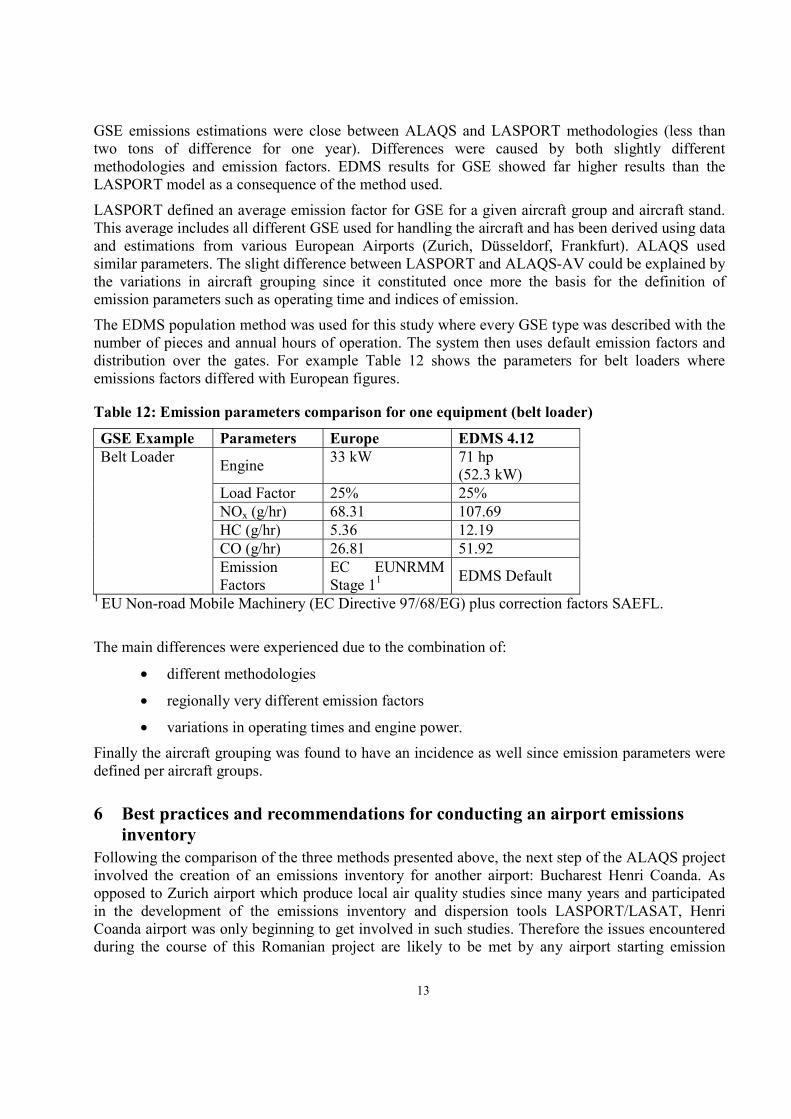
GSE emissions estimations were close between ALAQS and LASPORT methodologies (less than two tons of difference for one year). Differences were caused by both slightly different methodologies and emission factors. EDMS results for GSE showed far higher results than the LASPORT model as a consequence of the method used.
LASPORT defined an average emission factor for GSE for a given aircraft group and aircraft stand. This average includes all different GSE used for handling the aircraft and has been derived using data and estimations from various European Airports (Zurich, Düsseldorf, Frankfurt). ALAQS used similar parameters. The slight difference between LASPORT and ALAQS-AV could be explained by the variations in aircraft grouping since it constituted once more the basis for the definition of emission parameters such as operating time and indices of emission.
The EDMS population method was used for this study where every GSE type was described with the number of pieces and annual hours of operation. The system then uses default emission factors and distribution over the gates. For example Table 12 shows the parameters for belt loaders where emissions factors differed with European figures.
Table 12: Emission parameters comparison for one equipment (belt loader)
GSE Example Parameters Europe EDMS 4.12
Engine 33 kW 71 hp (52.3 kW)
Load Factor 25% 25% NOx (g/hr) 68.31 107.69 HC (g/hr) 5.36 12.19 CO (g/hr) 26.81 51.92
Belt Loader
Emission Factors
EC EUNRMM Stage 11 EDMS Default
1 EU Non-road Mobile Machinery (EC Directive 97/68/EG) plus correction factors SAEFL. The main differences were experienced due to the combination of:
• different methodologies
• regionally very different emission factors
• variations in operating times and engine power.
Finally the aircraft grouping was found to have an incidence as well since emission parameters were defined per aircraft groups.
6 Best practices and recommendations for conducting an airport emissions inventory
Following the comparison of the three methods presented above, the next step of the ALAQS project involved the creation of an emissions inventory for another airport: Bucharest Henri Coanda. As opposed to Zurich airport which produce local air quality studies since many years and participated in the development of the emissions inventory and dispersion tools LASPORT/LASAT, Henri Coanda airport was only beginning to get involved in such studies. Therefore the issues encountered during the course of this Romanian project are likely to be met by any airport starting emission
14
studies, and especially by the fast growing airports located in the new (accessing) Eastern EU countries. As a result, it was decided to issue guidelines which aim is to facilitate the data collection prior any emissions inventory or modelling dispersion using either the ALAQS-AV toolset or other airport modelling tools based on what was experienced in Romania. Those guidelines are reported in the present section, beginning with the data collection issues, followed by considerations about aircraft emissions calculations and in the end concerns with the default parameters used in the ALAQS-AV toolset databases.
6.1 Data collection The fundamental step prior conducting an emissions inventory is obviously the data collection. The Romanian project allowed identifying the sources for which it was complicated to get realistic operational figures. The main source of unknowns was the stand equipment (APU, GPU and Ground System Equipment i.e. belt loader, passenger buses, and so on…) for which neither a list of the equipment used nor details about operations were available. The study highlighted the importance of involving ground handling companies at an early stage of the project to ensure of a reliable cooperation and thus a thorough data collection. This was also true for the Air Traffic Controller (ATC) around the airport: it appeared that they hold the data inherent to runways (the point of touchdown for aircraft especially) and aircraft climb-out & landing profiles.
A second domain for which data was complicated to obtain was the aircraft ground movements (i.e. the taxiing path used between the stand/runway combinations). It appeared that the use of theoretical shortest geometrical routes lead to an underestimation of the emissions, as it is almost never the case in the real situation. Moreover the same aircraft landing on the same runway will not necessarily follow the same taxiing path. Therefore the best practice for calculating taxiing emissions is to rely upon the flight specific block times (on/off) whenever available, as it dismisses the need for estimating a theoretical taxiing time or taxiing velocity.
The calculation of the emissions from the stationary sources present at the airport, that is to say the power and heating plants, the fuel tanks, etc… had to rely upon the default values provided in the ALAQS-AV toolset. As related previously in this paper, the ALAQS default emission indices for stationary sources were originally set up for US equipments, which might lead to errors due to the regional specificity of such defaults. The best practice would consist in undertaking on-field measurements for every category of equipment. This time consuming task is difficult to achieve most of the time, as a consequence it was decided that a new database should be built based on European equipment characteristics.
In the end, the last source of uncertainties was the roadways, both landside and airside. Whenever possible, a campaign of measurements should be held to provide statistics such as the number of vehicles or their average speed. Guidelines will have to be defined which will help the airports deriving yearly statistics from a set of monitored data.
6.2 Aircraft emissions As stated previously, the two main parameters when computing aircraft emissions are the engine emission indices and the flight profile. Originally, each aircraft type was assigned only one engine which turned to be unrealistic and resulted in larger errors. As a consequence, the best practice consists in using for every aircraft the real engine fit as it was done by LASPORT for the Zurich airport emissions inventory. This is possible with the unique registration number attributed to each
15
aircraft therefore this functionality was implemented in the next release of the ALAQS-AV toolset. However it is worth remembering that due to its complexity the effects of the engine ageing and maintenance could not be accounted for even thought they have been proved to impact greatly the level of emissions.
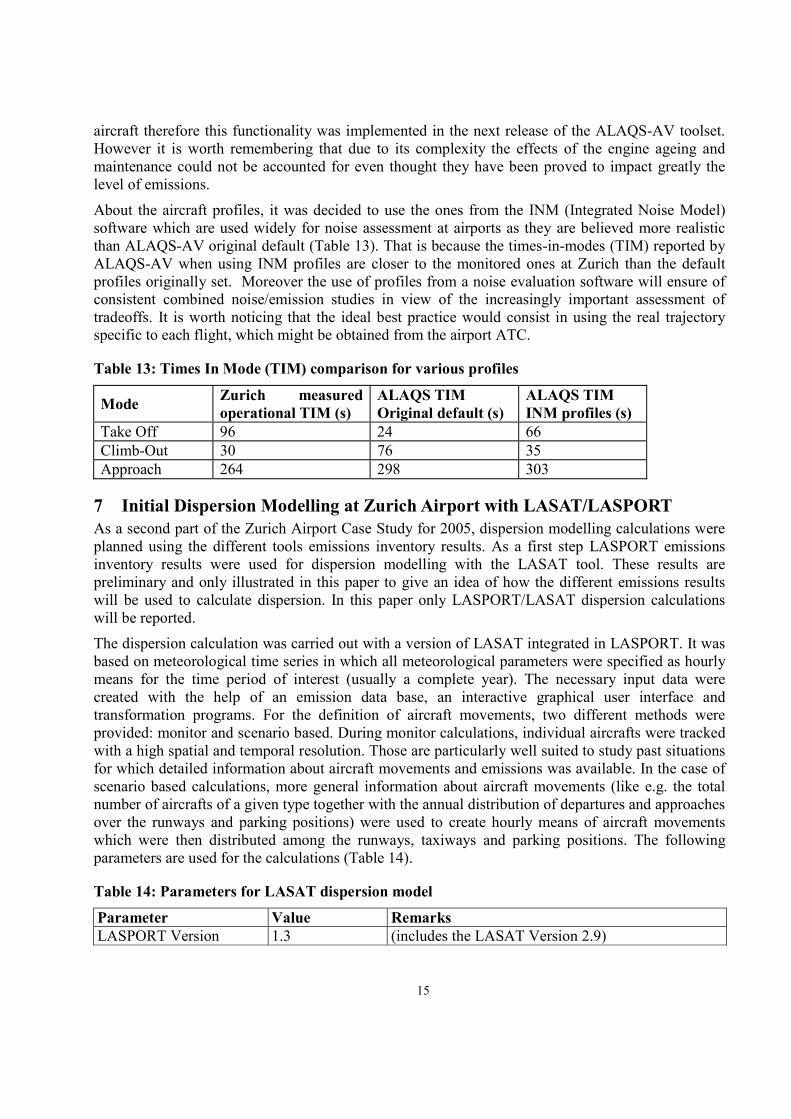
About the aircraft profiles, it was decided to use the ones from the INM (Integrated Noise Model) software which are used widely for noise assessment at airports as they are believed more realistic than ALAQS-AV original default (Table 13). That is because the times-in-modes (TIM) reported by ALAQS-AV when using INM profiles are closer to the monitored ones at Zurich than the default profiles originally set. Moreover the use of profiles from a noise evaluation software will ensure of consistent combined noise/emission studies in view of the increasingly important assessment of tradeoffs. It is worth noticing that the ideal best practice would consist in using the real trajectory specific to each flight, which might be obtained from the airport ATC.
Table 13: Times In Mode (TIM) comparison for various profiles
Mode Zurich measured operational TIM (s)
ALAQS TIM Original default (s)
ALAQS TIM INM profiles (s)
Take Off 96 24 66 Climb-Out 30 76 35 Approach 264 298 303
7 Initial Dispersion Modelling at Zurich Airport with LASAT/LASPORT As a second part of the Zurich Airport Case Study for 2005, dispersion modelling calculations were planned using the different tools emissions inventory results. As a first step LASPORT emissions inventory results were used for dispersion modelling with the LASAT tool. These results are preliminary and only illustrated in this paper to give an idea of how the different emissions results will be used to calculate dispersion. In this paper only LASPORT/LASAT dispersion calculations will be reported.
The dispersion calculation was carried out with a version of LASAT integrated in LASPORT. It was based on meteorological time series in which all meteorological parameters were specified as hourly means for the time period of interest (usually a complete year). The necessary input data were created with the help of an emission data base, an interactive graphical user interface and transformation programs. For the definition of aircraft movements, two different methods were provided: monitor and scenario based. During monitor calculations, individual aircrafts were tracked with a high spatial and temporal resolution. Those are particularly well suited to study past situations for which detailed information about aircraft movements and emissions was available. In the case of scenario based calculations, more general information about aircraft movements (like e.g. the total number of aircrafts of a given type together with the annual distribution of departures and approaches over the runways and parking positions) were used to create hourly means of aircraft movements which were then distributed among the runways, taxiways and parking positions. The following parameters are used for the calculations (Table 14).
Table 14: Parameters for LASAT dispersion model
Parameter Value Remarks LASPORT Version 1.3 (includes the LASAT Version 2.9)
16
Time zone GMT +1 Needed to synchronise the times in the aircraft movement database and meteorological time series.
Quality Factor +1 Definition of the mass of a particle. Q=0: the standard mass is used; Q=+1: half the mass is used (i.e. twice the number of particles); Q=-1: twice the mass is used (i.e. half the number of particles). This parameter largely determines the necessary computation time.
Meteo 60 min See above Orography Terrain See above Chemistry: NO2 to NOx 0.15 See above
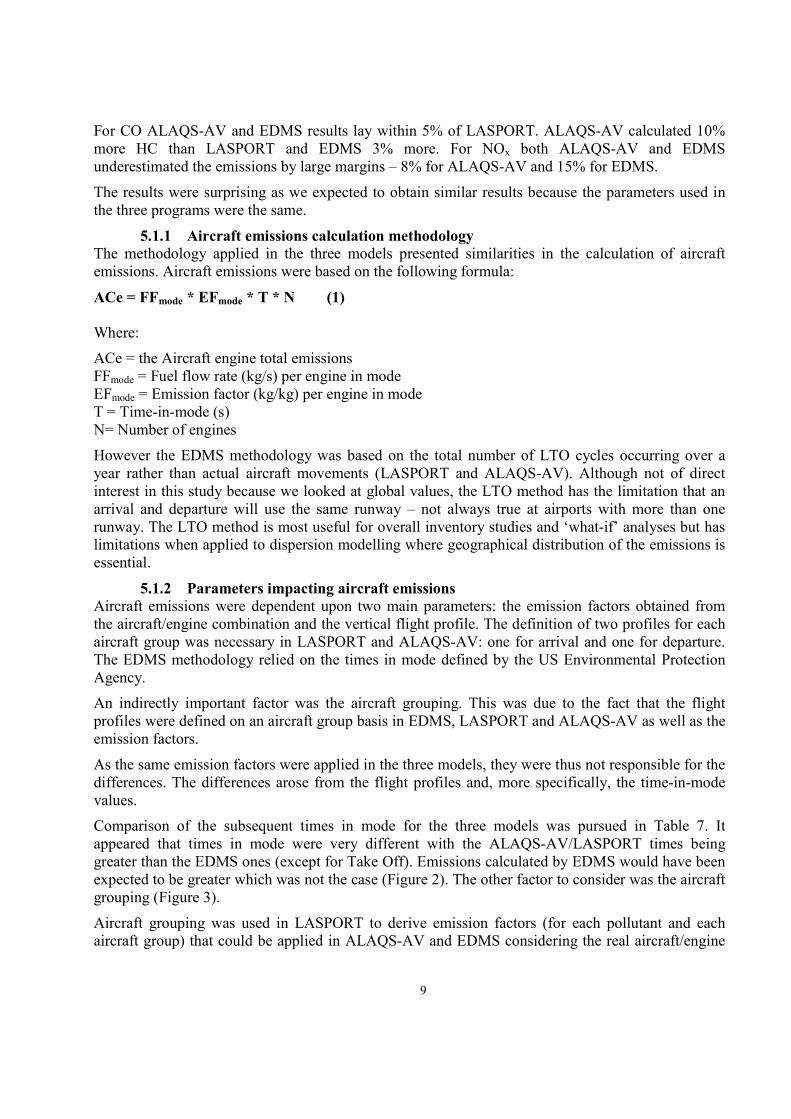
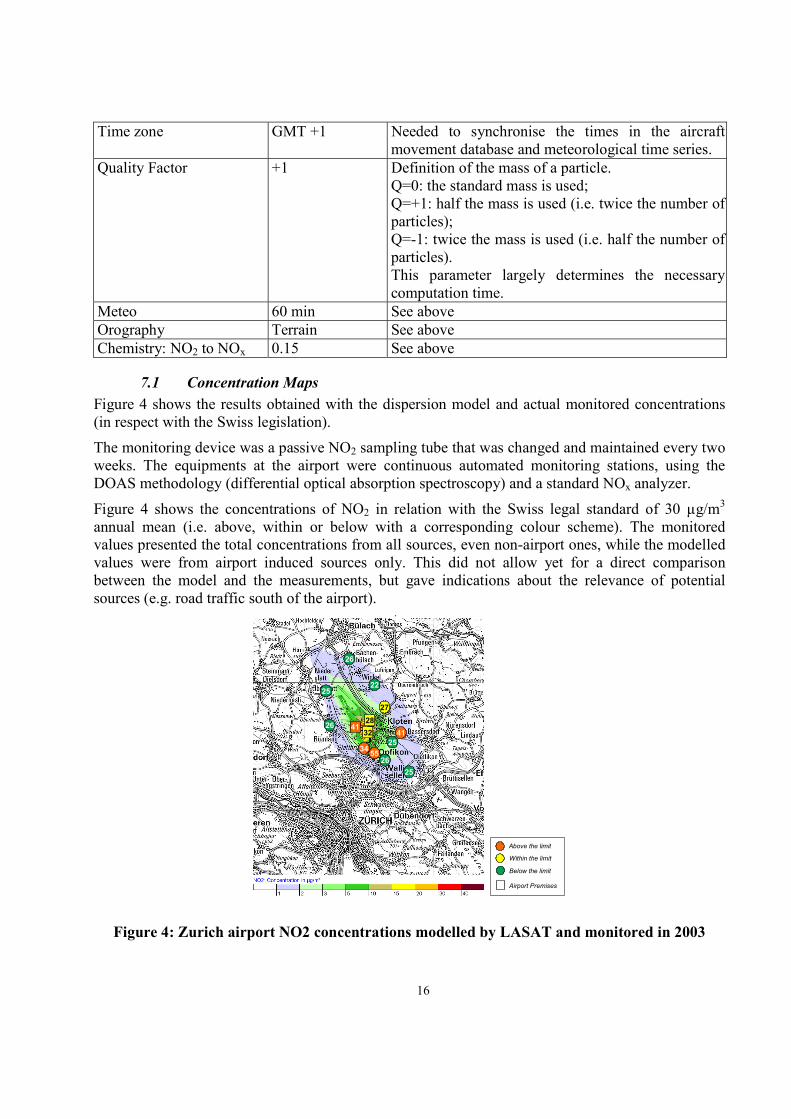
7.1 Concentration Maps Figure 4 shows the results obtained with the dispersion model and actual monitored concentrations (in respect with the Swiss legislation).
The monitoring device was a passive NO2 sampling tube that was changed and maintained every two weeks. The equipments at the airport were continuous automated monitoring stations, using the DOAS methodology (differential optical absorption spectroscopy) and a standard NOx analyzer.
Figure 4 shows the concentrations of NO2 in relation with the Swiss legal standard of 30 µg/m3 annual mean (i.e. above, within or below with a corresponding colour scheme). The monitored values presented the total concentrations from all sources, even non-airport ones, while the modelled values were from airport induced sources only. This did not allow yet for a direct comparison between the model and the measurements, but gave indications about the relevance of potential sources (e.g. road traffic south of the airport).
25
2541
34 55
2832
26
41
25
26
Above the limit
Within the limit
Below the limit
Airport Premises
26
22
27
Figure 4: Zurich airport NO2 concentrations modelled by LASAT and monitored in 2003
17
A follow up to the emissions inventory made a trial of the initial dispersion modelling using LASAT (which was the integrated dispersion model into LASPORT). These results were compared with monitored figures from Zurich Airport and showed good levels of similarity. However direct comparisons were not possible yet as monitored concentrations included sources which were not airport specific and thus not accounted for in the model. These effects will be considered in a future exercise.
8 Conclusion The study successfully compared the global emissions calculated by three airport emissions inventory models: ALAQS-AV, LASPORT and EDMS. Extensive empirical data from Zurich airport was used which avoided the inaccuracies normally associated with emissions models that rely on default parameters, emissions factors and movement data.
The comparison was based on the main pollutants CO, HC and NOx for each of the source groups: aircraft, ground support equipment, stationary sources and road vehicles.
EDMS was found to be reliable for global calculations over a long period of time (month, year). However, in the context of striving towards increased realism in the models, in particular 4D emissions inventories, the LTO based method for aircraft emissions induced a lack of geographical localization of aircraft emissions. However, we propose that LASPORT and ALAQS-AV methodologies, because they are based on individual movements (arrivals and departures), are better suited for airport use as they allow the precise 4D repartition of the emissions. In addition ALAQS-AV has the advantage of being a GIS based application, so that inventory and dispersion results can be presented with other geo-referenced information.
The downside of this increased realism is the need for more detailed and thorough input data
Aircraft emissions were dependent upon various factors, mainly the engine emission factors and the climb-out profiles used in the tool. The interim sensitivity calculations proved that emissions can shift largely by changing either the emission factors or the climb out profiles. Those parameters can be defined per aircraft group but the findings emphasized that the best practice was the use of the real match aircraft / engine and trajectory such as used in EDMS.
It was also found that aircraft grouping had an important impact on emissions, especially when the defaults emission factors were defined on an aircraft group basis (GSE, APU, GPU mainly).
Finally the applicability of the model default emission indices was proved to lead to high variations in the results which emphasized the importance of using airport specific data as much as possible.
9 References
[1] EEA, 2003, Europe's environment: the third assessment, European Environmental Agency, Copenhagen
[2] EEA, 2004, Ten key transport and environmental issues for policy makers, European Environmental Agency, Copenhagen
[3] DFT, 2003, The Future of Air Transport, Department for Transport, UK
[4] Eurostat, 2002, Energy, transport and environment indicators, ISBN 92-894-7529-3
18
[5] Muhlstein, P., 2005, Les ravages du mouvement perpétuel, Le Monde Diplomatique, N. 610, pp. 14-17
[6] ICAO, 2002b, The World of Civil Aviation 2001-2004, International Civil Aviation Organisation, Montreal
[7] IPCC, 1999, Aviation and the Global Atmosphere, International Panel on Climate Change, Geneva
[8] EEC, 2004, Long Term Forecast of Flights (2004-2025), Eurocontrol Statistics & Forecast Services, Brussels
[9] Fleuti E., 2001, Airport Air Quality, Air & Space Europe, Vol. 3 Number 1, pp. 43-44 [10] FAA, 2001, EDMS Reference Manual, Federal Aviation Administration
[11] Janicke Consulting, 2003, LASPORT version 1.3 Reference Book
[12] Peeters S., 2003, ALAQS-AV Application Reference Manual, Eurocontrol Experimental Centre
[13] Celikel A., Fleuti E., Hofmann P., Silue M., 2003, Emissions inventory for Lyon Saint Exupery airport, Eurocontrol Experimental Center
[14] Fleuti E., 1997, Emission charges at Zurich airport, Unique, http://europa.eu.int /comm/environment/gpc/
[15] ICAO, 1993, Environmental Protection, Annex16, Vol II. Aircraft Engine Emissions, International Civil Aviation Organisation, Montreal, Canada
[16] Schafer K., Jahn C., Sturm P., Lechner B., Bacher M., 2003, Aircraft emission measurements by remote sensing methodologies at airports, Atmospheric Environment, Issue 37 pp. 5261-5271
[17] US Department of Energy, 1997, Household Vehicles Energy Consumption 1994, Energy Information Administration, Washington DC
[18] OFS, 2003, Véhicules Routiers en Suisse -Parc au 30 septembre 2004, Office Fédérale de la Statistique, Neufchâtel, Switzerland
10 Key Words EDMS, LASPORT, ALAQS, Airport Emissions inventory, Dispersion modelling
Ayce Celikel is a Senior Environmental Research Analyst at ENV-ISA. She has been involved with several projects on Eurocontrol Social, Environmental, Economic (SEE) Business Unit Her research has focused on ATM environmental effects, sustainability and local air quality. She holds the M.Sc. in Environmental Engineering from Danish Technical University.
Nicolas Duchene is an environmental specialist working at ENV-ISA. He has been involved in the development of emissions inventory models and air quality studies for airports in behalf of Eurocontrol SEE. He performed studies about the global impact of ATM procedures on the environment as well as concerning the sustainability of the aviation sector.
Ian Fuller is an

19
Emanuel Fleuti is an
Peter Hoffman is an