Agriculture Economic ai- Diversification Trends in U.S. Food
50
¿«s, ynl,«istates. ^^ PrOClUCt |jL|ti|; Department of Agriculture Economic Research Service Agricultural Economic Report Number 521 ai- i' Diversification Trends in U.S. Food [\/lanufacturing James M. MacDonald xy '.M>>
Transcript of Agriculture Economic ai- Diversification Trends in U.S. Food

¿«s, ynl,«istates. ^^ PrOClUCt |jL|ti|; Department of Agriculture
Economic Research Service
Agricultural Economic Report Number 521
ai-
i'
Diversification Trends in U.S. Food [\/lanufacturing James M. MacDonald xy
'.M>>

Additional copies. • • of this report can be purchased from the Superintendent of Documents, U.S. Government Printing Office, Washington, DC 20402. Ask for Product Diver- sification Trends in U.S. Food Manufacturing (AER-521). Write to the above address for price and ordering instructions. For faster service, call the GPO order desk at (202) 783-3238 and charge your purchase to your VISA, Master- Card, or GPO deposit account, A 25-percent bulk discount is available on orders of 100 or more copies shipped to a single address. Add 25 percent for postage for foreign orders.
Microfiche copies ($4.50 each) can be purchased from the Identification Sec- tion, National Technical Information Service, 5285 Port Royal Road, Spring- field, VA 22161, Ask for Product Diversification Trends in U.S. Food Manufac- turing (AER-521). Enclose check or money order payable to NTIS. For faster service, call NTIS at (703) 487-4780 and charge your purchase to your VISA, MasterCard, American Express, or NTIS deposit account.
The Economic Research Service has no copies for free mailing.

Product Diversification Trends in U.S. Food Manufacturing. By James M. MacDonald. National Economics Division, Economic Research Service, U.S. Department of Agriculture. Agricultural Economic Report No. 521.
Abstract
Leading U.S. food manufacturers typically produce and sell a growing array of food products. Many have also expanded into related wholesale, transporta- tion, and food service industries, while avoiding large-scale involvement in agriculture and food retailing. Diversification by food manufacturers into unrelated product lines declined in the seventies. That decline, coupled with continued increases in diversification into food-related products, led to stabi- lization in average levels of diversification, after persistent increases since 1919. Successful diversification frequently depends on how readily employees' skills can be transferred to new products. Much recent diversification in the food industries has been based upon the transfer of marketing skills among consumer product industries and technical skills in commodity processing and transportation among producer goods industries.
Keywords: Diversification, food manufacturing, mergers, conglomerates.
Reference to commercial firms or brand names in this publication is for iden- tification only and does not imply endorsement by the U.S. Department of Agriculture.
Washington, DC 20250 March 1985

Contents
Page
Summary ....... ..............iil
Introduction 1
A Frameworlifor AnahrzingDivenMcation 2 Diversification^Importânt Theoretical Issues 2 Specific Sources of Diversification 3 The Incentive to Diversify 4
Data Sources and Measures of Dhrewification ... ^ 5 Sources of Diversification Data. 5 Measures of Diversification 6
Current Directions of Diversification ................. 7 Levels of Diversification, 1975. ..... 8 Diversification Within Food Manufacturing 9 Diversification Into Other Manufacturing Industries 14 Diversification Outside of Manufacturing 16
Trends in Dfoersiflcatíon, 195^77..,....,.. 20 Levels of Diversification, 1950. 21 Marketing as a Basis for Diversification .... 22 Industrial Directions of 1950 Nonfood Dwersification ............. 22 Diversification Outside of Manufacturing 23 Changesin Diversification Since 1950 23 A Break in the Trend 24 Influence of Conglomerate Entry 25 Conglomerate Divestitures .........,.........*.................. 26 Small Firm Diversification 27
Early Diversification in Food Mannfaclitring, 1919-50 28 Characterístícs of Diversification in 1919 . ^.., 28 The Trend of Food Manufacturer Diversification, 1919-50 29
implications 30
Bibliograpliy 32
Appendix A: Organizational Changes Among Leading Food Manufacturers, 1975-84 34
Appendix B: Food Processing Industries 42
Summary
Leading U.S. food manufacturers typically sell an increasingly large number of different food products. Many have also expanded into related wholesale, transportation, and food service industries, while avoiding large-scale involve- ment in agriculture and food retailing. Unrelated diversification outside of food industries by food manufacturers declined in the seventies. After persistent in- creases since 1919, that decline, coupled with continued increases in diver- sification into food-related products, led to stabilization in average levels of diversification. Successful diversification frequently depends on how readily employees' skills can be transferred to new products. Much recent diversifica- tion in the food industries has been based upon the transfer of marketing skills among consumer product industries and technical skills in commodity proc- essing and transportation among producer goods industries.
Product diversification refers to the variety of products that a company sells; a firm diversifies its product mix whenever it begins to manufacture the products of an industry different from those in which it is already engaged. This report discusses product diversification among firms in the food manufacturing in- dustries. Some trends are highlighted below.
• Average levels of diversification among leading food manufacturers in- creased continually between 1919 and 1972. The firms diversified into other food industries, into related wholesale and food service in- dustries, and into a broad array of nonfood industries.
• Midsized regional food manufacturers, with between 400 and 2,000 employees, are typically diversified among a few food processing and wholesaling industries, and average levels of diversification among these firms also ro$e until 1972.
• Between 1972 and 1977, the extent of diversification stabilized, on average, among all size classes of food manufacturers. Since 1977, in- creased merger activity suggests some continued diversification among leading firms, but a corresponding increase in divestitures suggests a movement away from investment in industries unrelated to food.
• Conglomerate diversification into the food industries peaked in the late sixties and declined in the late seventies and early eighties.
• Successful diversification is often based on the transfer of the firm's existing skills in marketing, production, or management. Since 1950, diversification based on the transfer of marketing skills has become much more important.
ill

Product Diversification Trends in V.S. Food Manufacturing
James M. MacDonald'
Introduetion
A firm diversifies whenever it begins to manufacture the products of an industry different from those in which it is already engaged. Although diversification can have major consequences for diversifying firms, their competitors« and consumers, lack of data has restricted close study of the phenomenon.
This report presents an analysis of product diver- sification among firms in the food manufacturing in- dustries. I define industries at the four-digit level of the Standard Industrial Classification (SIC) System, as developed over a period of years by experts on classification in Government and private industry under the guidance of the U.S. Department of Com- merce [36y I describe the current extent of the phenomenon and its growth over time, and explore the impact of extensive diversification on firms, their competitors, and consumers.
For the firm, diversification can provide a means to grow or to increase profits through a shift of re- sources out of slow-growth, low-profit industries into industries with higher growth and profits. Diversifica- tion may also lead to more intensive use of existing resources; for example, the firm may diversify in order to further process the byproducts of a manufac- turing operation or to provide expanded opportunities for underutilized younger managers.
Firms that diversify reallocate capital, labor, and materials from one particular industry, and often from a particular region, to another. In doing so, the firms perform functions often carried out through markets for capital, labor, and materials; that is, diversification can substitute for market processes as a resource allocator. An immediate question arises;
*The author is a staff economist in the National Economics Divi- sion, Economic Research Service, U.S. Department of Agriculture.
'Italicized numbers in brackets refer to literature cited in the bibliography of this report.
that question, of how diversified firms perform as resource allocators relative to markets, is of great in- terest to economists, whose research often centers on the operation of markets. The issue also interests State and Federal policymakers because proposed legislation, such as that concerned with conglom- erate mergers, plant closings, and industrial policy, is often based on criticisms of the performance of diver- sified firms in the allocation of resources.
Finally, diversifiers can directly affect innovation in an industry, including the introduction of new prod- ucts and new production processes. Diversified firms finance a large share of organized private research and development, often acquire innovative and rapidly growing small firms, and introduce a major share of new food products each year. To the extent that di- versifying firms affect the flow of innovations to the economy, diversification will have further indirect in- fiiences on the growth of productivity and incomes.
The report's aim is to supply a broad, descriptive perspective, to provide the reader with the principal characteristics of diversification in the food indus- tries, including incidence, extent, trend over time, and industrial directions, with some inferences made to sources and effects.
Product diversification should be kept distinct from other ways in which a company may be diversified. For example, a firm may diversify geographically by expanding into a new region or a new country without altering the types of products it manufactures. The company may also diversify financially by holding a portfolio of securities that are combined in such a way as to minimize the risk attendant upon any ex- pected financial return, without controlling the com- panies whose securities it holds. Financial diversifica- tion is often offered as a goal of product diversifica- tion, but the connection is actually weak; product

James M. MacDonald
diversification is an unnecessary and relatively costiy means of achieving financial diversification. Finally, in the sense that decisionmaking is highly decentral- ized, a firm may diversify by having top management perform a few functions, such as capital allocation, while using a small staff. Again, managerial diver- sification may occur where a firm's product mix is diversified (all four types may be present in a large firm), but it is not necessary for product diversifica- tion, which refers specifically to the complexity in the mix of goods and services produced by the firm.
The Standard Industrial Classification (SIC), the basis for industry definitions in the report, is an elaborate hierarchical code for the classification of establishments according to the nature of their prod- ucts [36] J The first step in classification is to assign establishments to sectors, such as manufacturing, mining, or wholesale and retail trade. Sectors are further comprised of groups, of which there are 20 in manufacturing, including food manufacturing. For a manufacturing establishment, the first digit in its in- dustry code is a 2 or a 3; the second digit refers to the industry group, with the food group assigned to 20. Each manufacturing group consists of several in- dustry classes; there are nine such classes in food manufacturing, such as meat and dairy products, which are assigned the three-digit codes of 201 and 202, respectively. Each three-digit industry class con- tains one or more four-digit industries; for example, the meat products class, 201, has meatpacking plants, 2011, prepared meate, 2013, poultry dressing plants, 2016, and poultry and egg processing, 2017. As one moves down the hierarchy from sectors to in- dustries, one moves to finer separations in product characteristics.
Some four-digit industries are closely related in a pro- duction sense; that is, firms active in flour milling (2041) or in wet corn milling (2046) may decide to further process the byproducts and waste material from those mills in feed establishments (2048). Other industries may use similar raw materials as well as production methods; a firm producing condensed milk (2023) may open ice cream (2024) or cheese (2022) establishments. In other instances, the prod-
'An establishment refers to a single physical location at which production takes place, and should be distinguished from the term firm, or enterprise, which is a business organization consisting of one or more establishments under common ownership.
ucts of some industries may be distributed in similar fashion. That is, a firm may find that its distribution network for canned fruits and vegetables (2033) may be applied to candy (2065), canned fish (2091), or cooking oils (2079). In short, there are various ways in which the products of different industries may be related to one another, and that relation may be close or it may be rather distant. At the extreme, the company's products may have no identifiable relation to one another. We will follow popular prac- tice and refer to this type of firm and diversification as conglomerate.
A Framewerk for Analyzing Diveisification
This section outlines the simple theoretical frame- work used in this study. This framework cannot en- compass all of the causes and directions of diver- sification, but it does provide a useful means of categorizing the data and interpreting the observed trends. The following principal points are made:
• Diversification is fundamentally a process of reallocating resources [by a firm] from one use to another and is, therefore, a substitute for resource reallocation [between firms] via markets.
• Resource reallocation, whether accomplished through a firm or a market, is costly, and diversification in general will be preferred where the costs of reallocation via markets are relatively high.
• Certain intangible assets, such as in- vestments in research and development, mar- keting organizations, and byproduct develop- ment, have substantial amounts of firm- specific knowledge, whose exchange through markets is relatively costly. These assets should influence both the levels and direc- tions of food manufacturer diversification.
• Profit expectations influence diversification. Specifically, firms with opportunities to diver- sify will most likely leave low-profit industries and enter high-profit ones.
DJversificatioii—Important Theoretical Issues
What enables a firm with experience in one activity to compete successfully elsewhere? Rivals in a new ac-

Prodttct Diversificatioii Trends in U.S. Food Manuffaetaring
tivily have more experience than the diversifying en- trant and, to the extent that experience in an industry leads to declines in production costs, existing pro- ducers should have a cost advantage. If there are im- portant scale economies, existing producers also seem more likely to have attained them.
Some historical accounts advance excess capacity in certain inputs as a source of diversification. For ex- ample, Alfred Chandler interprets General Motors' ex- pansion into tractor and refrigerator production dur- ing and after World War I to be a response to excess capacity in its automobile plants and distribution net- work [6]. Given the excess capacity, m*arginal costs of production in those new areas may have been rela- tively low. Similarly, Edith Penrose asserts that cor- porate policies of diversification may result from ex- cess managerial capacity [29}.
The excess capacity notion focuses on assets that the firm can apply, at relatively low cost, to other ac- tivities. Such assets might be structures (factories or warehouses) that can be applied to several types of products, raw materials with a variety of industrial applications, or managers whose skills can be applied to the production or distribution of a variety of prod- ucts. Yet a fundamental problem still exists. The firm with excess capacity in some input can reallo- cate that input through diversification, but the firm also has the choice of selling the input to existing producers in the other activity. Consequently, there must be reasons for the firm's preference for an inter- nal reallocation (diversification) over a market reallo- cation via sale (divestiture) of the asset. Recent the- ories of vertical integration and diversification con- centrate on those reasons, identifying conditions under which the costs of using markets will be rel- atively high, with the result that diversification is preferred.
Specific Sources of Divei^ification
Four principal sources of diversification are based on an intangible asset, knowledge:
• Research and development of new products or manufacturing processes may generate new knowledge which can be applied to other activities of a firm.
• A firm's marketing organization may be adaptable to other product lines.
• Knowledge of manufacturing processes may be transferable to other product lines.
• Manufacturing processes may generate by- products which are potentially marketable on their own.
There are well-known obstacles to the exchange of knowledge within a market [2], First, it is difficult to agree upon the value of knowledge without revealing its content; revealing content makes it unnecessary to buy the knowledge. This is the "appropriability prob- lem," so named because of the difficulty of appro- priating the returns to knowledge in the market. Sec- ond, ''specific knowledge" is often used jointly with other inputs in production; it may be quite difficult to ascertain the contribution of knowledge to the value of output.^ This increases the uncertainty of invest- ment in knowledge. Third, many products require in- vestment in unique types of knowledge concerning the production characteristics at the plant or methods of distribution of the product. Those possessing the unique knowledge will have a degree of monopoly power in the sale of their services and will often face a single buyer. The resulting bilateral monopoly can cause production delays and increase costs as the parties bargain over division of profits [40]. By "inter- nalizing" the parties within a single firm, these costs of using markets can be reduced. Again, diversifica- tion is used where market solutions are relatively costly.
The costs of using markets are low where the prod- ucts exchanged are well-defined and have clearly defined property rights. For products such as infor- mation, where these characteristics do not necessari- ly hold, the cost of using markets may be relatively high.
The theoretical literature implies that diversification may arise where specific knowledge is an important component of sharable production and distribution in- puts. In other words, certain intangible assets may
'"Specific knowledge" is held by certain emplc^ees within the firm, but not, in general, by people outside the firm.
James M. MacDonald
strongly affect the level and directions of diversifica- tion. Research and developrnent (R & D) of new prod- ucts and processes often generate new knowledge ap- plicable to other activities technologically related to the firm's principal industry. This new knowledge may have to be applied internally, rather than ex- changed In markets, in order for the firm to appro- priate the returns to its investment. In their histori- cal accounts. Chandler and Penrose have emphasized the role of organized research and development (R & D) efforts in the growth and diversification of industrial firms [6, 19],
A firm's marketing organization contains a second sort of firm-specific knowledge, which is particularly important in the food industries. Firms with expertise in the marketing of their original products may apply those skills to other products which are marketed through similar channels. In the context of our theory, the resources of marketing organizations are less transferable through markets than others, since those resources consist substantially of the specific knowledge embodied in the organization's personnel and, therefore, must be reallocated through the firm. Marketing here refers to the pricing, warehousing, packaging, transportation, and retail distribution of the firm's products. Among food industries, there clearly are elements of similaril^ in the marketing channels of products. The most similar are the chan- nels for marketing products which use the same physical distribution facilities (warehouses, trucks); two such groups are refrigerated grocery products and alcoholic beverages. Moving along a continuum through less similar products, we encounter products sold through the same retail outlet (for example, grocei^ products) and then produce sold to similar classes of buyers (consumer nondurables). Using this notion of a continuum, marketing expertise should lead firms to diversify into those products which are relatively closer to their own, and industries with strong similarity in marketing links are more likely to be linked by diversification than industries with weaker or nonexistent similarity.
A third type of firm-specific knowledge arises in the firm's manufacturing organization; The technological problems of commodify processing may be quite sim- ilar to those of other products. Therefore, expertise in the preservation, separation, and acquisition of raw materials^ and in machinery design, inventory con-
trol, and jquality control may be transferred to tech- nologically related products. Within the food indus- tries, for example, skill in one of the canning in- dustries provides a basis for diversification into another; the same may be said for diversificaron among the industries In grain milling or vegetable oil refining.^ As in the marketing case, the resources of production organizations which generate diversifica- tion are personnel who possess the sharable, firm- specific knowledge of production techniques.
A last source of diversification also arises firom pro- duction. As output grows in the primary activity, the firm often generates large quantities of byproducts and may o^n require iarge quantities of a particular input. If there are high transportation costs and econ- omies of scale in production of the input or in further processing of the raw material, the least-cost organi- zation of production of the item may be a single plant. In such a case, our original firm faces the risk that its byproduct generation or input demands will face a simple buyer of byproducts or a monopolist seller of inputs. The efficient solution is for the firm to in- tegrate into^he upstream or downstream activity and manage input production and byproduct processing itself. ' This situation should occur only among large producers of a primary good with scale economies and high transport costs in inputs or byproducts. For example, leading canners often manufacture their own cans.
The Incentive to Divers^
The incentive for a firm to diversify is increased prof- its. Relatively high expected profits in a primary in- dustry should lead the firm to invest there. Girowth in the primary Industry, coupled with market character- istics which require vertical integration, lead to in-
^In the SIC system of plant classification» there are seven four- digit grain milling industries, anci the differences among products in the seven industries are subsUintial enough to generally require processing In separate es^blishments. Most firms that produce grain mill products specialize in one of these industries; those that eventually diversi^ production are likely to enter other grain mill- ing industries because of similarities in raw materials, techniques, and distribution jskills.
'The solution is efficient in two sensesv First, the integrating firm can reduce its costs. Second, monopsony will raise thé price of a producty relative to other inputs, and if input substitution exists, the buyer will shift to an Input combination that is inefficient under competitive prices. Integration will lead to lower total production costs in the two stages and gféatér output. A similar condition holds for monopoly.

Product Diversification Trends in U.S. Food Manufacturing
vestments in vertically related activities such as byproduct, input, and ñnal product processing/Rela- tively low expected profits in the primary industry should lead firms to diversify toward those higher profit secondary industries in which the firmes shar- able assets can be applied.
The factors mentioned thus far should influence the industrial directions of diversification and the level of diversification that a firm might attain. Another fac- tor, the size of the firm, should also constrain the level of diversification. Given competition and scale economies, in order to achieve least-cost production levels, the firm must be large enough to achieve min- imally efficient scale in all products. Therefore, the larger the firm, the greater will be the number of in- dependent products that can be manufactured. In this way, factors that influence firm size will also indirect- ly influence levels of diversification. Such factors in- clude communications technologies, which alter the relative cost of managing large organizations; those government tax, procurement, and antitrust policies whose effects vary with size of firms; and intersec- toral demand shifts (since average firm sizes vary greatly across sectors). During periods in which large firms grow rapidly and more firms become large, average levels of diversification in the economy should increase. Alternatively, during periods in which large firm growth stagnates and smaller firms begin to proliferate, average levels of diversification should decline.
In the process described so far, firm size places a constraint upon the amount of diversification that a firm may achieve. Relative profits and intangible assets should influence both the level and the direc- tions of diversification. Firms should diversify into in- dustries related to their own through marketing and production similarities. The degree of relatedness among industries will vary; firms should diversify first into those industries most closely related to their own, and then into industries with more tenuous links. Firms should be far less likely to diversify into unrelated industries.
The outline provided here is rather simple. Indeed, it is kept purposefully so in the belief that a simple framework can aid in identifying the principal under- lying sources of diversification without treating each instance as a special case.
Data Sources and Measures of Diversification
Several sources and measures of diversification data are used in this report. They differ in units of observa- tion (single firms or groups of firms), level of industry detail, and extent of information provided (table 1).
Sources of Diversification Data
For 1975, diversification data were obtained for the 200 largest food manufacturers from Economic Infor- mation Systems, Inc. (EIS). The original EIS set lists for each firm the location, principal industry, and number of employees of all establishments with more than 20 employees. In order to obtain estimates of the dollar value of plant shipments, the employment figures were multiplied by the average value of ship- ments per employee in the relevant industry (using Census Bureau ratios); estimated firm shipments in an industry are then the sum of establishment ship- ments [8], Note that secondary output of plants is assigned to the principal industry of the plant; that is, I follow the Census Bureau convention.
The EIS data provide information on the extent and directions of large firm diversification in 1975. Federal Trade Commission (FTC) data provide the same information for 1950, thereby allowing for in- vestigation of 1950-75 change [35]. The FTC source includes shipments, by five-digit product class (a nar- rower level of detail than industry), for the 100 largest food manufacturing firms. The data were ag- gregated to the four-digit industry level for analysis. FTC data detail the secondary output of establish- ments, while the EIS data do not; the consequences will be explored in the statistical sections.
Special tabulations by the Census Bureau provide a third source of data. The Census data are for group- ings of firms (for example, the largest 25, or all firms in flour milling), without company detail. Census di- versification data are of two sorts: one is the average number of industries participated in by a group of firms, while the second shows the number of firms in a group who were active in a particular industry. The Census Bureau provided special tabulations for the 500 largest food manufacturers (and various sub- groups) in 1967, 1972, and 1977 [26, 27, 28]. Similar special tabulations were obtained earlier for 1954,

James M. MacDoiiald
Tabks 1 -Data acia usad in n^rt
Data set Ycar(s) covered Universe Comments
EIS
FTC
1975 200 largest focHl manufacturers.
1950 140 largest food manufacturers.
Individual firm data; covers aU activities; ignores secondaQjr output of ^tabltehments.
Individual firm data; only manufacturing is covered.
Moody's Industrial Manual
Census Special Tabulations
1919 1929 19a9 1950
1954 1958 1963 1967 1972 1977
53 large food manufacturéis (37 for 1919).
100 and 500 largest food manufacturers.
Individual firm data; does not give shipments ^timates; all firms are in FTC set.
Observations are for ^oups of firms; data presented are counts of the number of firms in an activity or the number of activities of a group of firms.
Census Enterprise Statistics
1963 1967 1972 1977
Three-digit food industries. Observations are for all firms assigned to an industry; data are largely shares of empfoyment in primary and secondai^ industries.
Sources: [5, 17, 18, 26, 27, 28, 29, 30,35],
1958, and 1963 [IS]. The Census Bureau also pub- lishes diversification data, at the three-digit leveU for all firms in a specific industry. These Enterprise Statistics are avaltable for 1963 through 1977 [29, 30], Census data do not provide the company detail of the other sources, but they cover a wide size range of companies, and they allow for closer analysis of time trends.
Finalty, early^data for the 1919-50 period were ob- tained ñt>mJtfoody's Industrial Manuals [17] for a sample of large publicly held firms. Moöd%^sMarmals provide accurate listings of the industries that ifi- dividuaL firms participated in during a given year. The MoodyV information, collected for 1919, 1929, 1939, and 1950^âtUows for an o^^rview of ead^r trends in food manufacturer diversification. Other trade pub- lications provide diversification detail, thereby sup- plementing the large data sets for the period up to 1984.
Measure« of Dlvei^ifieation
I used three measures of diversification. Each yields similar results, and they are highly correlated. Subtle differences, however, may appear in analyses of par- ticular flrmsv
The industry count (N), a simple count of the number of industries in which a firm engages, is widely used because it is easily available. N Is the only measure that can be used priorio 1950, and it is also the most common measure in the Census special tabula- tions. Although readily comprehensible, N measures only one aspect of diversification, ignoring the distribution of a firm's shipments across industries.
The specialization ratio (P), the share of primary in- dustiv shipments in the firm's total (the primary in- dustiv has iBhe largest share of firm shipments), is a crude means of meeting the distribution criterion.

Product Diversification Trends in U.S. Food ManuflK^iiring
The measure ignores the number of activities of a firm and the distribution of sales among secondary activities, but it is easily obtained and is highly cor- related with N and with more comprehensive indices.
Comprehensive indices reflect both the number of in- dustries of a firm and the complete distribution of shipments across them. The comprehensive index (C) used here is defined as follows:
N 0 = 11 {1/pfi
isl
or
N
logC = EPilog(l/Pi)
(1)
(2)
where Pj is the share of firm shipments in the i**^ in- dustry. The C index, also known as the entropy and the Shannon index, has been used in several eco- nomic analyses of diversification [3, 4, 13, 16] and is widely used in ecology in the study of species diversi- ty in a particular habitat. Given the distribution of shipments across industries, the C index increases as the number of industries increases. Given the number of industries, the index increases as smaller activities grow relative to large ones.
The index has two particularly desirable characteris- tics. First, it is expressed as a numbers equivalent. The significance of this can be grasped with an ex- ample. Assume that a firm is active in 15 industries. Five are important, each accounting for 15 percent of firm sales; five are quite minor, each accounting for 1 percent of sales, and the others each account for 4 percent of sales. Now, clearly this firm is not as diversified as one with sales evenly divided among 15 industries, since its sales are concentrated in 5 of the 15. It is clearly more diversified than one with sales evenly spread across 5 industries because it has an even spread across 5 and also has 10 more. The weighting scheme embodied in the formula for C places this representative firm more precisely be- tween the two extremes. According to the formula, the value of C for this firm is 7.3, which says that the firm is more diversified than one with sales evenly spread across seven industries. The maximum value
of C for any firm is N, the number of industries of the firm, and the minimum is 1.
The second characteristic is decomposability. Spe- cifically, the comprehensive index across all of a firm's activities, Cj, may be decomposed as follows:
CT = CA + CW
1 s 1
(3)
(4)
where C/v is a comprehensive index defined across a firm's two-digit industry groups (the P| of the entropy definition then becomes the share of firm sales in the ith two-digit group). In the present analysis, C^ is a measure of diversification outside of food manufactur- ing, while Cw is the weighted average of comprehen- sive indices across four-digit industries within each two-digit group. The weights (Pj) are the share of firm shipments in each group. One component of C^y is of particular interest. That is Cp, a comprehensive index defined across all four-digit food industries. The several comprehensive indices can be used in com- bination to describe the industrial directions of food manufacturer diversification.
Current Directions of Diversification
Large firms in today's economy produce in an enor- mous number of industries. Here I detail the extent of diversification by food manufacturers, the principal industries to which they've directed their expansion, and the connections among their industries. The prin- cipal conclusions are as follows:
• Leading food manufacturers are highly diver- sified, within food manufacturing as well as outside of it. Very few large firms are not diversified.
• Within food manufacturing, there is a system- atic clustering of firms among particular groups of industries. Some firms confine their activities to branded food products sold in grocery stores, ignoring products with more disparate sales patterns and those sold to other producers. Other firms concentrate on producer goods industries, avoiding consumer products.

M. MaeDanald
Marketing organizations are Important bases of diversification, and their importance as a base tias greafly increased since 1950.
diversified across food industries (Np). The smaller firms among the top 200 are also generally active in
While there have been significant investments in the food industries by conglomerates from other manufacturing si^tors, their activity has usually been limited to a small number of industries, and they account for a small share of shipments in most food industrie.
By implication, much diversification within the food industries is at least potentially based on the transfer of marketing and production assets to new activities.
Diversification into other manufacturing ac- tivities, outside of food, is relatively small, restricted to the largest food companies and concentrated in consumer products and in- dustries that are vertically related to the food industries (such as packaging and food proc- essing machinery).
Diversification outside of manufacturing has been an important and rapidly growing com- ponent of the total. Smaller food manufac- turers, as weU as large, have diversified into wholesaling, retailing, transportation, and agriculture. Food manufacturers have exten- sive, expanding operations in food wholesal- ing and in eating and drinking places. They are not major factors in transportation or agriculture, but their Investmente in those areas have grown rapidly in recent years.
Levels of Diversification, 1975
Average 1975 levels of diversification among food manufacturing firms, using N and C indices, are presented in tables 2 and 3.
Indtts^ Counts. Measures of N are presented in table 2. Nj is the number of industries in all sectors; Njj^ is the number of industries in manufacturing, and Np is the number of Industries in food manufac- turing. Mean values generally exceed medians, but the difference is small, and average levels of diver- sification clearly increase with size. The largest firms average over 20 Industries each (Nj) and are widely
Table 2 --Nnnber of industries of leading firnis, 1975
Indices Size dass of firms, ranked by food shipments
1-25 26-50 51-100 101-200
Number
Median NT 20.00 12.00 7.00 4.00 MeanNr 23.12 13.08 8.40 6.97 Median NtM 15.00 11.00 4.00 4.00 Median Nn« 19.44 11.64 6.80 5.41 Median Np 9.00 8.00 4.00 3.00 Mean Np 11.36 8.00 4.76 3.50
NT S number of manufocluring industries participated in, across all sectors;
N-pM» number of manufeicturing industries; Np s number of food manufocturing industries.
Source: Author's calculations, based on data acquired by John Connor and Loys Mather from Economic Information Systems, Inc.
IMite 3-DiveñMcation levels, 1975
Indices Size class oí firms, ranked by food shipments
1-25 26-50 51-100 101-200
Number
Median Q 6.31 4.60 3.11 2.14 Mean C^ 9.12 6.38 3.85 3.59 Median C^ 6.15 4.49 2.66 1.98 MeanCxM 8.26 5.42 3.28 3.08 Median C^ 2.08 1.71 1.48 1.22 MeanCA 2.52 1.96 1.88 1.92 Median CAM 1.42 1.30 1.00 1.00 Mean CAM 1.95 1.41 1.32 1.46 Median Cp 3.76 3.67 1.92 1.96 MeanCf 4.56 4.10 2.71 2.14
CTS comprehensive diversification index across alt four-digit manufacturing industries; CTM - diversification across ail four-digit manufacturing industries; CA s dh;ersification across all two-digit indùistries; CAM ^ diversification across all two-digit manufacturing industries; Cp s diversiflcation across four-digit food manufacturing industries.
Source; Author^ calculations, based upon data acqjulred by John Connor and Lo|^ Mather from Economic Information Systems, inc.
8

Product Diversification Trends in U.S. Food Mannfactoring
several food industries. Only modest manufacturing activity occurs outside food; food industries account for roughly 70 percent of all manufacturing industries of food firms ranked 26-200, and 60 percent of the top 25 firms. The largest class has significant non- food interests, with an average of eight other manu- facturing industries and about four nonmanufacturing industries.
Comprehensive Indices. Comprehensive indices, presented in table 3, provide a more complete view of 1975 levels of diversification. Cj, C^, and Cp refer to diversification across all four-digit industries, all two- digit groups, and all four-digit food manufacturing in- dustries, respectively. For purposes of comparison to the 1950 data, Cj and C^ were recomputed for the manufacturing sector only. The adjusted indices were
Mean values of the C indices substantially exceed me- dian values, reflecting especially extensive diversifica- tion by a few firms.^ Because the correlation coeffi- cient between Cj and firm shipments was -i- 0.56, diversification is strongly associated with firm size. Because median C^j^ in the two smaller size groups is 1.00, most of those firms have no nonfood manu- facturing, and entry into other manufacturing groups is therefore clearly restricted, for the most part, to the largest companies.
Several additional conclusions seem obvious in table 3. Values of C are generally 40-50 percent as large as corresponding values of N, with larger percentages among smaller firms. If a firm's shipments in each of its industries were equal, N and C would be identical. The large differences indicate that firms in 1975 typically had a few major industries and a large num- ber of relatively minor activities. Considering the low values of C^, diversification across groups, the me- dian firm in size classes below the'top 25 was con- siderably less diversified than one with sales evenly divided across two manufacturing groups. Finally, food firms concentrated most of their manufacturing diversification within food. Elsewhere I have shown that food manufacturers are unique in this respect [14]. In manufacturing groups other than food, niost secondary manufacturing employment in 1977 was
outside of the primary two-digit group, a pattern also true of Japan, Canada, and Great Britain [5, 12, 37],
Diversification Witliin Food Mannfactaring
Leading food manufacturers are widely diversified within the food industries (see Np and Cp in tables 2 and 3), and certain patterns stand out. Consider here the typical directions of diversification within food manufacturing (table 4). (SIC numbers only are listed to conserve space. See appendix B for füll titles and descriptions.) Column 1 lists the average number of diversified entrants, from the list of the 200 largest food manufacturers, in each four-digit industry. An entrant to an industry is here defined as a diversified producer for whom the industry is not primary; for example, Kellogg would be defined as an entrant in all industries but breakfast cereals. Column 2 lists the estimated share of industry sales accounted for by those large diversified entrants. The estimates appear to be reasonably accurate when compared with data from the Bureau of the Census.^
On average, large diversified entrants account for 35 percent of shipments in food industries in 1975, but there was a great deal of variation across industries. Almost no diversified entry occurred in beet sugar or in cottonseed oil, for example, while entrants ac- counted for almost all shipments in pet food. When the sample is broken down into 11 producer goods and 34 consumer goods industries, levels of entry (by number of entrants or share of shipments) are substantially lower in producer goods."
Functional Relationships Between Primary and Secondary Industries. In columns 3 through 5 of tables 4 and 5, the market share of diversified en- trants is distributed among three categories accord* ing to the relationship between the secondary in-
^Because the N index did not show a large discrepancy between mean and median values, the source of the difference must lie in the distribution of shipments across industries, rather than in the number of industries of diversified firms.
'The Census Enterprise Statíatica listed the share of industry shipments accounted for by firms for whom the industry is primary [29, 30]. The Enterprise Statistics industries often include several four-digit SIC industries, so one must aggregate the EIS industries for comparison. Secondary production, in the Enterprise Statistics, includes all firms, not just the 200 largest. My EiS-based estimates, therefore, should be smaller than the Enterprise Statistics,
"Consumer goods industries are those for whom at least 50 per- cent of total commodity output was sold to final consumer demand or to eating and drinking places, according to 1972 detailed Input- Output Tables [34].

TaMe 4—DIverslllcatloii within food manufactariiig by the 200 largest food ataiiiifactiirers« 1975
Industry SIC
number^
(1)
Entrants
(2) Share of Industry
sales
(3) Production- related as
percent of (2)
(4) Marketing- related as
percent of (2)
(5) unrelated as percent of
(2)
Number
2011 18 2013 39 2016-7 29
2021 12 2022 23 2023 17 2024 26 2026 16
2032 25 2033 38 2034 22 2035 31 2037 34 2038 37
2041 12 2043 14 2044 2 2045 12 2046 8 2047 24 2048 37
2051 26 2052 19
2061 7 2062 4 2063 1 2065 35 2066 9 2067 6
2074 2 2075 13 2076 8 2077 7 2079 19
2083 6 2082 5 2084 18 2085 7 2086 26 2087 17
2091 15 2092 13 2095 10 2097 6 2098 7
18 36 29
26 22 35 69 19
32 34 60 60 50 55
22 43 11 45 28 90 28
22 23
39 19 2 44 43 52
3 35 44 16 71
48 13 46 27 22 18
71 25 31 31 19
28 69 86
85 88 88 84 97
6 14 3 17 15 6
100 66 0
80 69 44 84
48 32
54 59 0 14 30 0
59 94 100 100 31
100 0 0 0
27 0
71 0
11 0 13
Percent —
0 20 14
15 10 10 16 3
54 52 91 75 69 68
0 31 100 8 0 46 0
13 34
0 0 0
62 70 25
0 0 0 0
65
0 0 98 48 14 90
23 53 86 100 51
72 11 0
0 2 2 0 0
40 34 6 8 16 26
0 3 0 12 31 10 16
39 34
46 41 100 24 0
75
41 6 0 0 4
0 100 2 52 59 10
6 47 3 0
36
^See appendix B for titles and descriptions of SIC numbers.
Source: Author's calculations, based on data in [8].
10

Product Dhreratficatlon Trends in U.S. Food Mannfactaring
Table 5-A saniniary of divefsification within food manufactnring by the 200 largest food flms, 1975
Industry category
All food industries
11 producer goods industries
34 consumer goods industries
(1)
Average number
of entrants
(2)
Entrant share of
ship- ments
(3) (4)
Production- Marketing- related as related as
percent of (2) percent of (2)
(5)
Unrelated as percent of
(2)
Number
17
10
19
35
26
38
44
69
36
■ Percent •
33
0
44
22
31
20
Source: Author's catculations, based on data in [S].
dustry and the primary industry of the diversifying firm. There is an unavoidable amount of subjectivity in such an exercise, and so the conclusions should be viewed as tentative.
Column 3 lists the share of entrant shipments by di- versified entrants whose primary industry is related to the secondary (entered) industry through production similarities. Production-related activities fall into two categories. One covers vertically related industries, where one industry supplies another. In this category, I included the activities of meat packers in processed meats, for example, and also the activities of feed producers in broiler processing. I also included by- product activities, chiefly in feeds and animal oils. Finally, I included the activities of retail foodstores in grocery product manufacturing. The vertical category is fairly clearcut and should not be controversial. The second production category is horizontal production relatedness; here, I grouped activities with a common raw material or with production processes deemed to be quite similar. For example, activities of fluid milk processors in other dairy industries were grouped here because they use a common raw material. Pro- duction by soybean oil processors in other vegetable oU industries was also grouped here because oil prod- ucts use similar technological processes and face similar problems in raw material preservation, stor- age, and processing. Finally, processors of substitute products are included (for example, beet, cane, and corn sugar), even though production processes may differ, because the industries share a common tech-
nical knowledge of the properties of the final product, and firms with the skills to produce in one may there- by generate the technical skills to introduce products in the other industry.
Column 4 lists marketing-related activities, falling in two categories. One consists of products distributed through the same physical marketing channels as the primary product. For example, a firm with a wide- spread refrigerated distribution system may market a variety of meats, dairy products, and refrigerated preserved products through the system. A firm with an alcoholic beverage distribution network may mar- ket wines as well as liquor in that network. The sec- ond type of marketing similarity is broader; it con- sists of grocery store food products sold by firms with widespread grocery manufacturing activities. This cat- egory consists of firms with skills in pricing, pro- moting, transporting, and storing consumer food products through a broad distribution network.
Column 5 lists unrelated diversification, which in- cludes diversification into food industries by firms from other consumer product industries, diversifica- tion among food industries with no obvious similar- ities, and conglomerate entry into food. In short, there are also various graduations of unrelatedness. This category should, however, correspond to the FTC merger series category of "other conglomerate mergers," with "other" essentially meaning unrelated.
There is one last conceptual problem in assigning firms to categories. We can probably agree that the
11

James M. MacDonald
1975 meatpacking activities (SIC 2011) of LTV Cor- poration (pTimarily active in steel, aerospace, and electronics) fall into the unrelated category. What about production by LTV's meatpacking subsidiary in processed meats (SIC 2013)? This type of case, an in- direct relatedness, was resolved by classifying the meat processing activities as production related (since there is a strong technological relation to meatpacking) while classifying the mealpadting ac- tivities as unrelated.
On average, 44 percent of shipments by firms enter- ing food industries were production related. Percent- ages of production-related shipments vary greatly across industries. They are very high in the dairy industries; almost all diversification into dairy in- dustries was carried out by other dairy firms, a phenomenon that occurred as far back as 1919 [25]. The remarkable absence of diversification into dairy industries by nondairy firms stands out clearly in the data. Production relatedness is also high, generally, in the producer goods industries. Horizontal relation- ships account for much diversified entry in the vege- table and animal oil industries, and vertical relation- ships appear to account for diversification links in the grain industries, malting, and in broiler processing.' The expansion of the agricultural export trade in the seventies provided profitable opportunities for these firms to expand into a range of related activities.
On average, an estimated 33 percent of large diver- sified entrant shipments were marketing related. This surely is higher for consumer food industries and was especially high in firms producing beverages and pre- served fruit and vegetables. Later we shall see that very little diversification in 1950 was based on mar- keting. By implication« application of marketing skills accounted for a substantial portion of the 1950-75 in- crease in diversification. The average share« while not dominant, has certainly grown since 1950, and the estimate is rather conservative. It would be quite a bit higher if I were less inclined to ascribe diver- sification among grains, oilseeds, and dairy industries to production similarities.
Finally, the percentage of firms in the unrelated cate- gory also varies substantially across industries. The
^One may argue that marketing actually accounts for the grain and oilseed figures, since these firms maintain extensive transpor- tation, storage, and distribution facilities.
share of all entrant shipments in the unrelated cate- gory tends to be highest where the total share of en- trants was relatively low—in meatpacking, sugar, cot- tonseed oil, brewing, and bottling. (Chewing gum was an exception.) Total entrant food shipments in the un- related category were also quite concentrated; 35 per- cent of con^merate shif>ments were in meatpacking, 10 percent were in bottling, and 6 percent each in brewing and feuit and vege^ble canning. Conglo- merate activity in the food industries Is still small.
This evidence suggests that while there Is significant unrelated diversification, many food firms do follow systematic strategies In their diversification within food manufacturing.
The Patteñis of Individual Firms. Commodity food processors—firms who transport, store, and proc- ess bulk grains, oilseeds, and meat products, but do not distribute to retail—have faced a distinct set of diversification opportunities.
At the beginning of the seventies, Cargill, the large grain trading firm, had an extensive network for transporting and storing grains, as well as obvious in- stitutional expertise in trading grains. During the sev- enties, Cargill used those assets to become a leading processor of a variety of commodity food produce. Through internal construction and acquisitions, Cargill became one of the largest flour millers in the country, and one of the four leaders In wet corn mill- ing. The firm also constructed several soybean and sunflower oil plants. Finally, Cargill has diversified into meatpacking, feeds, poultry processingi^^ and salt processing. Note that Cargill has not expanded Into branded consumer products, but has confined Itself to products related to its distribution network or prod- ucts that require the transporting and purchasing of bulk food commodities.
Archer-Daniels^Mldland (ADM) has followed a similar strategy. The firm is among the largest flour and wet corn millers in the countiv and has also expanded into soybeans and hydroponics. In response to the growth of agricultural exports in the seventies, ADM acquired grain elevators and transport firms^ increas- ing the scale of its distribution network. In general, the firm also avoided branded consumer food prod- ucts, but expanded in domestic and foreign grain and oilseed processing. Both Cargill and ADM, then, have
12

Product Diversification Trends in U.S. Food Manufacturing
based their expansion upon existing expertise in grain and oilseed transport, processing, and distribution. They have avoided consumer food products and entered other commodity industries that were rapidly growing (soybeans, wet corn milling) or subject to jfiindamen- tal shifts in the location or technology of production. Such industries offer significant profit opportunities, and diversifying commodity firms are well positioned to enter.
Conagra, rooted in grain processing, has expanded in a slightly different direction. The company became a leading poultry processor, a field which today is highly integrated, from chick and feed production (Conagra's base of entry) through broiler raising to processing and retailing. Innovative poultry proces- sors introduced more effective quality control, new developments in products (through bigger birds and different cuts) and production processes, and rapid distribution to retail outlets. Following diversification into broilers, Conagra diversified into meat, catfish, and seafood processing, all bulk-food operations in which opportunities for innovation in distribution, production methods, and new products may exist. Finally, with the growth of the grain export trade and the deregulation of grain transportation, Conagra has expanded its flour milling operations and its grain distribution network.
Many food processors sell their output through grocery stores to consumers, rather than to other producers. The largest of these firms have diversified extensively over time, and much of their diversifica- tion has been based upon their marketing experience. One might begin with the Campbell Soup Company, where diversification began in the fifties with the ac- quisition of the Swanson frozen food line. When the company later acquired the Pepperidge Farms bakery company, it had a nationwide distribution network available through which it could Introduce a variety of specialty baked goods, through frozen as well as regular channels. Later the firm acquired Mrs* Pauls fi'ozen fish plants and the Vlasic line of pickles. Campbell has confined itself to branded consumer food products, sold largely through grocery outlets, and has avoided entry into bulk commodity process- ing or unrelated manufacturing activity.
Nabisco Brands has also emphasized branded con- sumer food products. Prior to their 1981 merger.
Nabisco and Standard Brands each produced a varie- ty of dry grocery products in a large number of coun- tries, with some unrelated activities, such as Nabisco's toiletries business and Standard Brands' interests in wet corn milling and alcoholic beverages. Since the merger, the combined firm has sold off the toiletries, dog food, and alcoholic beverage businesses, has begun to exit from flour and wet corn milling, and has acquired Lifesavers Candy from Squibb. Nabisco Brands is now involved in a large variety of domestic and foreign grocery product industries, while avoiding further expansion in nonfood or producer goods industries.
The major tobacco firms faced a different set of in- centives, and a somewhat different set of opportu- nities, than those faced by processed food firms. As per capita tobacco consumption began to lag in the late fifties, large cigarette firms diversified. The firms did not have a distribution network that could easily be adapted to other products, and they did not have experience in large-scale food production. They were, however, experienced in the promotion (pricing, ad- vertising, and introducing new products) of branded consumer nondurable products and, in general, they diversified into those types of products. R. J. Reynolds, for example, has displayed a general strategy of diversifying into branded food products. Early acquisitions were in canned products, with the purchase of Pacific Hawaiian Products (^'Hawaiian Punch"), the Chun King Corporation, and Patio Pro- ducts. With acquisitions of Del Monte (canned fish, fruits, vegetables, and specialties) in 1979, Morton Frozen Foods in 1980, Heublein (alcoholic beverages, specialty canned goods, Kentucky Fried Chicken) in 1982, and Canada Dry (beverages) in 1984, Reynolds became one of the largest processors of branded, na- tionally distributed, food products. Reynolds has also invested in an unrelated area, petroleum, with ac- quisitions of Signal Petroleum, Aminoil, and the U.S. subsidiary of Burmah Oil but then sold its petroleum operations to Phillips Petroleum in 1984.
Phillip Morris has concentrated in branded consumer products: razor blades (Persona), beer (Miller), and soft drinks (Seven-Up). American Tobacco (now American Brands) has pursued a wide-ranging diver- sification strategy within consumer products and is now active in canned juices, cookies and crackers, snacks, alcoholic beverages, toiletries, home hard-
13

Jfâof ë» M. MacDônalil
ware (staplers), and office products/Less than half ^^o^ American's sales now x»*igmate in tobacco. Before its 1980 acquisition by Graind Metropolitan» Liggett and Myers had also reduced the shar^ of firm sales of tobacco to less than one^half through diversification into alcoholic beverages, pet foods, toiletries, and jewelry.
With the exception of Reynolds' oil interests, all ma^ jor cigarette firm diversification was directed toward branded consumer products in industries in which ad- vertising and new product introductions were impor- tant. Many of these industries are in food, and these firms have become major food processors.
Other food firms, market leaders in specific indus- tries, have diversified into other consumer food in- dustries, and have become diversified food marketers in the process. Pillsbury, with acquisitions since 1975 of Haagen-Dazs, Green Giant, Pioneer Food Indus- tries, American Beauty Macaroni Co., and Totino's Frozen Pizza, has expanded into canned and frozen fruits, vegetables, and specialties, as well as ice cream, rice, and pasta products. Since 1975, General Foods has expanded into specialty baking (Enten- manns), processed meats (Oscar Mayer), and pasta products (Ronzoni) in addition to its existing wide line. Coca-Cola, Pepsico, and Anheuser Busch have diversified into snacks, specialty baked goods, and other beverages. In short, market leaders in various branded food product categories have expanded into a variety of other consumer product food industries, in addition to firms such as Beatrice, Borden, Pet, General Mills, and Consolidated Foods, who had diversified widely across consumer food industries in the fifties and sixties. That these firms have chosen such industries suggests that marketing factors play a major role in current diversification strategies.
Marketing's Shift In Impoirtànçe. Thorp, writing in 1923, surmised that marketing could serve as a base for diversification among the food industries [25]. Yet marketing did not really become a major source until well after 1950.
Several factors have combined to alter the techno- logy of marketing since 1950. For example, televisiofi has become a very important advertising medium. Data from the National Commission on Food Market- ing indicate that food manufacturers (exclusive of tobacco and alcoholic beverage producers) allocated
about 7 percent of their total advertising expenditures to television in 1950 [18]; by 1980, the proporiion was 80 percent [20], The development of television advertising, along with improvements in ^ansporta- tion, communications, and production, may have reduced the costs of introducing products into nation- wide distribution, thereby increasing the number of nationally distributed products. Widespread distribu- tion often requires mass production in multiple plants and the development of large marketing organiza- tions within firms, with personnel oriented toward problems of retail distribution, new product introduc- tion, and advertising rather than production. As a result, those firms which could initially develop a na- tionwide distribution network for a particular food product often found that network to be adaptable to the advertising, retail distribution, inventory control, and transportation of other food produce enterifig na- tionwide distribution.
Diversification into Otiier Manufaetaring industries
Diversification into other manufacturing industries is mostly restricted to the largest food manufacturers. Census data show that those food firms ranked 201-500 in food shipments were diversified to some extent, but at least 92 percent of those smaller firms had no nonfood manufacturing activity. That pattern also generally holds among the 81 firms in ranks 101-200 who were primarily active in food; at least 82 percent had no nonfood manufacturing activity in 1977. Therefore, this discussion is largely liniited to activities of the largest food manufacturers and some conglomerate entrants with interests in food.
Principal Directions of Diversification ^Tw<i- Digit Groups. Table 6 describes the 1975 activities of the 200 largest food manufacturers in manufactur- ing industries outside of food. Because a number of leading food manufacturers have diversified into food industries from other nonfood industries, totals are described both for firms whose primary activity is food manufacturing or processing and those whose pri- mary activity is the manufacture of nonfood items. Note that the 200 largest food manufacturers had ap- proximately $51 billion in estimated shipments in nonfood manufacturing activities, or 18 percent of their total shipments.
14

Product Dlvenificatioii Trends in U.S. Food Manafaetnring
Table 6«* Distribution off aianvffactaring sUpaMimts outside off ffood and tobacco, l>y the 200 kurgest food uianufacturers, 1975
SIC number
All firms' Primarily food Primarily nonfood Title value of firms' value firms' value of
s hipments of shipments shipments
Number Mttlion dollars Number Maiion
dollars Number Million dollars
22 Textiles 15 1,117 9 347 6 770 23 Apparel 18 1,686 13 996 5 690 24 Lumber and wood 8 314 8 314 0 0 25 Furniture 9 407 7 372 2 35 26 Paper 23 6,958 18 2.039 5 4,919 27 Printing and publishing 13 717 7 163 6 554 28 Chemicals 59 19,004 45 6,933 14 12,071 29 Petroleum 0 0 0 0 0 0 30 Plastics and rubber 30 1,707 20 1,362 10 345 31 Leather 9 545 7 455 2 90 32 Stone, clay^ and glass 14 683 7 189 7 494 33 Primary metals 13 3,674 6 412 7 3,262 34 Fabricated metals 31 3.469 17 636 14 2.833 35 Machinery, except electrical 29 1,676 19 557 10 1.119 36 Electrical machinery 17 6.283 10 511 7 5.772 37 Transportation equipment 12 1,310 5 234 7 1.076 38 Instruments 15 960 6 105 9 855 39 Miscellaneous 22 1,221 16 1,007 6 214
All nonfood, nontobacco 92 51,731 72 15,632 20 35,099
Source: Author's calculations, based on data developed for Connor and Mather {8\,
The major direction of investment by food firms clear- ly is toward chemical manufacturing, SIC 28. Of the 72 firms who diversified from food manufacturing into other manufacturing industries, 45 were active in the manufacture of chemicals; chemicals accounted for 44 percent of the value of nonfood manufacturing shipments of those firms (table 6). Other product groups which attract large numbers of food firms in* elude paper (18 firms), plastics (20)vfabricated metals (17), and machinery (19). Inspection of un- published data revealed that most of the companies in these four groups were in activities vertically related to food manufacturing^ specifically packaging and food-processing machinery.
Now, consider the two right-hand columns of table 6. These give a picture of the spread of activities of con- glomerate firms who have diversified into food, mingled with the activity of other less diversified firms who are engaged in, say, food and another in* dustry. Most of the latter produce chemicals. A num- ber of firms in the chemical group have long had substantial food interests. The chemical firms also had large sales in instruments (SIC 38) primarily in the manufacture of health care equipment. The en- tries into the metal, machinery, equipment, and pa- per groups represent the interests of conglomerate in- dustrial firms like Gulf & Western, ITT, IC Industries, and LTV.
Some food firms have entered the apparel and mis- cellaneous product groups, including games and sporting goods. These apparently represent decisions by consumer product food firms to expand into other consumer products for which, given demographic trends, demand should grow rapidly through the re- mainder of this century.
The Link Between Food and Chemicals. Among firms engaged primarily in the manufacture of food, 44 percent of their nonfood shipments are chemicals. Table 7 shows shipments in each three-digit industry class within the chemicals group for firms whose pri- mary interest is the manufacture of food, for those primarily engaged in producing chemicals, and for conglomerates.
15

James M. NacDoñaId
Table 7*Di8tribtttfon of shipniento In chetnleal nianaffaçtariag (SIC 28) by firms in the top 200 In U.S. food and ttiliMco^aleêf 1975
Types of firms All Food Conglomerate Chemicals
Number
Firms 59 45 7 7
Million doffars
Shipments 19.004 6.933 2.056 10.015
Distribution of shipments across three-digit industries within SIC 28: Percent
Inorganic chemicals 4.0 2.2 14.2 3.1 Plastics and resins 9.8 18.2 14.3 3.1 Pharmaceuticals 19.5 3.4 16.3 31.3 Toiletries 47.3 56.0 13.2 48.3 Paints 2.6 1,1 .2 4.1 Organic chemicals 4.2 4.4 14.9 1.9 Agricultural chemicals 9.3 9.8 21.4 6.5 Miscellaneous 3.3 4.8 6.0 1.6
Percentages may not add to 100 because of rounding. Food s primary activity is food manufacturing. Chemicals s primary activity is chemicals manufacturing. Conglomerates s primary manufacturing activity is neither food nor chemicals. Source: Author^s calculation, based on data developed for [8].
Among the 45 firms principally active in food manufacturing, toiletries account for more than half of their chemical shipments. Other prominent direc- tions are plastics and resins (282) and agricultural chemicals (287). Investment in the former class chief- ly reflects decisions made some years ago by major food manufacturers such as Borden and National Distillers to expand into industrial chemicals, while the latter class is often handled by major agribusiness cooperatives and corporations who have diversified widely across agricultural input and processing oper- ations. These firms typically have experience In mar- keting producer goods and skill in the processing, by chemical and biological means, of agricultural raw materials. Finally, the conglomerate firms have their shipments rather evenly spread across chemicals.
Among the firms which primarily produce chemicals, 80 percent of their chemical shipments are toiletries and pharmaceuticals; firms in these specific areas are clearly far more likely to enter food industries than are other chemical firms.
One clear conclusion emerges. Toiletries obviously
represent a major source and direction of diversifica- tion with regard to food manufacturing. Such prod- ucts are sold through grocery outlets, are nationally distributed, and often are heavily advertised. That is, they bear strong similarities in marketing characteris- tics to branded food products. Marketing similarities, combined with profit opportunities, are potentially key sources of the observed links between food and chemical industries.
Diversiflcatioii Outside of Manttfactaring
There are important links between food manufactur- ing and several industries outside of the manufactur- ing sector and two categories of diversification based on those links. First, several firms fi'om nonmanufac- turing industries, principally food retailers, have im- portant food manufacturing activities; that^s, firms engaged in retailing have diversified Into food manu- facturing. Second, many firms originally in food manu- facturing have directed a large amount of diversifica- tion into a limited number of nonmanufacturing in- dustries. When I speak of the largest food manufac- turers (for example, the 200 or the 500 largest) I
16

Product Diversification Trends in U.S. Food Manufacturing
commingle these two categories (since some retailers are also major manufacturers). In what follows, I distinguish diversification into food manufacturing from that flowing in the opposite direction.
In 1977, employment outside of manufacturing ac- counted for 28 percent of the total employment of all companies principally in food manufacturing, accord- ing to the Census Bureau's Enterprise Statistics [29]. These firms clearly did not distribute their invest- ments at random; 52 percent of their nonmanufactur- ing employment was in wholesale or retail trade and evenly divided (26 percent each) between those two. Employment was, in turn, concentrated in specific areas within those sectors, udth 60 percent of whole- sale employment gathered within food wholesaling and 40 percent of retail employment assigned to eat- ing and drinking places.
Retailing Investments. The industry comprised of eating and drinking establishments grew rapidly dur- ing the seventies because of rising incomes and mobility, increases in female labor force participa- tion, and the rapid increase in households. The first two factors caused the time spent in home food prep- aration to become more expensive. Rising time costs, combined with rising incomes and demographic trends, have led to growing demand for convenient eating and subsequent rapid industry growth. These market changes created opportunities for firms with experience in the development and introduction of new food products, in food transportation and stor- age, and in the development of financial controls for multi-establishment enterprises, areas in which food manufacturers possessed substantial existing organi- zations. Of the 500 largest food manufacturers, 58 had chains of eating places in 1977, up from 25 in 1967. During 1967-77, food manufacturer employ- ment in the industry expanded almost fivefold, and the number of establishments grew sixfold. After ex- panding in this industry, some food manufacturers have lately entered other specialty retailing areas. For example, Quaker Oats has acquired and expanded chains of retail eyeglass, hardware, and yarn stores, and General Host has acquired retail tree nurseries and the Hickory Farms chain of specialty foodstores.
Food retailing also has important links with food . manufacturing. Although some firms have diversified from food manufacturing into convenience stores and
specialty foodstores, none have so far diversified into supermarkets. However, a number of large grocery chains, such as Safeway and Kroger, operate signifi- cant food manufacturing facilities. Thirty-four retail grocery chains processed food in 1977 and operated over 300 food manufacturing establishments. Sixteen chains were among the 500 largest food manufac- turers. Food retailers manufacture only a limited number of products; 60 percent of their employees are engaged in the manufacture of baked goods and fluid milk [29], In addition to products that they manufacture, the chains also market products that carry their own label but are manufactured by other firms. There is no evidence that grocery chains have expanded their food manufacturing operations in re- cent years.
Food Wliolesaling. A food manufacturer may oper- ate two types of wholesaling establishments. The first sells only the manufacturer's own products and is called a manufacturer's sales branch or office. The other type is like any other merchant wholesaling establishment in that it purchases, for resale, the products of many manufacturers. Both types are in- cluded in the Census of Wholesale Trade [31,32,33],
Since manufacturer's sales offices and branches are exclusively concerned with the products of the man- ufacturer, expansion into wholesaling via sales offices and branches is a case of pure vertical integration and an extension of the manufacturer's marketing ef- fort for its own products. Most manufacturer activity in wholesaling is of this sort, since sales offices and branches account for 78 percent of food wholesaling employment of firms primarily in manufacturing. A manufacturer that operates merchant wholesale es- tablishments (22 percent of manufacturer employ- ment in food wholesaling) may distribute the products of several manufacturers, and is likely to view expan- sion into wholesaling as diversification into a new area not necessarily tied to the marketing of its own products.
Wholesalers may diversify into manufacturing, but only three wholesalers, with 205 wholesaling establishments (less than 5 percent of those owned by the 500 largest), appear among the 500 largest food manufacturers.
Retail food chains also own both wholesaling and manufacturing establishments. However, the whole-
17

Jflniuïs M« MftcDanádd
saling establishments of food retailers appear in the Census of Wholesale Trade only if more than 50 per- cent of their shipments are sales to other firms [31], The 16 food retailers among the 500 largest food manufacturers of 1977 operated only 63 food whole- saling establishments so defined, less than 2 percent of all food wholesaling establishments owned by the 500 largest food manufacturers. Consequently, whole- saling data for the 500 largest food manufacturers consist almost entirely of diversification by firms primarily active in manufacturing (table 8).
Firms that are major food manufacturers account for 19 percent of total employment in food wholesaling and 24 percent of sales. Their relative importance varies across four-digit food wholesaling categories, reaching a maximum (42 percent of sales) in the gro- ceries and related products category (SIC 5149), where half of the food wholesaling employment of the 500 largest is located. That category consists of prod- ucts such as coffee, tea, baked goods, canned prod- ucts, flour, pet foods, breakfast cereals, soft drinks, shortenings, and cooking oils. Roughly one-half of the 500 largest food manufacturers maintain some facilities in food wholesaling, and most of this whole-
saling activity reflects operations by firms that are primarily food manufacturers, since 90 percent of all the establishments listed in table 8 and 96 percent of those in SIC 5149 are owned by firms whose primary industry is in food manufacturing.
The likelihood of diversification into wholesaling in- creases with firm size. The 20 largest food manufac- turers, for example, have 25 percent of the total value of food shipments of the 500 largest manufac- turers, but 37 percent of the total value of food wholesaling sales, largely through the operation of sales branches and offices. Seventy-six of the largest 100 and 50 of the next largest 100 have food whole- saling activities. However, food wholesaling is not ex* clusively the interest of the largest firms; smaller firms in the largest 500 have a 40- to 45-percent like- lihood of operating a wholesaling establishment, and small firms that diversify are most likely to enter either wholesaling or closely related food processing industries.
According to the Bureau of the Census, food man- ufacturer participation in food wholesaling has in- creased over time, from 187 of the 500 largest man-
Table 8—1977 food wholesaling activities by the 500 largest food manufacturers
SIC Kind of business
Firms 1 Establishments Emplo] TotaP
/ment number Total» Manufacturing Total* MMW* MSB3 MSB»
Number
514 Groceries 256 241 4.289 740 3.281 115,283 89.772 5140 nsk« 56 56 176 0 176 6,053 n.a. 5141 General line 22 18 82 58 0 6.578 0 5142 Frozen 29 27 243 34 44 3.836 n.a. 5143 Dairy 46 42 635 152 440 14.563 n.a. 5144 Poultry 26 25 92 39 50 2.843 n.a. 5145 Confectionary 28 27 250 81 167 7,088 n.a. 5146 Fish 4 4 7 6 1 n.a. n.a. 5147 Meat 41 39 432 87 343 15,647 n.a. 5148 Fresh fruit and vegetables 15 10 80 66 1 n.a. n.a. 5149 Not elsewhere classified 167 164 2,292 217 2,059 57.594 51.708
n.a. s not available. ^Thc columns headed "total" include some establishments of wholesalers diversified into manufacturing (205 establishments in 514, of
which 165 were in SIC 5142 and 23 were in SIC 5141) and 63 establishments of retailers with operations in manufacturing and wholesaling. ^Manufacturer-owned merchant wholesalers (MMW) handle the products of the owner and of other manufacturers. ^Manufacturers' sales branches and offices (MSB) handle only the products of the owner. *rhe "nsk" category (SIC 5140) consists of central administrative offices which oversee the operations of groups of manufacturers' sales
branches and offices. They are assigned to wholesaling in the Enterprise Statistics, but not in the Census of Wholesale Trade,
Source: [26],
18
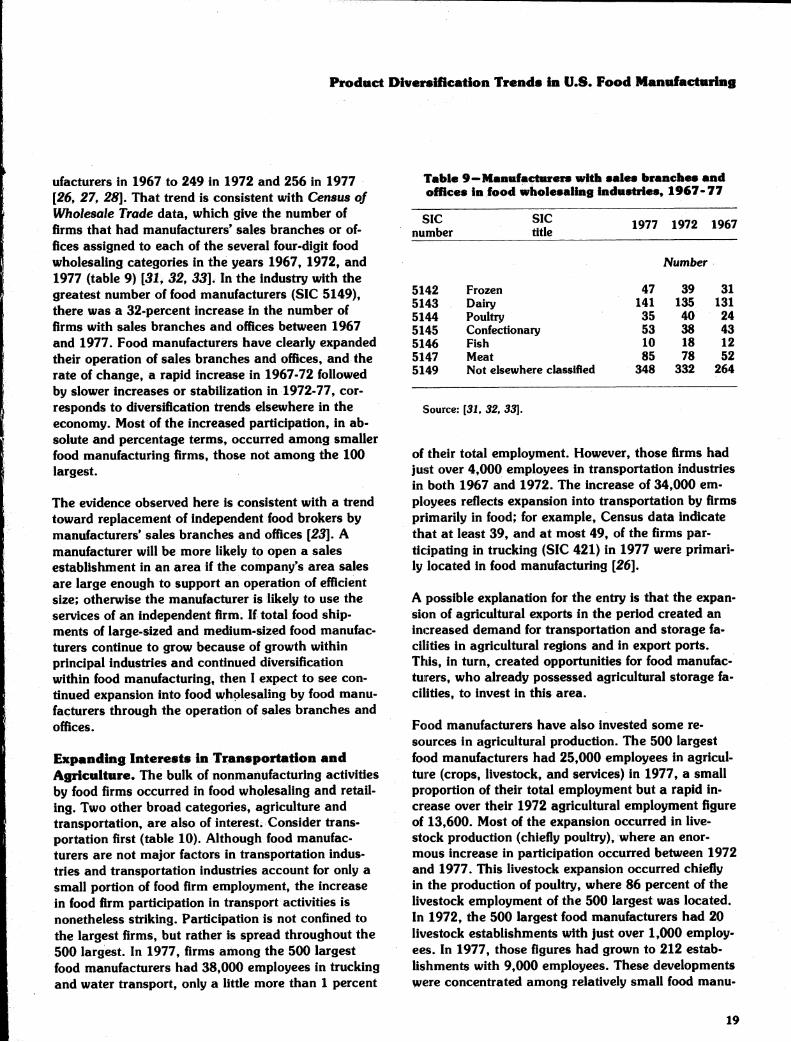
Product Diversification Trends in U.S. Food Mannfactiuring
ufacturers in 1967 to 249 in 1972 and 256 in 1977 [26, 27, 2S1. That trend is consistent with Census of V^Hiolesale Trade data, which give the number of firms that had manufacturers' sales branches or of- fices assigned to each of the several four-digit food wholesaling categories in the years 1967, 1972, and 1977 (table 9) [3h 32, 33]. In the industry with the greatest number of food manufacturers (SIC 5149), there was a 32-percent increase in the number of firms with sales branches and offices between 1967 and 1977. Food manufacturers have clearly expanded their operation of sales branches and offices, and the rate of change, a rapid increase in 1967-72 followed by slower increases or stabilization in 1972-77, cor- responds to diversification trends elsewhere in the economy. Most of the increased participation, in ab- solute and percentage terms, occurred among smaller food manufacturing firms, those not among the 100 largest.
The evidence observed here is consistent with a trend toward replacement of independent food brokers by manufacturers' sales branches and offices [23], A manufacturer will be more likely to open a sales establishment in an area if the company's area sales are large enough to support an operation of efficient size; otherwise the manufacturer is likely to use the services of an independent firm. If total food ship- ments of large-sized and medium-sized food manufac- turers continue to grow because of growth within principal industries and continued diversification within food manufacturing, then I expect to see con- tinued expansion into food wholesaling by food manu- facturers through the operation of sales branches and offices.
EsKpanding Interests in Transportation and Agriculture. The bulk of nonmanufacturing activities by food firms occurred in food wholesaling and retail- ing. Two other broad categories, agriculture and transportation, are also of interest. Consider trans- portation first (table 10). Although food manufac- turers are not major factors in transportation indus- tries and transportation industries account for only a small portion of food firm employment, the increase in food firm participation in transport activities is nonetheless striking. Participation is not confined to the largest firms, but rather Is spread throughout the 500 largest. In 1977, firms among the 500 largest food manufacturers had 38,000 employees in trucking and water transport, only a little more than 1 percent
Table 9—Manufacturers with sales branches and oißces In food wholesaling Industries, 1967-77
SIC number
SIC title
1977 1972 1967
Number
5142 Frozen 47 39 31 5143 Dairy 141 135 131 5144 Poultry 35 40 24 5145 Confectionary 53 38 43 5146 Fish 10 18 12 5147 Meat 85 78 52 5149 Not elsewhere classified 348 332 264
Source: [31, 32, 33].
of their total employment. However, those firms had just over 4,000 employees in transportation industries in both 1967 and 1972. The increase of 34,000 em- ployees reflects expansion into transportation by firms primarily in food; for example. Census data indicate that at least 39, and at most 49, of the firms par- ticipating in trucking (SIC 421) in 1977 were primari- ly located in food manufacturing [26].
A possible explanation for the entry is that the expan- sion of agricultural exports in the period created an increased demand for transportation and storage fa- cilities in agricultural regions and in export ports. This, in turn, created opportunities for food manufac- turers, who already possessed agricultural storage fa- cilities, to invest in this area.
Food manufacturers have also invested some re- sources in agricultural production. The 500 largest food manufacturers had 25,000 employees in agricul- ture (crops, livestock, and services) in 1977, a small proportion of their total employment but a rapid in- crease over their 1972 agricultural employment figure of 13,600. Most of the expansion occurred in live- stock production (chiefly poultry), where an enor- mous increase in participation occurred between 1972 and 1977. This livestock expansion occurred chiefly in the production of poultry, where 86 percent of the livestock employment of the 500 largest was located. In 1972, the 500 largest food manufacturers had 20 livestock establishments with just over 1,000 employ- ees. In 1977, those figures had grown to 212 estab- lishments with 9,000 employees. These developments were concentrated among relatively small food manu-
19

M,MaeDoôàld
TiMe lO'^Farticipatioii of the SOI^^k^^ food wattinfacttit^» i^sele^ Indiistries
SIC SICtitle 1967 1972 1977 number Firms Est, Firms Est. Firms Est.
Number
42 trucking and warehousing 14 133 27 125 76 575 421 Trucking 3 7 3 11 52 418 4212 Local trucking 3 4 1 1 26 39 4213 Long distance trucking 0 0 0 0 28 361 4214 Storage 1 3 2 10 6 18 422 Warehousing 14 126 25 114 35 154 4221 Farm product warehousing 5 81 10 47 11 59 4222 Refrigerated warehousing 7 38 ' ^ 9 < 48 20 73 4225 General warehousing 2 5 6 16 6 18 4226 Specialized warehousing 1 1 2 2 4 4 44 Water transport 0 0 6 11 22 146 441 Deep sea, foreign 0 0 0 0 3 13 442 Deep sea, domestic 0 0 1 1 4 55 444 Rivers and canals 0 0 0 0 4 14 445 Local water 0 0 0 0 5 10 446 Services, water 0 0 13 49 16 54
Est. s Establishments Source: 126,27,28].
facturers; and probably reflect the growth of in- tegrated processors into the largest 500, rather than extensive new diversification by already large firms.
Trends in Diversification, 1950->77
Since 1950, the incidence, extent, and directions of product diversification among food manufacturers have changed dramatically. Census and EIS data show the timing and magnitude of the change [S^ 26, 27, 28, 29, 30]. The principal findings of ^s^s^tion are the following:
• Measurements of food manufacturer diver-^ sification increased between 1950 and 1972 by magnitudes ranging around 100 percent. The increase reflects a spread of the inci- dence of diversification and an increase in its extent and was only slightly influenced by the entry of conglomerate firms.
• Average levels of diversification among food firms of all size classes stabilized between 1972 and 1977, after showing persistent in- creases since 1919. This development paral- lels a similar stabilization in the rest of manufacturing.
• Although average levels of diversification in- creased, there were also many divestitures during the period; by 1975, food manufac- turers had ceased production in 25 percent of their 1950 secondary industries.
• During the sixties, many nonfood conglom- erates entered the food industries, contribut- ing to the increase in diversification in food and tobacco manufacturing. Since 1975, there has been a noticeable shift towards the di- vestiture of food businesses by nonfood con- glomerates, and a reduced presence in food industries by conglomerates.
• The extent and incidence of diversification is positively associated with firm size. In gen- eral, only the largest food manufacturers diversify into industries manufacturing prod- ucts other than food. However, relatively small food firms have diversified into related food manufacturing and wholesaling indus- tries, and the incidence and extent of their diversity increased, along with that of large firms, during the 1967-72 period. Diversifica- tion among smaller firms> then, remained
20

Prodttcrt Diversification Trends in U.S. Food Naniifactaring
stable during the period 1972-77, consistent with the pattern among larger firms.
Most leading firms were diversified in 1950, but typically were active in one or a few ma- jor activities and a relatively large number of minor activities. Only the largest food manu^ facturers were diversified into industries other than the food manufacturing industries in 1950.
A few marketing-oriented diversified firms ap- pear by 1950, but most diversification was based on production similarities among industries.
In 1950, the only major diversification into food manufacturing by firms from other man- ufacturing groups originated with firms in chemical industries, who converted agricul- tural raw materials into food and chemicals. In short, there was little evidence of con- glomerate activity.
Levels of Diversification, 1950
Estimated measures of average levels of diversifica- tion, based on FTC data, for firms of different sizes appear in tables 11 and 12. I first used a count of the industries of each firm to provide means and medians, since they may diverge (table 11). I also provided separate counts for diversification within food manu- facturing (Np) and across all manufacturing (Nj).
In 1950, larger firms were more diversified. Mean Nf for the largest 50 firms is 10.32, while that for the next largest 50 is 4.84. Since mean Nx is not much larger than mean Np, diversification took place primarily within food manufacturing. However, a still substantial amount of diversification took place within other industries and the share of N directed outside of food rises with firm size.
Industry counts tell only part of the story of diversi- fication, since they do not tell us how output was dis- tributed among a firm's activities. For a more com- prehensive measure, I used the C indices in table 12.
Median Cj among the 25 largest food firms was 2.91; that is, the median firm in that group was slightly
less diversified than a firm with sales evenly divided among three industries. The mean value of Cj was slightly higher.
Several comparisons are of interest. First, compare these numbers' equivalents with the counts of table 11; that is, compare Cj to Nj and C^ to the dif- ference between Nj and Np. Recall that the larger is C relative to N, the more evenly distributed is firm output among industries. Values of Cj are always less than half the values of Nf, and they fall to less than a third in the largest size group, a pattern that sug- gests that food firms concentrated their output in
Table 11—Number of Industries off leading firms, 1950
Measure Size class of firms, ranked by food
shipments 1-25 26-50 51-100
Number
Median NT 9.00 6.00 4.00 Mean Nt 13.16 7.48 4.84 Median N^ 5.00 5.00 2.00 Median Np 8.92 5.36 3.46
Nj = number of manufacturing Industries participated in. Np s number of food manufacturing industries.
Source: Author's calculations, based on [35].
Table 12—Comprehensive Indices, 1950
Measure Size class of firms, ranked by food
shipments 1-25 26-50 51-100
Median Cr Mean Cr Median CA MeanC/v Median Cp Mean Cp
2.91 3.48 1.07 1.20 2.65 3.04
Number
2.42 2.86 1.00 1.18 2.31 2.52
1.75 2.11 1.00 1.17 1.48 1.88
CT = comprehensive diversification index across all four-digit manufacturing industries;
CA s comprehensive diversification index across all two-digit manufacturing groups;
Cp s comprehensive diversification index across all four-digit food manufacturing industries.
Source: Author's calculations, based on [35].
21

James M. MacDoñáld
primary activities in 1S150 as iñ 1975, and that most secandaiv interests were small.
Next, notice the small values of mean and median NEA, evidence that food firms concentrated most of their manufacturing activities entirely within food in- dustries, and that such nonfood interests as they did have were quite small. Indeed, 43 food manufacturers in ranks 26-100 manufactured nothing other than food. Diversified food manufacturers concentrated on food, and their secondary activities were generally quite small.
Diversification itself was not a universal phenomenon. In 1950, 16 of the largest 100 food manufacturers were actiye in only one manufacturing industry, and 5 others were active in only one food industry.
Marketing as a Basis for Diversification
Marketing was a major source of diversification in 1975. Two of the largest food processors of 1950, General Foods and Standard Brands, were formed through multiple mergers. The rationale for the crea- tion of such highly diversified firms was to achieve scale economies in marketing; the combined firms' marketing organizations were clearly envisioned as sources of cost advantages to diversification [6]. A small number of other firms also produced a diver- sified line of food products apparently related by mar^ keting similarities. For example. Best Foods grew from vegetable oil refining, with products functionally related to that process, into a firm that also mar- keted a line of canned food products, breakfast cereals, and flour. The Beech-Nut Packing Co. manu- factured a wide variety of food products from 1890 to 1950 (canned foods, hams, coffee, candy, and pre- serves, among others), largely under the Beech-Nut brand name, and apparently found that brand name, and its sale force, to be effective in the marketing of a diversified line. Finally, Kraft, Quaker Oats, General Mills, Nabisco, Fairmont Foods, and T. J. Upton all had some sizable interests (more than 10 percent of sales) in food products that were related to their primary products only through marketing similarities.
This evidence indicates that marketing was a source of diversification in food manufacturing by 1950, but the influence was limited. In 1950, large dairy firms that later diversified widely across food industries
were active only in dairy industries. Large canned goods producers did not stray from canning indus- tries. Vegetable oil firms were active in several oil in- dustries and in byproduct treatment, but not in other industries. Beverage, baking, milling, and sugar firms were largely undiversifled. Meat packers had diver- sified into a large number of activities, but almost all were associated with byproduct processing. In 1950, the preponderance of diversification was directed at industries with production processes functionally related to those of the primary industry, and mar- keting-based diversification was carried out by a limited number of firms.
Industrial Directions of 1950 Nonfood Diversificaton
Food firms clustered in a small number of nonfood activities (table 13). Twice as many firms were active in chemical manufacturing as in any other group.
Tableól3--Maniifáctttrlii9 In nonfooil Industries b^r leading food inMuiactnrers^ 19^
SIC number Title Firms Value of
shipments
Number M»Hon dottturs
22 Textiles 2 7.5 23 Apparel 6 6.4 24 Lumber and wood 12 59.8 25 Furniture 0 0 26 Paper 12 72.6 27 Printing and publishing 5 8.3 28 Chemicals 24 992.7 29 Petroleum 2 2.0
30 Rubber and plastics 0 0 31 Leather 2 115.0 32 Stone, clay, and glass 12 4.7 33 Primary metals 11 5.5 34 Fabricated metals 10 45.9 35 Machinery, except electrical 11 11.1 36 Electric machinery 1 6.3 37 Transportation equipment 3 .4 38 Instruments 1 1.9 39 Miscellaneous 2 20.3
Total 57V 1.360.4
^The number of food firms with nonfood interests. Not equal to sum of column since some firms invested in more than one group.
Source: Author's calculations, based on [35],
22

Product Diversification Trends in U.S. Food Manufacturing
Two firms entered here, Procter and Gamble and Lever Bro$.» were major soap manufacturers who had long held large interests in vegetable oil processing. Exclusion of their chemical shipments ($550 million) still leaves the chemical industries with more than half of the total nonfood value of shipments of food firms. Of the remaining 22 firms producing chemi- cals, 5 were meatpackers engaged in byproduct proc- essing, 6 were vegetable oil processors also treating byproducts, and 6 were distillers producing industrial alcohol. In 1950, clearly, most investments in chemi- cals appear to have been functionally related to primary activities.
Four other industries, lumber and wood, paper prod- ucts, fabricated metals, and machinery, each had at least 10 firms. Vertical integration explains these linkages. The first three reflect packaging operations with wood, paper, and metal containers, while the last includes the manufacture of food processing equipment.
Two other groups merit comment because of the size of their shipments. The large number of shipments of leather products (SIC 31) results from byproduct processing by Armour and Swift. In miscellaneous manufacturing, the sporting goods subsidiary of the Wilson meatpacking firm, with $20 million in ship- ments, was the only sizable conglomerate investment in the data.
In 1950, the manufacture of nonfood products was a minor activity for food firms, and almost all of what was carried on was functionally related to the pri- mary industry through processing of that industry's byproducts or the manufacture of products auxiliary to the primary.
Diversification Outside of Manufacturing
Evidence of diversification into industries other than manufacturing can be obtained from Moody's, which lists the existence of activities but not their size [17]. The 50 largest food manufacturers of 1950 had 76 nonmanufacturing activities, an average of 1.5 apiece. Table 11 indicates that the same firms had 357 food manufacturing industries and 159 nonfood manufacturing industries, an average of 3.2 manufac- turing activities in nonfood industries. Size is closely related to diversification away from manufacturing, and nonmanufacturing was rare among firms below
the top 50. Large firms involved in fruit, vegetable, and fish harvesting and processing invested in land and ships in order to provide stable supplies of raw materials. Some major grain millers operated wide- spread grain distribution operations and also retail feed stores, apparently the only retail operation of food processors in 1950. A number of firms whose operations were in rural or undeveloped regions (such as sugar and fruit processors) operated railroads, ir- rigation systems, communications networks, shipping lines, and landholdings, while other large food pro- cessors operated distribution networks. Several firms also owned phosphate mines, but as these firms also had large volumes of fertilizer products, I assume that the mines provided feedstock for the fertilizer operations.
Clianges in Diversification Since 1950
How did diversification change between 1950 and 1975? First, compare values of C^j^ in 1975 (table 3), with values of Cj in 1950. (Remember that the 1950 data exclude nonmanufacturing, so we must compare it with the 1975 manufacturing measure, Cjj^.) In- creases of approximately 50 percent are recorded for firms in ranks 51-100, 89 percent for ranks 26-50, and 120 percent for ranks 1-25, By excluding non- manufacturing, a major direction of food manufactur- er diversification, I probably understate the actual in- crease. However, in 1950, few food firms smaller than the 50 largest had any activity outside of manufactur- ing [17]; for those firms, therefore, 1950 Cj^ should be a very close approximation to Cj. If we compare 1975 Cj with 1950 CT^, we find that increases are larger across all size categories and, on average, levels of diversification in food manufacturing, mea- sured by Cj, doubled between 1950 and 1975.
Briefly consider several other observations. First, Cp and C^ both display large increases; food firms lessened their dependence on food manufacturing while also diversifying across industries within food. Second, the incidence of diversification among food firms also increased. Of the largest 100 firms, 8 were active in only 1 manufacturing industry in 1975, com- pared with 16 in 1950. Ten were active in only one food industry in 1975, whereas 21 of the 1950 100 largest specialized in a single food industry. That is, the increase in average measures of diversification reflected increases in incidence as well as in extent. Finally, trends in food manufacturing are similar to
23

James M. MacDoiiäld
those elsewhere in manufacturing. In an analysis of 1950-75^ trends in dh;ersificationaniong the 200 largest fiirms in all maniifaicturihg, Scherer found the same magnitude of change as that presented here [221.
The evidence presented thus far suggests large in- creases in measurements of food manufacturer diver- sification, both within food and outside of it, between 1950 and 1975. Census Special Tabulations provide fur- ther evidence. The first special tabulation prepared for the National Commission on Food Marketing (NCFM) and covering 1954, 1958, and 1963, did not include tobacco or alcoholic beverage firms [18]. Those firms were also excluded in 1967-77 tabulations in order to maintain comparability [26, 27, 28]. Since the six tabulations cover the Census of Manufactures during 1954-77, they will provide information on the timing of changes in diversification that is missing from a simple comparison of 1950 with 1975. In short, this set should complement the others.
The NCFM study, covering 1954-63, broke the 100 largest food manufacturers into three groups, ranks 1-20, 21-50, and 51-100, and was restricted to manu- facturing. I followed the same convention with the later data. In table 14, mean values of Njj^^ and Np are presented for the three size groups for the 6 years of the analysis. In the NCFM study, values of Njj^i for 1954-63 were presented only for the top 50 firms and were not broken down further.
There is fairly close agreement between the Census data and the corresponding EIS data (table 2). For example, 1975 Nj^ (EIS data) for the largest 50 firms was 15.54, while 1977 Nj^ (Census data) for the largest 50 was 16.79, 8 percent greater. EIS claims to record all plants with more than 20 em- ployees and is therefore likely to miss some minor ac- tivities if a firm has, for example, a small printing plant. EIS is also more likely to miss some subsid- iaries if the ownership links are not obvious. In general, however, the 1975 EIS data are reasonably close to the 1972-77 Census data.
Surprises occur when comparisons are made^etween the 1954 Census data and the 1950 FTC data, since averages based on the Census data are less than those based on FTC data. However, the discrepancy^ is explicable. The FTC data cover product class ship- ments, and therefore include secondary plant output;
but the Census statistics are derived from four-digit establishment data (as are the EIS data) and assign all secpiidafy plant output to the planfs primary prod- uct. The 1977 indices^re higher when recomputed using Census product class data (also included in the Special Tabulations); for example, mean 1977 Np in ranks 1-20 rises from 9.5, using establishment data, to 12.8 using product class data. As a result, the EIS-FTC data understate the 1950-75 châfïgêln di- versification by a substantial amount when N is used and by less (since secondary plant shipments are very small) when C is used.
Diversification increased considerably fron) 1954 to 1977 (table 14), and the increase is greater than the EIS-FTC comparisons. Firms in the ranks 51-100 had increases of about 150 percent each in Njj^ and Np, while firms in the top 50 had increases of 130 percent in Nj^ and 90 percent in Np; diversification increased both within food industries and in nonfood industries.
The time pattern is also interesting for several reasons. Between 1954 and 1963, Np (diversification within food manufacturing) increased by 65 percent for the largest 20 firms and by 69 percent for the next 30 firms, but by only 39 percent for firms 51-100. After 1963 the picture changed considerably. Np in- creased by 86 percent for firms in the smallest size class, compared with 28 percent for firms in ranks 21-50 and 7 percent for the largest firms, as the largest clearly turned their attention to diversification outside of food manufacturing. In later^ars dtrf the period, the relatively small firms diversified widely across food industries.
A Break in the Trend
Between 1972 and 1977, Nj^ and Np increased slightly among firms in ranks 21-50, while essentially no change occurred in other size classes. This is not an isolated phenomenon. Elsewhere, diversification indices for all manufacturing firms showed no change between 1972 and 1977, after recording steady in- creases between 1954 and 1972.***
There are several possible explanations. First, during 1972^77, merger activity (as measured by the ratio of
***In [15], I measured the share of company employment ac- counted for by secondary industries. Thus, each crude measure shows the same stabilization for 1972-77.
24

Product Diversification Trends in Ü.8. Food Manufacturing
Table 14-Levels of food manufacturer diversification, 1954-77
Indices and size classes, ranked by value added in food Year NTM' Npi
1-20 21-50 51-100 1-20 21-50 51-100
Number
1954 6.88» 3.10 5.40 3.20 1.80 1958 8.24 3.97 7.10 3.50 2.08 1963 10.30 5.80 8.90 5.40 2.50 1967 14.10 9.03 5.76 9.20 5.57 3.52 1972 21.15 11.00 8.22 9.95 6.40 4.56 1977 21.30 12.27 8.30 9.50 6.90 4.64
^^TM = mean number of four-digit manufacturing indices. ^Np = mean number of four-digit food manufacturing industries. ^he NCFM study, covering 1954-63, recorded Nj^ for ihe largest 50 food firms and did not break the group down further.
Source: [26, 27, 28],
assets acquired to either investment spending in man- ufacturing or total assets of manufacturing corpora- tions) declined dramatically in relation to similar ac- tivity during earlier years. Diversification is often initiated through acquisitions of other firms; if it becomes more difficult to acquire firms, then mergers and diversification could decline. This is a partial ex- planation because there is no generally accepted ex- planation for the decline in merger activity [24],
Second, during 1972-77 there is some evidence that, in relation to the economy as a whole, the largest firms grew more slowly than they had in previous years (and small firms appeared to grow more rapid- ly), as the sectors of the economy dominated by large firms (such as manufacturing) grew slowly. Size con- strains the diversification that a firm may carry out; stable sizes of large firms could lead to stabilized levels of diversification. Alternatively, declines in mergers and stabilized size structure of firms could result from stabilized levels of diversification.
Finally, the period 1965-70 was the height of an ex- traordinary wave of conglomerate mergers. Many of these mergers may have been ill advised, judging from ilecent divestitures and studies of financial per- formatice, and the recent stabilization in indices of diversification may in part reflect an adjustment to that wave. At best, however, this is also a partial ex- planation, since the evidence indicates that the 1972-77 stabilization occurred among a wide range of firnk sizes and among firms principally active in
food manufacturing and was not in general due to conglomerate activity.
Influence of Conglomerate Entry
Diversification Into food manufacturing by highly diversified firms from outside of the food Industry has become important since 1950. I shall Investigate whether the rise in average levels of diversification largely reflects this entry.
Of the 140 firms in the 1950 FTC listing, 72 were in- dependently owned and active In food manufacturing in 1975, and 63 of these were stiU among the largest 140 in 1975. That is, almost half of the leading largest 140 food firms of 1950 had disappeared by 1975, and most had been acquired In mergers. Let us caU the 72 firms '^the survivors,** leaving 77 entrants to the list of the 140 largest in 1975 (since only 63 of the 72 survivors remained among the 140 largest). These entrants may in turn be divided into three cate- gories. The largest category consists of 47 new food entrants, firms primarily active In food, that were either too small to be on the 1950 list or had yet to be started. The rest are the 30 diversifying entrants, 18 designated as vertical entrants with primary ac- tivities in transportation, wholesaling, or retafllng, and 12 horizontal entrants from other manufacturing industries.
Mean values of the C Indices are recorded for each of the four categories of firms (table 15). First, consider
25
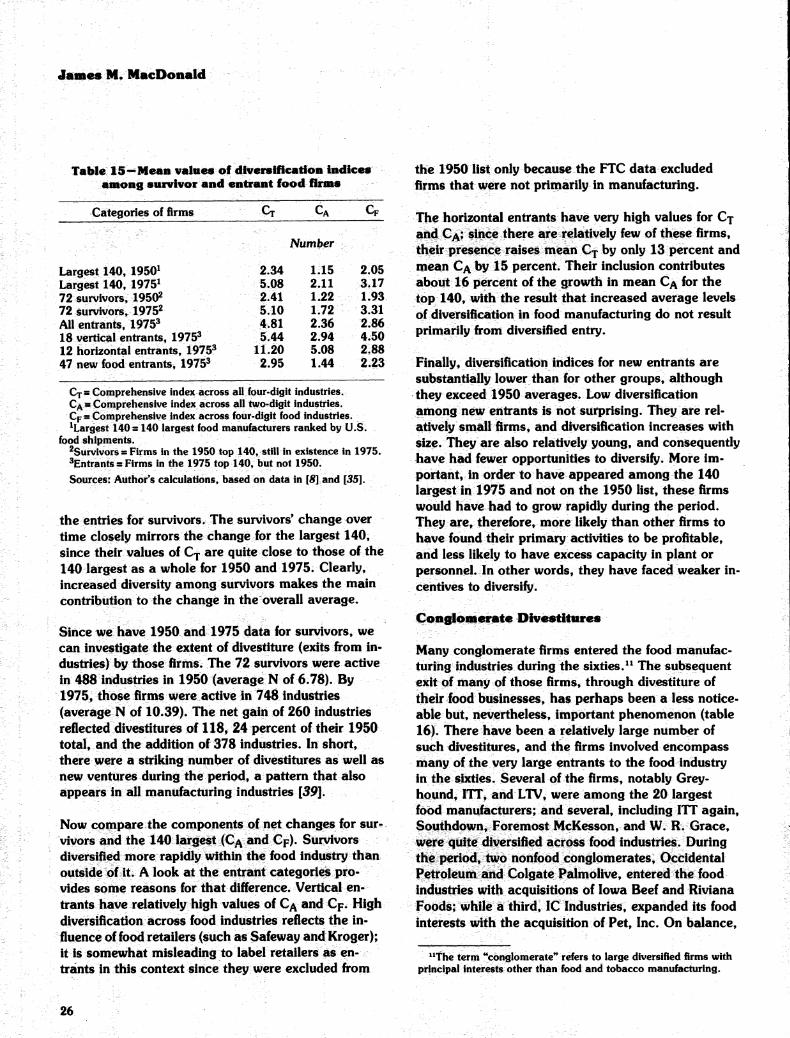
Jmneè M* BtaucDcmald
Table 15—Mean values of diversification Indices among survivor and entrant food ñrms
Categories of firms Cr CA Cp
Number
Largest 140, 1950^ 2.34 1.15 2.05 Largest 140, 1975» 5.08 2.11 3.17 72 survivors, 1950^ 2.41 1.22 1.93 72 survivors, 1975" 5.10 1.72 3.31 All entrants. 1975» 4.81 2.36 2.86 18 vertical entrants, 1975* 5.44 2.94 4.50 12 horizontal entrants , 1975* 11.20 5.08 2.88 47 new food entrants. 1975* 2.95 1.44 2.23
Cjs Comprehensive index across all four-digit industries. CA s Comprehensive index across all two-digit industries. Cp s Comprehensive index across four-digit food industries. ^Largest 140 = 140 largest food manufacturers ranked by U.S.
food shipments. ^Survivors s Firms in the 1950 top 140, still in existence in 1975. entrants s Firms in the 1975 top 140, but not 1950. Sources: Author's calculations, based on data in [8] and [35].
the entries for survivors. The survivors' change over time closely mirrors the change for the largest 140, since their values of Cj are quite close to those of the 140 largest as a whole for 1950 and 1975. Clearly, increased diversity among survivors makes the main contribution to the change in the overall average.
Since we have 1950 and 1975 data for survivors, we can investigate the extent of divestiture (exits from in- dustries) by those firms. The 72 survivors were active in 488 industries in 1950 (average N of 6.78). By 1975, those firms were active in 748 industries (average N of 10.39). The net gain of 260 industries reflected divestitures of 118, 24 percent of their 1950 total, and the addition of 378 industries. In short, there were a striking number of divestitures as well as new ventures during the period, a pattern that also appears in all manufacturing industries [39].
Now compare the components of net changes for sur- vivors and the 140 largest (C^ and Cp). Survivors diversified more rapidly within the food industry than outside of it. A look at the entrant categories pro- vides some reasons for that difference. Vertical en- trants have relatively high values of Cp^ and Cp. High diversification across food industries reflects the in- fluence of food retailers (such as Safeway and Kroger); it is somewhat misleading to label retailers as en- trants in this context since they were excluded from
the 1950 list only because the FTC data excluded firms that were not primarily in manufacturing.
The horizontal entrants have very high values for Cj and C>v; since there are relatively few of these firms, their presence raises mean Cj by only 13 percent and mean CA by 15 percent. Their inclusion contributes about 16 percent of the growth in mean C^ for the top 140, with the result that increased average levels of diversification in food manufacturing do not result primarily from diversified entry.
Finally, diversification indices for new entrants are substantially lower than for other groups, although they exceed 1950 averages. Low diversification among new entrants is not surprising. They are rel- atively small firms, and diversification increases with size. They are also relatively young, and consequently have had fewer opportunities to diversify. More im- portant, in order to have appeared amonig the 140 largest in 1975 and not on the 1950 list, these firms would have had to grow rapidly during the period. They are, therefore, more likely than other firms to have found their primary activities to be profitable, and less likely to have excess capacity in plant or personnel. In other words, they have faced weaker in- centives to diversify.
Conglomerate Divestitures
Many conglomerate firms entered the food manufac- turing industries during the sixties.^^ The subsequent exit of many of those firms, through divestiture of their food businesses, has perhaps been a less notice- able but, nevertheless, important phenomenon (table 16). There have been a relatively large number of such divestitures, and the firms involved encompass many of the very large entrants to the food industry in the sixties. Several of the firms, notably Grey- hound, ITT, and LTV, were among the 20 largest food manufacturers; and several, including ITT again. Southdown, Foremost McKesson, and W. R. Grace, were quite diversified across food industries. During the period, two nonfood conglomerates. Occidental Petroleum and Colgate Palmolive, entered the food industries with acquisitions of Iowa Beef and Riviana Foods; while a third, IC Industries, expanded its food interests with the acquisition of Pet, Inc. On balance.
"The term ^'conglomerate'* refers to large diversified firms with principal interests other than food and tobacco manufacturing.
26

Product Diversification Trends in U.S. Food Manufacturing
Table 16—Food Indvslry divestitures by conglomerate Ifarnis, 197S« 84
Firm Food industry divestitures
Esmarjc Meatpacking, soybean processing Foremost-McKesson Dairy products, pasta General Host Meatpacking, baking, frozen fish Greyhound Meatpacking, prepared meats Gulf SL Western Cigars, candy mr Meatpacking, soft drink bottling.
frozen foods, candy, baking LTV Meatpacking RCA Frozen foods Southdown Soft drinks, wine, sugar, brewing.
candy Spring Mills Frozen foods, fruit and vegetable
canning Squibb Candy Univar Malt, wet com milling Warner-Lambert Baking, candy W.R. Grace Frozen fish, soft drinks, feeds
Source: [18, 36],
however, the evidence shows that the importance of nonfood conglomerates in the food industries has declined in recent years. In addition, several of the largest and most diversified food firms, notably Beatrice Foods, Consolidated Foods, and Nabisco Brands, have divested a large number of their non- food businesses, while at the same time continuing to diversify within the food industry (appendix A).
Small Firm Diversification
Diversification appears to be commonplace among leading food manufacturers. Some evidence concern- ing diversification among smaller firms is provided in the Census Special Tabulations [26, 27, 28\. In addi- tion to the sample discussed earlier, data from a sec* ond sample of food firms was provided for the 500 largest food manufacturers ranked by value added in all food and tobacco industries. This sample differs from the other Census sample in that it is larger (500 firms) and, since it includes tobacco and alcoholic beverage producers, cannot be matched to 1954-63 data. I used this data set to investigate diversification among smaller food firms, those not among the 200 largest of 1977. Data for firms in ranltô 201-500, and primarily active in food, are presented in table 17. These firms typically have between 350 and 1,000 employees. By restricting the sample to firms with primary interests in food, I exclude the influence of several conglomerates who have minor food activities.
Smaller food firms are diversified to some extent, and their mean level of diversification increased rapidly during 1967-72. Notice the values of N^^M» nonman- ufacturing diversification. Mean values olí Np and ^NM account for almost all of Nj and, by implication, diversification by smaller food firms into other manu- facturing groups was almost nonexistent.
Census Special Tabulations also provide aggregate data on specialization ratios (P) among food firms [26, 27, 28]. The specialization ratio in this case is the share of the firm's total value added originating in its primary three-digit SIC industry class, and ratios are presented for several employment size classes. Of the 500 largest food firms, the number with fewer than 2,500 employees changed little be- tween 1967 and 1977; there were 321 in 1977, com- pared with 322 in 1972 and 313 in 1967. Firms in this size range are relatively small and are likely to be primarily involved in food manufacturing. In 1967, 127 of these firms were specialized since all of their value added fell within one industry class. By 1972, only 73 were so specialized, and the number rose slightly to 79 in 1977. Smaller firms also clearly diversified their activities during the peak of the con- glomerate merger wave. Their diversification appears to have stabilized between 1972 and 1977, a pattern similar to behavior in the rest of manufacturing.
The evidence for smaller food manufacturers is unique. We have previously had data only for the largest firms or for industry aggregates whose statistical movements are dominated by large firms [3, 11]. The new data show that the trend toward diversification in the late sixties occurred among relatively small firms, as well as among the Fortune 500, and that
Table 17«-Mean number of Industries, firms primarily active in food manufacturing and among
the 201-500 langst food manufacturers
Year NT NF NNM Firms
1967 1972 1977
2.15 2.73 2.69
Number
1.37 0.71 1.52 1.06 1.49 1.12
269 263 267
N-i- s average number of industries. Np s average number of food industries. I^NM - average number of nonmanufaçturing industries.
Source: [26, 27, 28\.
27

James M. MacDonald
the seventies saw stabilization of diversification among both large and small firms. The increase in diversification activity prior to 1972 was quite widespread, and was not restricted to a few conglom- erates or to the largest firms. Similarly, stabilization after 1972 was also widespread. In accounting for the observed patterns, one should focus on factors that affect a wide spectrum of manufacturing firms, rather than factors specific to particular industries, con- glomerates, or the largest size groupings of firms.
Early Diversiflcation in Food Manufacturins, 1919-»50
Diversification is commonly thought to be a i^cent phenomenon. This is not quite^rue. Prior to 1950, U.S. food firms were diversified, and average levels of diversification among food manufacturers increased steadily in the first half of this century. The principal findings in this section are as follows:
• Leading food firms were diversified in 1919. Most diversification resulted bom production similaHtiesaniong industries. Diversification based upon marketing was quite rare.
• Certain events, such as prohibition, had im- portant effects on the diversificaton of specific groups of firms in the 1919-50 period.
• Average levels of diversification increased continually throughout thé 1919-50 period.
Clim»(^i^irtic8 of 1^^ in 1919
Willard Thorp, who used confidential census informa- tion in a study of market organization in manufactur- ing, provides the basis of the 1919 evidence [25], Thorp proposed eight categories into which the rela- tionship between primary and secondary industries might fail (table 18). According to Thorp's data, 1.6 percent of air food manufacturers in 1919 operated more than one plant and 0.4 percent were diversified (active in itiultipie industries). By contrast, 10.1 per- cent of all food firms in existence in 1977 operated multiple plants and 5.9 percent were diversified.
The multi-industry food firms of 1919 had fairly sim- ple in-oduct structures. A few had primary-secondary links in more than one category^ since the sum of
firms in the eight categories^ (359) exceeds the total number of multi-industry food firms. However, the discrepancy is small; Thorp assigned at least 89 per- cent of diversified firms to a single functional category of diversification.
More than a third of all multi-industiv food firm links were assigned to category (a), joint products, in which the industries share a common raw material. This concentration largely reflects the 101 dairy firms that were assigned to the category, those that pro- duced in at least two dairy product industries (which included butter, cheese, condensed milk, ice cream). Fluid milk was not assigned to manufacturing in 1919, but most of tliese firms probably processed fluid milk as well. Diui^ production in 1919 was quite localized, so that leading dairy firms could diversify geographically across local markets, as welt as func- tionally across different dairy products.
Category (b), byproducts, reflects activities of meat- packers and vegetable oil refiners. Both activities were subject to economies of scale, and both yielded large quantities of byproducts, which were costiy to transport and often had uncertain uses. As a result, further byproduct processing was often carried out by primary product manufacturers; for example, meat- packers entered leather, feed, and chemical indus- tries, and refiners entered meal, feed, and chemicals. Only a few large firms fell into this category because of the large-scale requirements of efficient h^^^uct processing [17],
Table 18—Numbers of flrms and distribution of multi*lndttstry links according to functional relation
between primary and secondary products, food Industries, 1919
Category Firms
All food firms reporting Multi-establishment food firms Multi-industry food firms
(a) Joint products (b) Byproducts (c) Products of like processes (d) Complementary products (e) Auxiliary products (0 Products with like markets (g) Continuing functions (h) Unrelated functions
Number
74,147 1,175
323 123
17 99 29 31 28 24
8
Sources [25].
28
Product Diversification Trends in U.S, Food Mannfacturing
Category (c) covers industries which use similar proc- essing techniques and is largely made up of canning (61) and milling (25) Arms that diversiñed among the several canning and milling industries.
Categories (a) and (c) reflect similarities among in- dustries in raw materials or production methods, and together account for 62 percent of the diverstflcation links across categories. Similarly, categories (b), (d), (e), and (g) are closely related, reflecting vertical linkages among industries. Complementary products (d) refer, for food firms, chiefly to containers. Category (e), auxiliary products, consists largely of printing, vehicle repair, and ice production, while continuing functions (g) are vertically integrated ac- tivities such as production by a baking company in flour milling. These four categories of vertical relatedness account for another 28 percent of the category assignments. Therefore, two broad group- ings, based on production associations between pri- mary and secondary industries, together account for 90 percent of the diversified production relationships that Thorp observed in food manufacturing in 1919. Only 2 percent of the observed primary-secondary linkages were assigned to category (h), unrelated. Conglomerate diversification was clearly quite rare in 1919.
Similarities occur in the marketing of dissimilar prod- ucts with like markets (f), which accounted for 8 per- cent of the total in 1919. In Thorp's view, there was great potential in food manufacturing for diversifica- tion via marketing similarities [25], Food processors could theoretically market other food and consumer products through existing distribution networks. However, in 1919 diversification via marketing was still largely a potential source only since the preponderance of diversification by food manufac- turers was based upon the characteristics of primary production processes, and was directed toward in- dustries that either were vertically related to the primary activity or had production processes that were similar to it.
Two characteristics of Thorp's data restrict compari- sons with later studies. First, he reports evidence for groups of firms within industries, never for specific firms. One cannot, as a result, use his evidence to trace the path of diversification of a specific firm over time. Second, he was not interested in measuring levels of diversification. Rather, Thorp's interest was
in the relationship between secondary and primary activities. In short, he provided an outline of the prin- cipal industrial directions of diversification.
Tiie Trend of Food Manufacturer Diversification» 1919-50
Several major discrete events affected the diversifica- tion decisions of food manufacturers from 1919 to 1950. Some affected specific industries. For example, under a consent decree of 1923, major meatpackers were barred fi'om entering many food industries and forced to divest their holdings in other food, storage, and transportation industries. This action removed the most attractive targets of meatpacker diversifica- tion but did not result in wide-ranging conglomerate activity. The largest firms expanded their activities in the manufacture of chemicals and leather, and Wilson acquired a sporting goods subsidiary, but no other activities in nonfood manufacturing were under- taken. The advent of prohibition induced significant diversification by brewers and distillers. Both groups tried to produce other beverages (soft drinks). The distillers moved into industrial chemicals; the brewers experimented with yeast and malt processing, and ex- panded auxiliary brewery operations (such as vehicle repair and refi'igerated container manufacture) to serve independent markets. Most of the secondary ac- tivities ended with prohibition. Other events, such as the Great Depression and World War I!, influenced the diversification of all food firms. For example, dur- ing the Depression, excess capacity in many plants led firms to experiment with secondary lines in at- tempts to keep the plants operating. Production for World War II had disparate effects on food firm diver- sification. With restraints on consumer spending and an emphasis on long production runs at plants, firms were discouraged from introducing new food products in consumer markets, and they discontinued many depression-era secondary product lines at their plants. However, war production generated many new innovations in chemical and machinery industries, and some of the innovations led to diversification by food firms into those industries.^' These events af- fected some firms more than others and led to both
"For example, Quaker Oats produced the chemical furfural as a byproduct of its milling operations, but had diflßculty in finding ap- plications for it until war-related research foui^d that it could be used in synthetic rubber production, resulting in a major expansion of production. General Mills also initiated a precision machinery division during the war.
29

James M. MacDonald
increases and decreases in diveinMfication. However, tliere was a general increasing (though not accel- erating) trend in diversifteatikmwduring the period.
Evidence on trends in diversification amotig leading food manufacturers was drawn from annual editions otMoody's Industrial Manuat [17]. A measure of di- versification^ the industry count (N), was calculated for four benchmark years: 1919,1929/1939, and 1950 (table 19). The first is the year of Thorp's analysis, while the last corresponds to the year of the FTC data.
In 1919, the 37 food manufacturers in the sample participated in 125 industries, an average of 3.35 each. By 1929, the measure had increased by 35 per- cent for this sample. A few firms experienced declines in diversification; that is, there were divestitures and product abandonments in the period, but on average, diversification clearly increased. Most of the new products appear to have been related to old products. For example, Beatrice expanded from production of cream, fluid milk, and butter, to that of ice, eggs, evaporated milk, and ice cream. California Packing (a forerunner to Del Monte) added fresh pineapple operations to fruit, vegetable, and fish canning, and Ward Foods added milk and candy lines to its baking plants.
The firms added to the sample in 1929 had a higher average N, raising the overall value. The additions included diversified food product firms formed as a result of merger and the two largest meatpackers (Swift and Armour), for which accurate industry counts could not be found for 1919. Using the 53-firm sample, average levels of diversification increased by 43 percent between 1929 and 1939. The increase was quite general. Some firms (such as General Foods, Corn Products, National Dairy, and Nabisco) had very large increases, and only four firms produced fewer products; three of those were alcoholic bev- erage producers, who divested secondary lines begun during prohibition.
Between 1939 and 1950, levels of diversification in- creased again, but on average, the increase was rel- atively small compared with increases during 1929-39, a result consistent with findings by Gort for his sam- ple of 112 large U.S. manufacturing firms [11], Diversification declined for 8 firms in the sample, while 26 showed increases. World War II restraints
Year
Table 19—Average number of industries participated in by leading food finns,
selected years, 1919-50 _— __
NT
Number
1919 1929 1929 1939 1950
37 37 53 53 53
3.38 4.51 5.51 7.85 9.04
^Sufficient data existed for 37 firms in 1919; 16 more were added in 1929. Entries for the large and small samples are entexed in 1929.
Nj s Mean number of industries particpated in by sample firms.
Source: [17] for the years shown.
on consumer spending may have caused firms to drop some secondary products, thus accounting for the slow growth in the diversification index. On average, however, diversification continued to increase in the forties just as it had in the twenties and thirties.
Implications
Product diversification carries clear risks, since many diversified ventures are later divested. Unless a diver- sifying firm has some skills which can be used in the new business, thereby improving its competitive posi- tion, there is no reason to believe that a merged firm in a new industry, acquired by outbidding other firms, will be a profitable acquisition. I've argued that transferable skills in production and, more recently, marketing form bases for diversification in the food industries.
Sources of diversification can change over time. For example, skills in the mass market development, in- troduction, and distribution of consumer products have formed an important basis for diversification only since 1950. New communications technologies may in the future fragment mass markets into iden- tifiable segments, eroding the competitive advantages of broad-based marketing diversification. Further research is needed in this area, in order to identify more precisely the bases of diversification.
Average levels of diversification increased continually between 1919 and 1972, stabilizing thereafter. Sev- eral research questions arise. We need to know whether the observed 1972-77 stability was an aber- ration or a continuing phenomenon. We also need to identify the causes of the 1972-77 stabili^. Parallels
30
Product Diversification Trends in U.$f Food Manafscturing
in the recent (post'-1950) time trend among firms of different sizes suggest a broad, systematic influence.
The report presents new evidence for relatively small firms among the 500 largest food manufacturers. Most of these small firms are not among the eight largest producers in their industries. They typically are not national producers, although they may be strong regional firms. The extent and incidence of diversification among these firms have increased markedly over time, and diversification has largely been directed to food wholesaling and to related food manufacturing industries.
Almost all studies of diversification focus on the largest firms; consequently we have little evidence of the causes of multi-industry production among smaller firms. Since most of the smaller firms cluster their diversification among related manufacturing, whole- saling, and agricultural industries, it seems unlikely that financial risk reduction is the cause. Tax reasons are sometimes offered. Because retained earnings are taxed at lower rates than dividends, profitable firms are allegedly encouraged to grow faster than they otherwise would, and diversification is one means of growth. The tax reasons explain increases in diver- sification, but do not explain why small firms diversify into related industries. I suggest that there may be real production or marketing advantages underlying small firm diversification, but those advantages have yet to be specifically identified.
Manufacturing expansion into agriculture, transporta- tion, and wholesaling continued in 1972-77, even while overall levels of diversification stabilized. In wholesaling, food manufacturers are significant forces principally through ownership of manufacturer's sales branches and offices. Their activities are likely to ex- pand, if aggregate concentration in food manufactur- ing continues to grow as it has in the past. If that trend continues, more relatively small manufacturers will reach levels of regional shipments large enough to justify a sales branch or office. If large manufac- turers continue to find it efficient to distribute prod- ucts through their own organizations, and if more manufacturers become large in a region, then manu- facturer activity in wholesaling will continue to grow. Another important research question is involved here: Why do manufacturers prefer distribution, when feasi- ble, through their own sales offices?
Manufacturer diversification into agriculture and transportation has been more narrowly based. Much of the increased interest of manufacturers in agri- culture reflects the growth of integrated poultry producer-processors. As that industry matures, we should observe the exit of some poultry firms and a stabilization of diversification links. Other manu- facturer activity in agriculture, as in hydroponics and catfish processing, has been much more experimen- tal, with failures and successes. It is not at all clear that manufacturer diversification into these other agricultural areas will continue.
Transportation has been affected by the growth of agricultural exports and by deregulation. Future trends in regulation are difficult to predict, and future entry of manufacturers into commodity transportation will probably depend upon growth in the export trade. If growth is rapid, we should observe more diver- sification into commodity transportation.
The issues covered above largely concern the causes of diversification by food manufacturers. To a certain extent, one may infer some effects from causes. For example, assume that marketing organizations are a cause of diversification. In the sense that firms that sell branded, advertised consumer products are more likely to diversify, and that those firms direct their diversification towards consumer goods industries. Those firms are likely to apply previous experience to new markets by expanding the rate of introduction of new products, advertising existing products, and replacing independent wholesalers with their own organization. In some markets, diversified entrants may increase total demand with these techniques, leading to increased demand for the agricultural com- modity. They may also alter the characteristics of the commodity in an attempt to differentiate their proc- essed products from those of competitors. Such a strategy will clearly benefit some commodity pro- ducers at the expense of others. Alternatively, suc- cessful diversified entrants may, due to experience in mass production for other consumer markets, simply be lower cost producers than incumbents. In such a case, they will supplant incumbents by offering lower prices; the effect on commodity producers will then depend upon the elasticity of market demand for the final product and upon derived demand for the com- modity. If industry demand Is inelastic with respect to price and advertising, commodity producers will be largely unaffected by the entry of diversifiers.
31

James Mè MaeDonald v?r
Diversifying flrms may directly affect market struc- ture. Irt highly concentrated industries, #key may pro- vide the most likely source of new competition for firms with monopoly power. New coinpetition from diversifiers may lower price and expand output of the final product, and thereby increase demand for the
agricultural commodity. Alternatively, if diversifiers" marketing skills serve principally to drive smaller competitors out of the market, those marketing skills may increase the market power of large processors in an industry. The net effect of diversifying firms on market structure remains an open empirical issue.
Bilittoipraphy
1. Arrow, Kenneth. The Limiis of Organizatíon. New York: W. W. Norton and Co., 1974.
2. Baumöl, William, John Panzar, and Robert Willig. Contestable Markets and the Theory of Industry Structure. New York: Harcourt Brace Jovanovich, 1982.
3. Berry, Charles H. Corporate Growth and Diver- sification. Princeton, NJ: Princeton Univ. Press, 1975.
4. Carter, John R. "In Search of Synergy: A Structure-Performance Test," Review Of Eco- nomics and Statistics, Vol. 59, No. 2 (October 1977), 279-89.
5. Caves, Richard, and otherá. Competition in the Modem Economy. Cambridge, MA: Harvard Unh?. l^ess, 1980.
6. Chandler, Alfred D. Strategy and Structure: Chapters in the History of American Industrtal Enterprise. Cambridge, MA: MIT Press, 1962.
7. The Visible Hand: The Managerial
10. .. "A Problenn^^ of Measurement, firom
RßVQlution in American Business. Cambridge, MA: The Belknap Press of Harvard Univ., 1977.
Connor, John, and Loys Mather. Directory of the 200 Largest Food Processing Firms in 1975. Special Report No. 2, North Central Regional Project 117, July 1978.
Gorecki, Paul. "'A Study of Diversification in the Canadian Food Processing Sector." Working Paper No. 3. Bureau of Competition Policy, Consumer and Corporate Affairs, Canada, 1978.
Plante to Enterprises in the Analysis of Diver- sification: A Not€,*V Journal of Industrial Economics, Vol. 28, No. 3 (March 1980), 327-34.
11. Gort, Michael. Diversification and Integration in American Industry. Princeton, NJ: Princeton Univ. Press, 1962.
12. Goto, Akira. ''Statistical Evidence on the Diver- sification of Japanese Large Firms," Journa/ of Industrial Economics, Vol. 29, No. 3 (March 1981), 271-79.
13. MacDonald, James M. Determinants ofDiversi- ficaUon in Food Manufacturing. AGES810714. U.S. Dept. Agr., Econ. Res. Serv., July 1981.
14. _. '"Product Diversification in U.S. Man- ufacturing." Ph.D. thesis. State Univ. of New Yorioat Buffalo, 1983.
15. ____. "Diversification, Market Growth, and Concentration in U.S. Manufacturing," South- ern Economic Journal, Vol. 50, No. 4 (April 1984), 1098-111,
16. Montgomery, Cynthia Ann. "The Measurement of Firm Diverslftcatloh: Some New Empirical Evidence," Academy of Management Journal Vol. 25, NQ. 2 (June 1983), 299-307.
17. Moody's Investors Service, Inc. Moody's Indus- trial Manual. Various annual issues.
18. National Commission on Food Marketing. The Structure of Food Manufacturing. Technical Study No. 8, June 1966.
32

Prodttct IHvOTSiflcatioii Trands fat l)*S. Food Manufactariiis
19.
20.
21.
22.
23.
24.
25.
Penrose, Edith T. The Theory of the Growth of the Firm. London: Basil BlackweU, 1959.
Rogers, Richard, and Loys Mather. **Food Advertising 1954 to 1979,** AdvertMng and the Food System. Ed. John M. Connor and Ronald Ward. Monograph No. 4. North Central Region- al Research Project NC-117, 1983.
Rumelt, Richard. Strategy, Structure, and Economic Performance. Boston: Harvard Business School Division of Research, 1974.
Scherer, F. M. Growth by Diversification: En- trepreneurial Behavior in Large-Scale United States Enterprises. Line of Business Program Report No. 38. Federal Trade Commission, 1983.
Stafford, Thomas H., and Gerald E. Grinnell. Structure and Performance of Grocery Products Brokers. AER-490. U.S. Dept. Agr., Econ. Res. Serv., September 1983.
Steiner, Peter O. Mergers: Motives, Effects, Policies. Ann Arbor, Ml: University of Michigan
1975.
Thorp, Willard T. The Integration of Industrial Operations. U.S. Dept. Comm., Bur. of the Census, 1924.
29.
30.
31.
32.
33.
34.
35.
1977 Enterprise Statistics: General
36.
Report on Industrial Organization. 1981.
1972 Enterprise Statistics: General Repori on IndusMal Organization. 1977.
1977 Census of Wholesale Trade. Subject Statistics. WC77-Vol. 1. 1981.
1972 Census of Wholesale Trade. Subject Statistics. WC72-Vol. 1. 1975.
.. 1967 Censm of Wholesale Trade. Subject Statistics. WC67-Vol. 1. 1970.
U.S. Department of Commerce, Bureau of Economic Analysis. The Detailed Input-Output Structure of the U.S. Economy: 1972. 1979.
U.S. Federal Trade Commission. Statistical Repori: Value of Shipments Data by Product Class for the 1,000 Largest Mantrfacturing Firms of 1950. 1972.
U.S. Office of Management and Budget, Statis- tical Policy Division. Standard Industrial Classification Manual 1972, 1972.
26.
27.
28.
U.S. Department of Commerce, Bureau of the Census. 1977 Census of Mantj{facturers: Special Tabulation for the 1977 Census of Manti^actur- ersfrom the Largest Food and Tobacco Manu- facturers. 1982.
1972 Census of Mantrfacturers: Special Tabulation of the 1972 Census of Manu- facturers from the Largest Food and Tobacco Manufacturers. 1982.
.. 1967 Census of Manufacturers: Special Tabulation of the 1967 Census of Manu- facturers from the Largest Food and Tobacco Manufacturers. 1982.
37. Utton, M. A. Diversification and Competition. Cambridge, England: Cambridge Univ. Press, 1979.
38. Wall Street Journal. Various issues.
39. Weiss, Leonard W. "The Extent and Effects of Aggregate Concentration,"* Journal of Law and Economics, Vol. 26, No. 2 (June 1983), 429-56.
40. Williamson, Oliver E. Market and Hierarchies: Analysis and Antitrust Implications. New York: The Free Press, 1975.
33

James M. MacDonald
Appendte A: Organizationai Changes Among Leading Food Manufacturerst 1975-84
John Connor and Loys Mather compiled a listing of the 200 largest U.S. food manufacturers, listing the firms' products in their Directory of the 2(H) Largest U.S. Food and Tobacco Processing Firms, 1975. Since 1975, many firms in the directory have under« gone mergers, divestitures, and bankruptcies. The purpose of this addendum is to list the major orga- nizational changes affecting the firms in the directory between December 1975 and November 1984. Begin- ning on page 35 is a list of the 200 largest food manufacturers of 1975, ranked according to esti- mated U.S. food shipments. An alphabetical list follows below, detailing major changes for each firm since that time and then summarizing the extent of major mergers and divestitures during the period. In the alphabetical listing, numbers in parentheses are the firm's rank according to U.S. food and tobacco sales in 1975. I have tried to list all circumstances under which a firm in the top 200 was acquired, other mergers and divestitures where the compensation paid exceeded $100 million, or where the transaction was of fundamental importance to the company, and bankruptcies. Since firms may also expand internally (through plant construction) or through a series of small mergers, the list does not exhaust the direction of food firms' expansion or contraction since 1975, but it does capture the most obvious actions.
Mi^or Organizational Changes, December 1975 Through November 1984
Agway Inc. (75)—Acquired H. P. Hood Inc. (77), July 1980.
Amalgamated Sugar Co, (150)—Acquired by National City Lines for $125 million and "taken private" in September 1982.
American Brands (25)—Acquired Franklin Life Insurance in July 1978 for $200 million, Pinker- tons Inc. in December 1982 for $160 million, and Southland Life Insurance in October 1983 for $352 million.
Anderson, Clayton & Co. (56)—Acquired Igloo Corporation from Coca Cola Co. (12) in June
1980; acquired Gaines Pet Food division of General Foods Corp. (4) in April 1984.
Anheuser-Busch (14)—Acquired Campbell-Taggart Inc. (51) in August 1982 for $570 million. Divested wet corn milling operations to A.E. Staley Manufacturing Co. (46) in January 1982.
Archer-Daniels-Midland Co. (22)—Leased wet corn milling plant from Nabisco Brands (31) in Oc- tober 1982. Acquired Nabisco's flour milling operations in June 1984.
Associated Coca-Cola Bottling Co. (166)—Acquired by Coca-Cola Co. (12) in April 1982 for $418 million with intent to resell to "more aggressive group.'*
Beatrice Foods Co. (3)—Acquired Harmon Interna- tional (sound equipment) in August 1977 for $103 million, Tropicana Products (158) in August 1978 for $490 million, and the beverage business of Northwest Industries in November 1981 for $600 million. Included in the Northwest package was Coca-Cola Bottling of Los Angeles (180), ac- quired by Northwest in November 1977 for $195 million. Sold Dannon Yogurt to BSN in June 1981 for $84 million. Acquired Esmark (1) in June 1984 for $2.9 billion. During 1983, divested candy, animal byproducts, and steel tubing companies.
Bluebird (81)—Acquired by Northern Food Products, Ltd., in January 1980 for $73 million.
Borden (7)—Sold phosphate facilities to Amax in October 1979 for $200 million; acquired several pasta and snack food companies in 1980-84.
British-American Tobacco (72)—Acquired Appleton Papers from NCR in May 1978 for $280 million.
Brown Forman (186)—Acquired Southern Comfort Corp. for $94 million in March 1979; acquired Lenox, Inc. (china) in June 1983 for $427 million.
Cagles (185)-Acquired J. D. Jewell (170) in March 1978.
CoftHftiied, page 37
34

Appendix table 1-* The 200 Uifgeet food end tobacco procmeing finne« ranked by their U.S. food and tobacco processinfl ealesy 1975
Estimated Estimated U.S. food U.S. food
Rank Company name and tobacco processing
sales
Rank Company name and tobacco processing
sales
Mfflion Million dollars dollars
1 Esmark 3,281 51 Campbell Taggart 638 2 KraftcoCorp. 3.165 52 Mid America Dairymen Inc. 635 3 Beatrice Foods Co. 2.714 53 Gold Kist Inc. 631 4 General Foods Corp. 2.642 54 Kane-Miller Corp. 619 5 Greyhound Corp. 2,392 55 MBPXL Corp. 610 6 LTV Corp. 2.063 56 Anderson, Clayton & Co. 583 7 Borden, Inc. 2,050 57 Calif. & HawaUan Sugar Ref. Corp. Inc. 536 8 Ralston Purina 1,899 58 Liggett & Myers Inc. 527 9 R.J. Reynolds Industries 1,827 59 Pabst Brewing Co. 525
10 Iowa Beef Processors 1,805 60 Conagra Inc. 524 11 Phillip Morris 1.684 61 General Host Corp. 516 12 Coca-Cola Co. 1,600 62 American Home Products Corp. 495 13 Carnation Co. 1,589 63 Hershey Foods Corp. 490 14 Anheuser-Busch 1,550 64 Great Western United Corp. 490 15 General Mills 1.385 65 Loews Corp. 488 16 Cargill 1,355 66 Federal Co. 486 17 Ni^tle Àlimentana 1.348 67 Rapid-American Corp. 474 18 United Brands 1,306 68 Adolph Coors Co. 471 19 Campbell Soup Co. 1,300 69 Foremost-McKesson Inc. 457 20 ITT 1,295 70 Riceland Foods Inc. 455 21 Pepsico 1,270 71 Stokely-Van Camp Inc. 454 22 Archer-Daniels-Midland Co. 1,248 72 British American Tobacco 449 23 Unilever 1,242 73 Mars Inc. 441 24 Procter & Gamble Co. 1,200 74 Ward Foods Inc. 440 25 American Brands 1.165 75 Agway Inc. 438 26 Standard Bcands 1,165 76 Farmland Industries Inc. 433 27 Consolidated Foods Corp. 1,132 77 H.P. Hood Inc. 430 28 H.j. Heinz Co. 1,117 78 Spencer Foods Inc. 429 29 Central Soya 1,073 79 Interstate Brands Corp, 429 30 CPC International 1,055 80 American Bakeries Co. 409 31 Nabisco 1,043 81 Bluebird Inc. 403 32 Oscar Mayer & Co. 1,029 82 E.& J. GaUo Winery 400 33 Norton Simon 1.010 83 Rath Packing 399 34 Geo. A. Hormel & Co. 987 84 Moorman Manufacturing Co. Inc. 380 35 Amstar 986 85 Flavorland Industries Inc. 380 36 Heublein 951 86 International Muhifoods Corp. 365 37 LandO'Lakes 925 87 Universal Leaf Tobacco Co. Inc. 363 38 Jos, Schlitz Brewing Co. 906 88 Frederick &Herrud Inc. 355 39 Krogier Co. 885 89 Associated Milk Producers 354 40 Dubuque Packing Co. 850 90 J.R. Simplot 347 41 Jos. E. Seagram Company Ltd. 790 91 Hanson Trust (Hygrade Food Products) 345 42 Del Monte Corp. 786 92 Rivlana Foods Inc. 340 43 Safeway Stores Inc. 778 93 Savannah Foods & Industries Inc. 335 44 Quaker Oats Co. 751 94 Idle Wild Foods, Inc. 335 45 Kellogg Co. 725 95 Green Giant Co. 320 46 A.E.Staley Manufacturing Co. 700 96 Fairmont Foods Co. 318 47 Pet, Inc. 659 97 Southland Corp. 315 48 Great Atlantic and Pacific Tea Co. 654 98 Warner-Lambert Co. 313 49 Pillsbury Co. 653 99 Gerber Products Co. 308 50 Continental Grain Co. 645 100 SCMCorp. 305
—Continued
35

Appendix table l^The 200 largest food and tobacco proceealng flrins, ranked by their U.S. food and tobacco processing sales, 1975—Continued
Rank Company name
Estimated Estimated U.S. food U.S. food
and tobacco Rank Company name and tobacco processing processing
sales sales
Million Million dollars dollars
305 151 National Distillers and Chemicals Corp. 177 305 152 Perdue Foods Inc. 175 304 153 Lyfces Bros. Inc. of Florida 175 300 154 Gulf i& Western Industries 175 298 155 Castle & Cooke Inc. 174 298 156 Tyson Foods, Inc. 170 290 157 Squiibb Corp, 166 280 158 Tropicana Products 164 278 159 Illini Beef Packers 162 277 160 Univar Corp. 161 268 161 Sunnyland Packing Co. 160 267 162 Rice Growers Association 160 267 163 Hiram Walker-Gooderham & Worts Ltd. 160 265 164 Tri/Valiey Growers 159 262 165 National Grape Cooperative 258 Association Inc. 158 254 166 Associated Coca-Cola Bottling Co. 157 ; 252 167 Glover Inc. 155 251 168 ËMGE Packing Co. 155 245 169 Seven>UpCo. 154 236 170 J.D. Jewell 153 234 171 Sun Harbor Ind. 152 233 172 National Can Corp. 152 232 173 Coastal Freezing Inc. 152 225 174 Superior Brand Meats Inc. 150 221 175 Rothmans of PaUMall Canada 149 206 176 IC Industries Inc. 149 205 177 CHB Foods Inc. 149 204 ,178 Glenmore Distillers Co. 148 203 179 Reckitt & Coleman Ltd. 147 200 180 Coca-Cola Bottling of Los Angeles 142 200 181 Valmac Industries 140 195 182 Ghçdk Full Ó* Nute Corp. 140 194 183 Ch«iebrouglt-Ponds 140 194 184 Imasco Ltd. 138 193 185 Caglfts Inc. 136 191 186 Brown Forman 135 188 187 Krey Packing Co. 135 188 188 West^ennessee Padters 134 187 189 Publicker Industries Inc. 134 183 190 Dr. Pepper Co. 133 182 191 Dinner Bell Foods Inc. 132 182 192 Ç. Schmidt & Sons 130 180 193 General Cigar Co. 129 179 194 Smithfield Foods Inc. 127 179 195 Lance Inc. 124 179 196 George Weston 123 178 197 Abbott Laboratories 123 178 198 Springs Mills, Inc. 122 178 199 Marhoefer Packing Co. Inc. 122 178 200 Colonial Provisions 121
101 Farmers Union Grain Terminal Association
102 PcaveyCo. 103 Vatleydale Packers Inc. 104 Seaboard Allied Milling Corp. 105 Monfort of Colorado Inc. 106 Wm. Wrigley Jr. Co. 107 I.U. International Corp. 108 SucrestCorp. 109 AMFAC Inc. 110 United Biscuits Ltd. (Keebler) 111 J.Lyons & Co. Ltd. 112 Dean Foods Co. 113 Knudsen Corp. 114 Packeriand International 115 RCA Corp. 116 Jewel Companies Inc. 117 American Crystal Sugar Co. 118 RSN Projects Inc. 119 Grain Processing Corp. 120 Imperial Group Ltd. 121 F&M Schaefer Corp. 122 Coca-Cola Bottling Co. of New York 123 American Maize Products Co. 124 Hubbard MiUiag Co. 125 Holly Sugar Corporation 126 Olympia Brewing Co. 127 National Industries Inc. 128 î>airylea Cooperative Inc. 129 California Canners and Growers 130 U and I Inc. 131 Stroh Brewery 132 L.î>. Schreiber Cheese Co. 133 Southdown, Inc. 134 American Stores Co. 135 Dibrell Brothers Inc. 136 WR. Grace & Co. 137 Morton-Norwich Products, Inc. 138 Hartsville Oil Mill Inc. 139 United Dairymans Association 140 Imperial Sugar Co. 141 United States Sugar Corp. 142 Missouri Farmers Association 143 Fallstaif Brewing Corp. 144 McCormick & Co. Inc. 145 Flowers Industries« Inc. 146 Cook Industries, Inc. 147 Royal Crown Cola Co. 148 General Cinema 149 G. Heilcman Brewing Co., Inc. 150 Amalgamated Sugar Co. Source: [8].
36

Product Diveraificatioii Trends in U.S. Food Manafacturing
California Canners and Growers ( 129)—Acquired Libby fruit canning line of Nestle Alimentana (17) in June 1982; filed for protection under bankruptcy statutes, June 1983.
Campbell Soup Co. (19)—Acquired Vlasic Foods (pickle processor)/Herider Farms (poultry pro- cessing), Mrs. Pauls (fish processing), and Ger- man Village products (macaroni).
Campbell-Taggart Inc. (51)—Acquired by Anheuser- Busch (14) in August 1982 for $570 million.
Cargill (16)—Acquired mea^ackerMBPXL Corp. (55) in March 1977; flour-milling operations of Seaboard Allied Milling Corp. (104) in October 1981; and Spencer Foods Inc. (78) meatpacking operations of Land O' Lakes (37) in June 1983.
Carnation Co. (13)—Acquired by Nestle Alimentana (17) in August 1984 for $3 billion.
Central Soya (29)—Sold broiler operations to Seaboard Allied Milling Corp. (104) in February 1984.
Coca-Cola Bottling of Los Angeles (180)—Acquired by Northwest Industries in November 1977 for $195 million and then sold to Beatrice Foods Co. (3) in November 1981.
Coca-Cola Co, (12)—Acquired the following bottlers: Coca-Cola Bottling Co> of New York<122) in August 1982 for $218 million, Coca-Cola Bot- tling Co. of Ft. Worth in September 1981 for $100 million. Associated Coca-Cola Bottling Co. (166) in April 1982 for $418 million, and other smaller bottlers, with stated intent to reorganize firms and resell to other managements. Also ac- quired Columbia Pictures in January 1982 for $800 million. Acquired Taylor Wine Co. in Janu- ary 1977 for $80 million. Later (September 1983) sold wine business, including Taylor, Sterling, and Monterey vineyards, to Jos. E. Seagram Company, Ltd. (41), for $200 million.
Coca-Cola Bottling Co. of New York (122)-Acquired by Coca-Cola Co. in August 1981 for $218 million.
Colgate Palmolive—Acquired Riviana Foods Inc. (92) in June 1976 for $180 million.
Colonial Provisions (200)—Acquired by Curtice-Burns in September 1983.
Conagra Inc. (60)—Acquired frozen foods business of RCA Corp. (115) in September 1980, Singleton Packing (seafood) in February 1982, Peavey Co. (102) in April 1982 for $150 million, and Armour Foods of Greyhound Corp. (5) in June 1983 for $166 million.
Continental Grain Co. (50)—Divested baking opera- tions, Orowheat, to General Foods Corp. (4), and Arnold Bread to management in April 1984.
Consolidated Foods Corp. (27)—Acquired Hanes Cor- poration for $250 million in January 1979. Divested apparel, rental, home furnishing divi- sions, 1976-80, with stated intent to emphasize specialty meats, coffee, beverages, and frozen foods. Later (1983-84) acquired several regional meat processors.
Cook Industries, Inc. (146)—Discontinued food businesses after bankruptcy proceedings.
CPC International (30)—Began construction or expansion of three wet corn milling plants in 1981; acquired C. F. Mueller Co. (pasta) from Foremost-McKesson Inc. (69) in October 1983 for $125 million.
Culbro (General Cigar Co.) (193)—Sold proprietary medicine division in May 1981 to Sandoz Phar- maceutical and acquired several small snack operations in 1976-78,
Del Monte Corp. (42)—Acquired by R. J. Reynolds Industries (9) in February 1979 for $615 million.
Dr. Pepper Co. (190)-Acquired Canada Dry division of Norton Simon (33) in September 1981 for $143 million. Announced $500 million leveraged buy-out by private interests in November 1983. Sold Canada Dry to R. J. Reynolds Industries (9) for $150 million in March 1984.
Esmark (1)—Sold oil properties in March 1982 for $1.1 billion; divested fresh meat operations to management in April 1982; acquired Norton Simon (33) in June 1983 for $960 million. Sold Norton Simon's glass container division to Chat-
37

James M. MacDonald
tanooga Glass for $75 million in August 1983, and distilled spirits business to Distillci^ Inc. for $250 million in April 1984, Acquired by Beatrice Foods Corp. (3) in May 1984 for $2.9 biUion.
Fairmont Foods Go. (96)—Acquired by American Financial for $73 million in June 1980>
Foremost-McKesson Inc. (69)—Acquired C. F. Mueller (pasta) in October 1976^for$ 115 million; di- vested Foremost Dairies to private investors in June 1982 for $62 million. Sold MueUer to ÇPC International (30) in October 1983 for $125 million.
General Foods Corp. (4)—Acquired Oscar Mayer & Co. (32) in Februaiv 1981 for $465 million. Ac- quired Entenmann's Bakeries from Warner- Lambert Co. (98)Kin September 1982 for $315 million. AcquirêdRonzoni (pasta) in January 1984 and the Orowheat baking division of Con- tinental Grain Co. (50) in April 1984. Sold Gaines Pet Food to Anderson, Clayton & Co. (56) in April 1984.
General Host Corp. (61)—Divested Cudahy meat- packing operations, August 1981 .Sold American Salt ta Diamond Crystal ISalt in June 1984 for $40 million. Sold Van De Kamp frozen seafood to Pillsbury (49) in October 1984 for $100 million.
Grand Metropolitan-Acquired Liggett Group (58) in December 1980 for $600 million.
Great Atlantic and Pacific Tea Co. (48)—Closed 174 stores in March 1979. Closed large plant at Horseheads, NY, in April 1982.
Great Western United Coip. (64)—Merged into Hunt International Resources in February 1978.
Green Giant Co. (95)—Acquired by Pillsbury (49) in March 1979 for $130 miUion.
Greyhound Corp. (5)—Sold Armour Pharmaceuticals to Revlon in November 1977 for $87 million and sold Armour Foods to Conagra in June 1983 for $166miHion.
Gulf & Western Industries (154)-Sold Consolidated Cigar to management group in March 1983 for $120 million. Consolidated Cigar Was later (July 1984) acquired by MacAndrews and Forbes» Ltd. (UK). Sold sugar operations to Fanjul family in October 1984 for $200 million.
G. Heileman Brewing Co., Inc. (149)—Acquired 62 percent of Pabst Brewing Co. (59) by November 1983; Pabst had earlier acquired Olympia Brew- ing Co. (126). Also, continued expansion of bakery and snack operations.
Hershey Foods Corp. (63)—Acquired Friendly Ice Cream in April 1979 for $164 mÜíion. Also ac- quired several regional pasta manufacturers in 1976-77.
Heublein (36)—Acquired by R. J. Reynolds Industries (9) for $1,3 bilUon in July 1982.
Hiram Walker (163)—Amalgamated with Consumers Home Gas Co. in June 1980.
H. P. Hood Inc. (77)-Acquired by i^^way Inc. (75) in JuHM980.
IC Industries Inc. (176)-Acquired Pet Inc. (47) in August 1978 for $400 million; then dh^sted Pet^ fruit canning, nut, and retail liquor business. Ac^ quired Wm. Underwood (specialty meat$) in July 1982 for $150 million.
mini Beef Packers (159)—Sold all mea^acking assete to Dubuque Packing Co. (40) in June 1980; re- tained operations in meat processing (SIC #2013).
Imperial Group Ltd. (120)—Acquired Howard Johnson's in June 1980 for $600 miUion.
ITT (20)—Sold Morton Frozen Food operations to R. J. Reynolds Industries (9) in June 1980, Gwaltney Meatpacking to Smithfield Foods Inc. (194) in August 1981, and C & C Cola to Con- solidated Foods Corp. (27) in May 1982.
Interstate Brands Corp. (79)—Acquired by DPF in February 1979; DPF later sold its computer operations, retaining only Interstate Brands Corp.
38

Product Diversification Trends in U.S. Food Manufacturing
Iowa Beef Processors (10)—Acquired by Occidental Petroleum in May 1981 for $800 million.
J. D. Jewell (170)-Acquûred by Cagles Inc. (185) in March 1978.
Kane-Miller Corp. (54)—Sold bakery division to George Weston (196) in July 1981; divested can- ning operations to management in November 1983.
Knudsen Corp. (113)—Acquired by Builders Invest- ment Group in November 1983 for $75 million.
Kraftco Corp. (2)—Acquired Dart Industries in January 1981 for $2.5 billion to form Dart and Kraft. Dart and Kraft then acquired Hobart In- dustries in June 1981 for $460 million. In 1983-84, acquired Churny (specialty cheese). Celestial Seasonings (tea, herbs), and Lender's Bagels.
Krey Packing Co. (187)—Acquired by United Brands (18) in June 1978.
Land O' Lakes (37)—Acquired Spencer Foods Inc. (78) in July 1978; acquired Lake to Lake Co-op (cheese) in October 1980; sold Spencer Foods Inc. to Cargill (16) in June 1983.
Liggett Group (58)—Acquired Pepsi Cola Bottling of Atlanta for $125 million and other smaller Pepsi bottlers in April 1979. Acquired by Grand Metro- politan in December 1980 for $600 million.
LTV Corp. (6)—Acquired Lykes Corp. (steel and ship- building) in December 1978 for $188 million. Divested Wilson Foods in June 1981; Wilson filed for bankruptcy in May 1983.
Nabisco (31)—Terminated dog food business in June 1978; merged with Standard Brands (26) in March 1981; acquired Lifesavers Candy from Squibb Corp. (157) for $250 million in November 1981. Divested the following Standard Brands businesses: sold wine and spirits business to Whitbread (UK) for $155 million in July 1982; sold toiletries business for $100 million to private investors group in September 1982; leased wet corn milling plants to Archer-Daniels-Midland Co. (22) in October 1982; sold coffee division to
General Coffee in November 1982; sold tea divi- sion to Procter & Gamble Co. (24) in December 1982. Sold Nabisco's flour milling business to Archer-Daniels-Midland Co. (22) in June 1984. Acquired Huntley-Palmer (UK) for $150 million in November 1982.
National Industries Inc. (127)—Acquired by Fuqua for $66 million in September 1977.
Nestle Alimentana (17)—Divested U.S. Libby fruit canning operations to California Canners and Growers and U.S. vegetable canning operations to S. S. Pierce. Later (June 1984) acquired Hills Bros. Coffee and Chase and Sanborn Coffee. Ac- quired Carnation Co. (13) in August 1984 for $3 billion.
Northwest Industries—Acquired Coca-Cola Bottling of Los Angeles (180) for $195 million in No- vember 1977; sold entire beverage business to Beatrice Foods Co. (3) in November 1981 for $600 million.
Norton Simon (33)—Acquired Avis, Inc. for $160 million in July 1977; sold soft drink division to Dr. Pepper Co. (190) in September 1981 for $43 million. Acquired by Esmark (1) in June 1983 for $960 million.
Occidental Petroleum—Acquired Iowa Beef Processors (10) in June 1981 for $800 million.
Olympia Brewing Co. (126)—Acquired by Pabst Brewing Co. (59) in October 1983; by December 1983, G. Heileman Brewing Co. Inc. (149) held 62 percent of Pabst Brewing Co.
Oscar Mayer & Co. (32)—Acquired by General Foods Corp. (4) in March 1981 for $465 million.
Pabst Brewing Co. (59)—Acquired Olympia Brewing Co. (126) in October 1983; G. Heileman Brewing Co., Inc. (149) acquired 62 percent of Pabst by end of 1983 in a $179 million transaction.
Peavey Co. (102)—Acquired by Conagra Inc. (60) in April 1982 for $153 million.
39

Janes M. MacDonald
Pepsico (21)<-Acquired Pizza Hut in November 1977 and Taco Bel! for $150 million in June 1978. Sold North American Van Lines to Chessie System in April 1984 for $315 million.
Phillip Morris (ll)-Acquired Seven-Up Co. (169) in May 1978 for $500 million.
Pillsbury Co. (49)*-^Acquired American Beauty Macaroni Co. in September 1977 for $45 million. Green Giant Co. (95) in March 1979 for $130 million, agricultural commodity division of Wickes Corp. in February 1982, and Haagen- Dazs (ice cream manufacture and retailing) in June 1983. Bought Van De Kamp frozen seafood from General Host for $100 million in October 1984.
Procter & Gamble Co. (24)--Acquired beverage companies: Crush International in February 1980 for $53 million, Ben Hill Griffin (orange Juice) in August 1981, and Coca-Cola Botding/Midwest in November 1982. In July 1982 acquired Norwich Eaton Division of Morton-Norwich Producto, Inc. (137) for $371 million.
Quaker Oats Co. (44)<-Acquired Stokely-Van Camp Inc. (71) in August 1983. Divested chemicals business In November 1983 for $60 million.
RCA Corp. (115)--Sold Banquet Foods to Conagra Inc. (60) in September 1980, leaving the food industry.
Rath Packing Co. (83)—Filed for bankrupt«^, November 1983.
Riviana Foods Inc. (92)—Acquired by Colgate Palmolive in June 1976 for $170 million.
R. J. Reynolds Industries (9)—Acquired U.S. opera- tions of Burmah Oil Co. for $522 million in June 1976; acquired Del Monte Corp. (42) in Februan^ 1979 for $619 million; acquired Signal Petroleum in December 1979; acquired Morton Frozen Foods from ITT (20) in December 1980; acquired Heublein (36) for $1.3 billion in July 1982. Ac quired Canada Dry from Dr. Pepper Co. (190) for $150 million in March 1984 and Suidiist from General Cinema (148) for $57 million in October
1984. Divested oil operations to Phillips Petroleum for $1.7 billion in August 1984.
RSN Projects Inc. (118)—Filed for bankruptcy in October 1981.
F & M Schaefer Corp. (121)—Acquired by Stroh Brewery (131) in March 1980.
Jos. Schlitz Brewing Co. (38)—Acquired by Stroh Brewen^ (131) in September 1981 for $500 million.
Seven-Up Co. (169)-Acquired by Phillip Morris (11) for $500 million in October 1978.
Smithfield Foods Inc. (194)—Acquired Gwaltney MealÉ from ITT (20) in August 1981.
Southland Corp. (97)—Acquired refining, marketing, and transport operations of Cities Service from Occidental Petroleum for $567 million in May 1983.
Southdown, Inc. (133)-Between 1977 and 1981, divested soft drink, wine, brewing, sugar, and candy operations and left the food industry.
Spencer Foods Inc. (78)—Acquired by Land O' Lakes (37) in July 1978 and sold to Carglll (16) in June 1983.
Springs Mills, Inc. (198)—Sold divisions of Seabrook Farms Foods to various companies in June 1981 and left the food industry.
Squibb Corp. (157)-^Sold LIfesavers Candy to Nabisco Brands (31) for $250 million in November 1981 and left the food industry.
A. E. Staley Manufacturing Co. (46)—Divested Consumer Products Divisions, 1971-81. Acquired CFS Continental for $331 million in October 1984.
Standard Brands (26)-Merged with Nabisco (31) in March 1981.
Stokely-Van Camp Inc. (71)—Sold frozen-food operations to United Foods in September 1982; sold six canneries and trademark to Oconomowoc Canning in June 1983; acquired by Quaker Oats Co. (44) in August 1983.
40

Product Diversification Trends in U.S^ Food Manufactiiring
Unilever (23)—Acquired National Starch and Chemical for $485 million in August 1978.
United Brands (18)—Acquired Krey Packing Co. (187) in June 1978.
Univar Corp. (160)—Divested grain operations (malt, wet corn milling, and grain merchandising) to stockholders and left the food industry.
Universal Leaf Tobacco Co. Inc. (87)—Acquired Royster Co. (fertilizers) for $110 million in June 1980. Acquired two insurance companies from Continental Group for $115 million in August 1984.
U and I Inc. (130)—Closed beet sugar operations in June 1978.
United States Sugar Corp. (141)—Acquired South Bay Growers (celery, lettuce) in June 1980 for $80 million.
Valmac Industries (181)—Acquired by Lane Co. in February 1981,
Ward Foods Inc. (74)—Divested baking operations in 1976-80; initiated bankruptcy proceeding in 1981. Remaining units acquired by Tersoh Co. in 1981.
Summary off Mi^or Organizational Changes, December 1975 to November 1984
(a) Thirty-eight of the 1975 top 200 were acquired by July 1984. Sorted by sales rank they are:
Safes No, of Food manufacturers which were rank firms bought by other firnis
1-25 3 Iowa Beef, Esmark, Carnation Co.
26-50 7 Standard Brands, Oscar Mayer & Co., Norton Simon, Heublein^r Jos. Schlitz Brewing Co., Del Monte Corp., Pet Inc.
51400 14 Campbell Taggart Inc., MBPXL Corp., Liggett Group, Great
Western United Corp., Stokely- V Van Camp Inc., H. P. Hood Inc.,
Spencer Foods Inc., Interstate Brands Corp., Bluebird Inc., Ri- viana Foods Inc., Green Giant Co., Fairmont Foods Co., Pabst Brewing Co., Ward Foods Inc.
101-200 15 Peavey Co., F & M Schaefer Corp., National Industries Inc., Coca-Cola Bottling Co. of New York, Olympia Brewing Corp., Tropicana Products, Associated Cogra^Cola Bottling Co., J. D. Jewell, Coca-Cola Bottling of Los Angeles, Valmac Industries, Krey Packing Co., Seven-Up Co., Amalgamated Sugar Co., Colonial Provisions, Knudsen Corp^
(b) There were,17 ma}or divestitures of food businesses.
Sales No. of Firms divesting food businesses rank firms
1-25 4 Esmark, Greyhound Corp., LTV Corp., ITT.
26-50 2 Nabisco Brands, Land O' Lakes.
51-100 3 General Host Corp., Foremost- McKesson Inc., Warner-Lambert Co.
101-200 8 Seaboard Allied Milling Corp., RCA Corp., Southdown Inc., Gulf & Western Industries, Illini Beef Packers, Spring Mills Inc., Squibb Corp., Univar Corp.
(c) Five companies initiated bankruptcy proceedings.
Firms which filed for bankruptcy Sales rank 74 83 118 129 146
Ward Food Inc. Rath Packing Co. RSN Projects Inc. California Canners and Growers Cook Industries, Inc.
41

James M* MacDonald
Appendix B; Food Processing Industries
The following are Standard Industrial Classification (SIC) numbers, titles, ánd descriptions of food proc- 2021 Creamery essing industries as developed by the U.S. Depart- butter ment of Commerce [36].
SIC Title Description 2022 Cheese, number natural and 2011 Meatpacking Establishment engaged
primarily in the slaughter- processed
ing of cattle/hogs, sheep. 2023 Condensed lambs, and calves (for their and evapo- own account or on a con- rated milk tract basis for the trade) for meat to be sold or to be used on the same premises 2024 Ice cream in canning and curing, and and frozen in making sausage, lard. desserts and other products.
2013 Sausages and Establishments engaged 2026 Fluid milk other pre- primarily in manufacturing pared meat sausages, cured meats. products smoked meats, canned
meats, frozen meats, natural sausage casings, and other prepared meats and meat specialties from 2032 Canned purchased carcasses and specialties other materials.
2016 Poultry Establishments engaged dressing primarily in slaughtering
and dressing poultry (for their own account or on a 2033 Canned fruits, contract basis for the trade) vegetables, for meat to be sold or to be preserves, used on the same premises jams, and in further processing. jellies
2017 Poultry and Establishments engaged egg primarily in the preparation processing of processed poultry prod- 2034 Dried and de-
ucts from purchased car- hydrated casses, including cooking, fruits, veg- smoking, raw-boning, can- etables, and ning, freezing, and dehy- soup mixes drating (for their own ac- count or on a contract
basis for the trade) or in the drying, freezing, and breaking of eggs.
Establishments engaged primarily in manufacturing creamery butter.
Establishments engaged primarily in manufacturing all types of natural cheese.
Establishments engaged primarily in manufacturing condensed and evaporated milk and related products.
Establishments engaged primarily in manufacturing ice cream and other frozen desserts.
Establishments engaged primarily in processing (pas- teurizing, homogenizing, vitaminizing, bottling), and distributing fluid milk and cream and related products.
Establishments engaged primarily in canning spe- cialty products, such as baby foods, '*native foods,*' health foods, and soups (except seafood).
Establishments engaged primarily in canning fruits and vegetables and frtiit and vegetable juices, and manufacturing catsup and similar tomato sauces, pre- serves, jams, and jellies.
Establishments engaged primarily in sun-drying or artificially dehydrating fruits and vegetables, or in manufacturing packaged soup mixes from dehy- drated ingredients.
42

Product Divcnlficátion Trend« in U.S. Food M«nnf«ctiirin8
2035
2037
2038
2041
2043
2045
2046
2047
Pickled fruits Establishments engaged and vegeta- primarily in pickling and bles, vegeta- brining fruits and vegeta- ble sauces bles, and in manufacturing 2048 Prepared and season- salad dressings, vegetable feeds and ings, and relishes, sauces, and feed ingre- salad seasonings. dients for dressings animals and
fowls, not Frozen fruits. Establishments engaged elsewhere fruit juices. primarily in freezing fruits. classified and fruit juices, and vegetables. vegetables 2051 Bread and
other bakery Frozen Establishments engaged products, ex- specialties primarily in freezing and cept cookies
coldpacking food specialties and crackers such as frozen dinners and frozen pizza. 2052 Cookies and
crackers Flour and other grain mill products
Cereal break- fast foods
2044 Rice milling
Blended and prepared flour
Wet corn milling
Dog, cat, and other pet food
Establishments engaged primarily in milling flour or meal from grain (except rice).
Establishments engaged primarily in manufacturing cereal breakfast foods and related preparations.
Establishments engaged primarily in manufacturing rice flour or meal.
Establishments engaged primarily in the preparation of blended flours and flour mixes or doughs from pur- chased flour.
Establishments engaged primarily in milling corn or sorghum grain (milo) by the wet process, and pro- ducing starch, syrup, oil, sugar, and byproducts such as gluten feed and meal.
Establishments engaged primarily in manufacturing dog, cat, and other pet
2061
2062
2065
2066
Cane sugar, except refin- ing only
Cane sugar refining
2063 Beet sugar
Candy and other confec- tionery products
Chocolate and cocoa products
food from cereal, nieat, and other ingredients.
Establishments engaged primarily in manufacturing prepared feeds, and feed in- gredients and adjuncts for animals and fowls not elsewhere classified.
Establishments engaged primarily in manufacturing bread, cakes, and other "perishable" products.
Establishments engaged primarily in manufacturing cookies, crackers, pretzels, and similar "dry** bakery products.
Establishments engaged primarily in manufacturing raw sugar, syrup, or fin- Ished (granulated or clar- ified) cane sugar from sugarcane.
Establishments engaged primarily in refining pur- chased raw cane sugar and sugar syrup.
Establishments engaged primarily in manufacturing sugar from sugar beets.
Establishments engaged primarily in manufacturing candy, including chocolate candy; salted nuts; other confections; and related products.
Establishments engaged primarily in shelling, roast- ing, and grinding cacao beans for the purpose of
43

James M. MacDonald
2067 Chewing gum
2074 Cottonseed oil mills
2075 Soybean oil mills
making chocolate liquor, 2082 from which cocoa powder and cocoa butter are de- rived, and in the further manufacture of solid choc- olate bars and chocolate coatings.
Establishments engaged primarily in manufacturing £084 chewing gum or chewing gum base.
Establishment engaged primarily in manufacturing 2085 cottonseed oil and by- product cake, meal, and linters.
Establishments engaged primarily in manufacturing soybean oil and byproduct cake and meal.
Malt beverages
2083 Mah
Wines, bran* dy, and bran- dy spirits
Distilled, rec- tified, and blended liquors
Establishments engaged primarily in manufacturing all kinds of malt beverages.
Establishments engaged primarily in manufacturing malt or malt byproducts from barley or other grains.
Establishments engaged primarily in manufacturing wines, brandy, and brandy spirits.
Establishments engaged primarily in manufacturing alcoholic liquors by distilla- tion and rectification, and in manufacturing cordials and alcoholic cocktails by blending processes or by mixing liquors and other ingredients.
2076
2077
2079
Vegetable oil mills, except corn, cotton- seed, and soybean
Animal and marine fats and oils
Shortening, table oils
Establishments engaged primarily in manufacturing vegetable oils and by- product cake and meal (ex- cept corn, cottonseed, and soybean).
Establishments engaged primarily in manufacturing animal oils, including fish oil and other marine ani- mal oils and fish and ani- mal meal; and those ren- dering inedible grease and tallow from animal fat, bones, and meat scraps.
Establishments engaged primarily in manufacturing shortening, table oils, mar- garine, and other edible fats and oils not elsewhere classified by further proc- essing of purchased ani- mal and vegetable oils.
2086
2087
2091
Bottled and canned soft drinks and carbonated waters
Flavoring ex- tracts and flavoring syrups, not elsewhere classified
Canned and cured fish and seafoods
Establishments engaged primarily in manufacturing soft drinks (nonalcoholic beverages) and carbonated waters.
Establishments engaged primarily in manufacturing flavoring extracts, syrups, and fruit juices not else- where classified for soda fountain use; or for the manufacture of soft drinks, and colors for bakers' and confectioners* use.
Establishments engaged primarily in cooking and canning fish, shrimp, oysters, clams, crabs, and other seafoods, including soups; and those engaged in smoking, salting, drying, or otherwise curing fish for the trade.
44 ^U.S. GOVERNMENT PRINTING OFFICE« 1985-^60-941 :20043-ERS

Product Diversification Trends in U.S. Food Manufacturing
2092
2095
Fresh or frozen pack- aged fish and seafoods
Roasted coffee
2097 Manufactured ice
Establishments engaged primarily in preparing fresh and raw or cooked frozen packaged flsh and other seafood, including soups.
Establishments engaged primarily in roasting coffee, including freeze-dried, man- ufacturing coffee concen- trates and extracts in pow- dered, liquid, or frozen form.
Establishments engaged primarily in manufacturing ice for sale.
2098 Macaroni, Establishments engaged spaghetti, primarily in manufacturing vermicelli, dry macaroni, spaghetti, and noodles vermicelli, and noodles.
2099 Food prepa- Establishments engaged rations, not primarily in manufacturing elsewhere prepared foods and mis- classified cellaneous food specialties
not elsewhere classified, such as baking powder, yeast, and other leavening compounds; chocolate and cocoa products (except con- fectionery) made from pur- chased materials, peanut butter, and packaged tea.
45