Aging Studies on Normal Lens Using the Scheimpflug Slit-Lamp …big · slit-lamp biomicroscopy and...
7
Reports 263 on trabecular cells, 5 as well as the role of the TGF-/3s in modulating the production of the ECM, our findings are important for investigations regarding whether this class of growth factors is implicated in the normal aging process of the trabecular meshwork, in the pathogenesis of the glaucomatous state of the eye, and in the failure of filtration procedures for this disease. Key Words aqueous humor, betaglycan, competitive binding, extracel- lular matrix, heparinase, receptor types, Scatchard analysis. References 1. Roberts AB, and Sporn MB. The transforming growth factor-betas. In: Sporn MB, Roberts AB, eds. Peptide Growth factors and Their Receptors: Handbook of Experi- mental Pharmacology. Heidelberg: Springer-Verlag; 1990:419-472. 2. Massague J, Cheifetz S, Ignotz RA, Boyd FT. Multiple type-/3 transforming growth factors and their recep- tors. J Cell Physiol. 1987;5:43-47. 3. Tripathi RC, Borisuth NSC, Tripathi BJ. Growth fac- tors in aqueous humor and their therapeutic implica- tions in glaucoma and anterior segment disorders of the human eye. Drug Development Research. 1991; 22:1-23. 4. Jampel HD, Roche N, Stark WJ, Roberts AB. Trans- forming growth factor beta in human aqueous humor. Curr Eye Res. 1990;9:963-969. 5. Borisuth NSC, Tripathi BJ, Tripathi RC. Identifica- tion and partial characterization of TGF-j81 receptors on trabecular cells. Invest Ophthalmol Vis Sci. 1992;33:596-603. 6. Tripathi RC, Park JK, Tripathi BJ, Ts'ao C. Tissue plasminogen activator synthesis by trabecular cells and its implications for fibrinolytic therapy of the eye. Drug Development Research. 1989; 18:245-254. 7. Moscatelli D. High and low affinity binding sites for basic fibroblast growth factor on cultured cell: Ab- sence of a role for low affinity binding in the stimula- tion of plasminogen activator production by bovine capillary endothelial cells. J Cell Physiol. 1987; 131:123-130. 8. Cheifetz S, Hernandez H, Laiho M, Dijke PT, lwata KK, Massague J. Distinct transforming growth factor- /3 (TGF-/3) receptor subsets as determinants of cellular responsiveness to three TGF-/3 isoforms. J Bio I Chem. 1990;265:20533-20538. 9. Bassols A, Massague J. Transforming growth factor /3 regulates the expression and structure of extracellular matrix chondroitin/dermatan sulfate proteoglycans. / Biol Chem. 1988;263:3039-3045. Aging Studies on Normal Lens Using the Scheimpflug Slit-Lamp Camera Kay oho Kashima,* Benes L. Trus,\ Michael Unser,% Paul A. Edwards,* and Manuel B. Datiles* Purpose. To study the changes in density and thickness in normal lenses related to aging, and to study changes in anterior chamber depth related to aging. Methods. Eighty nine normal volunteers (ages 9-80 yr) were examined and their eyes were photographed to obtain Scheimpflug photographs. The images were dig- itized and linear densitometry was performed, dividing the lens intofiveareas: posterior capsular (area 1), pos- terior cortical (area 2), nuclear (area 3), anterior corti- cal (area 4), and anterior capsular (area 5). Total lens thickness and anterior chamber depth were similarly From the * Cataract and Corneal Diseases Section, Ophthalmic Genetics and Clinical. Services Branch, National Eye Institute, the ^Computer Systems Laboratoiy, Division of Computer Research and Technology, and the XBiomedical Engineering and Instrumentation Program, National Institutes of Health, Bethesda, Maryland. Submitted for publication: January 31, 1991; accepted July 23, 1992. Proprietary Interest Category: N. Reprint requests: Manuel B. Datiles, Cataract & Cornea Section, OCCSB, NEI-NIH, 9000 Rockville Pike, Bldg. 10, Rm. I0N226, Bethesda, MD 20892. measured for 90 normal eyes from the densitometry profiles. These were correlated with age. Results. There was a strong positive correlation between increasing age and the density in all lens areas (area 2: r = 0.805; P < 0.0001; area 3: r = 0.836, P < 0.0001; area 4: r = 0.767, P < 0.0001; and area 5: r = 0.319, P < 0.0023), except the posterior capsular area, where correlation was negative (area 1: r = —0.426; P < 0.0001). In addition, there was a significant correla- tion between age and overall lens thickness (r = 0.756; P < 0.0001), thickness of nucleus (r = 0.543; P < 0.0001), and cortex (r = 0.632; P < 0.0001), and a negative correlation with anterior chamber depth (r = -0.513, P< 0.0001). Conclusion. This report shows human lens changes in density and thickness correlated with aging using Scheimpflug photography and image analysis tech- niques. The results will aid future development of sys- tems for automated detection, classification, and moni- toring of human cataracts, as well as other anterior segment disorders. Invest Ophthalmol Vis Sci. 1993; 34:263-269. With aging, the normal human lens changes in density as well as thickness. It is important to study and docu- ment these normal age-related changes to distinguish these from pathologic changes such as cataract forma-
Transcript of Aging Studies on Normal Lens Using the Scheimpflug Slit-Lamp …big · slit-lamp biomicroscopy and...
Reports 263
on trabecular cells,5 as well as the role of the TGF-/3s inmodulating the production of the ECM, our findingsare important for investigations regarding whetherthis class of growth factors is implicated in the normalaging process of the trabecular meshwork, in thepathogenesis of the glaucomatous state of the eye, andin the failure of filtration procedures for this disease.
Key Words
aqueous humor, betaglycan, competitive binding, extracel-lular matrix, heparinase, receptor types, Scatchard analysis.
References
1. Roberts AB, and Sporn MB. The transforming growthfactor-betas. In: Sporn MB, Roberts AB, eds. PeptideGrowth factors and Their Receptors: Handbook of Experi-mental Pharmacology. Heidelberg: Springer-Verlag;1990:419-472.
2. Massague J, Cheifetz S, Ignotz RA, Boyd FT. Multipletype-/3 transforming growth factors and their recep-tors. J Cell Physiol. 1987;5:43-47.
3. Tripathi RC, Borisuth NSC, Tripathi BJ. Growth fac-tors in aqueous humor and their therapeutic implica-tions in glaucoma and anterior segment disorders ofthe human eye. Drug Development Research. 1991;22:1-23.
4. Jampel HD, Roche N, Stark WJ, Roberts AB. Trans-forming growth factor beta in human aqueous humor.Curr Eye Res. 1990;9:963-969.
5. Borisuth NSC, Tripathi BJ, Tripathi RC. Identifica-tion and partial characterization of TGF-j81 receptorson trabecular cells. Invest Ophthalmol Vis Sci.1992;33:596-603.
6. Tripathi RC, Park JK, Tripathi BJ, Ts'ao C. Tissueplasminogen activator synthesis by trabecular cellsand its implications for fibrinolytic therapy of the eye.Drug Development Research. 1989; 18:245-254.
7. Moscatelli D. High and low affinity binding sites forbasic fibroblast growth factor on cultured cell: Ab-sence of a role for low affinity binding in the stimula-tion of plasminogen activator production by bovinecapillary endothelial cells. J Cell Physiol. 1987;131:123-130.
8. Cheifetz S, Hernandez H, Laiho M, Dijke PT, lwataKK, Massague J. Distinct transforming growth factor-/3 (TGF-/3) receptor subsets as determinants of cellularresponsiveness to three TGF-/3 isoforms. J Bio I Chem.1990;265:20533-20538.
9. Bassols A, Massague J. Transforming growth factor /3regulates the expression and structure of extracellularmatrix chondroitin/dermatan sulfate proteoglycans. /Biol Chem. 1988;263:3039-3045.
Aging Studies on Normal LensUsing the ScheimpflugSlit-Lamp CameraKay oho Kashima,* Benes L. Trus,\ Michael Unser,%Paul A. Edwards,* and Manuel B. Datiles*
Purpose. To study the changes in density and thicknessin normal lenses related to aging, and to study changesin anterior chamber depth related to aging.
Methods. Eighty nine normal volunteers (ages 9-80 yr)were examined and their eyes were photographed toobtain Scheimpflug photographs. The images were dig-itized and linear densitometry was performed, dividingthe lens into five areas: posterior capsular (area 1), pos-terior cortical (area 2), nuclear (area 3), anterior corti-cal (area 4), and anterior capsular (area 5). Total lensthickness and anterior chamber depth were similarly
From the * Cataract and Corneal Diseases Section, Ophthalmic Geneticsand Clinical. Services Branch, National Eye Institute, the ̂ ComputerSystems Laboratoiy, Division of Computer Research and Technology, andthe XBiomedical Engineering and Instrumentation Program, NationalInstitutes of Health, Bethesda, Maryland.Submitted for publication: January 31, 1991; accepted July 23, 1992.Proprietary Interest Category: N.Reprint requests: Manuel B. Datiles, Cataract & Cornea Section,OCCSB, NEI-NIH, 9000 Rockville Pike, Bldg. 10, Rm. I0N226,Bethesda, MD 20892.
measured for 90 normal eyes from the densitometryprofiles. These were correlated with age.
Results. There was a strong positive correlation betweenincreasing age and the density in all lens areas (area 2: r= 0.805; P < 0.0001; area 3: r = 0.836, P < 0.0001;area 4: r = 0.767, P < 0.0001; and area 5: r = 0.319, P< 0.0023), except the posterior capsular area, wherecorrelation was negative (area 1: r = —0.426; P< 0.0001). In addition, there was a significant correla-tion between age and overall lens thickness (r = 0.756;P < 0.0001), thickness of nucleus (r = 0.543; P< 0.0001), and cortex (r = 0.632; P < 0.0001), and anegative correlation with anterior chamber depth (r= -0.513, P< 0.0001).
Conclusion. This report shows human lens changes indensity and thickness correlated with aging usingScheimpflug photography and image analysis tech-niques. The results will aid future development of sys-tems for automated detection, classification, and moni-toring of human cataracts, as well as other anteriorsegment disorders. Invest Ophthalmol Vis Sci. 1993;34:263-269.
With aging, the normal human lens changes in densityas well as thickness. It is important to study and docu-ment these normal age-related changes to distinguishthese from pathologic changes such as cataract forma-

264 Investigative Ophthalmology & Visual Science, January 1993, Vol. 34, No. 1
tion. These changes have not been documented quanti-tatively in a broad age range. Hockwin et al12 reportedage-related transparency changes using the Scheimp-Hug camera. They performed linear densitometry atthe central axis of the lens and superimposed theirresults for two age groups (30-40 yr and 50-60 yr)and demonstrated by visually comparing the densitom-etry graph profiles that the older age generally showedhigher density profiles. However, no statistical analysiswas performed on any of the numerical data.
We developed a system using the ScheimpflugTopcon SL-45 camera and image processing tech-niques to quantitate, document, and analyze humanlens density changes sensitively and objectively, usinglinear microdensitometry through the central axis ofthe lens.34 Therefore, we used the same system withwhich we analyzed the cataractous change to statisti-cally study the aging change on normal lenses in abroad age range.
Anterior chamber depth and lens thicknesschanges also are associated with aging, and importantinformation can be obtained with the Scheimpflugcamera. Good photographic results are influenced bythe lens thickness, even with maximum pupillary dila-tion. Charles et al5 measured lens thickness withBrown's Scheimpflug camera and showed the age-de-pendent increase of the lens thickness directly fromthe 35 mm photographs. They analyzed a wide rangeof age groups—from about 10-80 yr—and plotted aregression line, but did not analyze normal subjectsand cataractous eyes separately. Hockwin et al6 ana-lyzed changes in lens thickness with linear densitome-try profiles in cataractous patients aged 10-89 yr whowere divided into several age groups and cataract typesand compared the change in each group. Karino et al7
measured the thickness of the lenses in normal sub-jects 6-79 yr old with a grid system overlaid on theScheimpflug photographs and compared the findingsfrom different age groups by decades.
We conducted a study wherein we analyzed thechange in the thickness of the lens and anteriorchamber depth in normal eyes with the new image anal-ysis technique using densitometry profiles of Scheimp-flug images. We then performed a correlation analysiswith age. This data then could be used as a factor whencalculating quantitative changes in cataractous lensesover time.
MATERIALS AND METHODS. For the lenstransparency study, 89 normal volunteer lenses werephotographed with the Topcon SL-45 Scheimpflugcamera (Topcon America Corp., Paramus, NJ) aftermaximal dilation with 2.5% phenylephrine and 1%tropicamide ophthalmic solution. All eyes had 20/20best corrected vision without pathologic findings onslit-lamp biomicroscopy and fundus examination. In-formed consent was obtained from all volunteers in
this study. All volunteers were part of a National EyeInstitute Intramural Review Board-approved proto-col. Tenets of the Declaration of Helsinki regardinghuman subjects were followed. Patients with any his-tory of eye injury or systemic disorders were excluded.It was difficult getting normal volunteers older than60 yr or younger than 10 yr of age, because most pa-tients over 60 had opacities and those in the lattergroup had difficulty keeping still and fixing on thetarget. Eighteen photographs were taken from 90° to—90° (a 360° sweep around the central axis of the lensof the eye) at 10° intervals for each lens. Four of theimages from the 18 sets of photographs (approxi-mately equally spaced between 90° and —90°) wereselected. They then were digitized as previously re-ported3 using the Perkin Elmer 1010MG microdensi-tometer (Perkin-Elmer Corp., Garden Grove, CA) andanalyzed with a VAX8350 computer (Digital Equip-ment Corp., Maynard, MA) using specially developedsoftware. The four densitometry profiles from eachlens were averaged and the average optical densityvalue was calculated for each of five areas of everylens. These areas were determined based on densitom-etry peaks that represent posterior capsular area (area1), posterior cortical area (area 2), nuclear area (area3), anterior cortical area (area 4), and anterior capsu-lar area (area 5; Fig. 1). An average optical densityprofile was obtained for the different age groups andplotted. Correlation analysis was done for each meandensity of each of the areas.
For the lens thickness and anterior chamber depthanalysis, 90 normal lenses were photographed, andone of the views for each lens was digitized. The an-teroposterior thickness of the whole lens, the nucleus,
Area Determination
1.1
1.0
0.9
0.8
0.7
0.6
0.5
0.4
0.3
0.2
0.1
0
c
cCD
o
aO
—
—,_CO
— 2?CD
cCO
CD
/ —
|
COCO<DCO ^
. — ^
s ^
1 1 1 1 1 1
COcuCD
r\/ \I \' \
\\
inCOCU
CD
A/1/
I
0 0.1 0.2 0.3 0.4 0.5 0.6 0.7 0.8 0.9 1.0
Posterior Location in Lens Anterior
FIGURE l. Diagram of lens profiles used for area determina-tion in lens clarity. Area 1 = posterior capsule; area 2 = pos-terior cortex; area 3 = nucleus; area 4 = anterior cortex;area 5 = anterior capsule.
Reports ffii
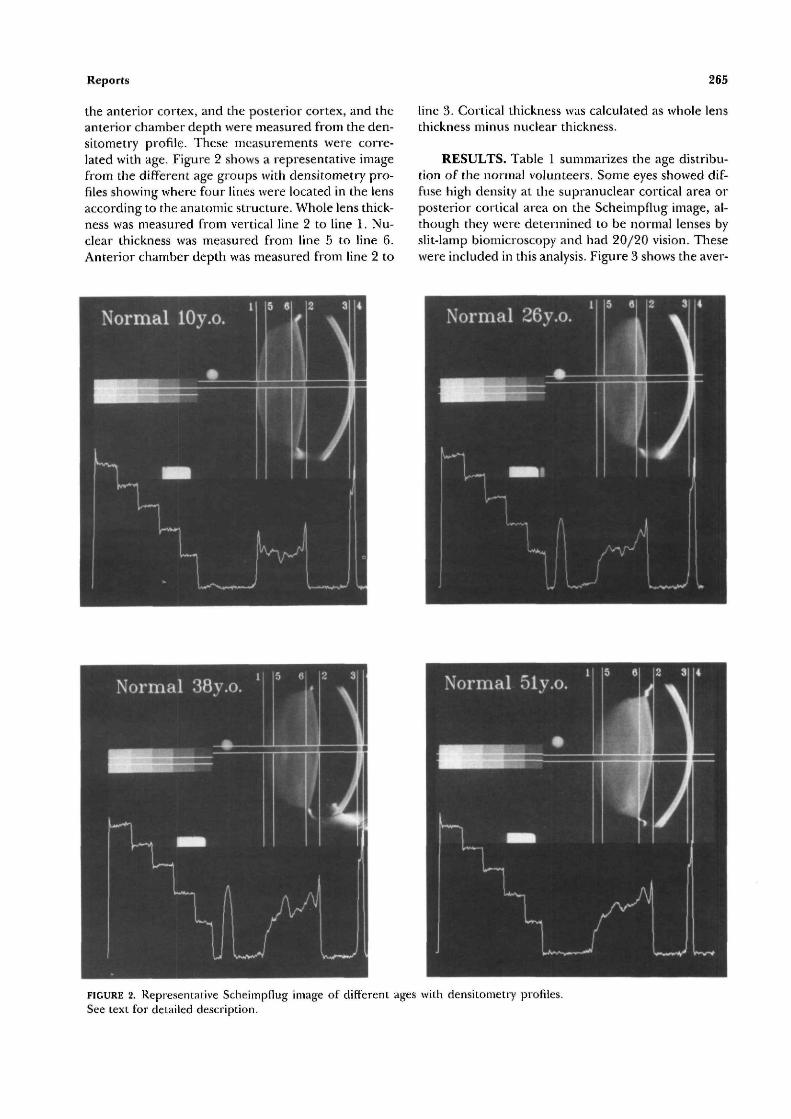
the anterior cortex, and the posterior cortex, and theanterior chamber depth were measured from the den-sitometry profile. These measurements were corre-lated with age. Figure 2 shows a representative imagefrom the different age groups with densitometry pro-files showing where four lines were located in the lensaccording to the anatomic structure. Whole lens thick-ness was measured from vertical line 2 to line 1. Nu-clear thickness was measured from line 5 to line 6.Anterior chamber depth was measured from line 2 to
line 3. Cortical thickness was calculated as whole lensthickness minus nuclear thickness.
RESULTS. Table 1 summarizes the age distribu-tion of the normal volunteers. Some eyes showed dif-fuse high density at the supranuclear cortical area orposterior cortical area on the Scheinipflug image, al-though they were determined to be normal lenses byslit-lamp biomicroscopy and had 20/20 vision. Thesewere included in this analysis. Figure 3 shows the aver-
FICURE 2. Representative Scheinipflug image of different ages with densitometry profiles.See text for detailed description.
266 Investigative Ophthalmology & Visual Science, January 1993, Vol. 34, No. 1
Average Densitometry Profilesfor Each Age Group
0 0.1
Posterior
0.2 0.3 0.4 0.5 0.6
Location in Lens
0.7 0.8 0.9 1.0
Anterior
FIGURE 3. Average densitome-try profiles plot for eacli agegroup.
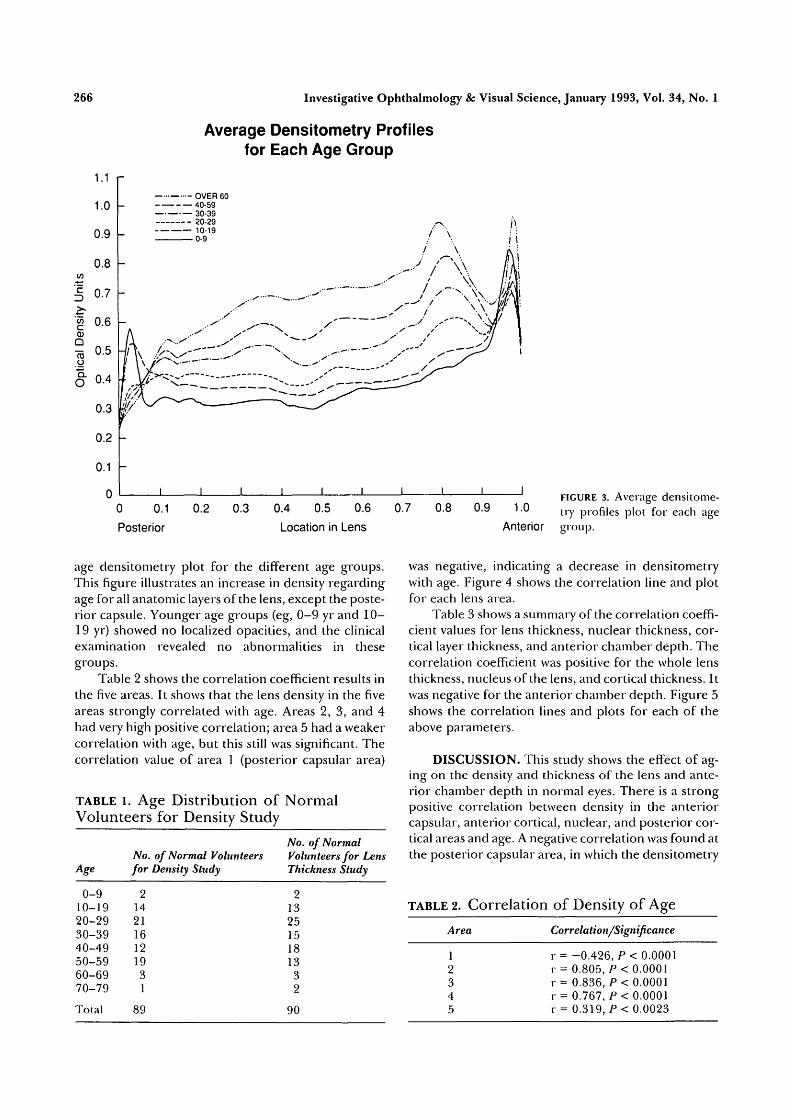
age densitometry plot for the different age groups.This figure illustrates an increase in density regardingage for all anatomic layers of the lens, except the poste-rior capsule. Younger age groups (eg, 0-9 yr and 10-19 yr) showed no localized opacities, and the clinicalexamination revealed no abnormalities in thesegroups.
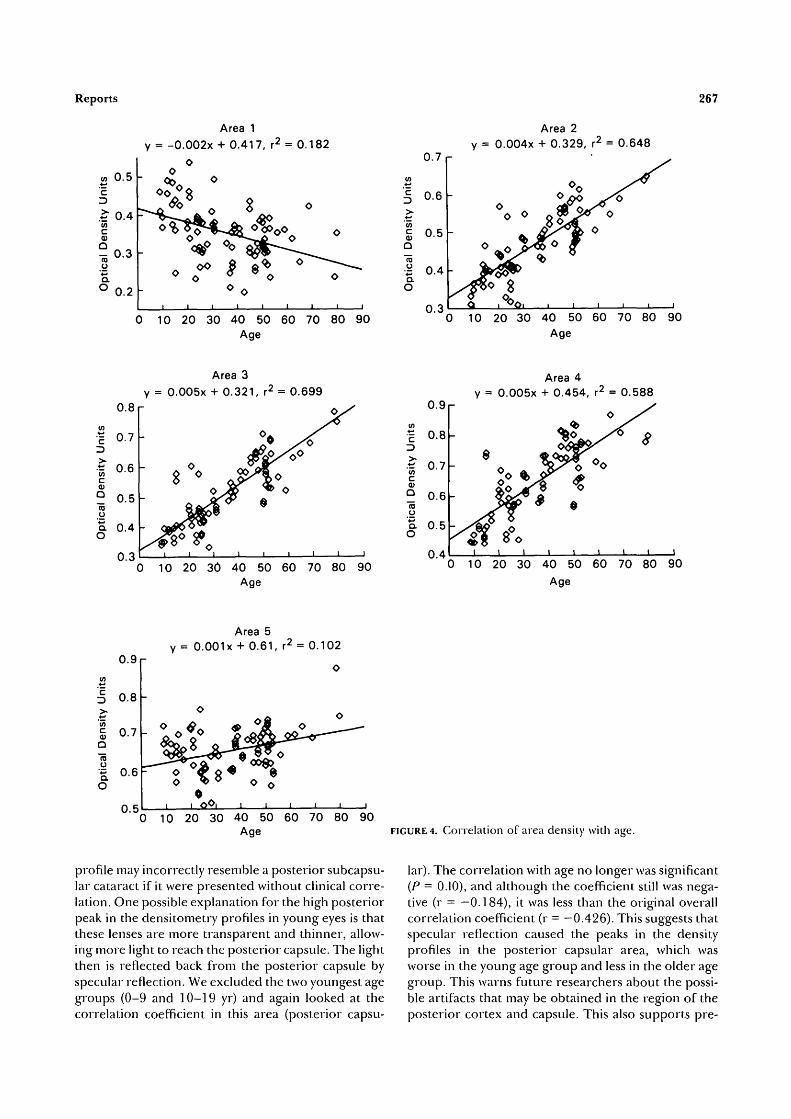
Table 2 shows the correlation coefficient results inthe five areas. It shows that the lens density in the fiveareas strongly correlated with age. Areas 2, 3, and 4had very high positive correlation; area 5 had a weakercorrelation with age, but this still was significant. Thecorrelation value of area 1 (posterior capsular area)
TABLE l. Age Distribution of NormalVolunteers for Density Study
No. of NormalVolunteers for Lens
Age for Density Study Thickness StudyNo. of Normal Volunteersfor Density Study
0-910-1920-2930-3940-4950-5960-6970-79
2142116121931
Total 89
2132515181332
90
was negative, indicating a decrease in densitometrywith age. Figure 4 shows the correlation line and plotfor each lens area.
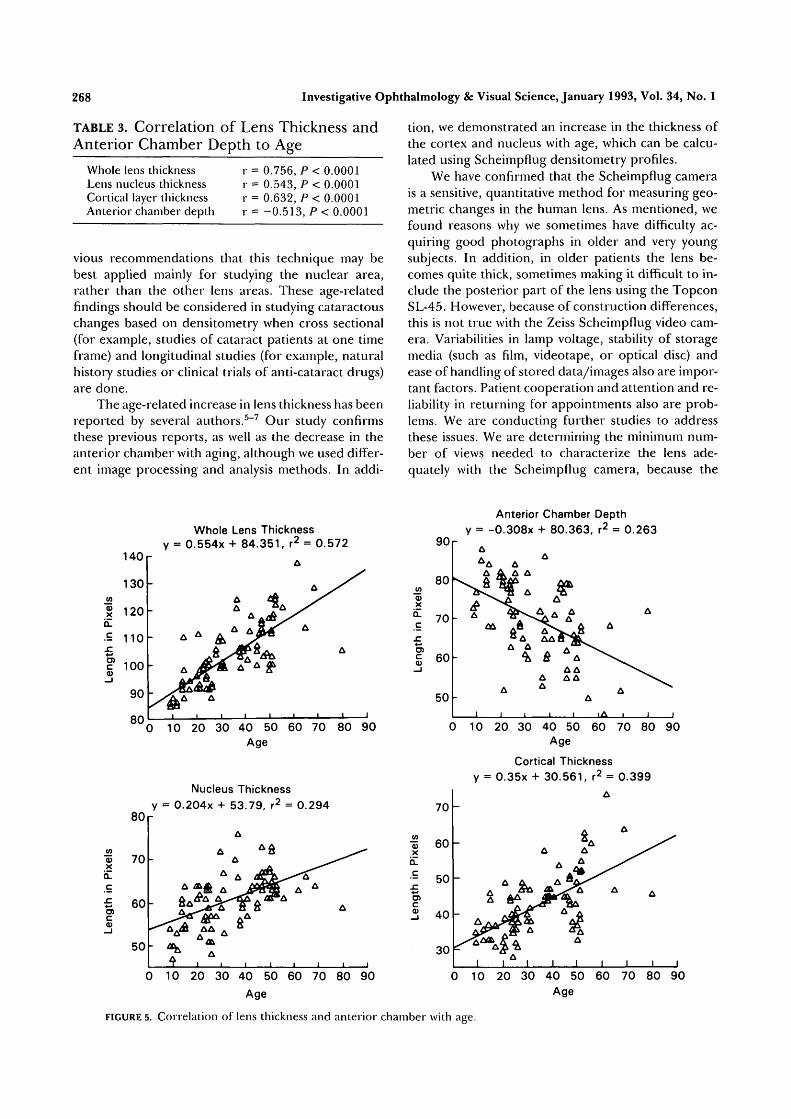
Table 3 shows a summary of the correlation coeffi-cient values for lens thickness, nuclear thickness, cor-tical layer thickness, and anterior chamber depth. Thecorrelation coefficient was positive for the whole lensthickness, nucleus of the lens, and cortical thickness. Itwas negative for the anterior chamber depth. Figure 5shows the correlation lines and plots for each of theabove parameters.
DISCUSSION. This study shows the effect of ag-ing on the density and thickness of the lens and ante-rior chamber depth in normal eyes. There is a strongpositive correlation between density in the anteriorcapsular, anterior cortical, nuclear, and posterior cor-tical areas and age. A negative correlation was found atthe posterior capsular area, in which the densitometry
TABLE 2. Correlation of Density of Age
Area Correlatio n/Significance
r = -0.426, P < 0.0001r = 0.805, P< 0.0001r = 0.836, P< 0.0001r = 0.767, P< 0.0001r = 0.319, P< 0.0023
Reports 267
(A4-»
ensi
ty
Uni
ptic
a
O
V
0.5
0.4
0.3
0.2
-
;—
-
-
= -0
0
t*0
.002x -0
0
8
0 .
<*$oo
o
1 1
Area 1f 0
O/v
9o
417, r2 =
sl ^ o o
oi i
0.182
o
>
°o
o
( 0
ensi
ty U
ni
Q
ptic
a
O
0.
0
0
0
n
7
6
5
4
3
y= 0
O
Cx
.004x
o o
%
Area 2+ 0.329,
©
55 o no>
r2 = 0.648
o
1 1 1
0 10 20 30 40 50 60 70 80 90Age
0 10 20 30 40 50 60 70 80 90Age
0.8
| 0.7
1 0.6
2 0.5oa 0.4O
0.3
Area 3
y = 0.005x + 0.321, r2 = 0.699
0 10 20 30 40 50 60 70 80 90Age
0.9
~ 0.8
c03Q 0.6
o. 0.5O
0.4
Area 4y = 0.005x + 0.454, r2 = 0.588
0 10 20 30 40 50 60 70 80 90Age
0.9
D 0.8
V)
g 0.7Q
I 0.6o
0.5
Area 5y = 0.001x + 0.61, r2 = 0.102
0 10 20 30 40 50 60 70 80 90Age FIGURE 4. Correlation of area density with age.
profile may incorrectly resemble a posterior subcapsu-lar cataract if it were presented without clinical corre-lation. One possible explanation for the high posteriorpeak in the densitometry profiles in young eyes is thatthese lenses are more transparent and thinner, allow-ing more light to reach the posterior capsule. The lightthen is reflected back from the posterior capsule byspecular reflection. We excluded the two youngest agegroups (0-9 and 10-19 yr) and again looked at thecorrelation coefficient in this area (posterior capsu-
lar). The correlation with age no longer was significant(P = 0.10), and although the coefficient still was nega-tive (r = —0.184), it was less than the original overallcorrelation coefficient (r = —0.426). This suggests thatspecular reflection caused the peaks in the densityprofiles in the posterior capsular area, which wasworse in the young age group and less in the older agegroup. This warns future researchers about the possi-ble artifacts that may be obtained in the region of theposterior cortex and capsule. This also supports pre-
268 Investigative Ophthalmology & Visual Science, January 1993, Vol. 34, No. 1
TABLE 3. Correlation of Lens Thickness andAnterior Chamber Depth to Age
Whole lens thicknessLens nucleus thicknessCortical layer thicknessAnterior chamber depth
r = 0.756, P< 0.0001r = 0.543, P < 0.0001r = 0.632, P< 0.0001r = -0.513, P< 0.0001
vious recommendations that this technique may bebest applied mainly for studying the nuclear area,rather than the other lens areas. These age-relatedfindings should be considered in studying cataractouschanges based on densitometry when cross sectional(for example, studies of cataract patients at one timeframe) and longitudinal studies (for example, naturalhistory studies or clinical trials of anti-cataract drugs)are done.
The age-related increase in lens thickness has beenreported by several authors.5"7 Our study confirmsthese previous reports, as well as the decrease in theanterior chamber with aging, although we used differ-ent image processing and analysis methods. In addi-
tion, we demonstrated an increase in the thickness ofthe cortex and nucleus with age, which can be calcu-lated using Scheimpflug densitometry profiles.
We have confirmed that the Scheimpflug camerais a sensitive, quantitative method for measuring geo-metric changes in the human lens. As mentioned, wefound reasons why we sometimes have difficulty ac-quiring good photographs in older and very youngsubjects. In addition, in older patients the lens be-comes quite thick, sometimes making it difficult to in-clude the posterior part of the lens using the TopconSL-45. However, because of construction differences,this is not true with the Zeiss Scheimpflug video cam-era. Variabilities in lamp voltage, stability of storagemedia (such as film, videotape, or optical disc) andease of handling of stored data/images also are impor-tant factors. Patient cooperation and attention and re-liability in returning for appointments also are prob-lems. We are conducting further studies to addressthese issues. We are determining the minimum num-ber of views needed to characterize the lens ade-quately with the Scheimpflug camera, because the
140
130
Q.
•S 110s:
? 100
90
80
Whole Lens Thicknessy = 0.554x + 84.351, r2 = 0.572
A
0 10 20 30 40 50 60 70 80 90Age
Nucleus Thicknessy = 0.204x + 53.79, r2 = 0.294
.c*->Oi
c0)
70
60
50
A
A
A
A
AB& AffAA^
" ^
AA ^
i i
A
A
A
8
A
ift'
ft ^ ^
A
i i i i
Anterior Chamber Depthy = -0.308x + 80.363, r2 = 0.263
80a>x
SL
f, 60
50 -
A ^
i i i
A
AAt
&
AA
i
AA
A
AAAA
A
i \ l
A
A
S. \ 1 1
0 10 20 30 40 50 60 70 80 90Age
Cortical Thicknessy = 0.35x + 30.561, r2 = 0.399
xels
i in
Pi
x;O)0)
_J
70
60
50
40
30
-
-
_
A
A, y y .
I
A A
A * A
1 1
KA A
A ^A ^ A
^ A
" AA
1 1
A
A
A A
1 1 10 10 20 30 40 50 60 70 80 90
Age
FIGURE 5. Correlation of lens thickness and anterior chamber with age.
0 10 20 30 40 50 60 70 80 90Age
Reports 269
current practice of using one view may be enough fornormal lenses but not for cataracts. We also are devel-oping new computer hardware and software using theMAC computer with an improved optical disc storagesystem to resolve image storage and recall problems.In addition, we are using a video camera on theScheimpflug to decrease variability resulting from filmbatches and development and to negate the need todigitize films.
We are developing standards for "live" on-linevideo digitization, so one can accept or reject an imageas acceptable or not while the patient is available. Thevideo images may be calibrated to optical density units,and a method can be devised and standardized to allowprecise comparisons between images obtained usingvarious levels of illumination to solve the problem ofvariability in lamp voltage. This is needed, because cat-aracts that grow denser over time will get overexposedif the illumination is subsequently not reduced. Re-sults of these studies will be presented in future re-ports.
This report presents a quantitative analysis of hu-man lens changes in density and thickness correlatedwith aging using the Topcon Scheimpflug camera andimage analysis techniques. The measurements weredone using semi-automated computer image process-ing, and the numerical data were analyzed statistically.The results will assist the future development of sys-tems for automated detection, classification, and mon-itoring of human cataracts, as well as other anteriorsegment disorders.
Key Words
age-related lens changes, anterior chamber depth, cataract,lens thickness, ScheimpHug camera
References
1. Hockwin O, Dragomirescu V, Laser H. Measurementof lens transparency or disturbances by densitometricimage analysis of Scheimpflug photographs. GraefesArch Clin Exp Ophthalmol. 1982;219:225-262.
2. Hockwin O, Dragomirescu V, Laser H, Lerman S:Age-related changes in normal and cataractous hu-man lens density obtained by microdensitoinetricimage analysis of ScheimpHug photographs. Lens Res.1983; 1:207-220.
3. Datiles M, Edwards P, Trus BL, Green S: In vivo stud-ies on cataract using Scheimpflug slit lamp camera.Invest Ophthalmol Vis Set. 1987;28:1707-1710.
4. Edwards P, Datiles M, Unser M, Trus B, Friedlin V,Kashima K: Computerized cataract detection and clas-sification. Cwr Eye Res. 1990;9:51 7-524.
5. Charles MW and Brown N: Dimension of the humaneye relevant to radiation. Phys Med Bud. 1975;20:202-218.
6. Hockwin O, Weigelin E, Laser H, and DragomirescuV: Biometry of the anterior eye segment by Scheimp-flug photography. Ophthalmic Res. 1983; 15:102-108.
7. Karino H, Yokoyama H, Sakamoto Y, and Sasaki K:Age-related changes in the thickness of the lens anddepth of the anterior chamber. Folia OphthnbnologicaJaponica. 1983;34:81 3-81 7.
The Effects of Acetazolamide onVisual Function in RetinitisPigmentosaVivienne C. Greenstein, Karen Holopigian, Elizabeth Siderides,William Seiple, and Ronald E. Carr
Purpose. To study the effects of acetazolamide on cen-tral and peripheral visual function in patients with reti-nitis pigmentosa (RP) who showed no evidence of macu-lar edema.
From the Department of Ophthalmology, New York University MedicalCenter, New York, New York.Supported by grants from the National Retinitis Pigmentosa FoundationFighting Blindness, Baltimore, Maryland, the National Eye Institute(ROI-EY02115), and Research to Prevent Blindness Inc, New York,New York.Submitted for publication: March 16, 1992; accepted July 9, 1992.Proprietary interest categoiy: N.Reprint requests: Vivienne C. Greenstein, Department of Ophthalmology,NYU Medical Center, 550 First Avenue, New York, NY 10016.
Methods. Thirteen patients with retinitis pigmentosaparticipated in a preliminary study. Measures of centraland peripheral visual function were obtained beforeand after an 8 wk period on acetazolamide. An addi-tional 10 patients participated in a cross-over study.They were placed on a placebo for an 8 wk period, thenon acetazolamide for a second 8 wk period.
Results. None of the patients in the preliminary studyshowed significant changes in visual acuity, color vision,foveal cone pathway sensitivities, focal electroretino-gram (ERG) amplitudes, or in any ERG parameter.Three patients, however, showed significant changes invisual field area and in dark-adapted thresholds. Noneof the patients in the cross-over study showed signifi-cant increases in visual field area.
Conclusions. Given the results and the reports of side-effects, it is difficult to justify using acetazolamide toimprove retinal function in RP patients who show noevidence of cystoid macular edema. Invest OphthalmolVisSci. 1993;34:269-273.