Construction and initial operation of MHD PbLi facility at UCLA

STATE OF THE SERVICE
REPORT 2017–18
State
of th
e S
ervice
Re
po
rt 2017-18

State
of th
e S
ervice
Re
po
rt 2017-18

1 State of the Service Report 2017-18
CONTENTS TRANSMITTAL CERTIFICATE .......................................................................................................... 4
FOREWORD .................................................................................................................................. 5
B. ORGANISATIONAL OVERVIEW AND PERFORMANCE .................................................................. 8
B.1 Organisational Overview ............................................................................................................... 8
Head of Service ................................................................................................................................ 9
Summary of Key Work, Working Arrangements and Core Focus during 2017-18 ........................ 10
2017-18 Significant Awards and Recognition ................................................................................ 13
B.2 Performance Analysis – Workforce Strategies ............................................................................ 17
Respect, Equity and Diversity Framework ..................................................................................... 17
Aboriginal and Torres Strait Islander Framework and People with Disability Employment Framework .................................................................................................................................... 17
Employment of People with Disability in the ACTPS ..................................................................... 18
Workforce Capability ..................................................................................................................... 19
Activity Based Work in the ACTPS ................................................................................................. 21
Revised Executive Structure .......................................................................................................... 22
ACT Government Veterans Employment Strategy ........................................................................ 22
Industrial Relations and Enterprise Agreements .......................................................................... 23
A Commitment to Better Communications and Engagement ...................................................... 23
Establishment of the ACT Centre of Data Excellence (the Centre) ............................................... 25
Reportable Conduct Scheme ......................................................................................................... 26
Work Safety, Rehabilitation and Workers’ Compensation ........................................................... 27
Contractor Central – Contingent Labour System .......................................................................... 28
Ethical Behaviour, Professional Standards and Complaint Management ..................................... 29
Establishment of the ACT Integrity Commission ........................................................................... 29
B.8 Human Resources Management ................................................................................................. 31
ACT Public Sector Development Programs ................................................................................... 31
APPENDIX 1 – COMPLIANCE STATEMENT .................................................................................... 33
Part 1 Directions Overview ................................................................................................................ 33
ISSN 2205-8281
© Australian Capital Territory, Canberra 2018
This publication is subject to copyright. Except as permitted under the Copyright Act 2003, no part of it may in any form or by any means (electronic, mechanical, microcopying, photocopying, recording or otherwise) be reproduced, stored in a retrieval system or transmitted without prior written permission. Enquiries should be addressed to the Territory Records Office, ACT Government, GPO Box 158 Canberra City ACT 2601.
First published October 2018
For further information please contact: ACT Public Service Head of Service. Chief Minister, Treasury and Economic Development Directorate. Phone: +61 (02) 6205 0241 Website: www.act.gov.au
Designed and typeset by: ACTPS Shared Services GPO Box 158 Canberra City ACT 2601
AccessibilityThe ACT Government is committed to making its information, services, events and venues accessible to as many people as possible. If you have difficulty reading a standard printed document and would like to receive this publication in an alternative format – such as large print and audio – please call the Canberra Blind Society on (02) 6247 4580.
If English is not your first language and you require the translating and interpreting service, please call the Telephone Interpreter Service on 131 450. If you are deaf or hearing impaired and require assistance, please call the National Relay Service on 133 677.
This report is also available online at www.cmd.act.gov.au
© Australian Capital Territory, Canberra, October 2018 Material in this publication may be reproduced provided due acknowledgement is made. Publication No 18/1055 Printed on recycled paper.

1 State of the Service Report 2017-18
CONTENTS TRANSMITTAL CERTIFICATE .......................................................................................................... 4
FOREWORD .................................................................................................................................. 5
B. ORGANISATIONAL OVERVIEW AND PERFORMANCE .................................................................. 8
B.1 Organisational Overview ............................................................................................................... 8
Head of Service ................................................................................................................................ 9
Summary of Key Work, Working Arrangements and Core Focus during 2017-18 ........................ 10
2017-18 Significant Awards and Recognition ................................................................................ 13
B.2 Performance Analysis – Workforce Strategies ............................................................................ 17
Respect, Equity and Diversity Framework ..................................................................................... 17
Aboriginal and Torres Strait Islander Framework and People with Disability Employment Framework .................................................................................................................................... 17
Employment of People with Disability in the ACTPS ..................................................................... 18
Workforce Capability ..................................................................................................................... 19
Activity Based Work in the ACTPS ................................................................................................. 21
Revised Executive Structure .......................................................................................................... 22
ACT Government Veterans Employment Strategy ........................................................................ 22
Industrial Relations and Enterprise Agreements .......................................................................... 23
A Commitment to Better Communications and Engagement ...................................................... 23
Establishment of the ACT Centre of Data Excellence (the Centre) ............................................... 25
Reportable Conduct Scheme ......................................................................................................... 26
Work Safety, Rehabilitation and Workers’ Compensation ........................................................... 27
Contractor Central – Contingent Labour System .......................................................................... 28
Ethical Behaviour, Professional Standards and Complaint Management ..................................... 29
Establishment of the ACT Integrity Commission ........................................................................... 29
B.8 Human Resources Management ................................................................................................. 31
ACT Public Sector Development Programs ................................................................................... 31
APPENDIX 1 – COMPLIANCE STATEMENT .................................................................................... 33
Part 1 Directions Overview ................................................................................................................ 33

2 State of the Service Report 2017-18
Part 2 Directorate and Public Sector Body Annual Report Requirements ........................................ 33
Part 3 Reporting by Exception ........................................................................................................... 33
Part 4 Directorate and Public Sector Body Specific Annual Report Requirements ........................... 34
Part 5 Whole of Government Annual Report .................................................................................... 34
PUBLIC SECTOR STANDARDS COMMISSIONER ANNUAL REPORT 2017-18 ..................................... 36
WORKFORCE COMPOSITION 2017-18 .......................................................................................... 42
Introduction ....................................................................................................................................... 42
ACT Public Service Directorates ........................................................................................................ 42
ACT Public Sector Bodies ................................................................................................................... 42
2018 AGENCY SURVEY ................................................................................................................ 44
Background, Aims and Objectives ..................................................................................................... 44
Methodology ..................................................................................................................................... 44
Development of the Survey Instrument ............................................................................................ 44
Reporting Notes ................................................................................................................................ 45
ACT PUBLIC SERVICE WORKFORCE PROFILE 2017-18 .................................................................... 46
Background, Aims and Objectives ..................................................................................................... 46
Reporting Notes ................................................................................................................................ 46
1. AN AGILE WORKFORCE: MEETING THE NEEDS OF THE ACT COMMUNITY AND EFFECTIVELY SERVING THE GOVERNMENT OF THE DAY ................................................................................... 48
1.1 Attraction and Retention ............................................................................................................. 48
1.2 Age Profile ................................................................................................................................... 51
1.3 Gender Profile ............................................................................................................................. 52
1.4 Part Time Employment ................................................................................................................ 55
2. INNOVATIVE AND RESPONSIVE: PEOPLE PLANNING FOR THE FUTURE ...................................... 58
2.1 Workforce Planning ..................................................................................................................... 58
2.2 Employment Growth ................................................................................................................... 59
2.3 Salary Growth .............................................................................................................................. 61
3. UPHOLDING THE ACT PUBLIC SERVICE VALUES ........................................................................ 63
3.1 Appropriate Workplace Behaviour .............................................................................................. 65
3.2 Discipline Action .......................................................................................................................... 67
3 State of the Service Report 2017-18
3.3 Fraud and Risk ............................................................................................................................. 68
3.4 ACTPS Respect Equity and Diversity (RED) Framework............................................................... 70
4. A DIVERSE WORKFORCE: REFLECTING THE CANBERRA COMMUNITY ........................................ 74
4.1 Aboriginal and Torres Strait Islander Peoples ............................................................................. 75
4.2 People with Disability .................................................................................................................. 81
4.3 Cultural and Linguistic Diversity .................................................................................................. 86
5. AN ENGAGED WORKFORCE: GETTING THE BEST FROM PEOPLE AT WORK ................................ 87
5.1 Performance and Capability Development ................................................................................. 87
5.2 Underperformance ...................................................................................................................... 88
ACT PUBLIC SECTOR WORKFORCE PROFILE 2017-18 .................................................................... 92
ACT Public Sector Bodies ................................................................................................................... 96
Workforce Planning ....................................................................................................................... 97
Attraction and Retention Strategies.............................................................................................. 97
Appropriate Workplace Behaviour ................................................................................................ 98
Disciplinary Action ......................................................................................................................... 99
Fraud and Risk ............................................................................................................................... 99
ACTPS Respect Equity and Diversity (RED) Framework............................................................... 100
Performance and Capability Development ................................................................................. 102
Underperformance ...................................................................................................................... 103
APPENDIX 2 – ACTPS WORKFORCE PROFILE INFORMATION ........................................................ 105
APPENDIX 3 – DEFINITIONS........................................................................................................ 116
APPENDIX 4 – 2018 AGENCY SURVEY ......................................................................................... 119

4 State of the Service Report 2017-18
TRANSMITTAL CERTIFICATE
5 State of the Service Report 2017-18
FOREWORD
As we move toward our 25th year as a public service, I am delighted to provide this year’s State of the Service Report. The ACT Public Service (ACTPS) is a mature, innovative and respected Service made up of a diverse group of Canberrans providing services to their fellow Canberrans.
The unique model of Government in Canberra has allowed the ACTPS to continue to deliver integrated State and municipal functions in ways that are the envy of other jurisdictions and has contributed to Canberra being named the world’s “third most liveable city”. We strive to operate as One Service, delivering comprehensive advice to our Ministers to support them to serve the community, and delivering coherent services directly to the community on their behalf. The ACTPS is a public service that people want to work for because of the opportunity to engage in contemporary and innovative thinking.
As you read this report you will see many examples of teams and individuals being recognised through national and industry awards for the redesign and improvement of services to the ACT community. National awards were achieved in the areas of architecture, civil design, medicine, teaching, marketing, process improvement and innovation, and master planning. In addition Public Service Medals were awarded to the outgoing Public Sector Standards Commissioner, Ms Bronwen Overton-Clarke, the late Dr Karl Alderson, and recently retired Mr Phillip Green for their outstanding public service.
Our multi-level Whole of Government Communication and Engagement Strategy has seen significant improvement in the community feeling engaged and listened to. In 2015, 58 per cent of the ACT community felt well informed. In 2018 it is now 78 per cent. This level of engagement has ensured our response to consultation is relevant and delivers on community expectations.
Data analytics and data management present significant opportunities to take our advice to Ministers and service to the community to a new level. Data analytics has the potential to help identify new perspectives on complex problems and improve outcomes.
During 2017-18, the Office of the Chief Digital Officer established the ACT Centre of Data Excellence which will contribute to the delivery of better services for the community and improved evidence based decision-making. In addition, the ACT Digital Services platform was established and will enable people to access multiple ACT government services easily via their mobile phone.
We have continued a focus on strengthening the capability of our workforce by building the diversity of the ACTPS to ensure we are truly reflective of the community we serve. This year we saw continued growth in the number of Aboriginal and Torres Strait Islander employees from 350 to 380 employees. We also saw the number of employees who identify with disability increase from 521 to 565.
An ACT Government Veterans’ Employment Strategy was launched in September 2017 which paves the way to assist veterans in gaining employment with the ACTPS while attracting highly skilled staff to the Service. The Office for LGBTIQ Affairs was also established to coordinate a whole of government approach for promoting Canberra as the most LGBTIQ friendly city in the country. These are indicators of the inclusive public service we strive to be.

6 State of the Service Report 2017-18
Canberrans can be proud of their Public Service. We have come a long way since 1994 and continue to go from strength to strength. I look forward to joining with the community and the broader public sector to celebrate 25 years in 2019. Kathy Leigh Head of Service October 2018
HEAD OF SERVICE
ANNUAL REPORT 2017-18

8 State of the Service Report 2017-18
B. ORGANISATIONAL OVERVIEW AND PERFORMANCE
B.1 Organisational Overview The ACT Public Service (ACTPS) manages the responsibilities of the ACT Government and provides our community with responsive and accessible services for the benefit of all Canberrans.
On 1 July 2017, the Administrative Arrangements 2017 (No. 1) issued by the Chief Minister came into effect. These arrangements reflect the ACT Government’s commitment to the following priorities:
health and education;
suburban renewal and better transport;
economic growth and diversification; and
enhancing liveability and social inclusion.
The ACTPS is divided into seven directorates. Each directorate specialises in different functions for the ACT Government. The directorates are arranged into clusters to strengthen our performance as a Service. The clusters emphasise key collaborative relationships.
For 2017-18:
Strengthening governance and promoting opportunity cluster consisted of: Chief Minister, Treasury and Economic Development Directorate (CMTEDD); and Justice and Community Safety Directorate (JACSD);
Supporting our community cluster consisted of: Community Services Directorate (CSD); Health Directorate (HD); and Education Directorate (EDU); and
Enhancing our city cluster consisted of: Environment, Planning and Sustainable Development Directorate (EPSDD); and Transport Canberra and City Services Directorate (TCCSD).
In addition to these directorates, there are a number of specialised agencies that form part of the broader ACT Public Sector.
The Head of Service is responsible for overarching management of the ACTPS. The position provides direction and coordination across the ACTPS on policy and strategy.
9 State of the Service Report 2017-18
Head of Service Section 31 of the Public Sector Management Act 1994 (the PSM Act), provides that the Chief Minister may engage an eligible person as the Head of Service. Under section 17 of the PSM Act, the Head of Service has leadership functions across the ACTPS in relation to:
developing, overseeing the implementation of, coordinating and providing advice and reports to the Chief Minister about Whole of Government strategies;
providing direction across the Service in relation to critical or potentially critical issues;
promoting cooperation and collegiality within and between administrative units;
promoting and upholding in the ACTPS the public sector values, the public sector principles and the conduct required of a public servant, including by personal example.
In addition, the Head of Service has a number of management functions under the PSM Act and the Public Sector Management Standards 2016 (the PSM Standards) which include:
engaging, appointing and employing people on behalf of the Territory in accordance with the merit and equity principle;
organising public servants in the ACTPS;
providing advice and reports to the Chief Minister about employment in the ACTPS; and
any other function given to the Head of Service by the Chief Minister.
The Head of Service also holds powers and/or obligations under the following legislation:
Board and Senior Secondary Studies Act 1997;
Cemeteries and Crematoria Act 2003;
Children and Young People Act 2008;
City Renewal Authority and Suburban Land Agency Act 2017;
Crimes (Sentence Administration) Act 2005;
Director of Public Prosecutions Act 1990;
Government Procurement Act 2001;
Inquiries Act 1991;
Inspector of Correctional Services Act 2017;
Judicial Commission 1994;
Law Officers Act 2011;
Long Service Leave (Portable Schemes) Act 2009;
Planning and Development Act 2007;
Remuneration Tribunal Act 1995; and
Royal Commissions Act 1991.
These powers have been delegated as appropriate to relevant Directors-General.
The Head of Service is also the Principal Officer under the Territory Records Act 2002. This involves ensuring that the ACTPS complies with the Territory Records Act in relation to its records. The key compliance mechanism established by the Territory Records Act is the development of a Records Management Program, which is intended to ensure that directorates and agencies have policies, procedures and resources in place to adequately manage the records of their activities.

10 State of the Service Report 2017-18
The Principal Officer powers have been delegated to Directors-General.
The Head of Service is also the Director-General, Chief Minister, Treasury and Economic Development Directorate and has responsibilities of a Director-General under section 19 of the PSM Act.
How the Role was occupied during 2017-18
The role of the Head of Service was occupied by Ms Kathy Leigh, who also served as the Director-General of the Chief Minister, Treasury and Economic Development Directorate (CMTEDD) for the reporting period.
The role of Head of Service was occupied by Mr David Nicol, Under Treasurer, who also served as Director-General CMTEDD from 17 January 2018 to 28 January 2018, and 21 February 2018 to 2 March 2018.
Summary of Key Work, Working Arrangements and Core Focus during 2017-18
2017-18 Priorities
The focus for the Head of Service over 2017-18 was to:
continue to build the capability of the ACTPS;
ensure a continued focus on good governance;
further promote collaboration and the sharing of knowledge and resources;
support the development of the executive cohort; and
encourage, support and develop the diversity of our workforce including Aboriginal and Torres Strait Islander Peoples, People with Disability, and Lesbian, Gay, Bisexual, Transgender, Intersex and Queer (LGBTIQ) employees to further build an agile, responsive and innovative public service.
This was achieved by:
the continued roll out of workforce planning tools to support directorates and line areas in their future planning;
implementing work policies that allow flexible movement of executives and practical flexible working arrangements for all employees to support a more productive and engaged workforce;
continuing to consult and partner with Pride in Diversity, the Australian Network on Disability (AND), and the Aboriginal and Torres Strait Islander Elected Body to foster positive workplace cultures; and
supporting existing initiatives to increase diversity in the ACTPS while engaging new opportunities such as Australian School Based Apprenticeships (ASBAs) and the internship program.
Aboriginal and Torres Strait Islander Reporting
The focus on Aboriginal and Torres Strait Islander employment continued to be championed by the Head of Service and all Directors-General throughout the 2017-18 reporting period. The range of programs, projects and initiatives included:
the continuation of the Aboriginal and Torres Strait Islander Vocational Employment Program (previously the Aboriginal and Torres Strait Islander Traineeship);
11 State of the Service Report 2017-18
the launch of the ACTPS Aboriginal and Torres Strait Islander Employment Framework in September 2017;
cultural awareness training for employees; and
provision of individual support and pastoral care for Aboriginal and Torres Strait Islander trainees and graduates along with support, assistance and guidance for work areas.
Further information is provided in section B.2 (Performance Analysis).
Significant Committees and their Roles
Strategic Board
The Head of Service is the chair of the Strategic Board, comprising all Directors-General and other Whole of Government roles, including the Deputy Director-General, Workforce Capability and Governance, the Deputy Director-General, Policy and Cabinet and the Chief Digital Officer. The Strategic Board provides Whole of Government leadership and strategic direction to the ACTPS, including in relation to the management and development of the workforce. Strategic Board meetings are held on a fortnightly basis.
The Strategic Board is the peak ACTPS forum which leads the delivery of cross-directorate and strategic issues. It takes a Whole of Government strategic approach to its role.
The Strategic Board strives to aid the delivery of Government priorities and policies through:
defining and driving the ACTPS forward agenda in line with Government priorities;
building the capacity and capability of ACTPS employees;
promoting an inclusive, collaborative, and cooperative culture within the ACTPS; and
ensuring the operation of proper governance and accountability arrangements across the ACTPS.
The priority areas for the Strategic Board during 2017-18 were to: a) drive the growth and diversification of the ACT economy (including by reforming our regulatory
approach); b) lead the digital transition in the ACT; c) drive social inclusion and domestic violence prevention and responses; d) position the ACT within the region and nation; e) (1) build an agile, streamlined and engaged ACT Public Service;
(2) create agile procurement processes and deliver on capital works in a timely manner; and f) support the Government to engage the ACT community.
Joint Council
The Head of Service, or their delegate, co-chairs the ACTPS Joint Council (Joint Council) with the unions. Established under the PSM Act, Joint Council is the peak union and management consultative committee for the ACTPS, meeting twice a year. Joint Council provides a forum for the consideration of and exchange of information on matters of strategic interest to ACTPS employees and employee organisations.
Joint Council considers significant issues that have, or might have, a multi-directorate impact on the employment of ACTPS employees. These matters include:
Whole of Government industrial relations issues;

12 State of the Service Report 2017-18
Whole of Government human resource issues; and
administrative and communication issues.
Important matters discussed at Joint Council within the reporting period included:
the implementation of a Reportable Conduct Scheme across the ACTPS;
the report card on misconduct investigations and introduction to the new Public Sector Standards Commissioner;
progress on the upgrade of the Human Resources Information Management System and Long Service Leave automation project;
background to the Property Group restructure;
the proposed establishment of an independent Integrity Commission;
the proposed Civic and Dickson Office blocks; and
progress towards the ACTPS becoming a self-insurer under Comcare.
Institute of Public Administration Australia (IPAA) Council
The Head of Service is a council member of the IPAA Council. IPAA promotes excellence and professionalism in public service.
The council advises on key initiatives that drive the direction of IPAA under four overarching pillars:
shaping thinking in public administration;
promoting excellence in public administration;
capability and professionalism; and
extending our influence and engagement.
As a representative of the ACTPS on the IPAA Council, the Head of Service provides the ACTPS with a voice on the future direction of best practice public administration within Australia.
Council of the Order of Australia
The Head of Service sits on the Council of the Order of Australia as a representative of the ACT.
The Order of Australia is the principal and most prestigious means of recognising outstanding members of the community at a national level.
As a member of the Council of the Order of Australia, the Head of Service provides a voice for celebrating the achievements of the people of the ACT at a national level.
Outlook for 2018-19
The Head of Service will continue to build on the current set of priorities with a core focus on continuing to build the capability of the ACTPS. In particular, the Head of Service will:
lead and support organisational and cultural change across the ACTPS to ensure workforce change readiness ahead of the completion of the new Office blocks during 2020;
support workforce planning and capability development across the ACTPS through the implementation of executive development programs and the release of Whole of Government workforce plans for entry level positions;
13 State of the Service Report 2017-18
continue to foster positive workplace cultures and drive employment initiatives to continue to increase diversity within the ACTPS, including programs and new opportunities to support the attraction and retention of Aboriginal and Torres Strait Islander Peoples and People with Disability, Veterans and LGBTIQ employees;
finalise and implement the Enterprise Agreements and associated commitments; and
use the 25th anniversary of the establishment of the ACTPS in 2019 to celebrate and further strengthen performance of the ACTPS.
2017-18 Significant Awards and Recognition Throughout 2017-18, teams and individuals from the ACTPS were recognised for outstanding achievements and significant contributions made to the community. Recognition was given in the form of awards both within directorates and by external bodies. Each directorate administered an awards process internally, providing recognition at the local level.
At the whole of service level, the ACTPS Awards for Excellence are held annually to recognise outstanding contributions within the Service under the categories of Respect, Integrity, Collaboration, Innovation, Leadership and the Bill Harris Executive Leadership Award.
The winners of the ACTPS Awards, presented in August 2017 were:
Respect: Woman’s Health Service, Health Directorate - for providing a high-quality and welcoming service and building respectful relationships with clients.
Integrity: William Clapham, Community Services Directorate - for his continual high standard of work and collaboration to resolve issues.
Collaboration: James Cotter, Garran Primary School, Education Directorate - for his ongoing collaborative work to improve the school and its community.
Innovation: Steve Taylor, Environment, Planning and Sustainable Development Directorate - for modernising integrated pest management in the ACT.
Leadership: Shona Chapman, West Belconnen Child and Family Centre, Community Services Directorate - for her outstanding service in developing and delivering early intervention and prevention programs to vulnerable communities in the ACT.
Bill Harris Executive Leadership: Associate. Professor Girish Talaulikar, Health Directorate - for his leadership and significant contributions to enhancing service delivery.
Some of the significant external awards and award nominations received across the sector include:
Chief Minister, Treasury and Economic Development Directorate Public Service Medal (PSM) award - Ms Bronwen Overton-Clarke, former Deputy Director-
General, Workforce Capability and Governance and ACT Public Sector Standards Commissioner who retired in December 2017, was awarded a Public Service Medal for her outstanding public service in the Australian Capital Territory, particularly in the area of public sector standards.
Public Service Medal (PSM) award – The late Dr Karl Alderson was awarded a Public Service Medal for his outstanding public service to justice policy and reform in the Australian Capital Territory.
2018 Vocational Education Training (VET) Indigenous Student of the Year Award and Canberra Institute of Technology BTA Indigenous Student Ambassador for 2017: Mr Tyson Brown - graduated from the ACTPS Indigenous Traineeship Program 2018.
Shared Services and Outsourcing Network (SSON) Excellence Awards – Excellence in Process Improvement and Innovation: Shared Services – for the Shared Services Website - The SSON

14 State of the Service Report 2017-18
awards recognise outstanding achievements of Shared Services organisations and outsourcing partnerships in public and private sectors across Australasia.
Government Property Group, Emerging Thought Leader Award 2017: Mr Phillip Yapp - for implementing the ACT Government's Energy Efficiency programs, including the Carbon Neutral Framework.
Justice and Community Safety Directorate ACTSMART Business Sustainability Awards 2018 (nomination) - innovation category: the
Industries and Facilities Management and Procurement teams - for the recycling program at the Alexander Maconochie Centre.
Institute of Public Administration Australia’s 2018 Public Sector Innovation Awards – Finalist (Citizen centred): ACT Corrective Services (ACTCS) – for the Extended Throughcare Program. The ACTCS Extended Throughcare Program is a targeted initiative working with eligible detainees released from the Alexander Maconochie Centre, designed to support their community reintegration and break the cycle for reoffending.
Rotary NSW and ACT Emergency Services Community Awards – Volunteers and Safety: Rob Thompson and Sue Elsbury (respectively).
Environment, Planning and Sustainable Development Directorate
Suburban Land Agency
Excellence in Master planned Communities (Nominated) category and Excellence in NSW Regions Development (Nominated): Suburban Land Agency - for development of the suburb of Franklin, Gungahlin.
Property Council of Australia Awards - Project Innovation award (finalist): Mingle, the Suburban Land Agency community development program, named “Mingle”, is an exciting initiative that aims to build vibrant communities through a range of activities such as new residents programs, events, working groups and more.
Property Council of Australia Awards - national commendation for Excellence in Marketing Urban Development category: Marketing team - for Asset Recycling Initiative release of former public housing sites “On Northbourne”.
City Renewal Authority
Civil Contractors Federation Earth Award - best civil construction project between $510 million in the ACT and surrounding region in 2017-18: CRA – for Henry Rolland Park, West Basin, Lake Burley Griffin.
Parks and Conservation Service
ACT Parks senior fire management officers - Brian Levine and Adam Leavesley had papers accepted at the International Association of Wildland Fire conference in Montana, USA. Brian led an interstate team in the development of a new prescribed burn risk management tool, and his paper described the tool and its use. Adam presented a paper about the development of a new bushfire erosion risk assessment tool based on research conducted through the Bushfire Cooperative Research Centre and implemented at ACT Parks.
Climate Change and Sustainability
Institute of Public Administration Australia's 2017 Public Sector Innovation Awards -'Innovative Solutions' category: The Energy Markets and Renewables Team - for their policy to promote
15 State of the Service Report 2017-18
renewable energy investment; the ACT became the first Australian jurisdiction to use a reverse auction process to provide guaranteed revenue and certainty for generators.
Public Housing Renewal
MBA Building Excellence Awards in the Chief Minister’s Affordable Housing category (Finalist) - Public Housing Renewal Taskforce, in collaboration with Shaw Building Group - for a public housing development in Moncrieff.
Education Directorate 2018 Member of the Order of Australia (AM) - Geoff McNamara, teacher, Melrose High School.
2018 Public Education Foundation’s First State Super Teachers Scholarship - Sascha Steinbeck.
2018 Australian Scholarship Group (ASG) National Excellence in Teaching Award - Adam Porter, teacher, Hughes Primary School.
2018 ASG National Excellence in Teaching Award - Rebecca Pain, teacher, Evatt Primary School.
2018 ASG National Excellence in Teaching Award - Michelle Allen, teacher, Torrens Primary School.
2017 Australian Council for Educational Leaders New Voice Scholarship - Tabatha Kellett, The Woden School.
ACT Awards
2017 ACT Chief Minister’s Inclusion Awards - Six Degrees Café, Garden and Gallery, Black Mountain School.
2017 ACT NAIDOC Person of the Year - Daniel Greene, teacher, Namadgi School.
2018 ACT Australian Education Union (AEU) Reconciliation Award - Joe Chapman-Freeman, Aboriginal and Torres Strait Islander Education Officer, based at Melba Copland Secondary College.
2017 ACT AEU Reconciliation Award - Cara-Jane Shipp, Executive Teacher, Campbell High School.
ACT Health 2018 General Practitioner of the Year for NSW and the ACT - Royal Australian College of General
Practitioners Associate Professor Katrina Anderson - presented by the Royal Australian College of General Practitioners, the award celebrates the outstanding contributions general practitioners make to the health and wellbeing of patients and communities across Australia.
2018 Member of the Order of Australia (AM) - Dr Vanita Perekh – Dr Parekh has been recognised for her significant service to medicine, as a specialist in the fields of sexual health and forensic medicine, as an educator and as a clinician.
Biggest Recycler, ACTSmart Business Sustainability Award - ACT Health - collaborative efforts between ISS Health Services, ACTSmart and ACT Health has delivered increased volumes of recyclables that include co-mingled, paper and cardboard, metal, electronic, fluorescent light, printer toner and cartridges, batteries and organic / food waste as part of its day to day waste operations.
Nurse of the Year, ACT Nursing and Midwifery Excellence Awards - Joanne Lindbeck – the ACT Nursing and Midwifery Excellence Awards celebrate and honour the achievements and outstanding contribution that nurses and midwives make to the health and wellbeing of the ACT community. Jo has extensive critical care experience and has led improvements for care of the dying and people with long term illness. Jo works collaboratively with the Chronic Care and Palliative Care teams to

16 State of the Service Report 2017-18
improve communication about Advanced Care Directives and has positively influenced the Medical Emergency Team’s admission times to the Intensive Care Unit.
Midwife of the Year, ACT Nursing and Midwifery Excellence Awards - Amelia Druhan - Amelia has an inclusive philosophical approach to patient-centred care, with her performance qualities consistently exemplified in her practice. Amelia has successfully established an antenatal parent education clinic for women with diverse cultural and linguistic needs, improving the transition of women from birthing to parenthood.
Team of the Year, ACT Nursing and Midwifery Excellence Awards - Neonatal Quality Improvement and Research Nursing Team, Canberra Hospital and Health Services.
Canberra Institute of Technology (CIT) 2018 Woman of the Year finalist: Caroline Hughes, CIT Yurauna Centre Director - Under her
leadership, CIT Yurauna Centre has become an integral part of CIT and increasingly successful at supporting Aboriginal and Torres Strait Islander students through their training and into careers.
2017 CIT Staff Achievement Awards - CIT CEO Staff Award: Rikki Norris, Manager Training Initiatives Unit - for her outstanding work leading the Training Initiatives Unit through significant change under the Australian Apprenticeships Project including the staged roll out of My Profiling, implementation of the ACT Funding Agreement Quality Manual, and the establishment of a team of externally focused liaison officers.
ACT Electoral Commission Public Service Medal (PSM) award - Mr Phillip Green (retired) for his outstanding public service to
the electoral system in the Australian Capital Territory.
17 State of the Service Report 2017-18
B.2 Performance Analysis – Workforce Strategies To equip the ACTPS to deliver Government priorities efficiently, a range of workforce initiatives have been driven across the ACTPS. These initiatives are explored below.
Respect, Equity and Diversity Framework The Resolving Workplace Issues resources were established under the Respect, Equity and Diversity (RED) Framework in 2015 to continue embedding positive workplace cultures across the ACTPS. The resources focus on the identification and management of inappropriate behaviour at the local level through to more serious allegations of misconduct that are managed under ACTPS Enterprise Agreements.
A review of these resources commenced in 2017-18 to ensure they remain current and best practice. It is expected that the review will be finalised during 2018-19.
Aboriginal and Torres Strait Islander Framework and People with Disability Employment Framework A renewed focus continued on the employment of Aboriginal and Torre Strait Islander Peoples and People with Disability through 2017-18. The respective employment strategies were removed from the RED Framework and developed into accessible stand-alone employment strategies. The Frameworks were launched in September and October 2017 respectively.
Employment of Aboriginal and Torres Strait Islander Peoples in the ACTPS
At June 2018, workforce data shows that the employment of Aboriginal and Torres Strait Islander Peoples has increased to 1.7 per cent (336.7 FTE or 380 employees).
Following the success of previous years’ Aboriginal and Torres Strait Islander Traineeships, interviews for the 2018 Aboriginal and Torres Strait Islander Vocational Employment Program were held in June 2018. Please note that the Aboriginal and Torres Strait Islander Traineeship Program was retitled to the Aboriginal and Torres Strait Islander Vocational Employment Program. Forty four applications were received for the program with seventeen positions available across the ACTPS. The successful candidates will commence early in the 2018-19 financial year. As part of the Program, participants are required to complete a formal learning and development program equivalent to a minimum Certificate lll or similar. Following successful completion, participants are permanently appointed to the ACTPS at the Administrative Service Officer Class 2 or equivalent depending on the directorate in which they are placed. This year, the pool of applicants for the Vocational Employment Program will be shared with other jurisdictions including the Australian Public Service (APS) and the Canberra Business Chamber for private sector employment opportunities.
More information about this employment framework is covered in the Workforce Profile section.

18 State of the Service Report 2017-18
ABORIGINAL AND TORRES STRAIT ISLANDER TRAINEESHIP PROGRAM PARTICIPANT CATCH UP: ASHLEE SPENCER
Ashlee Spencer was a participant in the 2017 Aboriginal and Torres Strait Islander Traineeship program. Following the completion of the program, Ashlee works as a Customer Services Officer in the Land Titles team within Access Canberra and successfully completed a Certificate III in Business.
Ashlee’s highlights of the program:
It created numerous opportunities leading to becoming the shadow secretariat for the 2018 CMTEDD RAP group. These opportunities were: getting to meet and relate to other Aboriginal and Torres Strait Islander people in
the traineeship program; being able to create a community at work with amazing people; joining the Reconciliation Action Plan (RAP) group and the Aboriginal and Torres
Strait Islander mentoring group for CMTEDD; and taking away from it an improved self and work life.
A challenge of the program:
In the beginning adjusting to moving around different workplaces, as it can sometimes be at short notice, and establishing new networks.
Ashlee concluded with:
“To anyone that was interested in the traineeship I would encourage to pursue it, and to be open to all the opportunities that comes with it.”
“I would like to add that I think this is such an amazing program and what it’s done for me and other Aboriginal and Torres Strait Islander people is very empowering.”
Employment of People with Disability in the ACTPS At June 2018, workforce data shows that the employment of People with Disability has increased to 2.5 per cent (505.6 FTE or 565 employees).
The first Disability Employment Services Provider Expo was held in August 2017. This is an avenue for members of the community and new school leavers to link in and meet with local providers that support the employment for People with Disability and Aboriginal and Torres Strait Islander Peoples. Due to its success and positive feedback, the Expo will be held again in August 2018.
Applications for the 2018 Inclusion Vocational Employment Program (previously the Traineeship Program) closed in January 2018. Over 250 applications were received. Interviews will be held in July 2018 with at least 11 positions available. Program participants will commence on a staggered basis from August 2018. This year, the pool of applicants for the Vocational Employment Program will be shared with other jurisdictions including the APS and the Canberra Business Chamber for private sector employment opportunities.
In early 2018, two Interns were placed through the Australian Network on Disability’s ‘Stepping Into’ Internship program. One intern was placed in CMTEDD and the other was placed in CSD.
19 State of the Service Report 2017-18
To better support ACTPS employees with disability, meetings with staff have been undertaken to establish the ACTPS Disability and Allies Network. The network aims to facilitate learning and awareness of issues, co-ordinate events and enable consultation on policy development.
INCLUSION TRAINEESHIP PROGRAM PARTICIPANT CATCH UP: DANIEL MCKENNY
Daniel McKenny was a participant in the 2017 Inclusion Traineeship Program. Following the completion of the Program, Daniel works as a Licensing Officer in the Liquor and Gaming Licensing Team within Access Canberra and successfully completed a Certificate III in Business.
Daniel’s highlights of the Program: the opportunity to work within a structured environment on a routine basis; meeting new people through my work; and learning new skills and being provided with the opportunity to gain a qualification
that is nationally recognised and providing me the opportunity to enter the public service.
Challenges faced during the program: adapting to the study schedule at CIT one day a week; learning new systems/procedures as part of daily work practices and routines; and learning to develop a work/life balance.
Daniel concluded with: ‘I think more people should be offered the chance to do Traineeships as they offer a gateway into industries via a qualification which many people may have when applying for jobs. However, they have the lack of experience which an employer may be looking for which in essence a traineeship can provide’.
Workforce Capability The Chief Minister’s Statement of Ambition is a call to action for workforce transformation. The ACTPS must systematically and deliberately ‘attract and retain the talented people that can help make our city great’ to shape an effective and efficient public service of the future.
Aligning directly to the Government’s priority to ‘attract and retain the talented people that can make our city great1’; in 2017-18, the ACTPS has continued to build the workforce capability required to be an agile, responsive and innovative public service that is able to deliver the Government’s priorities and provide effective services to the ACT community now and into the future.
To achieve this, work centred on the development and implementation of workforce strategies and practical tools through effective collaboration with directorates to co-develop approaches that support workplace culture and capability.
A cross directorate working group comprised of HR Directors from across the Service was established to support positive workplace cultures. This ‘Culture Ready’ working group has an initial focus on assisting the transition to Activity Based Working (ABW) environments for approximately 3,000 employees by 2020.
1 ACT Government’s Statement of Ambition: Canberra – A Statement of Ambition (2016): http://www.cmd.act.gov.au/__data/assets/pdf_file/0006/865482/Canberra-A-Statement-of-Ambition.pdf

20 State of the Service Report 2017-18
In 2017-18, the Culture Ready Working Group began development of practical resources, policies, training material and team working tools to support positive workplace cultures and contemporary management practice. Further work to implement this initiative in directorates will occur throughout 2018-19.
The ADAPT (Align, Design, Analyse, Program and Transform) Strategic Workforce Planning Toolkit (ADAPT Toolkit) was developed in 2017 to support strategic workforce planning activity across the ACTPS. The ADAPT model aligns service innovation, business improvement opportunities and strategic priorities with ‘people planning’ to drive business transformation.
The ADAPT Toolkit was launched on the ACTPS Employment Portal in November 2017 as a fully accessible and interactive smart-form. The ADAPT Toolkit assists users to build a workforce around key service delivery into the future, supporting work areas to continue to effectively deliver on Government priorities and future service commitments.
Prompted by global trends and discourse, consideration was also given to the future of work for the ACTPS. In 2017-18, work was undertaken to complete a jurisdictional scan of current practice and principles were developed which will enable the ACTPS workforce to meet future challenges and opportunities. Further work is planned for 2018-19.
Released in 2018, the ACTPS Learning Strategy and the ACTPS Core Learning Policy, articulates our commitment to an ongoing learning environment for the ACTPS and reinforces our commitment to innovation and change. The ACTPS Learning Strategy will ensure our workforce is building the leadership and learning culture we want in the ACTPS. The Core Learning Policy supports the ACTPS Learning Strategy and the ACTPS Shared Capability Framework in building the ACTPS of the future. It identifies training for all employees regardless of their directorate or the position they hold. Core learning topics have been selected to ensure employees are aware of the fundamentals of working in the ACTPS and provide a consistency of core skills development across the Service.
The ability of ACTPS leaders to create productive working environments that engage employees and foster collaboration, innovation and responsiveness is central to developing the ACTPS workforce as a whole.
With the move to the Government Office blocks in Civic and Dickson in 2020, the focus of executive learning and development over the next two years will be around people management, program management and budget management.
Directors-General will be involved in the selection of Band 1 and 2 executives to undertake the following modules:
People and Culture: focusing on enabling our people to create an engaging, trusting and high performing work culture that delivers on the Chief Ministers’ Statement of Ambition. This is to encourage employee’s ability to self-direct, make sound decisions, work autonomously and innovate at work.
Change Management: in order to achieve sustainable cultural transformation in the ACTPS and transition to new ways of working.
Program/Project Management: including governance, complexity thinking, judgement and risk, planning, outcomes realisation, and co-design.
21 State of the Service Report 2017-18
Whole of Government Training Providers Panel Arrangement
Throughout 2017-18, a procurement process was undertaken to expand the Whole of Government Training Panel.
As of July 2018, we will be transitioning to a new Whole of Government Panel of Training Providersarrangement which will replace the current training arrangement. The new panel arrangement willprovide ACTPS directorates and agencies with access to a variety of suppliers who providecontemporary, future focussed and structured training. The new arrangement has significantlyincreased the number of providers available to the Territory for training services and includes threenew categories: Executive Leadership and Development, Emergency Response and Fire Safety, andInclusion Programs.
Forty providers have formed part of the Training Panel. The new Panel offers the following trainingcategories:
Communication and Engagement - 19 providers;
Computer Skills - 3 providers;
Executive Development - 9 providers;
Fire and Emergency - 4 providers;
First Aid - 8 providers;
Inclusion - 6 providers;
Management and Leadership – 20 providers;
National Qualifications – 13 providers;
Self-Development – 14 providers;
Work Safety – 11 providers; and
Working in Government – 12 providers.
An important change with the new arrangement is the use of the Panel Management Portal (PMP). The PMP features automated workflows and alerts, offers a significant degree of self-management and control, as well as real time data for reporting, compliance and performance management purposes.
The PMP allows the directorates and providers to work more efficiently and effectively together inthe procurement of training services across the Territory.
Activity Based Work in the ACTPSThe ACT Government is committed to having up to date, contemporary and innovative work spaces to allow its workforce to deliver services to the Government and the broader community.
Activity Based Work (ABW) has been endorsed as the presumptive model for all new fit-outs andrefurbishments of new or existing office accommodation across the ACTPS. This decision hasinformed the design of the Dickson and Civic office blocks, which are being privately developed for lease by the ACTPS. Both buildings are expected to be occupied by the ACTPS in 2020 and willaccommodate more than 3,000 staff.
An evaluation of staff satisfaction in July 2017 following initial ABW fit-outs at the Canberra Nara Centre (Civic) and Cosmopolitan Building (Woden) demonstrated that a significant majority of staff were supportive of the shift to contemporary work practices. Some key results include:

20 State of the Service Report 2017-18
In 2017-18, the Culture Ready Working Group began development of practical resources, policies, training material and team working tools to support positive workplace cultures and contemporary management practice. Further work to implement this initiative in directorates will occur throughout 2018-19.
The ADAPT (Align, Design, Analyse, Program and Transform) Strategic Workforce Planning Toolkit (ADAPT Toolkit) was developed in 2017 to support strategic workforce planning activity across the ACTPS. The ADAPT model aligns service innovation, business improvement opportunities and strategic priorities with ‘people planning’ to drive business transformation.
The ADAPT Toolkit was launched on the ACTPS Employment Portal in November 2017 as a fully accessible and interactive smart-form. The ADAPT Toolkit assists users to build a workforce around key service delivery into the future, supporting work areas to continue to effectively deliver on Government priorities and future service commitments.
Prompted by global trends and discourse, consideration was also given to the future of work for the ACTPS. In 2017-18, work was undertaken to complete a jurisdictional scan of current practice and principles were developed which will enable the ACTPS workforce to meet future challenges and opportunities. Further work is planned for 2018-19.
Released in 2018, the ACTPS Learning Strategy and the ACTPS Core Learning Policy, articulates our commitment to an ongoing learning environment for the ACTPS and reinforces our commitment to innovation and change. The ACTPS Learning Strategy will ensure our workforce is building the leadership and learning culture we want in the ACTPS. The Core Learning Policy supports the ACTPS Learning Strategy and the ACTPS Shared Capability Framework in building the ACTPS of the future. It identifies training for all employees regardless of their directorate or the position they hold. Core learning topics have been selected to ensure employees are aware of the fundamentals of working in the ACTPS and provide a consistency of core skills development across the Service.
The ability of ACTPS leaders to create productive working environments that engage employees and foster collaboration, innovation and responsiveness is central to developing the ACTPS workforce as a whole.
With the move to the Government Office blocks in Civic and Dickson in 2020, the focus of executive learning and development over the next two years will be around people management, program management and budget management.
Directors-General will be involved in the selection of Band 1 and 2 executives to undertake the following modules:
People and Culture: focusing on enabling our people to create an engaging, trusting and high performing work culture that delivers on the Chief Ministers’ Statement of Ambition. This is to encourage employee’s ability to self-direct, make sound decisions, work autonomously and innovate at work.
Change Management: in order to achieve sustainable cultural transformation in the ACTPS and transition to new ways of working.
Program/Project Management: including governance, complexity thinking, judgement and risk, planning, outcomes realisation, and co-design.
21 State of the Service Report 2017-18
Whole of Government Training Providers Panel Arrangement
Throughout 2017-18, a procurement process was undertaken to expand the Whole of Government Training Panel.
As of July 2018, we will be transitioning to a new Whole of Government Panel of Training Providers arrangement which will replace the current training arrangement. The new panel arrangement will provide ACTPS directorates and agencies with access to a variety of suppliers who provide contemporary, future focussed and structured training. The new arrangement has significantly increased the number of providers available to the Territory for training services and includes three new categories: Executive Leadership and Development, Emergency Response and Fire Safety, and Inclusion Programs.
Forty providers have formed part of the Training Panel. The new Panel offers the following training categories:
Communication and Engagement - 19 providers;
Computer Skills - 3 providers;
Executive Development - 9 providers;
Fire and Emergency - 4 providers;
First Aid - 8 providers;
Inclusion - 6 providers;
Management and Leadership – 20 providers;
National Qualifications – 13 providers;
Self-Development – 14 providers;
Work Safety – 11 providers; and
Working in Government – 12 providers.
An important change with the new arrangement is the use of the Panel Management Portal (PMP). The PMP features automated workflows and alerts, offers a significant degree of self-management and control, as well as real time data for reporting, compliance and performance management purposes.
The PMP allows the directorates and providers to work more efficiently and effectively together in the procurement of training services across the Territory.
Activity Based Work in the ACTPS The ACT Government is committed to having up to date, contemporary and innovative work spaces to allow its workforce to deliver services to the Government and the broader community.
Activity Based Work (ABW) has been endorsed as the presumptive model for all new fit-outs and refurbishments of new or existing office accommodation across the ACTPS. This decision has informed the design of the Dickson and Civic office blocks, which are being privately developed for lease by the ACTPS. Both buildings are expected to be occupied by the ACTPS in 2020 and will accommodate more than 3,000 staff.
An evaluation of staff satisfaction in July 2017 following initial ABW fit-outs at the Canberra Nara Centre (Civic) and Cosmopolitan Building (Woden) demonstrated that a significant majority of staff were supportive of the shift to contemporary work practices. Some key results include:

22 State of the Service Report 2017-18
280 of approximately 565 staff completed the survey;
if given the choice, 69% of staff who responded to the survey would prefer to continue working in an ABW environment;
if asked about ABW by a colleague, 63% indicated they would respond positively, 20% neutrally, with 17% indicating they would provide a negative response; and
69% of staff were satisfied with their physical office environment.
The expansion of ABW within the ACTPS continued during the 2017-18 reporting period, with the completion of ABW fit-outs at TransACT House in Dickson, 255 Canberra Avenue in Fyshwick and the Callam Offices in Woden. More than 800 staff are now working flexibly across five locations.
Lessons continue to be learned from each roll-out of ABW, and applied in the design and implementation of subsequent roll-outs. Collectively, a significant body of knowledge and experience has been established to inform the change program to transition 3,000 staff into the Civic and Dickson office blocks.
The Workforce Transformation Group has been established to drive workforce readiness ahead of the transition to the new building. This group has a whole of Government focus with executive representation from each directorate. Three sub-groups have been established to deliver programs of work in the key areas of technology, operations, and workplace culture.
Consultation with staff and with union stakeholders on how the change program will be implemented is ongoing, and will be a point of focus for 2018-19.
Revised Executive Structure In 2016, changes were made to the PSM Act that established the Senior Executive Service within the ACTPS. Among other things these changes provided clear roles and responsibilities of Directors-General and Executives across the ACTPS. The PSM Standards were amended on 28 June 2018 to introduce a revised executive classification structure to further implement these changes. A new four band 16 point executive classification structure replaced the previous three band 12 point executive structure. This revised structure creates a clearer delineation between executive levels.
The new executive classification structure is based on an independent review of the executive structure. This is the first review of the executive structure conducted since the original structure was established in 1994. The review considered a comprehensive interjurisdictional analysis of Commonwealth, State and Territory executive structures. The new structure is effective from 1 July 2018 and all current executives will be translated into the new classification structure without being disadvantaged.
ACT Government Veterans Employment Strategy The ACT Government Veterans Employment Strategy was launched on 13 September 2017. The Strategy focuses on assisting veterans as they transition from the Australian Defence Force (ADF) into civilian employment, specifically into the ACTPS.
In late 2017, a staff survey was undertaken to determine the number of veterans employed in the ACTPS and gain an understanding of their experience of entering the ACTPS. A total of 134 responses were received in the survey. The results of the survey are now informing further actions for the ACTPS.
23 State of the Service Report 2017-18
The ACTPS Veterans Employment Transition Guide was launched in April 2018. The guide has been developed for people considering professional options after a career in the ADF. It provides information on the ACTPS and useful tips for job searching and navigating the application andselection process.
A number of ACTPS employees attended the ACT Australian Defence Force (ADF) transition seminaron 18-19 April 2018 to provide background about the ACTPS, information on conditions of employment and promote employment possibilities.
Seven senior executives in the ACT Public Service participated in Exercise Executive Stretch on22-23 April 2018. This program is conducted by the Department of Defence to provide an opportunity for employers to see and experience first-hand what Reservists do.
The HR system has also been updated to enable self-identification of veterans.
Six Executive Champions were appointed in June 2018. These ACTPS senior executives are looking atthe most effective way they can support veterans with the transition into civilian life andemployment in the ACTPS.
Industrial Relations and Enterprise AgreementsThe ACTPS employment framework includes 17 Enterprise Agreements made under the Fair WorkAct 2009 (Cwlth). These cover the majority of the Sector. While the Enterprise Agreements nominallyexpired on 30 June 2017, under the Fair Work Act 2009 (Cwlth) they continue to operate untilreplaced. Negotiations with unions and other employee representatives to replace them are nearingcompletion.
The Government is offering fair, affordable and competitive wage and entitlement enhancements including important and significant commitments to its workforce concerning job security and futureemployment opportunity. Negotiations with unions and nominated non-union bargainingrepresentatives have been extensive and have largely concentrated on the common core aspects ofagreements. Broader reform is sought in relation to the ACTION, Fire Fighting and Canberra Institute of Technology (CIT) agreements, with the view of creating sufficient flexibility to meet the community’s changing needs and expectations.
A Commitment to Better Communications and EngagementThe ACT Government has a ‘One Government’ approach to putting the citizen at the centre of its communications and engagement efforts.
An indicator of the effectiveness of communication mechanisms of Government is the community’sperceptions of whether they are engaged and informed on important priorities, services and major projects.
Since implementing a Whole of Government approach to communications, the community has feltbetter informed each year about ACT Government services, increasing from 58% of the communityfeeling well informed in 2015, to 73% in 2018.
Engagement reform
In 2017-18 the ACT Government committed to strengthening its approach to communityengagement to hear from more Canberrans, to provide clear information and easy opportunities for the community to have their say on the issues that matter. At its heart, the engagement reform is:

22 State of the Service Report 2017-18
280 of approximately 565 staff completed the survey;
if given the choice, 69% of staff who responded to the survey would prefer to continue working inan ABW environment;
if asked about ABW by a colleague, 63% indicated they would respond positively, 20% neutrally, with 17% indicating they would provide a negative response; and
69% of staff were satisfied with their physical office environment.
The expansion of ABW within the ACTPS continued during the 2017-18 reporting period, with the completion of ABW fit-outs at TransACT House in Dickson, 255 Canberra Avenue in Fyshwick and theCallam Offices in Woden. More than 800 staff are now working flexibly across five locations.
Lessons continue to be learned from each roll-out of ABW, and applied in the design andimplementation of subsequent roll-outs. Collectively, a significant body of knowledge andexperience has been established to inform the change program to transition 3,000 staff into the Civicand Dickson office blocks.
The Workforce Transformation Group has been established to drive workforce readiness ahead of the transition to the new building. This group has a whole of Government focus with executive representation from each directorate. Three sub-groups have been established to deliver programs of work in the key areas of technology, operations, and workplace culture.
Consultation with staff and with union stakeholders on how the change program will be implemented is ongoing, and will be a point of focus for 2018-19.
Revised Executive StructureIn 2016, changes were made to the PSM Act that established the Senior Executive Service within the ACTPS. Among other things these changes provided clear roles and responsibilities of Directors-General and Executives across the ACTPS. The PSM Standards were amended on 28 June 2018 tointroduce a revised executive classification structure to further implement these changes. A new fourband 16 point executive classification structure replaced the previous three band 12 point executive structure. This revised structure creates a clearer delineation between executive levels.
The new executive classification structure is based on an independent review of the executive structure. This is the first review of the executive structure conducted since the original structure was established in 1994. The review considered a comprehensive interjurisdictional analysis of Commonwealth, State and Territory executive structures. The new structure is effective from1 July 2018 and all current executives will be translated into the new classification structure withoutbeing disadvantaged.
ACT Government Veterans Employment StrategyThe ACT Government Veterans Employment Strategy was launched on 13 September 2017. The Strategy focuses on assisting veterans as they transition from the Australian Defence Force (ADF) intocivilian employment, specifically into the ACTPS.
In late 2017, a staff survey was undertaken to determine the number of veterans employed in the ACTPS and gain an understanding of their experience of entering the ACTPS. A total of 134 responses were received in the survey. The results of the survey are now informing further actions for the ACTPS.
23 State of the Service Report 2017-18
The ACTPS Veterans Employment Transition Guide was launched in April 2018. The guide has been developed for people considering professional options after a career in the ADF. It provides information on the ACTPS and useful tips for job searching and navigating the application and selection process.
A number of ACTPS employees attended the ACT Australian Defence Force (ADF) transition seminar on 18-19 April 2018 to provide background about the ACTPS, information on conditions of employment and promote employment possibilities.
Seven senior executives in the ACT Public Service participated in Exercise Executive Stretch on 22-23 April 2018. This program is conducted by the Department of Defence to provide an opportunity for employers to see and experience first-hand what Reservists do.
The HR system has also been updated to enable self-identification of veterans.
Six Executive Champions were appointed in June 2018. These ACTPS senior executives are looking at the most effective way they can support veterans with the transition into civilian life and employment in the ACTPS.
Industrial Relations and Enterprise Agreements The ACTPS employment framework includes 17 Enterprise Agreements made under the Fair Work Act 2009 (Cwlth). These cover the majority of the Sector. While the Enterprise Agreements nominally expired on 30 June 2017, under the Fair Work Act 2009 (Cwlth) they continue to operate until replaced. Negotiations with unions and other employee representatives to replace them are nearing completion.
The Government is offering fair, affordable and competitive wage and entitlement enhancements including important and significant commitments to its workforce concerning job security and future employment opportunity. Negotiations with unions and nominated non-union bargaining representatives have been extensive and have largely concentrated on the common core aspects of agreements. Broader reform is sought in relation to the ACTION, Fire Fighting and Canberra Institute of Technology (CIT) agreements, with the view of creating sufficient flexibility to meet the community’s changing needs and expectations.
A Commitment to Better Communications and Engagement The ACT Government has a ‘One Government’ approach to putting the citizen at the centre of its communications and engagement efforts.
An indicator of the effectiveness of communication mechanisms of Government is the community’s perceptions of whether they are engaged and informed on important priorities, services and major projects.
Since implementing a Whole of Government approach to communications, the community has felt better informed each year about ACT Government services, increasing from 58% of the community feeling well informed in 2015, to 73% in 2018.
Engagement reform
In 2017-18 the ACT Government committed to strengthening its approach to community engagement to hear from more Canberrans, to provide clear information and easy opportunities for the community to have their say on the issues that matter. At its heart, the engagement reform is:

24 State of the Service Report 2017-18
> resetting how the ACT Government meaningfully seeks the views of the community;
> encouraging a greater diversity of Canberrans to have their say; and
> delivering a coordinated and consistent program of community engagement activities for the
Canberra community to inform decision making.
Whole of Government communications and engagement strategy
To increase the transparency of the upcoming engagements and community information campaigns a Whole of Government Communications and Engagement Strategy was publicly released in February 2018. A link to the Strategy can be found on the ACT Government 'Your Say' website here: https://www.act.gov.au/yoursay/our-conversations
The strategy forecasts Government’s priority conversations with Canberrans, and identifies opportunities for collaboration. It supports directorates practically, and forges connections across directorates, portfolios and with external stakeholders.
Deliberative engagement
The use of deliberative engagement is one element of engagement reform for the ACT Government, and provides processes where a representative group of Canberrans have the time and information to gain an understanding on complex policy issues to inform recommendations to Government.
In 2017-18 the ACT Government delivered four deliberative engagement processes, a Carers’ Strategy, Citizens’ Jury considering improvements to the Compulsory Third Party Insurance Scheme, a Citizens’ Panel on the housing needs of the future (Housing Choices Collaboration Hub) and a Citizens’ Forum to inform a shared vision and prioritisation of city services (Better Suburbs Citizens Forum).
To support this growing practice, an external deliberative engagement Community of Interest has been established, as a partnership between ACT Government officials, the University of Canberra, Canberra Alliance for Participatory Democracy, engagement practitioners and interested community members.
An online insights community
An online insights community is in development, to allow a greater diversity of Canberrans to engage with the Government more quickly and easily. It will be launched in late 2018.
It will establish a capability for ACT Government directorates and agencies to quickly seek advice from a broadly representative segment of the community and analyse their responses to gain insights about key ACT Government initiatives, topics and issues. It will also provide a new platform to reach more voices, more easily - not just those who can attend public meetings and more traditional engagement activities.
Closing the loop
Community engagement practices rely on transparency of process and feedback on results obtained, to build trust and encourage altruistic participation.
In 2017-18 guidelines have been implemented on the proactive release of community views, research and feedback received through engagements, including:
> a high level Report on What We Heard, published within a month of an engagement closing for public comments;
25 State of the Service Report 2017-18
a final Consultation Report published within three months of the consultation closing; and
a high level Outcomes Statement summarising how the community’s input was used in decisionmaking.
SNAPSHOTCTP CITIZENS’ JURY: A DELIBERATIVE DEMOCRACY CASE STUDY
An innovative engagement process was undertaken over seven months in 2017-18 tofind out what the community really wanted out of the ACT’s Compulsory Third Party Insurance (CTP) scheme, through a citizen’s jury.
Citizens’ juries are an innovative way for members of the community to make collective recommendations on complex issues. The jury receives information andaccess to experts so they can deliberate in an informed way on policy trade-offs.
The process commenced in September 2017, actively seeking the views of theCanberra community through an online engagement process and through statistically sound market research. Invitations to participate in a citizens’ jury were then sent to 7,500 Canberra households, with 54 jurors recruited to represent a mix of peoplebroadly corresponding to the ACT’s population demographics.
Jurors spent three weekends and many hours in between considering the scheme from all perspectives, including hearing from people injured in motor vehicle accidents. The process was supported by many experts and involved those parties with an interest in the scheme through a Stakeholder Reference Group (SRG). The SRG spent almost 30hours in deliberations to provide input into the development of four models by the scheme designer that met the jury’s identified priorities for an improved CTP scheme to best balance the interests of all road users.
The jury’s chosen model is a hybrid no-fault common law scheme, with coverage andbenefits that best met their priorities.
The ACT Government has publicly committed to pursuing the scheme chosen by the jury and to introducing legislation to the ACT Legislative Assembly by the end of 2018. If passed, it is expected the new scheme will commence in Canberra in the second half of 2019.
As a pilot deliberative democracy project, the CTP citizens’ jury demonstrated the significant benefits of working directly with the community on complex policy development and internally, the benefits of closer working relationships betweenpolicy, communications and engagement officers.
Establishment of the ACT Centre of Data Excellence (the Centre) Developing the capability of employees in data analytics and data management provides significant opportunities to strengthen our performance as a service. Data analytics has the potential to help identify new perspectives on complex problems and improve outcomes.
In 2017-18, the Office of the Chief Digital Officer established the ACT Centre of Data Excellence (the Centre). This includes a base version of the data technology platform and associated functions andthe recruitment of a small team of data specialists to operate the platform and conduct data analytics projects. The Centre’s strategic outcomes are to improve evidence-based decision making,
24 State of the Service Report 2017-18
resetting how the ACT Government meaningfully seeks the views of the community;
encouraging a greater diversity of Canberrans to have their say; and
delivering a coordinated and consistent program of community engagement activities for theCanberra community to inform decision making.
Whole of Government communications and engagement strategy
To increase the transparency of the upcoming engagements and community information campaignsa Whole of Government Communications and Engagement Strategy was publicly released in February 2018. The Strategy can be found at:https://www.act.gov.au/__data/assets/pdf_file/0004/1163983/ACT-Whole-of-Government-Communications-and-Engagement-Strategy-2017-2019.pdf.
The strategy forecasts Government’s priority conversations with Canberrans, and identifies opportunities for collaboration. It supports directorates practically, and forges connections acrossdirectorates, portfolios and with external stakeholders.
Deliberative engagement
The use of deliberative engagement is one element of engagement reform for the ACT Government, and provides processes where a representative group of Canberrans have the time and informationto gain an understanding on complex policy issues to inform recommendations to Government.
In 2017-18 the ACT Government delivered four deliberative engagement processes, a Carers’Strategy, Citizens’ Jury considering improvements to the Compulsory Third Party Insurance Scheme, a Citizens’ Panel on the housing needs of the future (Housing Choices Collaboration Hub) and a Citizens’ Forum to inform a shared vision and prioritisation of city services (Better Suburbs Citizens Forum).
To support this growing practice, an external deliberative engagement Community of Interest has been established, as a partnership between ACT Government officials, the University of Canberra, Canberra Alliance for Participatory Democracy, engagement practitioners and interested communitymembers.
An online insights community
An online insights community is in development, to allow a greater diversity of Canberrans to engage with the Government more quickly and easily. It will be launched in late 2018.
It will establish a capability for ACT Government directorates and agencies to quickly seek advice from a broadly representative segment of the community and analyse their responses to gaininsights about key ACT Government initiatives, topics and issues. It will also provide a new platformto reach more voices, more easily - not just those who can attend public meetings and more traditional engagement activities.
Closing the loop
Community engagement practices rely on transparency of process and feedback on results obtained, to build trust and encourage altruistic participation.
In 2017-18 guidelines have been implemented on the proactive release of community views,research and feedback received through engagements, including:
a high level Report on What We Heard, published within a month of an engagement closing forpublic comments;
25 State of the Service Report 2017-18
a final Consultation Report published within three months of the consultation closing; and
a high level Outcomes Statement summarising how the community’s input was used in decision making.
SNAPSHOT CTP CITIZENS’ JURY: A DELIBERATIVE DEMOCRACY CASE STUDY
An innovative engagement process was undertaken over seven months in 2017-18 to find out what the community really wanted out of the ACT’s Compulsory Third Party Insurance (CTP) scheme, through a citizen’s jury.
Citizens’ juries are an innovative way for members of the community to make collective recommendations on complex issues. The jury receives information and access to experts so they can deliberate in an informed way on policy trade-offs.
The process commenced in September 2017, actively seeking the views of the Canberra community through an online engagement process and through statistically sound market research. Invitations to participate in a citizens’ jury were then sent to 7,500 Canberra households, with 54 jurors recruited to represent a mix of people broadly corresponding to the ACT’s population demographics.
Jurors spent three weekends and many hours in between considering the scheme from all perspectives, including hearing from people injured in motor vehicle accidents. The process was supported by many experts and involved those parties with an interest in the scheme through a Stakeholder Reference Group (SRG). The SRG spent almost 30 hours in deliberations to provide input into the development of four models by the scheme designer that met the jury’s identified priorities for an improved CTP scheme to best balance the interests of all road users.
The jury’s chosen model is a hybrid no-fault common law scheme, with coverage and benefits that best met their priorities.
The ACT Government has publicly committed to pursuing the scheme chosen by the jury and to introducing legislation to the ACT Legislative Assembly by the end of 2018. If passed, it is expected the new scheme will commence in Canberra in the second half of 2019.
As a pilot deliberative democracy project, the CTP citizens’ jury demonstrated the significant benefits of working directly with the community on complex policy development and internally, the benefits of closer working relationships between policy, communications and engagement officers.
Establishment of the ACT Centre of Data Excellence (the Centre) Developing the capability of employees in data analytics and data management provides significant opportunities to strengthen our performance as a service. Data analytics has the potential to help identify new perspectives on complex problems and improve outcomes.
In 2017-18, the Office of the Chief Digital Officer established the ACT Centre of Data Excellence (the Centre). This includes a base version of the data technology platform and associated functions and the recruitment of a small team of data specialists to operate the platform and conduct data analytics projects. The Centre’s strategic outcomes are to improve evidence-based decision making,

26 State of the Service Report 2017-18
leading to delivery of better services for citizens and building on the data capability in our workforce.
The ACT Digital Services platform was also established and will enable people to access multiple ACT Government services easily via their mobile phone. This platform and the use of best practice design methods will allow the ACT to reimagine and transform services in a human centred, fully digital way.
The following services were publicly released on 31 May 2018:
My Family - offers the ability for families to ‘tell their story once’, manage their own information and access services within the Community Services Directorate. My Family is at https://myfamily.act.gov.au.
Office for Women ACT Diversity Register - aims to increase female and diverse participation on ACT Government and non-government Boards and Committees, by enabling people from diverse backgrounds to register for these opportunities. The ACT Diversity Register is at http://www.communityservices.act.gov.au/home/diversityregister
During 2018-19, the aim is for the Centre of Data Excellence to:
operationalise the data technology platform and continue to maintain and support it and ensuring privacy, security and access controls;
support priority projects across government through the use of data and analytics;
develop a data literacy and analytics program to build on the capability in our workforce; and
increase the ability to easily publish data to the open data platform.
Priorities for ACT Digital Services during 2019-20 include:
maintaining current services, delivering the current digital services in development and design a number of additional service transformations for delivery in 2019-20;
working with the Digital Transformation Agency to ensure seamless integration between the ACT digital account and the federal MyGovID;
developing a Digital Design Practice Guide to build on digital design capability across government.
Reportable Conduct Scheme The Reportable Conduct Scheme (the Scheme) commenced on 1 July 2017 under the Ombudsman Act 1989 and the Children and Young People Act 2008. The Scheme is designed to support the ongoing commitment to safeguarding children in our community. It is a Scheme which requires affected employers to better manage and report on allegations of inappropriate conduct involving children, and which establishes an oversight function that sits with the ACT Ombudsman.
In preparation for the commencement, and to support the implementation of the scheme across the ACTPS, communication and training was provided to staff across the ACTPS. Specialised training was provided to designated reportable conduct officers in each directorate and further developed through regular practitioner meetings, which brought together the reportable conduct officers as well as representatives from the Government Solicitor’s Office and the Ombudsman’s office.
In the first year of operation of the Scheme, ACTPS directorates made 29 reports to the Ombudsman’s office about reportable conduct matters. These matters have been handled within the relevant directorates, at times with referral to the Professional Standards Unit, especially where matters also constituted alleged misconduct. The ACTPS is continually reviewing and evaluating its approach to the Scheme and the handling of reportable conduct matters to ensure compliance with
27 State of the Service Report 2017-18
the Scheme and to develop best practice processes that protect the safety of children and young people.
Work Safety, Rehabilitation and Workers’ Compensation Work is underway to improve policy, program and service delivery arrangements to support the health, safety and rehabilitation of our workforce.
The ACT Government has determined to make an application to the Safety, Rehabilitation and Compensation Commission (SRCC) to become a self-insurer within the Comcare scheme. As a licenced self-insurer, ACTPS employees will continue to be protected by the same workers’ compensation arrangements that apply now and allow the Territory to influence how these services are delivered to its employees.
To support self-insurance, the ACT Government has been working to establish a best-practice claims management model that promotes health and mental wellbeing for injured ACTPS employees. This model has been informed by consultation with ACTPS employees, unions and insurance experts.
It is intended that transition to the self-insurance arrangement will commence in Quarter 1, 2019 (calendar year), pending the SRCC’s approval of the Territory’s licence application.
In 2017-18 work continued to support the health, safety and rehabilitation of all workers across the ACTPS, including:
promoting workplace health and wellbeing through a suite of programs and policies. This work has included the Whole of Government Healthy Food and Drink Choices Policy and approved catering providers list and the Healthier Me program which provides physical activity and lifestyle modification sessions;
a focus on a Whole of Government approach to workforce health, safety and wellbeing with work underway to develop a Whole of Government work health, safety and wellbeing strategy;
collaboration across directorates to drive continuous improvement and improved safety culture in work, health and safety and wellbeing. This has included the continued facilitation of the ACTPS Work Health and Safety Working Group and the Health and Wellbeing Network;
a focus on intervening early to support employees with injury or illness to remain in or return to work. The Early Intervention Physiotherapy Program has provided funded support for employees who become injured in the course of their work to access timely physiotherapy services. Work has also been occurring with directorates to develop approaches to better support managers to manage reasonable adjustments to enable employees to stay at work following injury;
a focus on building partnerships between the Whole of Government Injury Management Team and directorates to enhance the support and service delivery to injured and ill employees through a greater understanding of operational environments and processes;
a broad review of the Whole of Government work-based rehabilitation policy has led to the development of a suite of policies to support employees to return to or remain in work. These policies are the subject of consultation and will be implemented in 2018-19; and
expanding the availability of reporting for directorates and public sector bodies through the RiskMan electronic incident reporting system. This provides directorate-based work health and safety officers with up to date information about incidents and near misses that are reported across their organisations, allowing them to identify and analyse trends and use the data to inform work health and safety improvement initiatives.
28 State of the Service Report 2017-18
In 2018-19 the Government will remain focused on delivering initiatives that improve services and outcomes for injured workers and reflect a ‘One Service’ approach to supporting injured workers. This will include:
development and implementation of a new Whole of Government Work Health, Safety and Wellbeing Strategy with a focus on understanding risks in order to tailor targeted health, safety and wellbeing interventions;
a focus on supports to assist managers to support employees with illness or injury return to, or stay at work;
transition to a self-insurance operating model to take greater responsibility for the health and recovery of employees;
implementation of an electronic claims management system to enhance service delivery to injured and ill employees;
implementing the suite of work-based rehabilitation policies to improve work participation across the service; and
a refresh of the Whole of Government safety management system and approaches to drive a safety performance culture.
Contractor Central – Contingent Labour System Contractor Central was introduced in April 2017 and is the Territory’s system for engaging contingent labour services utilising the NSW Government Contingent Workforce arrangement scheme. Comensura is the head contractor for the provision of this service supported by Fieldglass as the Vendor Management System provider.
The scheme makes it easier for all suppliers to do business with the Territory, including improving access by small to medium enterprises (SMEs) to Government goods and services procurement and assisting in reducing red tape.
The scheme acts as a simple, streamlined process for suppliers and allows the Territory access to greater choice, better leverage of the available talent pool and access to a supplier performance management framework which includes satisfaction reviews, invoicing accuracy, response times and system data collection requirements.
The scheme currently has 45 registered suppliers and is taking an average 18 days to fill a position. The top four worker categories being filled are IT management, administration, finance and industry/trade.
Between the introduction of Contractor Central on 3 April 2017 and 30 June 2018, a total of 437 contractors were engaged, including:
167 job postings approved;
104 business units engaged;
176 hiring managers engaged;
95 new work orders created;
40 suppliers engaged; and
18 suppliers had active workers.
During this period, Contractor Central has delivered net savings to the Territory of $2.56 million.
29 State of the Service Report 2017-18
Ethical Behaviour, Professional Standards and Complaint Management During the 2017-18, there were three people appointed as the Public Sector Standards Commissioner. Ms Bronwen Overton-Clarke, formerly the Commissioner for Public Administration, continued to perform the role of the Public Sector Standards Commissioner from 1 July 2017 until 1 December 2017.
Mr Laurie Glanfield AM temporarily filled the Public Sector Standards Commissioner role from 2 December 2017 until 28 January 2018. Mr Ian McPhee AO PSM commenced as the long-term appointee to the Public Sector Standards Commissioner from 29 January 2018 for a period of five years.
The Public Sector Standards Commissioner has important functions under the PSM Act and the Public Interest Disclosure Act 2012. The Commissioner has written to the Head of Service providing an update on the activities of the office during 2017-18. This letter is provided within the State of the Service Report.
The table below provides a summary of matters led by the Commissioner and the office during 2017-18:
Table 1: Summary of matters led by Public Sector Standards Commissioner
Received during 2017-18 Completed during 2017-18
Complaints 24 21
Misconduct investigations 73 52 (includes 19 from 2016-17)
Public Interest Disclosures 1 0
The Commissioner and the office are continuing to focus on preventative measures to moderate or contain the number of matters that result in misconduct referrals, and to implement alternative strategies including mediation, dispute resolution and restorative practices, in order to support a positive workplace culture across the ACTPS.
For further information, please see the Public Sector Standards Commissioner Annual Report 2018.
Establishment of the ACT Integrity Commission Establishing the ACT Integrity Commission is a 2016 election commitment of the Government and is an item in the Parliamentary Agreement.
CMTEDD co-ordinated the input into the Government Response to the 79 recommendations from the Select Committee Report 2017 – Inquiry into an Independent Integrity Commission.
The Government Response was tabled in the Legislative Assembly on 20 March 2018 and is available at https://www.parliament.act.gov.au/in-committees/select_committees/an-Independent-Integrity-Commission/Inquiry-into-an-Independent-Integrity-Commission#tab-1002307-6.
A significant body of work was undertaken on preparing draft legislation in anticipation of an Exposure Bill being referred to the Legislative Assembly Select Committee in July 2018. CMTEDD, in partnership with the JACSD (Parliamentary Counsel’s Office and Legislation, Policy and Programs), prepared the Integrity Commission Bill 2018 and associated policy development prior to referral to

30 State of the Service Report 2017-18
the ACT Legislative Assembly Select Committee for an Independent Integrity Committee 2018. The Government focussed on preparing a Bill which was compliant with the Human Rights Act 2004.
A motion to establish the new Select Committee on an Independent Integrity Commission was tabled by the Government on 6 June 2018.
The Select Committee has two pieces of proposed legislation before it. The Anti-Corruption and Integrity Commission Bill 2018 was presented to the Legislative Assembly by Mr Alistair Coe MLA on 6 June 2018. The ACT Government tabled the Integrity Commission Bill 2018 on 31 July 2018. Both pieces of legislation can be accessed on the Legislation Register (www.legislation.act.gov.au). The Select Committee is due to report by 31 October 2018.
In further support of the Government’s intention to establish an Integrity Commission, in the 2018-19 Budget, the Government committed funding in the order of $8.4m over four years towards the establishment of the Integrity Commission. This funding commences on 1 July 2018.
Work is continuing during 2018-19 to support the ACT Government in the Select Committee on an Independent Integrity Commission Inquiry 2018 and finalise legislation for the ACT Government’s consideration and Legislative Assembly debate. The Government will present a Bill in November 2018 for the Legislative Assembly to debate.
31 State of the Service Report 2017-18
B.8 Human Resources Management
ACT Public Sector Development Programs A range of Whole of Government professional development programs were offered across the ACT Public Sector during the 2017-18 reporting period. In addition to strengthening the capabilities of participating employees, Whole of Government programs offer the opportunity to build collaboration and networks across the ACT Public Sector.
The ACTPS Graduate Program attracts high calibre graduates from across Australia and builds the diversity of our workforce. It is a full time program conducted over ten months, offering graduates three diverse work rotations, tailored learning and development, and permanent appointment upon successful completion. The ACTPS Graduate Program employs candidates to a range of streams including:
Commerce and Business;
Law;
Sustainability/Environment/Planning;
Public Administration and Policy;
ICT; and
Health Professionals.
The learning and development training courses that the graduates complete include Cultural Awareness, Resilience and Wellbeing, Strategic Thinking in the workplace and Working with Ministers. As part of the program, graduates participate in a ‘Graduate Debate’ where two teams work alongside an Executive and debate topics endorsed by the Strategic Board.
Graduates are also required to complete a group research project under the guidance of an Executive sponsor. Topics for the group research project involve real issues, challenges or initiatives that the ACTPS is facing. Topics addressed by the 2017 graduates included:
Open Access (Freedom of Information);
Autonomous Vehicles in the ACT;
Inclusive Canberra – What steps can the Government, business and community do to become the most LGBTIQ-friendly city in Australia?; and
Information Sharing and Family Violence.
In 2017, 160 applicants attended the assessment centre with 51 graduates (our largest ever cohort) being successful and commencing in the 2018 ACTPS Graduate Program. Twenty-five (25) per cent of the cohort are Aboriginal and Torres Strait Islander graduates or graduates with a disability.
The ACTPS has an internal target to continue growing the graduate program each year. In 2019, the graduate program is looking to engage 60 graduates. In 2018-19, a Whole of Government strategic workforce plan for graduate entry level positions will be developed.
Preparation is ongoing for the 2019 Graduate intake. Applications for the 2019 ACTPS Graduate Program closed on 2 May 2018. Close to 1,000 applications were received and 186 progressed to the assessment centres. Work is underway to assess candidates for commencement in February 2019.

32 State of the Service Report 2017-18
SNAPSHOT GRADUATE DEBATE 2017
In August, the 2017 ACTPS Graduate cohort took on the 2016 Graduate cohort to debate the topic “Failure is necessary for innovation”.
The 2017 Graduates, led by Geoffrey Rutledge, Executive Director, Strategic Policy and Cabinet, CMTEDD – Clair Reidy, Daniel Hauptberger and Lucy Albiston – argued for the affirmative whilst the 2016 Graduates – led by Ash Balaretnaraja, Director, Cabinet Office, CMTEDD – Callum Stringer, Kym Johnson and Linda Palmer – argued for the negative.
In what was a very memorable and entertaining debate, Kathy Leigh, Head of Service was delighted to hear a very clear focus on one of our core values, innovation.
Excerpt from the Head of Service message:
“It is important as public servants that we continually look for ways to improve our skills and services, and that we welcome change and new ideas as part of our work. The debate encouraged ongoing dialogue on how we can all engage in innovative thinking and design. The enthusiasm of our past and current graduate’s displayed gives me confidence that the future of our small and dynamic service is in great hands.”
As outlined in Section B.2 (Performance Analysis), in 2017-18, the ACTPS has continued to build the workforce capability required to be an agile, responsive and innovative public service that is able to deliver the Government’s priorities and provide effective services to the ACT community now and into the future.
Strengthening the leadership and capability of the ACTPS executive cohort continued to be a key focus on leading an agile, responsive and innovative public service into the future during the 2017-18 reporting period. The Executive Speaker series focussed on community engagement, digital transformation, collaboration with the National Capital Authority and leadership.
The ‘Leaders Leading Learning’ Program was delivered to 64 Band 1 executives between May 2017 and October 2017 with a focus on leading innovation, engaging with risk and leading transformational change. In 2018-19, executive learning and development will focus on people and culture, change management and citizen-centric design principles to enhance program/project management outcomes.
33 State of the Service Report 2017-18
APPENDIX 1 – COMPLIANCE STATEMENT
The State of the Service Report 2018 must comply with the 2017 Annual Report Directions (the Directions). The Directions are found at the ACT Legislation Register: http://www.legislation.act.gov.au/ni/2017-280/notification.asp.
The Compliance Statement indicates the subsection, under the five Parts of the Directions that are applicable to the Head of Service and the location of information that satisfies these requirements.
Part 1 Directions Overview The requirements under Part 1 of the Directions relate to the purpose, timing and distribution, and records keeping of annual reports. The State of the Service Report 2018 complies with all subsections of Part 1 under the Directions.
In compliance with Section 13 (Feedback), Part 1 of the Directions, contact details for the Head of Service are provided within the State of the Service Report 2018 to provide readers with the opportunity to provide feedback.
Part 2 Directorate and Public Sector Body Annual Report Requirements The requirements within Part 2 of the Directions are mandatory for all directorates and public sector bodies, however due to the functions of the Head of Service and structure of the State of the Service Report, there is no reporting against the following sections of the Directions:
B.3 Scrutiny (see the 2017-18 Annual Report of Chief Minister, Treasury and Economic Development Directorate);
B.4 Risk Management;
B.5 Internal Audit;
B.6 Fraud Prevention;
B.7 Work Health and Safety;
B.8 Human Resource Management (with the exception of learning and development programs and activities);
B.9 Ecologically Sustainable Development; and
C. Financial Management Reporting.
Part 3 Reporting by Exception The Head of Service has nil information to report by exception under Part 3 of the Directions for the 2017-18 period.

34 State of the Service Report 2017-18
Part 4 Directorate and Public Sector Body Specific Annual Report Requirements The Head of Service has nil information for directorate and public sector body specific annual report requirements under Part 4 of the Directions for the 2017-18 reporting period.
Part 5 Whole of Government Annual Report All subsections of Part 5 of the Directions apply to the Head of Service. Consistent with the Directions, the information satisfying these requirements is reported in one place for all ACTPS directorates, as follows:
N. Community Engagement and Support, see the 2017-18 Annual Report of Chief Minister, Treasury and Economic Development Directorate;
O. Justice and Community, including all subsections O.1 (Bushfire Risk Management)- O.4 (Legal Services Direction), see the 2017-18 Annual Report of the Justice and Community Safety Directorate;
Q. Territory Records, see the 2017-18 Annual Report of Chief Minister, Treasury and Economic, Development Directorate.
Subsection P of Part 5 of the Directions requires the Head of Service to produce an annual report on the State of the Service. The information that satisfies the requirements of subsection P is found in the State of the Service Report as follows:
P.1 Culture and Behaviour, see pages 63-73;
P.2 Public Interest Disclosures, see page 29; and
P.3 Workforce Profile, see pages 42-115.
ACT Public Service Directorate annual reports are found at the following web address: https://www.cmtedd.act.gov.au/open_government/report/annual_reports PUBLIC SECTOR
STANDARDS COMMISSIONER
ANNUAL REPORT 2017-18

36 State of the Service Report 2017-18
PUBLIC SECTOR STANDARDS COMMISSIONER ANNUAL REPORT 2017-18
37 State of the Service Report 2017-18

36 State of the Service Report 2017-18
PUBLIC SECTOR STANDARDS COMMISSIONER ANNUAL REPORT 2017-18
37 State of the Service Report 2017-18

38 State of the Service Report 2017-18
39 State of the Service Report 2017-18

38 State of the Service Report 2017-18
39 State of the Service Report 2017-18

ACT Public Service 40 State of the Service Report 2017-18
ACT PUBLIC SERVICE
WORKFORCE 2017-18

ACT Public Service 40 State of the Service Report 2017-18
ACT PUBLIC SERVICE
WORKFORCE 2017-18

ACT Public Service 42 State of the Service Report 2017-18
WORKFORCE COMPOSITION 2017-18
Introduction The ACT Public Sector workforce delivers a wide range of services to the Canberra community, including health, education, planning and urban renewal, transport, law enforcement and the maintenance of community infrastructure and facilities.
At June 2018 the ACT Public Sector consisted of seven ACT Public Service (ACTPS) directorates and twelve public sector bodies.
ACT Public Service Directorates Chief Minister, Treasury and Economic Development Directorate (CMTEDD);
Community Services Directorate (CSD);
Education Directorate (ED);
Environment, Planning and Sustainable Development Directorate (EPSDD);
Health Directorate;
Justice and Community Safety Directorate (JACS); and
Transport Canberra and City Services Directorate (TCCS).
ACT Public Sector Bodies There are a number of public sector bodies which have Head of Service management powers under section 152 of the PSM Act. These public sector employers are those statutory office holders or agencies whose establishing or other legislation prescribes that they may employ staff and that the staff are employed under the PSM Act. In effect, these bodies are a public sector employer that exercises the management powers in their own right and without reference to the Head of Service. These arrangements are appropriate as statutory office holders and these agencies are not part of the public service, but rather part of the broader public sector.
These public sector bodies are outlined below:
ACT Audit Office;
ACT Electoral Commission;
ACT Teacher Quality Institute;
Calvary Health Care ACT (Public)2;
Canberra Institute of Technology;
City Renewal Authority;
Cultural Facilities Corporation2;
2 These public sector bodies have their own payroll system.
ACT Public Service 43 State of the Service Report 2017-18
Director of Public Prosecutions3;
Independent Competition and Regulatory Commission;
Long Service Leave Authority;
Office of the Legislative Assembly2;
Principal Registrar, Courts and Tribunal3;
Solicitor-General and Government Solicitor’s Office3; and
Suburban Land Agency.
Approximately 90 per cent of the ACT Public Sector’s workforce is employed by the seven directorates. The remaining ten per cent fall within public sector bodies which operate independently of the ACTPS. Please note that this is not a complete list of the independent statutory bodies across the public sector, however it does represent those bodies with Head of Service management powers.
3 For the purposes of reporting in the ACT Public Sector Workforce 2017-18 section, the Director of Public Prosecutions, the Principal Registrar, Courts and Tribunal and the Solicitor-General and Government Solicitor’s Office are is included in the workforce profile data of the Justice and Community Safety Directorate, which has portfolio responsibilities for these bodies.

44 State of the Service Report 2017-18
2018 AGENCY SURVEY
Background, Aims and Objectives Section P.1 of the Annual Reports (Government Agencies) Notice 2017 (the Annual Report Directions) requires that the Head of Service produce a report on culture and behaviour within the ACT Public Sector workforce. The Agency Survey is the method by which information on culture and behaviour is collected from ACTPS directorates and public sector bodies.
The aim of the Agency Survey is to collect data on the outcomes delivered under the Respect, Equity and Diversity (RED) Framework and identify how the values under the ACTPS Code of Conduct are being embedded into workplace culture4. These objectives are met through collecting and analysing information via the Agency Survey on the following topics:
the significant achievements, activities, awards and recognition received throughout the reporting period;
learning and development activities provided by directorates and public sector bodies;
human resource strategies employed by directorates and public sector bodies (i.e. attraction and retention, Attraction and Retention Incentives (ARIns), workforce planning, managing performance);
disciplinary action and preventing bullying and harassment; and
the tools and measures used by directorates and public sector bodies to implement the RED Framework and Employment Strategies for Aboriginal and Torres Strait Islander Peoples and People with Disability.
Methodology The ACT Government 2018 Agency Survey was administered by the Workforce Capability and Governance Division (WCGD) within the CMTEDD.
The Agency Survey has been conducted by this method over the past three years.
The Agency Survey was distributed on 14 June 2018 and was open until 18 July 2018. A writable PDF instrument was sent to contacts at each participating directorate and public sector body. Information was then gathered by each directorate and public sector body, and was collated and analysed by WCGD. All seven ACTPS directorates and nine of the 12 public sector bodies completed the Agency Survey.
Development of the Survey Instrument The Survey Instrument was initially developed in collaboration with Human Resources (HR) Directors in 2016. The Agency Survey was then restructured to reflect the main strategic objectives for ACTPS people planning: an agile, innovative, responsive and engaged workforce.
4 From the Annual Reports (Government Agencies) Notice 2017, (the Annual Report Directions) Section P.1 Culture and Behaviour.
45 State of the Service Report 2017-18
The 2018 Agency Survey provided respondents with the opportunity to provide information on significant achievements throughout the reporting period and actions or initiatives that their directorate or public sector body had undertaken during the reporting period. This allowed directorates and public sector bodies to support their data with contextual information and commentary.
The Survey Instrument, a writable PDF, was prepared by WCGD and emailed to directorates and public sector bodies to enable them to participate at their own convenience. Upon completion of the Agency Survey, directorates and public sector bodies were required to gain approval from their delegate prior to submitting their responses to WCGD.
A full copy of the 2018 Agency Survey can be found at Appendix 4.
Reporting Notes Questions that have multiple response options will result in percentages that could add up to more
than 100 per cent. In the case of open-ended questions, respondents often provide more than one reason for their response and in these cases, percentages will add up to more than 100 per cent.
Data has been rounded to one decimal place and as such, percentages may not add up to exactly 100 per cent on certain graphs.
Where possible, comparisons are made within this report between 2016-17 results, 2015-16 results and those results collected by Qualtrics for the 2014-15 reporting period, and Insightrix for the 2013-14 reporting period.

46 State of the Service Report 2017-18
ACT PUBLIC SERVICE WORKFORCE PROFILE 2017-18
Background, Aims and Objectives Section P.3 of the Annual Report Directions requires that directorates and public sector bodies produce a Workforce Profile report, specifically including information on ARIns special Employment Arrangements (SEAs) and Australian Workplace Agreements (AWAs). Further, Section P.3 requires that the State of the Service Report include information at a Whole of Government level on Full Time Equivalent (FTE), headcount and key demographics.
The Workforce Profile information is intended to provide a holistic overview of the ACTPS and analysis of ACTPS workforce data. It includes data, analysis and commentary on employment and key demographics, including part time employment, employment growth, separation rates and diversity. Some tables and graphs are contained in the State of the Service Report while others are available online at: http://www.cmd.act.gov.au/open_government/report/annual_reports.
Further, Workforce Profile data provides a historical summary of indicators based on the ACTPS structure, including high-level time series information. This allows for time series comparison and incorporates retrospective updates that help to remove time lag in human resources data processing.
Workforce statistics contained within the Workforce Profile data are based on information from the ACTPS payroll system and information provided by public sector bodies as at the final pay of June 2018 (‘June 2018’). Some indicators represent the 2017-18 financial year.
Reporting Notes Shared Services, a division of CMTEDD, administers all but one per cent of staff payroll across the
ACTPS directorates and provides the data for the Workforce Profile. The Workforce Profile provides data for the directorates and public sector bodies that are administered through Shared Services.
For the purposes of workforce reporting, the reporting structure has been amended from the 2016-17 report to provide a more accurate representation of the ACTPS. These changes are: Workforce profile information for the Independent Competition and Regulatory Commission,
Long Service Leave Authority and ACT Teacher Quality Institute were previously included within the data of their portfolio directorate. As these agencies are ACT Public Sector Bodies, their workforce data is included in the ACT Public Sector Workforce Profile 2017-18.
For the purpose of reporting in this section: ACTION is included in the reporting of TCCS; and while a public sector body, the Director of Public Prosecutions is included in the Workforce
Profile data of JACS;
Workforce indicators included in the Workforce Profile are based on paid staff and exclude employees on leave without pay, board members and contractors.
The data reported in this section, and the ACT Public Sector Workforce Profile 2017-18 section (including the appendices) excludes contractors and staff of Territory Owned Corporations.
47 State of the Service Report 2017-18
These are point in time indicators and do not adjust for seasonal fluctuation, such as demand for casual teachers and back pay. Directorates and employee cohorts with small numbers are susceptible to fluctuation.
Additional data can be found in Appendix 2, including a detailed breakdown of each directorate’s FTE and further information on ACTPS. Further data and tables can be found on the ACTPS website: http://www.cmd.act.gov.au/open_government/report/annual_reports.
Data has been rounded to one decimal place and as such, percentages may not add up to exactly 100 per cent on certain tables/graphs.

48 State of the Service Report 2017-18
1. AN AGILE WORKFORCE: MEETING THE NEEDS OF THE ACT COMMUNITY AND EFFECTIVELY SERVING THE GOVERNMENT OF THE DAY
1.1 Attraction and Retention Across the ACTPS, directorates seek to develop and implement innovative practices and solutions to assist in recruiting and retaining employees with specialist or critical skills. In the 2018 Agency Survey, all directorates reported that there are areas, or certain groups within their directorates which would benefit from various attraction and retention initiatives.
In the 2018 Agency Survey, directorates were asked to report on the attraction and retention of employees who fell within the following groups:
mature age employees;
Aboriginal and Torres Strait Islander employees;
People with Disability;
entry level positions/traineeships/employees;
people with specialist skills, including leadership skills at the Executive level;
Veterans; and
any other groups.
Five of the seven directorates provided comments relating to mature age employees. In particular, these comments highlighted that the potential loss of corporate knowledge and highly skilled workforce could be an issue. To mitigate risks and reduce the impact associated with employees who may be retiring, several directorates have commenced appropriate workforce planning and incorporated the transfer of information through mentoring and training opportunities. In addition, directorates have further encouraged flexible working arrangements. EPSDD provides an early intervention process, which means mature age employees are able to discuss their needs as their life changes. EPSDD will assist with early intervention strategies, through the provision of reasonable adjustments (if required) and flexible working arrangements to enable and encourage employees to stay in active employment for longer.
All directorates confirmed their commitment to the attraction and retention of Aboriginal and Torres Strait Islander and People with Disability employees within their workforce.
All directorates have Reconciliation Action Plans (RAP). This is discussed in detail later in this section.
Directorates identified various strategies used to increase the recruitment and retention of Aboriginal and Torres Strait Islander and People with Disability employees including:
educating and developing employees and managers (through the transfer of knowledge between staff and through specialised training such as, cultural awareness training and disability awareness training);
49 State of the Service Report 2017-18
providing and promoting reasonable adjustment practices during the recruitment process and within individual workplaces;
continuing to build and maintain culturally safe workplaces;
involving staff in support networks and mentor programs;
culturally proficient workforce planning to include strategies to increase diversity of the workforce and support Aboriginal and Torres Strait Islander and People with Disability employees;
participating in the Whole of Government Inclusion Vocational Traineeships or Australian School Based Apprenticeships (ASBAs);
active involvement with Whole of Government inclusion initiatives (such as the ACTPS Aboriginal and Torres Strait Islander Career Development Program); and
utilising the directorate’s RAP to embed reconciliation into work practices and strengthen the cultural inclusivity of the workplace.
Specific initiatives undertaken by directorates include: the development and implementation of dedicated intranet pages to support managers and supervisors with the employment and retention of Aboriginal and Torres Strait Islander People and People with Disability and the continued implementation of the employment action plan for People with Disability. JACS formed a partnership with NSW Fire and Rescue to implement an Indigenous Fire and Rescue Employment Strategy program to increase representation of Aboriginal and Torres Strait Islander Peoples within the ACT Fire and Rescue Service.
SNAPSHOT ATTRACTION AND RETENTION: EDUCATION DIRECTORATE (EDU)
Education Directorate has undertaken significant work in the 2017-18 reporting period to increase the recruitment and retention of People with Disability.
The Education Directorate established an Accessibility Advisory Group to engage the ideas and perspectives of staff with disability. The first role of the group during the 2017-18 financial year was to co-design an employment action plan for People with Disability 2018-2023. The plan was endorsed in June 2018 and articulates 32 initiatives and a total of 55 actions relating to inclusive workplaces, recruitment, retention, capability development, leadership, collaboration and recognition.
All directorates support and participate in at least one of the Whole of Government entry level programs such as the ACTPS Graduate Program, the Inclusion Vocational Employment Program and the Aboriginal and Torres Strait Islander Vocational Employment Program. Several directorates also participated in the Work Experience Support Program (WESP), creating an avenue for ACT residents from culturally and linguistically diverse backgrounds experiencing significant barriers to obtaining on-going employment by gaining work experience.
Five directorates reported difficulty in attracting employees with certain specialist skills including leadership skills at the Executive level. Several directorates identified issues in attracting and retaining specific classifications while others identified difficulty in attracting skills such as leadership capability. For those directorates, numerous strategies have been implemented to build on their internal leadership and management capability. CSD is commencing a talent identification program ‘Stepping into Executive’ which will focus on developing skilled and values based leaders within their directorate and the Education Directorate has an Aspiring Leaders Program.

50 State of the Service Report 2017-18
SNAPSHOT SPECIALIST RECRUITMENT: TRANSPORT CANBERRA AND CITY SERVICES (TCCS)
During the 2017-18 reporting period, TCCS implemented a number of strategies to address the difficulties in recruiting qualified librarians, including the following: Encouraging current employees to undertake relevant tertiary studies in order to
develop the required capability internally; Paying above the base salary for the Professional Officer Class 1 in order to both
attract and retain the required capability; and Advertising all Professional Officer vacancies in Library specific newsletters and
through Library Associations websites, in order to attract a broader range of applicants.
The ACT Government Veterans’ Employment Strategy was launched in September 2017 with the vision to make the ACTPS a leader in the recruitment and retention of veterans. Three of the seven directorates commented on the recruitment and retention of veterans and noted that appropriate recruitment initiatives focused on bringing veterans into the workforce will be explored in the coming years.
The ACTPS Enterprise Agreements contain provisions for the Head of Service to determine that an employee or group of employees who occupy certain positions should be provided with ARIns that may differ from some of the terms and conditions available under the Enterprise Agreement. It is a requirement of the Enterprise Agreements that ARIns are reviewed annually.
Prior to the introduction of ARIns in 2013, these arrangements were achieved through the use of Special Employment Arrangements (SEAs) and Australian Workplace Agreements (AWAs). SEAs and AWAs continue to apply to until they are ceased by either party. Whilst there continues to be employees covered by SEAs and AWAs in the ACTPS, no new arrangements can be commenced using these instruments.
Table 2 – Attraction and Retention Incentives, Benefits paid under Australian Workplace Agreements and Special Employment Arrangements as at 30 June 2018
30 June 20185
Total number of ARIns as at 30 June 2018 438
Total number of SEAs as at 30 June 2018 5
Total number of AWAs as at 30 June 2018 9
Number of new ARIns commenced in 2017-18 195
Number of ARIns terminated during 2017-18 242
Number of SEAs terminated during 2017-18 4
Number of AWAs terminated during 2017-18 5
Number of ARIns and/or SEAs providing for privately plated vehicles as at 30 June 2018 3
Total additional remuneration paid6 under AWAs, ARIns and SEAs during 2017-18 $17,777,753
5 For the purposes of reporting ARIns, SEAs and AWAs, the City Renewal Authority and Suburban Land Agency data is included in the ACT Public Service Workforce Report. 6 Total additional remuneration paid under AWAs, ARIns and SEAs during 2017-18 is an approximate figure.
51 State of the Service Report 2017-18
ARIns, SEAs and AWAs were provided to employees across a wide range of classifications in all seven directorates throughout the 2017-18 reporting period. Of the 452 ARIns, SEAs and AWAs in place at 30 June 2018, 284 are within the Health Directorate making up 63 per cent of the total number across the ACTPS. The additional remuneration paid under the Health Directorate arrangements accounts for approximately 92 per cent of the total additional remuneration paid in the ACTPS. The arrangements are utilised for a wide range of classifications including Dentists, Health Professionals, Medical Practitioners and Senior Specialists. The arrangements apply to employees with notional salaries ranging from $84,816 per annum to $222,205 per annum.
The other six Directorates reported ARIns SEAs and AWAs being used for officers notionally ranging from an Administrative Services Officer Class 5 (classification salary range: $74,081 - $78,415) to a Senior Officer Grade A (classification salary: $137,415) and across different employment classification types such as Professional Officers and Information Technology Officers.
Please note that some ARIns do not contain additional remuneration and instead may contain some other benefits.
1.2 Age Profile During the 2017-18 reporting period the age profile of ACTPS employees remained consistent with previous years. Graph 1 shows the distribution of the ACTPS workforce by age groups and highlights that the majority of ACTPS workers are aged between 30 and 59 years old.
Of the 22,230 ACTPS employees, 16.9 per cent were 29 years old or younger, 53 per cent were between the ages of 30 and 49 years old, and 30.1 per cent were 50 years old or older.
Graph 1 – Age Profile of the ACTPS Workforce (30 June 2018)
Graph 2 below illustrates the change in the age of the ACTPS workforce over the previous five year period. There have been slight variations in the proportion of each age group from June 2014 to June 2018. The trend continues to show a pattern of gradual ageing of the ACTPS workforce.
The ACTPS workforce experienced the highest growth in headcount during the last twelve months in employees between the ages of 30 to 49 years old with a total increase of 465 employees. The 30 to 39 age group increased by 347 employees and the 40 to 49 age group increased by 118 employees. All other age groups had minimal change in their growth.
138
3,630
6,039 5,745
4,725
1,805
148 -
1,000
2,000
3,000
4,000
5,000
6,000
less than 20 20-29 30-39 40-49 50-59 60-69 70+
Num
ber o
f em
ploy
ees
Age

52 State of the Service Report 2017-18
Graph 2 – Change in ACTPS Age Profile (June 2014 – June 2018)
1.3 Gender Profile At June 2018, the ACTPS consisted of employees who identified as male, female and Indeterminate/Intersex/Unspecified (referred to as Gender X). Employees who identify as Gender X are those individuals who do not exclusively identify as male or female (i.e. a person of a non-binary gender)7.
Gender, as defined in the Australian Government Guidelines on the Recognition of Sex and Gender is ‘part of a person’s personal and social identity. It refers to the way a person feels, presents and is recognised within the community. A person’s gender may be reflected in outward social markers, including their name, outward appearance, mannerisms and dress’8.
For the purposes of reporting in the 2017-18 State of the Service Report, gender information is presented as male/female only. While the ACTPS recognises that there are employees who identify as a gender other than male or female, for privacy reasons this information is not included where data has been broken down by gender.
At June 2018, the ACTPS workforce comprised of 14,505 female employees which is equivalent to 65.2 per cent of the workforce (based on headcount). Similar to last year, the representation of females in the ACTPS is approximately 16 per cent higher than the representation of females in the ACT labour force (49.0 per cent at June 2018)9, and approximately 18.1 per cent higher than in the Australian labour force (47.1 per cent at June 2018)10. In comparison, male employees total 7,722 or 34.7 per cent of the ACTPS.
Illustrated in Graph 3 is the number of female and male employees by age group. Similar to last year, there are more females than males in all age groups across the ACTPS, with the exception of the 70+ cohort which comprises 14.5 per cent more males than females. Given females make up 7 Australian Government Guidelines on the Recognition of Sex and Gender, Australian Government, 2013. 8 Australian Government Guidelines on the Recognition of Sex and Gender, Australian Government, 2013. 9 Australian Bureau of Statistics, Labour Force Australia 6202.0 http://www.abs.gov.au/AUSSTATS/[email protected]/DetailsPage/6202.0August%202018?OpenDocument 10 Ibid
0
1,000
2,000
3,000
4,000
5,000
6,000
Less than 20 20-29 30-39 40-49 50-59 60-69 70 and over
Num
ber o
f em
ploy
ees
Age
2013-14 2014-15 2015-16 2016-17 2017-18
53 State of the Service Report 2017-18
65.2 per cent of the total ACTPS workforce, the higher proportion of females in each age group is to be expected. Of all the age groups, the highest proportion of females is in the 20-29 age group at 69.3 per cent. The lowest proportion of females is in the age group over 70 at 46.6 per cent.
Graph 3 – Gender Profile by Age
At June 2018 the average salary of females in the ACTPS was $90,300 and the average salary of males was $92,443.
The gender pay gap for the 2017-18 reporting period is 2.3 per cent. This means that females in the ACTPS are paid slightly less than their male counterparts. However the pay gap is reducing – it reduced by 0.8 per cent from the previous year.
Research continues to identify and support that gender pay gaps are lower in those organisations with higher representation of females in executive leadership roles11. This is certainly the case for the ACTPS with 46.1 per cent of the Senior Executive Service being females, an increase from 44.7 per cent in 2016-17.
It is important to note that in the ACTPS, females and males undertaking the same job receive the same remuneration. That is, females and males with the same role and responsibilities receive the same salary (for example a female and a male in an Administrative Services Officer Class 6 position receive the same salary, just as a female and a male in a Classroom Teacher 1 position receive the same salary).
11 Cassells R, Duncan A and Ong R (2017), ‘Gender Equity Insights 2018: Inside Australia’s Gender Pay Gap, Bankwest Curtin Economics Centre, Workplace Gender Equality Agency - Gender Equity Series, Issue #2, March 2017.
73
2,517
3,986 3,775
3,016
1,069
6965
1,112
2,053 1,9691,708
736
790
1,000
2,000
3,000
4,000
less than 20 20-29 30-39 40-49 50-59 60-69 70+
Num
ber o
f em
ploy
ees
Age
Female Male

54 State of the Service Report 2017-18
Graph 4 – Gender Profile by Salary Range (June 2018)
Graph 4 shows the number of male and female employees across different salary groups in the ACTPS. There are significantly more females in the $60,000-$119,000 salary groups, while in the $40,000-$59,000 and over $120,000 salary groups the number of females and males is more similar.
Over the past year the number of females has increased in all salary groups above $80,000. The highest increase was within the $80,000 to $99,000 range from 3,755 in 2017 to 4,002 in 2018. Comparatively, over the same period the number of males has remained consistent across all salary ranges.
Females hold 46.1 per cent of Senior Executive positions in the ACTPS, a proportion roughly equivalent to that of four years ago (44 per cent at June 2013). Of those Senior Executive positions five out of seven Directors-General are females. Females hold a similar proportion of Statutory Office Holder positions at 46.7 per cent.
Females working in the ACTPS hold a diverse range of professions, including: Administrative Officers, Ambulance Officers, Fire and Rescue Officers, Information Technology Officers, Teachers and Transport Officers. At June 2018 the professions with the highest proportion of female employees were: Nurses and Midwives (87.1 per cent), Health Professional Officers (78.4 per cent), Teachers (77.3 per cent), Legal Officers (76.5 per cent) and Health Assistants (76.3 per cent).
Graph 5 provides an overview of the average salary growth of females over the last five years in comparison to other diversity groups and the overall ACTPS workforce.
6
1,214
3,8054,002
3,104
1,355
9
946
2,372
1,424 1,327 1,172
0
1,000
2,000
3,000
4,000
<$39,000 $40,000-$59,000
$60,000-$79,000
$80,000-$99,000
$100,000-$119,000
>$120,000
Num
ber o
f em
ploy
ees
Salary
Female Male
55 State of the Service Report 2017-18
Graph 5 – Comparison of average salary (June 2014 - June 2018)
1.4 Part Time Employment The ACTPS is committed to accommodating flexible work arrangements including part time working arrangements. In the ACTPS, employees who work part time make up almost one quarter of the workforce. The high proportion of permanent part time employees in the ACTPS demonstrates that this commitment is being supported through part time arrangements. Part time work allows employees to combine employment with other activities such as education or raising or caring for family, and allows both female and male employees to maintain a healthy work life balance while progressing their careers.
Displayed below in Graph 6 is the ACTPS workforce by employment mode. At June 2018, 24.7 per cent of the workforce worked part time (5,496 employees).
At 24.7 per cent, the percentage of part time employees in the ACTPS is lower than both the percentage of part time employees in the ACT labour force (27.6 per cent)12 and the Australian labour force (32.2 per cent)13 at June 2018.
12 Australian Bureau of Statistics, Labour Force Australia 6202.0. http://www.abs.gov.au/AUSSTATS/[email protected]/DetailsPage/6202.0August%202018?OpenDocument 13 Ibid.
$70,000
$75,000
$80,000
$85,000
$90,000
$95,000
2014 2015 2016 2017 2018
Aver
age
sala
ry
ACTPSFemaleCulturally and Linguistically DiversePeople With DisabilityAboriginal and Torres Strait Islander Peoples

56 State of the Service Report 2017-18
Graph 6 – ACTPS Workforce by Employment Category (June 2018)
As can be seen in Table 3, at June 2018 there were 917 part time Culturally and Linguistically Diverse employees, representing 16.7 per cent of the total number of part time employees. People with Disability made up 2.2 per cent, and Aboriginal and Torres Strait Islander Peoples made up 1.4 per cent.
Consistent with previous years, the majority of ACTPS part time employees are female (83 per cent). At 30 June 2018, 31.4 per cent of females worked part time in comparison to 12.1 per cent of males. The percentage of males who work part time has increased by 0.6 per cent within the last 12 months.
The proportion of ACTPS part time employees who are female is approximately 15 per cent higher than the percentage of female part time employees in both the ACT labour force14 (68.2 per cent) and Australian labour force15 (69 per cent) at June 2018.
In the ACT labour force, 38.6 per cent of all females work part time compared to 17.1 per cent of all males16, and in the Australian labour force 47.2 per cent of females work part time compared to 18.9 per cent of all males17.
Table 3 – Part time employment by diversity (June 2018)
ACTPS Females
Aboriginal and Torres Strait
Islander Peoples
People with Disability
Culturally and Linguistically
Diverse
Permanent part time 4,456 3,729 54 96 744
Temporary part time 1,040 834 21 23 173
Total part time 5,496 4,563 75 119 917
14 Ibid. 15 Ibid. 16 Ibid. 17 Ibid.
56.1%
20.0%
12.6%
4.7%6.6%
Permanent Full Time
Permanent Part Time
Temporary Full Time
Temporary Part Time
Casual
57 State of the Service Report 2017-18
As shown in Table 3, part time employees within the ACTPS are predominantly employed on a permanent part time basis, with these employees making up 81.1 per cent of all part time employees. Over the past three years, trends within the part time workforce have remained consistent. The percentage of females who work part time has changed 1.1 per cent from 84.1 per cent in 2016 to 83 per cent in 2018 and the proportion of part time employees who identified with a diversity group has also remained largely unchanged. The most significant change has been the slight reduction of part time employees who are permanent. This has declined by 2.1 per cent (83.2 per cent in 2016 to 81.1 per cent in 2018).
The ACTPS average salary for part time employees was $84,433 at June 2018. The average salary of females and males working part time was approximately equivalent, with females earning an average part time salary of $84,393 and males earning an average part time salary of $84,628. The gap between the average part time salary for females and males has reduced from $1,057 to $235 since the 2016-17 reporting period.

58 State of the Service Report 2017-18
2. INNOVATIVE AND RESPONSIVE: PEOPLE PLANNING FOR THE FUTURE
2.1 Workforce Planning The ACTPS workforce is being shaped and supported through Whole of Government workforce strategies to drive a more agile, responsive and innovative service into the future. Workforce transformation is a key priority for the government, to ensure that the ACTPS is an effective and efficient public service, focussed on delivering the Government’s strategic agenda and meeting community needs, with the agility to deliver consistently, responsively and sustainably into the middle of the 21st century.
As mentioned in section B.2 (Performance Analysis), strategic workforce planning activity has commenced across the ACTPS. Examples of transformative Whole of Government projects already in motion include the ACTPS Learning and Development Strategy; ACTPS Leadership Development Strategy (People), Culture Ready and the new government office blocks with the transition to Activity Based Working (ABW) environments.
In addition, following on from previous years’ work, the ADAPT (Align, Design, Analyse, Program and Transform) Strategic Workforce Planning Toolkit (ADAPT Toolkit) was launched as a fully accessible and interactive smart-form and assists users to build workforces around key service delivery into the future, supporting work areas to continue to effectively deliver on government priorities and future service commitments. Further information regarding the Whole of Government workforce capability initiatives can be found at section B.2 (Performance Analysis) in the Head of Service Annual Report.
In the 2018 Agency Survey, directorates were asked to report on whether their directorate had a workforce plan in place and what the key workforce strategies are to position the directorates to meet future workforce demands.
Four of the seven directorates reported that they have a strategic workplace plan in place, identifying that their workforce plan was guided by issues specific to their directorate. With an additional directorate advising that while they do not have a strategic workforce plan in place, they have a Workforce Planning Toolkit available to managers to use and undertake workforce planning activities within their own business units.
The Health Directorate advised that their workforce strategy will support the delivery of a sustainable workforce, able to deliver person–and family-centred, safe and high quality care into the future. JACS launched its Workforce Strategy 2017-19 in July 2017 with an aim to build a workforce that is engaged, enabled and empowered to achieve the directorate’s strategic goals and operational imperatives into the future. JACS indicated that the focus of its Workforce Strategy is for the directorate to be seen as an employer of choice and this will be achieved through driving best practice in contemporary and responsive workforce management systems. JACS have also implemented business unit specific strategies that address specific issues affecting the particular business unit.
The Education Directorate have drafted a Workforce Capability Strategy outlining high level themes that identify areas of need with initiatives to be prioritised across the system to address priority areas providing a clear plan for the Education workforce. The aim of the Workforce Capability Strategy is to provide a comprehensive, system level approach to organisational development
59 State of the Service Report 2017-18
through capability building and other initiatives including induction, health and wellbeing, leadership development, performance management and mentoring. The ACTPS values are an inherent part of the Education Directorate’s Workforce Capability Strategy, which is expected to be delivered in 2019.
2.2 Employment Growth At 30 June 2018, the ACTPS comprised 22,230 employees18. Employment has experienced another year of relative small growth of 2 per cent or 439 employees (based on headcount) during 2017-18 reporting period. FTE employment increased by 2.2 per cent, or 421.2 FTE over the same period. At 2 per cent, the employment growth is similar to that of the Australian labour force (employment growth of 2.4 per cent) over the same period.
While the ACTPS increased by 439 employees, 87.2 per cent or 383 employees were permanent, 12 per cent or 54 employees were temporary and casual employees grew by 0.5 per cent for the reporting period. Table 4 displays the ACTPS employment growth by directorate for the June 2017 to June 2018 period.
All directorates experienced relatively similar employment growth, with EPSDD experiencing the largest growth at 11.5 per cent. EPSDD’s growth is due to Machinery of Government (MOG) changes and several business areas joining their directorate during the reporting period. CMTEDD was the only directorate to experience a decrease in employee headcount (-2 per cent). This too can be attributed to MOG changes and staff being transferred to both TCCS and EPSDD.
Table 4: ACT Public Service Employment Growth by Directorate
Headcount FTE
ACTPS Directorates Jun-17 Jun-18 Change (%) Jun-17 Jun-18 Change (%)
Chief Minister, Treasury and Economic Development Directorate
2,457 2,411 -2.0 2,362.3 2,318.6 -1.8
ACT Insurance Authority 18 18 5.3 17.6 18.3 3.9
Community Services Directorate 892 933 4.4 835.9 865.8 3.6
Education Directorate 6,578 6,814 3.5 5,438 5,664.1 4.2
Environment, Planning and Sustainable Development Directorate
595 672 11.5 561.1 635.1 13.2
Health Directorate 7,403 7,607 2.7 6,476.3 6,661.2 2.9
Justice and Community Safety Directorate 1,818 1,869 2.7 1,729.5 1,781.0 3.0
Transport Canberra and City Services Directorate 1,882 1,906 1.3 1,711.3 1,753.9 2.5
ACTPS Directorates Total 21,791 22,230 2.0 19,13219 19,697.9 2.95
18 For the 2017-18 reporting period, the reporting structure changed slightly. All public sector bodies were removed see pages 46-47 for details. 19 The total FTE for June 2017 does not match the figure reported in the 2017 State of the Service Report due to the changes in reporting structure. See pages 46-47 for an explanation of these changes.

60 State of the Service Report 2017-18
Table 5: ACT Public Service Employment Growth by Classification
Classification group Jun-17 Jun-18 Change %
Administrative Service Officers 5,391 5,500 2.0
Ambulance Officers 233 215 -7.7
Ambulance Support Officers20 n/a 48 n/a
Bus Operators 716 740 3.4
Correctional Officers 213 217 1.9
Dentists/Dental Officers 17 16 -5.9
Disability Officers 4 3 -25.0
Executives 235 243 3.4
Fire and Rescue Officers 334 336 0.6
General Service Officers and Equivalent 1,206 1,194 -1.0
Health Assistants 123 114 -7.3
Health Professional Officers 1,430 1,459 2.0
Information Technology Officers 164 176 7.3
Judicial Officers 15 14 -6.7
Legal Officers 119 132 10.9
Legal Support 20 20 0.0
Linen Production and Maintenance 58 53 -8.6
Medical Officers 914 932 2.0
Nursing and Midwifery 3,108 3,159 1.6
Professional Officers 228 226 -0.9
Prosecutors 39 44 12.8
Rangers 41 47 14.6
School Leaders 750 752 0.3
Senior Officers 2,422 2,494 3.0
Statutory Office Holders 12 1521 25.0
Teachers 3,626 3,736 3.0
Technical Officers 280 272 -2.9
Trainees and Apprentices 48 38 -20.8
Transport Officers 45 35 -22.2
Total 21,791 22,230 2.0
Table 5 breaks down employment growth by classification groups, by headcount. Just over half the ACTPS classification groups experienced employment growth. The largest growth was seen in the
20 Ambulance Support Officers is a new category for the 2017-18 reporting period. Previously Ambulance Support Officers and Ambulance Officers were reported together. They have been separated to provide a more accurate view of the ACTPS workforce. 21 During 2017-18 there were two new Statutory Office Holders including, the Public Sector Standards Commissioner and the Principal Registrar.
61 State of the Service Report 2017-18
following classification groups; Rangers 14.6 per cent, Legal Officers at 10.9 per cent, Prosecutors at 12.8 per cent and Information Technology Officers at 7.3 per cent.
2.3 Salary Growth The average salary of the ACTPS was $91,046 at June 2018. This is slightly higher than the previous reporting period when the average salary was $90,650 at June 2017. The ACTPS average salary is just below the average salary of an individual in the ACT labour force ($94,427 at May 2018)22, and approximately $9,000 higher than the average salary of an individual in the Australian labour force ($82,700 at May 2018)23.
A five year average salary growth chart for the various diversity groups can be viewed at Graph 5 on page 55.
The most significant increase in this area was for employees identifying as Aboriginal and Torres Strait Islander Peoples. At June 2018 the average salary of employees identifying as Aboriginal and Torres Strait Islander Peoples was $82,798, an increase of 3.7 per cent since June 2017. Given the considerable work undertaken across the ACTPS during the 2017-18 reporting period to support and strengthen the participation of Aboriginal and Torres Strait Islander Peoples in the ACTPS workforce it is encouraging to see an increase in the average salary.
The average salary of female employees ($90,300) continues to be slightly under that of the average ACTPS salary, a trend that is likely attributable to the proportionally larger number of female employees choosing part time work across the ACTPS.
Meanwhile the average salary of employees identifying as Culturally and Linguistically Diverse increased by 1.0 per cent over the reporting period. At June 2018 the average salary of employees identifying as Culturally and Linguistically Diverse was $87,199.
From June 2017 to June 2018, the average salary of People with Disability increased from $90,504 to $91,174, an amount $133 higher than the average salary of the ACTPS.
Table 6 – Appointments and Promotions (July 2013 – June 2018)
Financial Year
Total Appointments/ Promotions/
Transfers Appointment from External
Appointment from Temporary
Contract Promotion from HDA
Permanent Transfer/
Promotion
2013-14 2,826 15.5% 34.4% 18.7% 31.4%
2014-15 2,734 15.1% 33.4% 19.7% 31.8%
2015-16 2,923 14.9% 32.6% 21.1% 31.4%
2016-17 3,060 15.7% 33.0% 22.9% 28.4%
2017-18 3,444 14.1% 36.1% 22.4% 27.3%
Table 6 provides an overview of ACTPS appointments and promotions from July 2013 to June 2018. As can be seen from the table, the total number of appointments/promotions/transfers for the period 2017-18 has increased to 3,444 from the previous year of 3,060. Of this, appointments from a temporary contract has had the highest proportion at 36.1 per cent. This was a slight increase of
22 Australian Bureau of Statistics, Average Weekly Earnings, Australia 6302.0, Australian Capital Territory, 2017. 23 Australian Bureau of Statistics, 6302.0 - Average Weekly Earnings, Australia, Nov 2017.

62 State of the Service Report 2017-18
3.1 per cent from the previous year. The three other groups had minimal reductions of between 0.5 per cent and 1.6 per cent.
Over the five years, the trends have remained much the same without too much variance of each group. Appointment from temporary contracts has continued to amount to a third of the total Appointments/Promotions/Transfers.
63 State of the Service Report 2017-18
3. UPHOLDING THE ACT PUBLIC SERVICE VALUES
The ACTPS Employee Values and Signature Behaviours define who we are as an organisation. The ACTPS employee values of Respect, Integrity, Collaboration and Innovation are enshrined in the Public Sector Management Act 1994 (PSM Act).
ACTPS directorates strive to promote and uphold the ACTPS Values and Signature Behaviours and implement innovative practices and solutions to assist employees in incorporating these practices into their work.
SNAPSHOT EMBEDDING VALUES: TRANSPORT CANBERRA AND CITY SERVICES DIRECTORATE (TCCS)
A specific set of questions were asked about the ACTPS values in the TCCS 2017 Employee Survey. The results received led to ‘Embedding Values’ being one of the four areas of focus for the TCCS wide action planning. A focus group which was open to all TCCS employees was held to discuss ways in which TCCS could embed the values. The outcome of this Focus Group was three actions that were to be undertaken across TCCS: Clear expectations: clear and consistent explanation of the behaviours that are
expected in line with the Values: Conduct a series of workshops to articulate the good and unacceptable behaviours under each value.
Recognition and sponsorship of values: Establish a working group to redesign the approach to reward and recognition. Propose solution to Executive Board.
Innovation / Continuous improvement: ‘Wicked Problems’ Create small Tiger Teams to work on issues within an agreed time period. Pilot underway in City Services. Lessons learned to be shared across TCCS.
Acting on feedback from the 2017 TCCS Employee Survey, a series of Values Workshops have been undertaken with employees from across TCCS. To ensure there is a clear and consistent understanding of the TCCS Values and how they translate into our day to day behaviours, the workshops articulated the behaviours that demonstrate the TCCS values and those that detract from them. The behaviours associated with each value, as developed by participants in the workshops will be proposed to the TCCS Executive Board for approval. Following this, the behaviours will then be incorporated into training, performance management support material, and the induction program. An implementation plan will be developed with input from workshop participants to make the behaviours a living part of the TCCS culture.
In the 2018 Agency Survey, directorates were asked to report on some of the activities undertaken to promote the values. Some examples of these activities include:
Inclusion of values sessions in employee induction programs;
Fraud and Ethics, Risk Management and Respect, Equity and Diversity (RED) Training;
Inclusion of workplace values in performance frameworks;

64 State of the Service Report 2017-18
Hosting regular directorate consultative forums;
Inclusion of values aligned categories in Awards and Recognition Programs;
Celebration of significant dates and events; and
Promotion of White Ribbon awareness.
SNAPSHOT VALUES JOURNEY: COMMUNITY SERVICES DIRECTORATE (CSD)
CSD Values Journey
All staff were consulted and invited to be involved with the Values Journey and varying methods of engagement were utilised including crowd sourcing, focus groups, world café sessions and the creation of a values toolkit, leadership materials and training programs, along with a CSD Values Promise. The Values Promise sets out how the ACTPS Signature Values and Behaviours guide our work.
It represents our commitment to each other, and how we work with our stakeholders, partners and clients.
CSD held values focus groups which were an opportunity for all staff to work with their colleagues to unpack the values. Through these focus groups, staff defined each of the values and how they guide our work and represent our commitment to each other and how we work with our stakeholders and partners. They unpacked the values of Respect, Integrity, Collaboration and Innovation and created enjoyable conversations with their colleagues.
During this time, ‘values trees’ were displayed throughout all CSD locations. Leaves in the four colours associated with the values were provided to all staff. Staff were invited to have values conversations within their teams and to write a message on a leaf together and attach it to a tree.
The World Café saw the next set of important conversations in our values journey. It was designed to provide an opportunity for all staff to engage with our senior executives on each of our values. Discussions were centred on the application of values in the workplace and the things all staff can do to make them a part of everyday practice and to make CSD a great place to work.
Throughout the Values Journey, various crowd-sourcing activities were held. This tool, which everyone in CSD could access, invited staff to reflect on a specific question and to share their thoughts and experiences. Staff were able to see what their peers and colleagues were sharing and vote on the responses which resonated. They highlighted our values conversations and staff received an info graphic summarising responses and this then became a further opportunity to talk about how we can make our workplace a great place in which to work. The first activity attracted 1,507 votes and 96 answers.
65 State of the Service Report 2017-18
3.1 Appropriate Workplace Behaviour The 2018 Agency Survey asked directorates to report on the number of bullying and harassment contacts received during the 2017-18 reporting period, and whether the directorate had a formal system in place for the management of bullying and harassment. All seven directorates reported that they had a formal reporting system in place during 2017-18 for the management of bullying and harassment.
Table 7 provides information on the various mechanisms for reporting bullying and harassment within the ACTPS. The figures captured in Table 7 are the total number of contacts received of potential bullying and harassment. This is a subjective indicator. It is important to note that a contact of bullying and harassment is based on the perception of the employee and is not a ‘one for one’ indicator of bullying and harassment. It is possible for an employee to report through multiple mechanisms, or, have multiple employees make a report for the same matter. Any reports of this nature are reviewed by the relevant manager or executive and the HR area, which may require further action or investigation. After this occurs it may be found that formal bullying and harassment did not occur.
Table 7 – Mechanisms of Reporting Bullying or Harassment (2016-17 to 2017-18)
2016-17 2017-18
Contacts received by directorate RED Contact Officers 49 75
Contacts received by HR (not by a RED Contact Officer) 147 121
Contacts received through RiskMan24 132 168
Contacts received through other mechanisms 2 3
All respondents to Agency Survey: 2016-17 = 7, 2017-18 = 7
As shown in Table 7, during 2017-18 the total number of contacts of bullying and harassment has increased since 2016-17. The majority of bullying and harassment contacts were made through the RiskMan automated incident reporting system and directorate HR areas with approximately 80 per cent of contacts coming through these channels. These reporting trends are reflective of the significant recent efforts in educating employees on both when and how to make contact about bullying and harassment and the introduction in 2015 of the RiskMan automated reporting system.
While the majority of bullying and harassment contacts were received by directorate HR areas and RiskMan, directorate RED Contact Officers were also utilised by employees to make contact about bullying and harassment matters, with approximately 18 per cent of all reports coming through that channel in 2017-18.
Table 7 should be read with Table 8.
24 In 2016-17, the number of contacts received through RiskMan was reported incorrectly due to an error in the reporting methodology. It should have been reported as 132 contacts, not 38. The data in 2016-17 and 2017-18, represents the total number of reports made through RiskMan by an ACTPS employee where the cause selected by the employee is ‘work colleague’.

66 State of the Service Report 2017-18
Table 8 – Reports of Bullying or Harassment (2016-17 to 2017-18)
2016-17 2017-18
Number of reports of bullying or harassment where a preliminary assessment under Section H of ACTPS Enterprise Agreements was commenced during the 2017-18 financial year
86 225
Number of reports of bullying or harassment received during the 2017-18 financial year that resulted in a misconduct process under Section H of ACTPS Enterprise Agreements25
11 14
Number of bullying or harassment related misconduct processes completed during the 2017-18 financial year where a breach of section 9 of the PSM Act was found to have occurred26
5 8
Number of bullying or harassment related misconduct processes that are currently underway/being investigated, as at 30 June 201827 6 11
All respondents: 2016-17 = 7, 2017-18 = 7
When comparing Table 7 and Table 8 above, a large difference exists between the total number of reported experiences of bullying and harassment in Table 7 and the total number of reports of bullying and harassment resulting in a finding of bullying or harassment through a misconduct process reported in Table 8. This demonstrates that many of the complaints were either resolved within the workplace without the need for further intervention, or were found during a preliminary assessment to not involve behaviour that was considered bullying or harassment. The total number of instances of bullying or harassment where a breach of section 9 of the PSM Act was found to have occurred has remained relatively consistent over the past two years.
Under the Enterprise Agreements, directorates are required to conduct a preliminary assessment of a report of bullying or harassment to determine whether a formal investigation is required or if the matter can be resolved through other means. Where it is determined that an investigation is required, the matters are referred to the Professional Standards Unit (PSU). The reporting trends are reflective of the significant recent efforts in educating and training managers in undertaking preliminary assessments.
The PSU was formed in December 2015 to improve and standardise investigations in the ACTPS. All misconduct investigations in the ACTPS are conducted, or overseen by the PSU under the auspices of the Public Sector Standards Commissioner with a small number of cases being referred to an external investigator by PSU. Investigations are undertaken in accordance with the provisions of the relevant ACTPS Enterprise Agreement, the PSM Act and the Public Sector Management Standards (PSM Standards).
The number of formal misconduct processes relating to bullying and harassment which were referred to the PSU (and before the establishment of the PSU on 19 December 2015, to Shared Services Employee Relations) are displayed in Table 9 below.
25 The data in 2017-18 was sourced from data held centrally by the PSU. 26 The data in 2017-18 was sourced from data held centrally by the PSU. 27 Total number of investigations commenced, completed and ongoing may not reconcile due to action across financial years. The data in 2017-18 was sourced from data held centrally by the PSU.
67 State of the Service Report 2017-18
Table 9 – Misconduct processes relating to bullying and harassment investigated by the PSU (formerly Shared Services Employee Relations) from 2013-14 – 2017-18
2013-14 2014-15 2015-16 2016-17 2017-18
Number bullying or harassment investigations 17 11 16 12 18
3.2 Discipline Action Table 10 shows the number of misconduct investigations commenced with a suspected breach of Section 9 of the PSM Act, during the 2016-17 and 2017-18 reporting periods. Data is held centrally by the PSU. Section 9 of the PSM Act provides the general obligations of public employees. Procedures for dealing with misconduct are provided in the employee’s relevant Enterprise Agreement.
A misconduct investigation may involve one or more suspected breaches of Section 9 of the PSM Act. Reporting investigations rather than breaches provides a more realistic sense of the level of discipline action across the ACTPS.
Table 10 – Misconduct Investigations Commenced
2016-17 2017-18
Number of misconduct investigations commenced with a suspected breach of section 9 of the PSM Act 70 73
Table 11 – Investigations completed in 2017-18 where a Breach(es) of Section 9 was found to have occurred or where allegations were not sustained
2016-17 2017-18
Number of investigations where a breach of section 9 of the PSM Act was found to have occurred 68 45
Number of investigations where the allegations were not sustained 12 7
Prior to 19 December 2015, directorates conducted their own investigations, or in the case of more complex matters, they were referred to the PSU for investigation.
On 19 December 2015, the Strategic Board determined that misconduct investigations should be conducted through a centralised team, the PSU. Table 12 shows the time taken to complete those investigations from available data held within PSU.
Table 12 – Average Length of Time to Complete Misconduct Investigations Undertaken by PSU 2013-14 to 2017-18
2013-14 2014-15 2015-1628 2016-17 2017-18
Number of investigations completed 26 23 42 8029 5230
Average time to complete investigations in working/business days 124 83 101 96 101
28 The 2015-16 figures have been adjusted to reflect a consistent methodology of calculating statistics between financial years, and as such may differ from figures reported in previous versions of the State of the Service Report. 29 Includes full investigations and taking of admission statements by PSU. 30 Includes full investigations and taking of admission statements by PSU.

68 State of the Service Report 2017-18
The PSU has focussed on providing quality investigations while also improving and maintaining timeliness. As a centralised team, the PSU is well equipped to conduct investigations on behalf of the ACTPS in an effective and efficient way.
During the 2017-18 financial year, the PSU received fewer investigation referrals and the average time to complete was slightly higher than the previous year. This was primarily due to the investigations being of a larger scale and higher complexity.
Directorates were asked to report on the sanctions imposed as a result of misconduct processes completed in the 2017-18 financial year where misconduct was found to have occurred. Table 13 shows the number of outcomes and sanctions imposed as a result of misconduct processes over the last five years in the ACTPS. It is important to note that more than one sanction can be issued as a result of misconduct and as such the number of misconduct processes resulting in a breach may not reconcile with the total number of sanctions.
Table 13 – Disciplinary Sanctions since 2013-14 to 2017-18
2013-14 2014-15 2015-16 2016-17 2017-18
Misconduct found, but no sanction applied 8 3 4 4 0
Written warning and admonishment31 32 37 21 34 14
Other financial penalty n/a n/a 2 7 6
Transfer, temporarily or permanently, to other position at level n/a n/a 5 2 4
Transfer, temporarily or permanently, to other position at lower classification 5 2 2 3 5
Termination of employment 14 15 11 19 19
Employee resigned prior to sanction being imposed n/a 7 9 15 2
All respondents: 2013-14 = 15, 2014-15 = 14, 2015-16 = 8, 2016-17 = 7, 2017-18 = 7
As shown in Table 13, during 2017-18 the most common outcome reported where a breach was determined was the sanction of termination of employment, closely followed by the issuing of a written warning and admonishment. This significant sanction has consistently been the most used over the past five years.
3.3 Fraud and Risk All seven directorates had a Senior Executive Responsible for Business Integrity Risk (SERBIR) in place throughout the 2017-18 reporting period. Further, five directorates reported that a formal risk assessment had been undertaken in accordance with the Risk Management Standard during 2017-18.
Directorates identified a number of common key and emerging risks, including:
information management and storage;
ICT and cyber threats, including the loss or misuse of sensitive data and information;
31 Figures for 2013-14 and 2014-15 include data associated with ‘written admonishment’ and ‘first or final written warning’ notices reported in previous editions of the State of the Service report.
69 State of the Service Report 2017-18
prevention, preparedness and response to environmental threats (loss of utilities and key infrastructure due to physical and environmental conditions);
public safety (including Events, Crowded Places);
population health due to influenza outbreak; and
fraud and corruption.
All seven directorates identified their intentions to review the risk assessment process within their directorate during the 2018-19 reporting period. These directorates noted the timing and event triggers of these reviews included:
the review of the ACT Government Risk Management Framework by the ACT Insurance Authority;
risk assessment process undertaken in line with business planning cycle;
directorate restructure (including MOG changes);
ongoing review as part of risk management framework and business continuity planning; and
introduction of an ICT risk management solution.
In the 2017-18 reporting period, all seven directorates reported that they had a current Fraud and Corruption Plan. All directorates reported that they had reviewed their Fraud and Corruption Plan within the past two years.
Directorates were asked to rate a number of integrity risks within their organisation against a category of low, medium, high or extreme. The risk areas were:
Fraud and Integrity;
Asset Management;
Procurement and Contract Management;
Finance;
Fraud (clients);
IT Systems; and
Other (please specify).
For the 2017-18 reporting period, the most common risks identified by directorates under each risk rating was:
Low risk category: Fraud (clients);
Medium risk category: Fraud and Integrity, Asset Management, Procurement and Contract Management and Finance; and
High risk category: IT Systems.
No directorates identified a risk as extreme.
All directorates reported that an Internal Audit Committee was in operation for the 2017-18 reporting period. Each committee was reported to include members who are external to the directorate, including the Chair.

70 State of the Service Report 2017-18
3.4 ACTPS Respect Equity and Diversity (RED) Framework The ACTPS is committed to creating a positive, respectful, supportive and fair work environment where employee differences are respected, valued and utilised to create a productive and collaborative workplace. The RED Framework, launched in 2010, supports the ACTPS in achieving this commitment, and in meeting its obligations under the PSM Act. During the 2017-18 reporting period, all seven directorates provided RED specific training to employees, with approximately 1,032 staff undertaking training during the reporting period.
The 2018 Agency Survey asked directorates to provide comment on the different activities they used during the 2017-18 reporting period to continue to reinforce the RED message.
Table 14 – Activities to Promote the RED message (2017-18)
Number of Directorates
Executive support of National Aborigines and Islanders Day Observance Committee (NAIDOC Week) activities 7
Workplace celebrations of Harmony Day 5
International Women’s Day events 6
Disability training 6
Aboriginal and Torres Strait Islander cultural awareness training 7
Lesbian, Gay, Bisexual, Transgender, Intersex and Queer (LGBTIQ) awareness training 5
All respondents: 2017-18 = 7
In addition to the activities mentioned in Table 14, directorates reported undertaking other initiatives to promote the RED message. These initiatives included:
the establishment of a directorate RED Network;
implementation of a directorate specific RAP;
inclusion of RED categories in award and recognition programs;
cultural awareness training for staff and managers;
provision of RED training;
provision of Domestic and Family Violence Awareness training;
establishing a directorate network for Aboriginal and Torres Strait Islander employees, and network for People with Disability; and
steps taken towards receiving accreditation by White Ribbon Australia.
71 State of the Service Report 2017-18
Table 15 – Promotion of the RED Framework (2017-18)
Number of Directorates
RED Overview sessions (separate from formal RED training) 5
Regular discussions regarding RED issues 6
A RED network that meets quarterly or more frequently 6
Other 5
All respondents: 2017-18 = 7
All directorates reported using a range of communication methods to provide details of their RED Contact Officers. Details were provided on the intranet and staff directory in all directorates. Six directorates provided details of RED Contact Officers in common areas and on notice boards, three directorates provided details on their website and two directorates made the details available through their switchboard.
In addition to the above, directorates reported the following methods for ensuring staff had access to the details of RED Contact Officers:
posters and promotion of access to RED Contact Officer details in Organisational Development workshops;
information provided in directorate induction sessions and through RED Training;
access to the Whole of Government RED Contact Officer list on the ACT Government Directory; and
self-promotion of RED Contact Officers, such as the display of posters at the location of their workstation.
SNAPSHOT RED: CHIEF MINISTER, TREASURY AND ECONOMIC DEVELOPMENT DIRECTORATE (CMTEDD)
CMTEDD developed an interactive presentation providing a 45 minute overview of the RED Framework, allowing attendees to answer questions relating to the RED Framework using their laptops or mobile devices in real-time. The presentation allows participants to submit anonymous responses to questions without being biased by the responses of other participants in the room. This approach also allows the facilitator to get a deeper understanding of the level of knowledge and perceptions from participants, and challenge what they might consider to be acceptable workplace behaviour.
Feedback received from the pilot session was positive and the intention is to make this overview session available to business units in 2018-19.
The 2018 Agency Survey asked if directorates had conducted a Diversity Census and/or a ‘Update your Details’ process during the 2017-18 reporting period. Two directorates reported that they had conducted both a Diversity Census and an ‘Update your Details’ process, a further three directorates reported that they conducted an ‘Update your Details’ process, and two directorates reported that they did not conduct any processes to encourage the disclosure of diversity.
Directorates were asked to report on the initiatives implemented during 2017-18 to support employees and potential employees from diversity target groups, in particular, people from a Culturally and Linguistically Diverse Background, Aboriginal and Torres Strait Islander Peoples and People with Disability. Common initiatives utilised by directorates included:

72 State of the Service Report 2017-18
participation in Whole of Government programs including: the Inclusion Vocational Employment Programs; and the Aboriginal and Torres Strait Islander Vocational Employment Programs.
identified positions for People with Disability and Aboriginal and Torres Strait Islander Peoples;
development and/or implementation of a directorate specific Disability Action Plans and/or RED Action Plans;
workshops and seminars on inclusion and/or cultural awareness to equip managers and employees with the knowledge and skills to support colleagues from diversity target groups;
in-directorate support, provided by ACTPS employees (including dedicated Inclusion Officers), for Aboriginal and Torres Strait Islander Peoples and People with Disability;
promotion and provision of reasonable adjustment; and
utilising Aboriginal and Torres Strait Islander employee networks to provide support to Aboriginal and Torres Strait Islander employees.
Table 16 – Directorate Inclusion Strategies (2017-18)
Total directorates
Job advertisements written in plain English 7
Reasonable Adjustments made at interview for People with Disability 7
Reasonable workplace adjustments made for successful applicants with a disability 7
Training for panel members on the inclusion of the needs of diverse applicants 5
Roles and responsibilities clearly defined in job descriptions 7
All respondents: 2017-18 = 7
As shown in Table 16, during 2017-18 all directorates reported that they ensured job advertisements were written in plain English, that roles and responsibilities were clearly defined in job descriptions, and provided reasonable adjustment for interviewees and on commencement of successful applicants. Five directorates also reported that they provide training for panel members on the inclusion of the needs of diverse applicants. In addition to the above inclusion strategies, directorates reported that they had undertaken the following strategies during the 2017-18 reporting period:
engaging a dedicated Inclusion Officer;
using Auslan interpreters at interview for applicants with a hearing impairment;
promotion of the ACTPS disability inclusion network;
inclusion of a person who identifies as a person with disability on the selection committee when recruiting to identified positions for People with Disability;
amended duty statements to clearly articulate physical and psychosocial requirements of the role to potential applicants; and
advertising Aboriginal and Torres Strait Islander People identified positions through mainstream and Aboriginal and Torres Strait Islander People media and networks and advertising People with Disability identified positions through various universities’ networks.
When asked if their directorate had introduced any broader activities or initiatives to raise awareness of diversity in the workplace during the 2017-18 reporting period, all directorates responded yes. The most common activities/initiatives were:
73 State of the Service Report 2017-18
participation in, and celebration of international days and/or weeks including NAIDOC Week, Reconciliation Week, National Sorry Day, Close the Gap Day, Mabo Day, National Aboriginal and Torres Strait Islander Children’s Day, Harmony Day, LGBTIQ Week, International Day of People with Disability, White Ribbon Day, International Women’s Day and R U OK? Day;
introduction/implementation of a directorate specific RAP;
promotion of disability inclusion, including hosting an iDay event with guest speaker Paralympian Michael Roeger;
establishment of directorate LGBTIQ Staff Network that provides information and advice to staff on issues that affect LGBTIQ staff and their families, clients and stakeholders; and
promotion of LGBTIQ inclusion and awareness sessions and resources.

74 State of the Service Report 2017-18
4. A DIVERSE WORKFORCE: REFLECTING THE CANBERRA COMMUNITY
As an employer, the ACT Government strives to achieve a diverse and skilled public service comprised of individuals who are valued for their differences, experiences, knowledge, backgrounds and the contribution they can make.
The Employment Inclusion Team within CMTEDD, designs and administers Whole of Government inclusion strategies, programs and initiatives. The inclusion employment programs and initiatives focus on increasing participation numbers to better represent the Canberra community in which we serve and assist to meet targets while also retaining and developing current staff.
During 2017, the ACTPS Aboriginal and Torres Strait Islander Framework, and the ACTPS Disability Framework were launched. These frameworks acknowledge the level of maturity that now exists in inclusion employment across the ACTPS. The frameworks are high level, providing overarching direction on inclusion activities, which directorates can implement themselves, or participate in at a Whole of Government level.
The frameworks recognise that each directorate already has, or is developing, inclusion employment strategies with the expectation that in-depth information and analysis, including reporting and measures of accountability, are undertaken at the directorate level.
SNAPSHOT DIVERSITY: JUSTICE AND COMMUNITY SAFETY DIRECTORATE (JACS)
Emergency Services Agency supporting a diverse workforce
The Emergency Services Agency (ESA) has developed two programs to boost workforce diversity and inclusiveness. The purpose of the Women in Emergency Services (WIES) strategy is to attract more women into emergency service roles, while the Indigenous Fire and Rescue Employment Strategy (IFARES) program works to create greater opportunities for Aboriginal and Torres Strait Islander people to become career firefighters.
Women in Emergency Services (WIES) Strategy
This strategy, launched in November 2015, focuses on the culture of the emergency services to recruit more women into the ESA and support women into leadership roles.
Research shows that incorporating gender considerations into emergency management builds more resilient communities. Having a more diverse and inclusive workforce, better reflecting the community we serve, helps the ESA improve community engagement which leads to greater preparedness and resilience to deal with the ACT’s emergencies and disasters.
As well as a strong project management focus, the WIES strategy contains a well-defined governance structure and clear accountabilities to ensure the strategy meets staff expectations.
75 State of the Service Report 2017-18
Indigenous Fire and Rescue Employment Strategy (IFARES) Program
The ESA is also increasing the diversity of its workforce by promoting opportunities for Aboriginal and Torres Strait Islander People to become career firefighters with ACT Fire and Rescue (ACTF&R) through the IFARES program. IFARES involves a partnership between ACTF&R, Fire and Rescue New South Wales and the South Western Sydney Institute of TAFE.
This program allows the ESA to better meet its commitment under the Government’s Aboriginal and Torres Strait Islander People Employment Framework, specifically in relation to bringing innovation to employment pathways and promoting awareness of career paths into the ACT Public Service. Part of this is achieved through establishing links with tertiary institutions and using designated positions for Aboriginal and Torres Strait Islander People employment.
Since the commencement of this initiative, two Aboriginal and Torres Strait Islander People have successfully completed the firefighter training program and are now career firefighters. There are a further two local candidates waiting to undertake the next recruitment program in early 2019 and several members of the local Aboriginal and Torres Strait Islander community are currently participating in this program.
4.1 Aboriginal and Torres Strait Islander Peoples As shown in Table 17, Aboriginal and Torres Strait Islander employees made up 1.7 per cent of the total ACTPS workforce at June 2018.
The ACTPS is committed to building a more inclusive workforce and delivered multiple pathways and programs during the 2017-18 reporting period to support and encourage employment opportunities for Aboriginal and Torres Strait Islander Peoples in the ACTPS. The Employment Inclusion Team continues to focus on expanding whole of government inclusion employment initiatives, developing diversity employment resources and providing direct support to directorates to assist the ACTPS in increasing the employment of Aboriginal and Torres Strait Islander people across the workforce.
The success of the Aboriginal and Torres Strait Islander Traineeship programs over recent years has seen the ACTPS make further progress towards reaching the diversity target of having 407 Aboriginal and Torres Strait Islander employees by 30 June 2019. For this reporting period, the number of employees who identified as being an Aboriginal and Torres Strait Islander Peoples increased from 350 to 380 employees, a growth of 8.6 per cent. Continued growth at the rate seen over the last five years has the ACTPS on track to meeting the 2019 target.
Further information on programs and initiatives implemented during 2017-18 to improve the employment and retention of Aboriginal and Torres Strait Islander Peoples in the ACTPS can be found at Section B.2 (Performance Analysis) in the Head of Service Annual Report.
The 2016 Census revealed that Aboriginal and Torres Strait Islander Peoples represented 2.8 per cent of the Australian population, up from 2.5 per cent in 2011 and 2.3 per cent in 200632. In the ACT, Aboriginal and Torres Strait Islander Peoples represented 1.6 per cent of the total population of the ACT33.
32 Aboriginal and Torres Strait Islander Population: 2016 Census Data Summary http://www.ausstats.abs.gov.au/Ausstats/subscriber.nsf/0/C1DE83F220B089E3CA2581470023C96E/$File/aboriginal%20and%20torres%20strait%20islander%20population,%202016%20census%20data%20summary.pdf. 33 Ibid.

76 State of the Service Report 2017-18
Table 17 – Aboriginal and Torres Strait Islander Employees (June 2014 – June 2018)
Jun-14 Jun-15 Jun-16 Jun-17 Jun-18 Headcount 253 299 313 350 380 Percentage of total workforce 1.2% 1.4% 1.5% 1.6% 1.7%
Of the 380 Aboriginal and Torres Strait Islander employees:
the average salary for Aboriginal and Torres Strait Islander employees has increased at a higher rate than that across the ACTPS (3.6 per cent compared to 0.8 per cent) but continues to be less than the average ACTPS salary ($82,798 compared to $91,046);
trainees continue to be the largest cohort of Aboriginal and Torres Strait Islander employees at 21.1 per cent, followed by Corrections Officers at 6 per cent, Legal Support Officers at 5 per cent and Rangers at 4.3 per cent;
the separation rate of Aboriginal and Torres Strait Islander employees has reduced significantly over the last 12 months from 11.4 per cent at June 2017 to 8.6 per cent at June 2018. This rate continues to be higher than the separation rate for the whole ACTPS which is 7.1 per cent at June 2018, however it is useful to note that the sample size is smaller.
The 2018 Agency Survey asked directorates to report whether their directorate had a RAP in place in the 2017-18 reporting period, and if so, what the key attributes of the plan were, and what activities/initiatives were undertaken by the directorate to promote/implement the plan. A RAP is a framework for an organisation to realise their vision for reconciliation. Reconciliation Australia notes that having a RAP gives an organisation the best chance of achieving Aboriginal and Torres Strait Islander Peoples engagement objectives and increasing the attraction and retention of Aboriginal and Torres Strait Islander Peoples.34
Of the seven directorates, six reported having a current RAP in place during the 2017-18 reporting period. The remaining directorate reported that their RAP had expired and a working group has drafted an innovative RAP, which is out for consultation with employees.
The key purpose and attributes of each directorate’s RAP varied slightly by directorate. Some of the key attributes of directorate RAPs included:
building cultural proficiency across the directorate;
increasing joint reconciliation initiatives across the ACT Government and the Canberra community to improve culturally appropriate and accessible services for Aboriginal and Torres Strait Islander Peoples;
celebrating cultural identity;
determining and taking a personally meaningful action to support reconciliation;
engaging employees in the creation of an organisational culture, enriched by the diversity and knowledge of the Aboriginal and Torres Strait Islander Peoples;
delivering services in a way that acknowledges and understands Aboriginal and Torres Strait Islander culture and history; and
supporting the attraction, retention and capability building of Aboriginal and Torres Strait Islander employees.
Directorates also reported various activities and initiatives used for the promotion and/or implementation of their RAP, including through information on their directorate website, intranet
34 Reconciliation Australia (2016), Reconciliation Action Plan). RAP, About: http://www.reconciliation.org.au/raphub/about/.
77 State of the Service Report 2017-18
and email, and through celebration of significant days and events, such as Reconciliation Week and NAIDOC Week.
Some examples of these activities and initiatives included:
a flowerbed design celebrating reconciliation was planted at Vernon Circle, Civic, for the period covering Reconciliation Week 2018 until the end of NAIDOC Week 2018. The design was endorsed by the United Ngunnawal Elders Council and featured the Ngunnawal word “Galambany” meaning “we, including you”;
in November 2017, TCCS began offering a half-day On-Country Cultural Appreciation Tour run by Thunderstone Cultural and Land Management Services. The program offers an introduction to Ngunnawal Country, the Traditional Owners of the lands and waters in the Canberra region, Ngunnawal language, local bush tucker and the impact of non-Indigenous land management practices over the centuries;
ACT Schools support National Reconciliation Week through a variety of actions, including excursions, NAIDOC assemblies, inviting guests to share story and cultural activities, and learning through action. In 2018, nine ACT schools were successful in receiving an ACT Reconciliation Grant to hold activities, including Reconciliation mural development and Reconciliation student groups;
annual combined ACT Corrective Services and Southside Community Services Art Exhibition which showcased artworks from the Alexander Maconochie Centre and the community; and
JACS held a stall at the Reconciliation Day in the Park event, to celebrate the newly appointed public holiday in the ACT and to demonstrate the commitment of JACS to building strong and respectful relationships with the community alongside other directorates.

78 State of the Service Report 2017-18
Table 18 – Aboriginal and Torres Strait Islander Peoples Snapshot (June 2018)
Total Employees (Headcount) 380 Age Headcount
Total Employees (FTE) 336.7 <20 years old 15
Aboriginal and Torres Strait Islander Peoples by directorate
% (Headcount) 20-29 years old 85
Chief Minister, Treasury and Economic Development
1.5% (36) 30-39 years old 111
ACT Insurance Authority n/a 40-49 years old 78
Community Services 4.4% (41) 50-59 years old 70
Education 1.5% (101) 60-69 years old 21
Environment, Planning and Sustainable Development
3.4% (23) >70 years old 0
Health 1.1% (83) Employment Type
Justice and Community Safety 2.8% (52) Permanent 258
Transport Canberra and City Services 2.3% (44) Temporary 91
ACTPS Total 1.70% Casual 31
Full Time / Part Time Employment
Average Salary $82,798 Full Time 274 Part Time 75
Separation Rate 8.6% Casual 31
Table 19 shows the employment strategies used by directorates during 2017-18 to attract Aboriginal and Torres Strait Islander Peoples to the ACTPS.
Table 19 – Employment Strategies for the Attraction and Retention of Aboriginal and Torres Strait Islander Peoples (2017-18)
Total directorates
Designated positions 5
Aboriginal and Torres Strait Islander Traineeship 4
Work experience 0
Positions in the ACTPS Graduate Program for Aboriginal and Torres Strait Islander Peoples 3
Aboriginal and Torres Strait Islander cadetship 1
Mentoring programs 2
School based apprenticeships for Aboriginal and Torres Strait Islander Peoples 3
All respondents: 2017-18 = 7
79 State of the Service Report 2017-18
In 2017-18 the most commonly used employment strategies for the attraction and retention of Aboriginal and Torres Strait Islander Peoples to the ACTPS were designated positions, the Aboriginal and Torres Strait Islander Traineeship, positions for Aboriginal and Torres Strait Islander Peoples in the ACTPS Graduate Program and School based apprenticeships for Aboriginal and Torres Strait Islander Peoples.
In addition to the employment strategies listed in Table 19, directorates also reported using the following strategies to attract and retain Aboriginal and Torres Strait Islander Peoples to the ACTPS:
participation in the Aboriginal and Torres Strait Islander Career Development Program;
encouraging Aboriginal and Torres Strait Islander employees to have performance and learning and development plans which include professional development and work-related study opportunities;
mentoring groups for senior Aboriginal and Torres Strait Islander employees to provide support and career pathway advice for junior Aboriginal and Torres Strait Islander employees;
participation in career expos and community events, promoting the directorate as an employer of choice for Aboriginal and Torres Strait Islander Peoples; and
advertising employment opportunities through a variety of media sources including Aboriginal and Torres Strait Islander People publications/media and through specialist Aboriginal and Torres Strait Islander recruitment organisations.
The most commonly reported strategy used to support Aboriginal and Torres Strait Islander employees during 2017-18 was Aboriginal and Torres Strait Islander cultural awareness training and employee networks.
Other widely reported strategies used to support Aboriginal and Torres Strait Islander employees included the establishment of Aboriginal and Torres Strait Islander employee networks in six of seven directorates and the promotion of the ACTPS as an employer of choice for Aboriginal and Torres Strait Islander Peoples in five directorates.
Some directorates reported that in addition to providing Aboriginal and Torres Strait Islander cultural awareness training, they provided specific training to service delivery staff in relation to Aboriginal and Torres Strait Islander Peoples.

80 State of the Service Report 2017-18
SNAPSHOT CULTURAL LEARNING: COMMUNITY SERVICES DIRECTORATE (CSD)
CSD launched the Cultural e-Learning Program (CORE) on 8 January 2018. The CORE program has been promoted to all staff through Executive messages and the Learning Management System.
Staff are asked to set aside regular time to work through each of the 10 modules. This enables the team to discuss what they have learned and complete the tasks that are assigned within the modules.
As a part of the Service Delivery training program, staff members also completed a number of face to face training modules, including: Aboriginal and Torres Strait Islander Young People Policy and Procedures; Aboriginal and Torres Strait Islander Cultural Development Program;
Implementation of stage 1 of the "More than a Network - Employment Excellence" project for Aboriginal and Torres Strait Islander People. This project aims to recognise and invest in the unique contribution that Aboriginal and Torres Strait Islander People make to the achievement of organisational outcomes. It seeks to authentically engage with CSD Aboriginal and Torres Strait Islander People to build career development pathways supported through employment frameworks inclusive of the Enterprise Agreement. This project will continue into the 2018-19 financial year.
Other strategies that were used to support Aboriginal and Torres Strait Islander employees during 2017-18 were:
establishing a formal Aboriginal and Torres Strait Islander Staff Network to provide ongoing support to Aboriginal and Torres Strait Islander employees;
working closely with the ACTPS Inclusion Employment team to support Aboriginal and Torres Strait Islander employees;
participating in the Aboriginal and Torres Strait Islander Career Development Program;
directorate specific Aboriginal and Torres Strait Islander mentoring programs;
undertaking directorate specific staff surveys, providing an opportunity for Aboriginal and Torres Strait Islander employees to identify areas of concern about workplace culture and opportunities;
promoting the Murranga Murranga Aboriginal and Torres Strait Islander Employee Network;
encouraging active participation and leadership from Aboriginal and Torres Strait Islander employees in the development/implementation of directorate specific RAPs; and
working with, and maintaining positive relationships with Indigenous Employment Service providers.
81 State of the Service Report 2017-18
SNAPSHOT: CULTURAL INTEGRITY: EDUCATION DIRECTORATE (EDU)
Cultural Integrity Training for all ACT Public School Principals and Education Support Office Directors was delivered in 2017. A series of three consecutive training days was delivered over a six week period. The Director-General hosted a follow up session with Principals in December 2017. The first training day with MurriMatters (Mr Scott Gorringe and Mr David Spillman) engaged participants in a cultural analysis and implications of deficit discourse. The second day, with Mr Grant Sarra, engaged participants in a strategic Aboriginal and Torres Strait Islander awareness workshop “To Understand the Present – We Must Understand the Past”. The final session examined approaches to complex challenges and planning for cultural change, from which the Directorate Framework for Cultural Integrity will be developed in 2018-19.
4.2 People with Disability The ACTPS People with Disability Framework (the Framework) was launched in October 2017. The ACTPS is committed to building a more inclusive workforce and continued to support and encourage employment opportunities for People with Disability during 2017-18. The Employment Inclusion Team continued to provide Whole of Government inclusion employment initiatives and provide diversity employment resources to support to directorates in increasing the employment of People with Disability across the workforce.
Further information on programs and initiatives delivered during 2017-18 to improve the employment and retention of People with Disability in the ACTPS can be found at Section B.2 (Performance Analysis) in the Head of Service Annual Report.
Within the ACTPS, employees who identified as a Person with Disability made up 2.5 per cent (565 employees) of the total ACTPS workforce at June 2018. This is a slight increase from the previous year where 521 (2.4 per cent of the workforce) employees identified as a Person with Disability.
Table 20 – People with Disability (June 2014 – June 2018)
June 2014 June 2015 June 2016 June 2017 June 2018
Headcount 415 437 458 521 565
Percentage of total workforce 2.0% 2.1% 2.2% 2.4% 2.5%

82 State of the Service Report 2017-18
Of the 565 employees who identify as a Person with Disability:
Executives continue to make up the largest classification of People with Disability at 6.2 per cent, followed by Transport Officers at 5.7 per cent and Senior Officers (4.1 per cent), Information Technology Officers and Technical Officers at 4 per cent;
CMTEDD had the largest proportional representation of employees identifying as People with Disability at 4.7 per cent, followed by CSD at 4.5 per cent;
The average salary for People with Disability was $91,174, slightly higher than the ACTPS average salary ($91,046); and
The separation rate of People with Disability continues to be slightly higher than the separation rate of the ACTPS (9.8 per cent compared to 7.1 per cent), noting the small sample size of this diversity group.
Table 21 – People with Disability Diversity Snapshot (June 2018)
Total Employees (Headcount) 565 Age Headcount
Total Employees (FTE) 505.6 <20 years old 7
People with Disability employees by directorate
%(Headcount) 20-29 years old 94
Chief Minister, Treasury and Economic Development
4.7% (113) 30-39 years old 113
ACT Insurance Authority
4.5% (42)
40-49 years old 149
Community Services
2% (138)
50-59 years old 145
Education
3.3% (22)
60-69 years old 51
Environment, Planning and Sustainable Development
1.8% (138)
>70 years old 6
Health
2.5% (47)
Employment Type
Justice and Community Safety
3.4% (64)
Permanent 434
Transport Canberra and City Services
2.5%
Temporary 96
ACTPS Total
n/a
Casual 35
Full Time / Part Time Employment
Average Salary $91,174 Full Time 411
Part Time 119
Separation Rate 9.8% Casual 35
83 State of the Service Report 2017-18
The 2018 Agency Survey asked directorates to report whether directorates had a Disability ActionPlan in place during the 2017-18 reporting period, and if so, what the key attributes of the plan were and what activities/initiatives were undertaken by the directorate to promote or implement the plan.
Three of the seven directorates reported that they had a Disability Action Plan in place during the reporting period. Various activities were undertaken by directorates to support and promote theirDisability Action Plan. These included having an executive champion for the Disability Action Plan andto support staff, through the provision of relevant training in disability and mental health awareness, promoting and celebrating diversity days and events to promote awareness and inclusion, implementing and promoting the reasonable adjustment policy and participation in the Whole ofGovernment initiatives.
Six of the seven directorates reported that they utilise at least one of the below strategies identified in table 22 to attract People with Disability.
Table 22– Employment Strategies for the Attraction of People with Disability (2017-18)
Total directorates
Designated positions 3
Disability Traineeship 4
Work experience 2
Positions in the ACTPS Graduate Program for People with Disability 4
Disability cadetship 1
Mentoring programs 0
School based apprenticeships for People with Disability 1
Other Initiatives 2
All respondents: 2017-18 = 7
Consistent with the previous years, the most commonly used strategies to attract and retain People with Disability in the ACTPS workforce were participation in the ACTPS Graduate Program and the Disability Traineeship. Examples of other employment strategies for the attraction of People with Disability include one directorate working collaboratively with Black Mountain School and Canberra College to provide senior students with disability with experience opportunities in the horticulturalindustry. Another directorate developed and piloted creative innovative employment pathways for people with disability. This included developing and sharing promotional interviews about thebenefits of employing people with disability.
Directorates were also asked what strategies they use to support employees with disability. As shown in Graph 7, the most commonly reported strategies used to support People with Disabilityemployees during 2017-18 were the use of Disability Employee Networks, the use of the Whole ofGovernment Reasonable Adjustment Policy and Disability Awareness Training. The usage of Disabilityemployee networks has doubled from the previous year.

82 State of the Service Report 2017-18
Of the 565 employees who identify as a Person with Disability:
Executives continue to make up the largest classification of People with Disability at 6.2 per cent, followed by Transport Officers at 5.7 per cent and Senior Officers (4.1 per cent), Information Technology Officers and Technical Officers at 4 per cent;
CMTEDD had the largest proportional representation of employees identifying as People with Disability at 4.7 per cent, followed by CSD at 4.5 per cent;
The average salary for People with Disability was $91,174, slightly higher than the ACTPS average salary ($91,046); and
The separation rate of People with Disability continues to be slightly higher than the separation rate of the ACTPS (9.8 per cent compared to 7.1 per cent), noting the small sample size of this diversity group.
Table 21 – People with Disability Diversity Snapshot (June 2018)
Total Employees (Headcount) 565 Age Headcount
Total Employees (FTE) 505.6 <20 years old 7
People with Disability employees by directorate
% (Headcount) 20-29 years old 85
Chief Minister, Treasury and Economic Development
4.7% (113) 30-39 years old 113
ACT Insurance Authority 4.5% (42) 40-49 years old 149
Community Services 2% (138) 50-59 years old 145
Education 3.3% (22) 60-69 years old 51
Environment, Planning and Sustainable Development
1.8% (138) >70 years old 6
Health 2.5% (47) Employment Type
Justice and Community Safety 3.4% (64) Permanent 434
Transport Canberra and City Services 2.5% Temporary 96
ACTPS Total 4.5% (42) Casual 35
Full Time / Part Time Employment
Average Salary $91,174 Full Time 411
Part Time 119
Separation Rate 9.8% Casual 35
83 State of the Service Report 2017-18
The 2018 Agency Survey asked directorates to report whether directorates had a Disability Action Plan in place during the 2017-18 reporting period, and if so, what the key attributes of the plan were and what activities/initiatives were undertaken by the directorate to promote or implement the plan.
Three of the seven directorates reported that they had a Disability Action Plan in place during the reporting period. Various activities were undertaken by directorates to support and promote their Disability Action Plan. These included having an executive champion for the Disability Action Plan and to support staff, through the provision of relevant training in disability and mental health awareness, promoting and celebrating diversity days and events to promote awareness and inclusion, implementing and promoting the reasonable adjustment policy and participation in the Whole of Government initiatives.
Six of the seven directorates reported that they utilise at least one of the below strategies identified in table 22 to attract People with Disability.
Table 22– Employment Strategies for the Attraction of People with Disability (2017-18)
Total directorates
Designated positions 3
Disability Traineeship 4
Work experience 2
Positions in the ACTPS Graduate Program for People with Disability 4
Disability cadetship 1
Mentoring programs 0
School based apprenticeships for People with Disability 1
Other Initiatives 2
All respondents: 2017-18 = 7
Consistent with the previous years, the most commonly used strategies to attract and retain People with Disability in the ACTPS workforce were participation in the ACTPS Graduate Program and the Disability Traineeship. Examples of other employment strategies for the attraction of People with Disability include one directorate working collaboratively with Black Mountain School and Canberra College to provide senior students with disability with experience opportunities in the horticultural industry. Another directorate developed and piloted creative innovative employment pathways for people with disability. This included developing and sharing promotional interviews about the benefits of employing people with disability.
Directorates were also asked what strategies they use to support employees with disability. As shown in Graph 7, the most commonly reported strategies used to support People with Disability employees during 2017-18 were the use of Disability Employee Networks, the use of the Whole of Government Reasonable Adjustment Policy and Disability Awareness Training. The usage of Disability employee networks has doubled from the previous year.

84 State of the Service Report 2017-18
Graph 7: Strategies to support People with Disability Employees (2017-18)
All respondents: 2017-18 = 7
Other support strategies used by Directorates during the 2017-18 reporting period include:
the promotion and distribution of a Managers Guide: Disability in the Workplace and the Reasonable Adjustment Policy;
reviewing job descriptions;
providing information at directorate induction sessions; and
working alongside the Employment Inclusion Team, CMTEDD.
The 2018 Agency Survey asked directorates how they make managers and supervisors aware of the requirements to investigate and where practical, make reasonable adjustment(s) following the disclosure of a disability. Common methods reported include:
providing Disability Awareness training for managers;
promotion through emails;
via new starter checklists;
through the ACTPS Manager’s Toolkit;
development and distribution of an information pack concerning recruitment and retention of employees with disability; and
HR support.
When asked to report on the strategies implemented to ensure accessible workplaces, directorates reported utilising strategies such as:
through applications for reasonable adjustment and/or financial assistance to the Employee Assistance fund;
external assistance such as sourcing an Occupational Therapist and disability specialist, such as the Guide Dog Association, to provide advice and awareness training tailored to individual needs;
0 1 2 3 4 5 6 7
Other
Disability Awareness training
Whole of Government Reasonably Adjustment Policy
Directorate/agency specific Reasonable Adjustmet Policy
Disability employee networks
Number of Directorates
85 State of the Service Report 2017-18
use of a Work Health and Safety Committee or Workplace Consultative Committee, allowing employees to raise and resolve health and safety issues;
access to RED contact Officers; and
ensuring any new upgrades/building modifications are made in accordance and comply with all accessibility requirements.
Directorates have several avenues to employ people with disability. Working with a Disability Employment Service provider is one of those avenues. Four directorates reported that they had engaged a Disability Employment Service provider during the 2017-18 reporting period, including:
Max Employment;
Enabled Employment;
Nexus Human Services;
Lead Employment Services;
Koomari; and
Vision Australia.
Graph 8: Inclusion Strategies to maximise the participation of Aboriginal and Torres Strait Islander Employees and People with Disability on training courses (2017-18)
All respondents: 2017-18 = 7
During 2017-18 directorates used numerous strategies for maximising the participation of Aboriginal and Torres Islander employees and People with Disability on training courses. In addition, one directorate reported that they work with individuals on their specific training and development needs while another directorate focuses on building capability for career progression to more senior roles.
0 1 2 3
Other
None
Reserved places for target group employees
Targeted advertising through networks
Targeted invitations to apply
Number of Directorates

86 State of the Service Report 2017-18
4.3 Cultural and Linguistic Diversity The ACTPS is committed to having a workforce which is representative of the community that it serves. As shown in table 23, Culturally and Linguistically Diverse employees made up 17.9 per cent of the ACTPS workforce at June 2018. Of the 3,974 Culturally and Linguistically Diverse employees:
the average salary for Culturally and Linguistically Diverse employees was slightly less than the average ACTPS salary ($87,199 compared to $91,046);
the highest proportion of Culturally and Linguistically Diverse employees was found in the Health Directorate at 27.3 per cent, followed by the CMTEDD at 19.3 per cent;
the separation rate of Culturally and Linguistically Diverse employees was lower than the separation rate of the whole of the ACTPS (5.7 per cent compared to 7.1 per cent); and
50 per cent of Culturally and Linguistically Diverse employees were in the Dentists/Dental Officers classification group. This is consistent with previous years.
Table 23– Cultural and Linguistic Diversity Snapshot (June 2018)
Total Employees (Headcount) 3,974 Age Headcount
Total Employees (FTE) 3,596.9 <20 years old 7
Culturally and Linguistically Diverse employees by Directorate
%(Headcount) 20-29 years old 392
Chief Minister, Treasury and Economic Development
19.3% (465) 30-39 years old 1,399
ACT Insurance Authority 10.5% (2) 40-49 years old 1,162
Community Services 15.9% (148) 50-59 years old 745
Education 10.3% (700) 60-69 years old 247
Environment, Planning and Sustainable Development
12.2% (82) >70 years old 22
Health 27.3% (2,077) Employment Type
Justice and Community Safety 9.1% (170) Permanent 2,915
Transport Canberra and City Services35
17.3% (330) Temporary 799
ACTPS Total 17.9% Casual 260
Full Time / Part Time Employment
Average Salary $87,199 Full Time 2,797
Part Time 917
Separation Rate 5.7% Casual 260
35 The headcount and percentage of workforce for employees within TCCS was reported incorrectly for the 2016-17 reporting period due to a transfer of data between IT systems. It should have been a headcount of 296 (15.7 per cent of the TCCS workforce), not a headcount of 472 (25.1 per cent).
87 State of the Service Report 2017-18
5. AN ENGAGED WORKFORCE: GETTING THE BEST FROM PEOPLE AT WORK
5.1 Performance and Capability DevelopmentThe ACTPS is committed to building the skills and capability of the workforce to ensure everyemployee feels engaged and supported through a positive workplace environment. The ACTPS Performance Framework (the Framework) establishes the process for managing employee performance, and supports managers to develop workplace culture and capability. The Framework supports the commitment to further build an agile, responsive and innovative public service. The keyobjectives of the framework are to:
support employee effectiveness for the benefit of the ACTPS through providing a consistent andsustainable approach to achieving high performance standards across the ACTPS;
support ACTPS Values and Signature Behaviours by ensuring that employees’ performance ismanaged in a holistic sense, with the way in which an employee conducts themselves being as important as the results they achieve;
provide a consistent approach to the way in which the ACTPS holds its employees accountable for their work performance; and
embed performance management and development as a familiar and supportive part of workinglife in the ACTPS, creating a Service that consistently provides its employees with role and taskclarity, strengthens capability and retains talented employees.
To achieve high levels of employee engagement, it is important that managers and employees have a clear understanding around roles, responsibilities and objectives. The Framework assists employees and managers to have quality performance conversations. These discussions are an opportunity for employees to highlight their achievements, obtain and provide feedback, and seek assistance when required. Performance conversations can assist employees to identify exactly what skills, knowledgeand behaviour they need to master in order to do their job and progress their career in the ACTPS.
The ACTPS Shared Capability Framework (the Capability Framework) describes the skills, knowledgeand behaviour that can be universally expected of ACT Public Servants at different organisationallevels and in every workplace across the Service. Using the Capability Framework in conjunction with a personal Performance and Development Plan, employees can track their development goals against their current and desired organisational level.
The 2018 Agency Survey asked directorates to report on whether they monitored the utilisation of the ACTPS Performance Framework during the 2017-18 reporting period. Five directorates reportedthat they monitored usage.
Directorates were then asked to report on the percentage of their workforce that had a performance agreement in place at 30 June 2018. Two of the seven directorates reported that they were unable todetermine the percentage as they did not have a system available to capture this information. The directorates that were unable to determine this figure were in areas that involved largely field based workers and reported that whilst they were unable to actively collect data in relation to thecompletion of performance agreements, they actively support line areas to ensure agreements are inplace.

86 State of the Service Report 2017-18
4.3 Cultural and Linguistic Diversity The ACTPS is committed to having a workforce which is representative of the community that it serves. As shown in table 23, Culturally and Linguistically Diverse employees made up 17.9 per cent of the ACTPS workforce at June 2018. Of the 3,974 Culturally and Linguistically Diverse employees:
the average salary for Culturally and Linguistically Diverse employees was slightly less than the average ACTPS salary ($87,199 compared to $91,046);
the highest proportion of Culturally and Linguistically Diverse employees was found in the Health Directorate at 27.3 per cent, followed by the CMTEDD at 19.3 per cent;
the separation rate of Culturally and Linguistically Diverse employees was lower than the separation rate of the whole of the ACTPS (5.7 per cent compared to 7.1 per cent); and
50 per cent of Culturally and Linguistically Diverse employees were in the Dentists/Dental Officers classification group. This is consistent with previous years.
Table 23– Cultural and Linguistic Diversity Snapshot (June 2018)
Total Employees (Headcount) 3,974 Age Headcount
Total Employees (FTE) 3,596.9 <20 years old 7
Culturally and Linguistically Diverse employees by Directorate
% (Headcount) 20-29 years old 85
Chief Minister, Treasury and Economic Development
19.3% (465) 30-39 years old 1399
ACT Insurance Authority 10.5% (2) 40-49 years old 1162
Community Services 15.9% (148) 50-59 years old 745
Education 10.3% (700) 60-69 years old 247
Environment, Planning and Sustainable Development
12.2% (82) >70 years old 22
Health 27.3% (2,077) Employment Type
Justice and Community Safety 9.1% (170) Permanent 2,915
Transport Canberra and City Services35
17.3% (330) Temporary 799
ACTPS Total 17.9% Casual 260
Full Time / Part Time Employment
Average Salary $87,199 Full Time 2,797 Part Time 917
Separation Rate 5.7% Casual 260
35 The headcount and percentage of workforce for employees within TCCS was reported incorrectly for the 2016-17 reporting period due to a transfer of data between IT systems. It should have been a headcount of 296 (15.7 per cent of the TCCS workforce), not a headcount of 472 (25.1 per cent).
87 State of the Service Report 2017-18
5. AN ENGAGED WORKFORCE: GETTING THE BEST FROM PEOPLE AT WORK
5.1 Performance and Capability Development The ACTPS is committed to building the skills and capability of the workforce to ensure every employee feels engaged and supported through a positive workplace environment. The ACTPS Performance Framework (the Framework) establishes the process for managing employee performance, and supports managers to develop workplace culture and capability. The Framework supports the commitment to further build an agile, responsive and innovative public service. The key objectives of the framework are to:
support employee effectiveness for the benefit of the ACTPS through providing a consistent and sustainable approach to achieving high performance standards across the ACTPS;
support ACTPS Values and Signature Behaviours by ensuring that employees’ performance is managed in a holistic sense, with the way in which an employee conducts themselves being as important as the results they achieve;
provide a consistent approach to the way in which the ACTPS holds its employees accountable for their work performance; and
embed performance management and development as a familiar and supportive part of working life in the ACTPS, creating a Service that consistently provides its employees with role and task clarity, strengthens capability and retains talented employees.
To achieve high levels of employee engagement, it is important that managers and employees have a clear understanding around roles, responsibilities and objectives. The Framework assists employees and managers to have quality performance conversations. These discussions are an opportunity for employees to highlight their achievements, obtain and provide feedback, and seek assistance when required. Performance conversations can assist employees to identify exactly what skills, knowledge and behaviour they need to master in order to do their job and progress their career in the ACTPS.
The ACTPS Shared Capability Framework (the Capability Framework) describes the skills, knowledge and behaviour that can be universally expected of ACT Public Servants at different organisational levels and in every workplace across the Service. Using the Capability Framework in conjunction with a personal Performance and Development Plan, employees can track their development goals against their current and desired organisational level.
The 2018 Agency Survey asked directorates to report on whether they monitored the utilisation of the ACTPS Performance Framework during the 2017-18 reporting period. Five directorates reported that they monitored usage.
Directorates were then asked to report on the percentage of their workforce that had a performance agreement in place at 30 June 2018. Two of the seven directorates reported that they were unable to determine the percentage as they did not have a system available to capture this information. The directorates that were unable to determine this figure were in areas that involved largely field based workers and reported that whilst they were unable to actively collect data in relation to the completion of performance agreements, they actively support line areas to ensure agreements are in place.

88 State of the Service Report 2017-18
The remaining directorates reported participation rates of between 33 and 88 per cent, with an average rate of 63 per cent of their workforce with a performance agreement in place at 30 June 2018. This continues an upward trend over the previous reporting periods, particularly in directorates with large numbers of office based workers. While it is encouraging to see incremental increases in the proportion of employees with a performance plan in place from the 2015-16 and 2016-17 reporting periods, further work is required over the coming year to continue this trend.
Providing employees with the opportunity to develop skills and capability has been shown as a key factor in driving high performance and motivation in the workforce. Directorates were asked to report on the strategies employed during 2017-18 to enhance, develop or improve employee capability and performance. The results are provided in Table 24 below.
Table 24: Strategies used during 2017-18 to enhance, develop or improve employee capability and performance
Total Directorates
Mentoring programs 7
Funded training 7
Secondments 4
Job swap opportunities 3
Communities of practice 5
Other 1
All respondents: 2017-18 = 7
One directorate reported using other strategies to enhance, develop or improve employee capability and performance which included all schools developing an annual professional learning program which outlines targeted professional learning courses, incorporating the value of engaging in professional learning communities, to enrich every teacher’s professional practice, knowledge and engagement.
5.2 Underperformance Having clear procedures for managing underperformance is essential in supporting workforce productivity and maintaining employee engagement. The Australian Government Fair Work Ombudsman states that underperformance can be exhibited through:
unsatisfactory work performance, that is, a failure to perform the duties of the position or to perform them to the standard required;
non-compliance with workplace policies, rules or procedures;
unacceptable behaviour in the workplace; and/or
disruptive or negative behaviour that impacts on co-workers36.
36 Australian Government, Fair Work Ombudsman, Managing Underperformance: https://www.fairwork.gov.au/how-we-will-help/templates-and-guides/best-practice-guides/managing-underperformance.
89 State of the Service Report 2017-18
The focus of the Framework is to support employee effectiveness for the benefit of the ACTPS through providing a consistent and sustainable approach to achieving high performance standards. Where an underperformance issue is initially identified, managers and supervisors are required to address the concerns with the employee informally and provide assistance to help the employee to achieve the required standard of performance. Where underperformance continues to be an issue, a formal performance action plan is developed.
Directorates were asked to identify whether they monitored the number of preliminary performance discussions held during the 2017-18 reporting period. Of the seven directorates, one reported that they did monitor preliminary performance discussions and that four such discussions had occurred during the reporting period. That directorate reported that of the four instances, three realised the required improvements and did not proceed to a formal underperformance process. The other six directorates indicated that performance discussions occurred regularly within their directorate but business units are not required to report on these discussions.
Directorates were asked to provide details of the number of formal underperformance processes that were commenced in the 2017-18 financial year under the procedures set out in the relevant ACTPS Enterprise Agreement. The results are provided in Table 25.
Table 25: Underperformance Processes (2017-18)
Total Processes
Number commenced in 2016-17 but finalised in 2017-18 4
Number commenced in 2017-18 24
Number commenced and finalised in 2017-18 8
Number commenced in 2017-18 but yet to be finalised at 30 June 2018 16
Six of the seven directorates indicated that they have commenced at least one formal underperformance process as set out in the relevant Enterprise Agreement during the 2017-18 reporting period. The commencement of 24 new underperformance processes during the 2017-18 reporting period is a significant reduction from the figures reported in the 2016-17 reporting period, where a total of 44 new underperformance cases were commenced.
Directorates were then asked to report on the outcomes of the underperformance processes that were finalised during 2017-18. These results are provided in Table 26.
Table 26: Outcomes from Underperformance Processes (2017-18)
Total Outcomes
Satisfactory performance achieved at the completion of the process 2
Development program instituted 1
Assignment to other duties 2
Deferral of increment 0
Reduction in classification 2
Termination of employment 2
Resignation of employee during process 3
It is recognised that a formal underperformance process can be a stressful experience for employees. Employees are provided with assistance, coaching, support and access to Employee Assistance Providers throughout these processes. Positively, the majority of employees involved in these

90 State of the Service Report 2017-18
processes were able to either return to a satisfactory level of performance in their role (two employees achieved satisfactory performance and one employee was placed on a development plan), or were re-allocated to a role more suited to their capabilities (two employees were assigned to other duties and two employees were assigned to a lower classification).
ACT PUBLIC SECTOR WORKFORCE 2017-18

92 State of the Service Report 2017-18
ACT PUBLIC SECTOR WORKFORCE PROFILE 2017-18
At 30 June 2018 the ACT Public Sector consisted of a workforce of 24,815, making up 10.8 per cent of the Territory’s labour force37. Overall, the ACT Public Sector had an increase of 2.1 per cent in the workforce from June 2017 to June 2018 (up from a headcount of 24,148 at June 2017). This increase is slightly less than the 2.4 per cent total increase of the Australian labour workforce during the same period38.
Aboriginal and Torres Strait Islander employees in the ACT Public Sector were represented by a headcount of 401, making up 1.6 per cent of all ACT Public Sector employees. The headcount of Aboriginal and Torres Strait Islander employees in the ACT Public Sector has increased 6.3 per cent from the 375 Aboriginal and Torres Strait Islander employees at June 2017. The gradual increase of Aboriginal and Torres Strait Islander employees within the ACT Public Sector demonstrates the success of the ACT Government’s commitment to diversity employment.
ACT Public Sector employees who identified as a Person with Disability were represented by a headcount of 599 (up from 548 at June 2017) or 2.4 per cent of all employees. Culturally and Linguistically Diverse employees were represented by a headcount of 4,184 (up from 4,138 at June 2017) or 16.9 per cent of all employees.
Table 27 provides a summary of the ACT Public Sector outlining staff numbers broken down by public sector body against key workforce indicators. Table 28 provides a snapshot of the ACT Public Sector in comparison with the previous reporting period.
37 Australian Bureau of Statistics, Labour Force Australia 6202.0. 38 Ibid.
93
St
ate
of th
e Se
rvice
Rep
ort 2
017-
18
Tabl
e 27
: ACT
PS P
ublic
Sec
tor O
verv
iew
(Jun
e 20
18)
ACTPS
ACT Audit Office
ACT Electoral Commission
ACT Teacher Quality Institute
Calvary Health Care (Public)
Canberra Institute of Technology
City Renewal Authority
Cultural Facilities Corporation
Independent Competition and Regulatory Commission
Long Service Leave Authority
Office of the Legislative Assembly
Suburban Land Agency
Total
FTE
Tota
l 19
,698
.0
36.9
11
.0
9.0
1,06
7.4
693.
2 23
.4
102.
58
10.6
13
.6
48.7
77
.5
21,7
91.8
FTE
- Pe
rman
ent
15,5
75.8
29
.8
7.4
6 91
0.6
419.
0 18
.4
42.5
7.
8 10
.6
43.3
68
.12
17,1
39.2
FTE
- Te
mpo
rary
3,
456
7.2
3.6
2 11
2.6
213.
3 5
16.7
2.
8 3
1.8
9.39
3,
833.
4
FTE
- Cas
ual
666.
4 n/
a n/
a n/
a 44
.2
60.9
n/
a 43
.4
n/a
n/a
3.7
n/a
819.
5
Head
coun
t To
tal
22,2
30
38
12
10
1,29
9 87
7 24
15
7 11
14
63
80
24
,815
Head
coun
t -
Perm
anen
t 16
,917
30
8
6 1,
054
436
19
47
8 11
48
70
18
,654
Head
coun
t -
Tem
pora
ry
3,83
9 8
4 2
123
251
5 17
3
3 2
10
4,26
7
Head
coun
t -
Casu
al
1,47
4 n/
a n/
a 2
122
190
n/a
93
n/a
n/a
13
n/a
1,89
4
Age
(ave
rage
) 42
.4
39.2
45
.8
51.7
41
.8
46.8
42
.7
40.9
40
.8
41.7
51
.4
42.1
43
.9
Leng
th o
f Se
rvic
e
(ave
rage
8.
8 6.
0 10
.5
13.1
6.
4 10
.0
5.1
5.2
1.9
8.1
10.6
8.
6 7.
9

94
St
ate
of th
e Se
rvice
Rep
ort 2
017-
18
ACTPS
ACT Audit Office
ACT Electoral Commission
ACT Teacher Quality Institute
Calvary Health Care (Public)
Canberra Institute of Technology
City Renewal Authority
Cultural Facilities Corporation
Independent Competition and Regulatory Commission
Long Service Leave Authority
Office of the Legislative Assembly
Suburban Land Agency
Total
year
s -
excl
udes
ca
sual
s)
Sepa
ratio
n Ra
te (a
vera
ge
perm
anen
t he
adco
unt)
7.1%
13
.8%
0.
0%
54.2
%
11.0
%
7.3%
5.
6%
6.4%
0.
0%
19.8
%
10.4
%
12.7
%
12.4
%
Abor
igin
al
and
Torr
es
Stra
it Is
land
er
Head
coun
t
380
n/a
n/a
n/a
n/a
19
n/a
n/a
n/a
n/a
n/a
n/a
401
Abor
igin
al
and
Torr
es
Stra
it Is
land
er
FTE
336.
7 n/
a n/
a n/
a n/
a 12
.8
n/a
n/a
n/a
n/a
n/a
n/a
351.
5
Peop
le w
ith
Disa
bilit
y He
adco
unt
565
n/a
n/a
n/a
n/a
26
n/a
3 n/
a n/
a n/
a 4
599
Peop
le w
ith
Disa
bilit
y FT
E 50
5.6
n/a
n/a
n/a
n/a
22.9
n/
a 2.
2 n/
a n/
a n/
a n/
a 53
0.7
Cultu
rally
and
Li
ngui
stic
ally
3,
974
20
6 n/
a n/
a 15
2 n/
a 6
4 4
n/a
16
4,18
4
95
St
ate
of th
e Se
rvice
Rep
ort 2
017-
18
ACTPS
ACT Audit Office
ACT Electoral Commission
ACT Teacher Quality Institute
Calvary Health Care (Public)
Canberra Institute of Technology
City Renewal Authority
Cultural Facilities Corporation
Independent Competition and Regulatory Commission
Long Service Leave Authority
Office of the Legislative Assembly
Suburban Land Agency
Total
Dive
rse
Head
coun
t
Cultu
rally
and
Li
ngui
stic
ally
Di
vers
e FT
E 3,
596.
9 20
5.
4 n/
a n/
a 12
2.5
n/a
5.6
3.8
4 n/
a 16
3,
776.
2
Fem
ale
Head
coun
t 14
,505
18
9
6 1,
008
537
12
90
5 11
39
39
16
,279
Fem
ale
FTE
12,5
20.0
17
.6
8 5.
2 81
7.4
425.
0 11
.4
52.9
4.
6 10
.6
30.5
37
.5
1,42
0.7
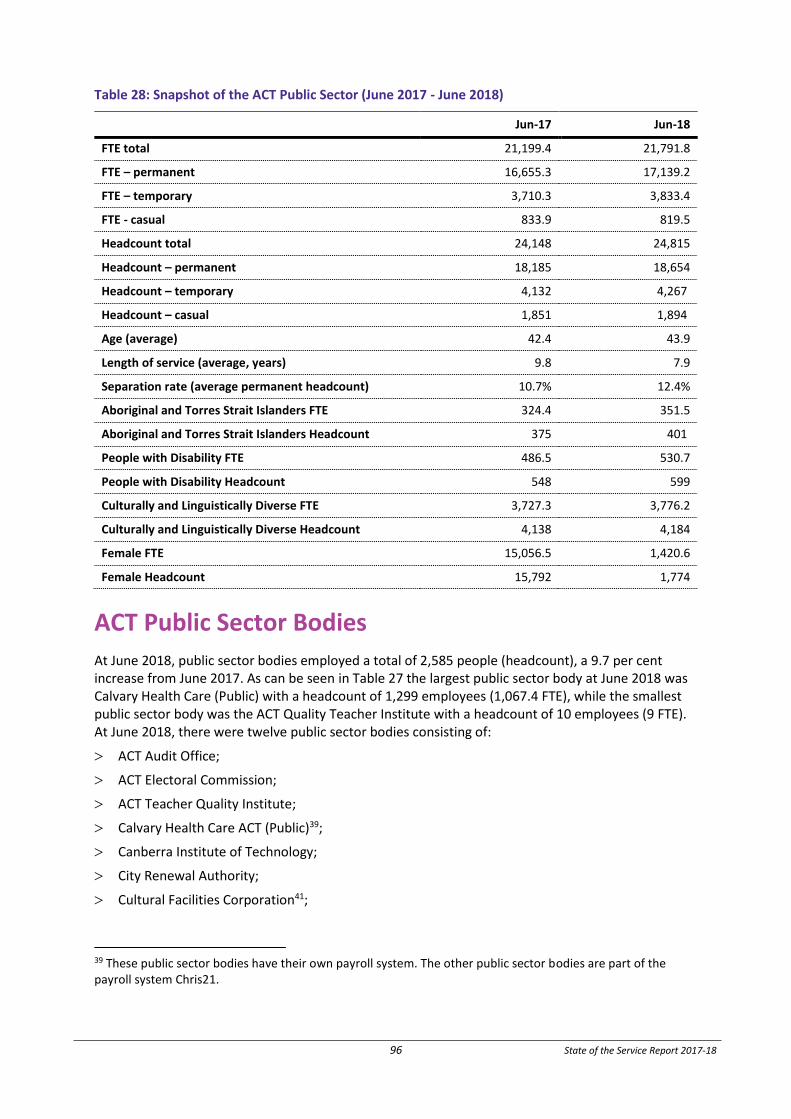
96 State of the Service Report 2017-18
Table 28: Snapshot of the ACT Public Sector (June 2017 - June 2018)
Jun-17 Jun-18
FTE total 21,199.4 21,791.8
FTE – permanent 16,655.3 17,139.2
FTE – temporary 3,710.3 3,833.4
FTE - casual 833.9 819.5
Headcount total 24,148 24,815
Headcount – permanent 18,185 18,654
Headcount – temporary 4,132 4,267
Headcount – casual 1,851 1,894
Age (average) 42.4 43.9
Length of service (average, years) 9.8 7.9
Separation rate (average permanent headcount) 10.7% 12.4%
Aboriginal and Torres Strait Islanders FTE 324.4 351.5
Aboriginal and Torres Strait Islanders Headcount 375 401
People with Disability FTE 486.5 530.7
People with Disability Headcount 548 599
Culturally and Linguistically Diverse FTE 3,727.3 3,776.2
Culturally and Linguistically Diverse Headcount 4,138 4,184
Female FTE 15,056.5 1,420.6
Female Headcount 15,792 1,774
ACT Public Sector Bodies At June 2018, public sector bodies employed a total of 2,585 people (headcount), a 9.7 per cent increase from June 2017. As can be seen in Table 27 the largest public sector body at June 2018 was Calvary Health Care (Public) with a headcount of 1,299 employees (1,067.4 FTE), while the smallest public sector body was the ACT Quality Teacher Institute with a headcount of 10 employees (9 FTE). At June 2018, there were twelve public sector bodies consisting of:
ACT Audit Office;
ACT Electoral Commission;
ACT Teacher Quality Institute;
Calvary Health Care ACT (Public)39;
Canberra Institute of Technology;
City Renewal Authority;
Cultural Facilities Corporation41;
39 These public sector bodies have their own payroll system. The other public sector bodies are part of the payroll system Chris21.
97 State of the Service Report 2017-18
Director of Public Prosecutions40;
Independent Competition and Regulatory Commission;
Long Service Leave Authority;
Office of Legislative Assembly41; and
Suburban Land Agency.
Please note that this is not a complete list of the independent statutory bodies across the public sector, however it does represent those bodies with Head of Service management powers.
The Head of Service Annual Report provides an overview of the public sector bodies in relation to directorates.
2017-18 saw the establishment of two new public sector bodies, the City Renewal Authority and the Suburban Land Agency. These bodies commenced operations on 1 July 2017 under the City Renewal Authority and Suburban Land Agency Act 2017. For the purposes of the Agency Survey, their responses were incorporated as part of the EPSDD response.
For the purposes of the Agency Survey, the ACT Teacher Quality Institute response has been incorporated into the Education Directorate’s response. As such, nine public sector bodies completed the 2018 Agency Survey.
Workforce Planning The 2018 Agency Survey asked public sector bodies whether they had a workforce plan in place. Of the nine, five responded yes. All five bodies detailed key workforce strategies to position their organisation to meet future workforce demands. Common strategies identified included:
use of ARIns and accelerated salary increments;
appropriate recruitment practices including the use of consultants and contractors to meet increased work demands;
succession planning for critical positions;
participation on external working groups focusing on staff recruitment and training within specialist areas;
promoting secondment or acting opportunities for staff; and
the provision of learning and development opportunities so that staff may gain qualifications to meet specific workforce needs.
Attraction and Retention Strategies Public sector bodies were asked to report on any critical skills shortages, capability gaps or difficulty recruiting or retaining employees during the 2017-18 reporting period. Five bodies highlighted areas where they had experienced difficulty with skills shortages, in particular related to attracting those with specialist skills. Due to the specialised nature of the work undertaken in many of the public sector bodies, these skills shortages were particular to each body. For example, Calvary Health Care ACT (Public) identified difficulty attracting staff to positions in specialist health care delivery areas.
40 Workforce profile data for the Director of Public Prosecutions (DPP) has been reported as part of the ACT Public Service Workforce Profile within the JACS Directorate.

98 State of the Service Report 2017-18
Table 29 – Attraction and Retention Incentives, benefits paid under an Australian Workplace Agreement and Special Employment Arrangements in public sector bodies (2017-18)
Total41
Total number of new ARIns commenced in 2017-18 23
Total number of ARIns as at 30 June 2018 43
Total number of SEAs as at 30 June 2018 2842
Total number of AWAs as at 30 June 2018 0
Number of ARIns terminated during 2017-18 2
Number of SEAs terminated during 2017-18 1
Number of AWAs terminated during 2017-18 0
Number of ARIns and/or SEAs providing for privately plated vehicles as at 30 June 2018 0
Total additional remuneration43 paid under AWAs, ARIns and SEAs during 2017-18 $2,566,399
The range of pay classifications of those employees that received ARIns and/or SEAs in the 2017-18 reporting period were from: Administrative Services Officer Class 5 (classification salary range: $74,081 to $78,415) to Senior Specialist (classification salary: $222,205). The public sector body reporting the most ARIns was Calvary Health Care ACT (Public) across a range of health classification levels. The second most common type of classification for an ARIn was within the administration stream comprising Administrative Services Officer Class 5 to Senior Officer Grade A classifications (classification salary: $137,415).
Appropriate Workplace Behaviour The 2018 Agency Survey asked public sector bodies to report on the number of bullying and harassment related contacts received during the 2017-18 reporting period, and whether the public sector body had a formal system in place for the management of bullying and harassment. Six public sector bodies reported having a formal reporting system in place to manage bullying and harassment.
The information in Table 30 outlines the mechanisms of the reporting of bullying and harassment within public sector bodies. It is important to note that the figures captured in Table 30 are not a one for one indicator of bullying and harassment as it is possible for an employee to report through multiple mechanisms, or, have multiple employees report the same matter.
41 For the purposes of reporting ARIns, SEAs and AWAs, the City Renewal Authority and Suburban Land Agency data is included in the ACT Public Service Workforce Report. 42 Prior to the introduction of ARIns in 2013, these arrangements were achieved through the use of Special Employment Arrangements (SEAs) and Australian Workplace Agreements (AWAs). SEAs and AWAs continue to apply to until they are ceased by either party. Whilst there continues to be employees covered by SEAs and AWAs in the ACTPS, no new arrangements can be commenced using these instruments. 43 Total additional remuneration paid under AWAs, ARIns and SEAs during 2017-18 is an approximate figure.
99 State of the Service Report 2017-18
Table 30 – Mechanisms of Reporting Bullying and Harassment in ACT Public Sector Bodies (2017-18)
2017-18
Contacts received by public sector body RED Contact Officers44 4
Contacts received by HR (not by RED contact officers) 13
Contacts received through RiskMan 1
Contacts received through other mechanisms 9
Table 31 shows the actions being taken by public sector bodies in response to reports of bullying and harassment.
Table 31 - Reports of Bullying and Harassment
2017-18
Number of reports of bullying or harassment where a formal preliminary assessment under Section H of ACTPS Enterprise Agreements was commenced during the 2017-18 financial year
16
Number of reports of bullying or harassment commenced during the 2017-18 financial year that resulted in a misconduct investigation under Section H of ACTPS Enterprise Agreements
6
Total number of bullying or harassment related misconduct investigations completed during the 2017-18 financial year where a breach of Section 9 of the PSM Act was found to have occurred
4
Number of bullying or harassment related misconduct investigations that are currently underway/being investigated, as at 30 June 201845. 1
Disciplinary Action Public sector bodies were asked to report on the number of investigations they conducted during the 2017-18 reporting period where an employee was suspected of breaching Section 9 of the Public Sector Management Act 1994 (PSM Act). Across the nine public sector bodies, four suspected breaches of Section 9 of the PSM Act were reported to have occurred.
Of the three disciplinary sanctions imposed in 2017-18, one resulted in a written warning and admonishment while two resulted in the employees resigning prior to a sanction being imposed.
Fraud and Risk Public sector bodies were asked whether a formal risk assessment had been undertaken during 2017-18 in accordance with the Risk Management Standard, with eight of the 10 public sector bodies46 responding yes.
44 Contacts with RED Contact Officers and HR can often be to seek advice on how best to deal with workplace conflict or whether an experience constitutes bullying and harassment. 45 Total number of investigations commenced, completed and ongoing may not reconcile due to action across financial years. 46 The additional body referenced in the Fraud and Risk section of this report was the Teacher Quality Institute (TQI).. The reason for this inclusion was that the TQI has an internal Senior Executive Responsible for Business Integrity Risk who was able to report on the bodies activities during the reporting period.

100 State of the Service Report 2017-18
In the 2017-18 reporting period six public sector bodies (or 60 per cent) reported that they had a current Fraud and Corruption Plan, and when asked if they had reviewed their Fraud and Corruption Plan within the past two years, four public sector bodies (or 40 per cent) reported yes.
Public sector bodies were asked to rate a number of integrity risks within their organisation against a category of low, medium, high or extreme. The risk areas were:
fraud and integrity;
asset management;
procurement and contract management;
finance;
fraud (clients);
IT systems; and
other (please specify).
For the 2017-18 reporting period, the most common risks identified by public sector bodies and their associated risk rating is below:
low risk category: asset management and fraud (clients);
medium risk category: fraud and integrity and finance; and
high risk category: procurement and contract management and IT systems.
There were no extreme category risks identified by public sector bodies.
ACTPS Respect Equity and Diversity (RED) Framework The 2018 Agency Survey asked public sector bodies to identify whether they provided RED specific training to employees during the 2017-18 reporting period. Four of the nine public sector bodies who completed the Agency Survey reported yes, with 73 employees completing this training during the 2017-18 reporting period.
Table 32 outlines the key activities used by public sector bodies to promote the RED message during the reporting period.
Table 32 – Activities to promote the RED message in ACT Public Sector Bodies (2017-18)
Number of Bodies
Executive support of NAIDOC Week activities 7
Workplace celebrations of Harmony Day 2
International Women’s Day events 4
Disability training 1
Aboriginal and Torres Strait Islander cultural awareness training 5
LGBTIQ awareness training 3
Other 0
101 State of the Service Report 2017-18
In addition to the activities outlined in Table 32, six public sector bodies reported undertaking other initiatives to promote the RED message, including:
RED training and RED refresher training;
RED working groups;
promotion of RED through all staff emails from the executive;
ongoing discussions at staff stand-up sessions;
promotion of RED through posters, monthly HR updates, newsletters and signature blocks; and
internal policy documents outlining the principles of RED and positive workplace cultures.
When asked about the initiatives used to promote the RED Framework during 2017-18:
two public sector bodies reported providing RED overview sessions;
three public sector bodies reported using regular discussions about RED issues; and
one public sector body reported using a RED network that meets quarterly (or more frequently).
Public sector bodies were asked how their organisation ensured that all staff had access to the details of RED Contact Officers during the 2017-18 reporting period. The most common method of ensuring staff had access to details of their RED Contact Officers was through the use of common areas and notice boards with five of the nine public sector bodies using this method. Positively, all nine public sector bodies reported that they had used methods to ensure staff had access to the details of RED Contact Officers.
Other methods used by public sector bodies for ensuring staff had access to the details of RED Contact Officers include:
folders and brochures;
identifying RED Contact Officers on staff phone lists;
inclusion of contact information in RED Contact Officer email signature blocks;
regular reminders at monthly all staff meetings and via all staff emails; and
inclusion of RED Contact Officers details in staff induction and new starter packs.
Public sector bodies were asked to report on the initiatives implemented during 2017-18 to support employees and potential employees from diversity target groups, in particular people from a Culturally and Linguistically Diverse background, Aboriginal and Torres Strait Islander Peoples and People with Disability. Initiatives utilised by public sector bodies included:
providing cultural support to staff and providing access to Aboriginal and Torres Strait Islander cultural awareness training;
targeted recruitment strategies to recruit people from diverse backgrounds, including ensuring all job advertisements are written to encourage inclusive recruitment practices;
development and participation of work experience programs for people of refugee and asylum seeker status;
ongoing communication strategies including myth busting exercises around inclusion groups; and
promotion of reasonable adjustment; and
encouraging staff to identify diversity matters and any support they may require in the workplace.
Public sector bodies were asked whether they had a Reconciliation Action Plan (RAP) in place during the 2017-18 reporting period. Of the nine public sector bodies, two reported that they had a RAP in

102 State of the Service Report 2017-18
place. Public sector bodies were then asked to report on the strategies used to support Aboriginal and Torres Strait Islander employees during 2017-18. Of the nine public sector bodies:
three reported utilising Aboriginal and Torres Strait Islander cultural awareness training;
one promoted the ACT Public Sector as an employer of choice for Aboriginal and Torres Strait Islanders;
one reported utilising Aboriginal and Torres Strait Islander employee networks; and
two reported having a dedicated Indigenous Liaison Officer in place.
One public sector body reported utilising other strategies to support Aboriginal and Torres Strait Islander employees during 2017-18, including the provision of support through a dedicated Indigenous unit or Cultural Centre.
Two public sector bodies ensured that for selection panels for Aboriginal and Torres Strait Islander designated positions an Aboriginal and Torres Strait Islander person was a member of the panel. One public sector body consulted with the Office for Aboriginal and Torres Strait Islander Affairs during the recruitment of casual employees.
The 2018 Agency Survey asked public sector bodies if they had a Disability Action Plan in place during the 2017-18 reporting period. One public sector body reported that they had a Disability Action Plan in place. Public sector bodies were also asked to identify the strategies used to support People with Disability employees during 2017-18. Of the nine public sector bodies, two public sector bodies reported using the Whole of Government Reasonable Adjustment Policy.
Seven of the nine public sector bodies reported that they made managers and supervisors aware of the requirement to investigate, and where practical, make reasonable adjustment(s) following disclosure of a disability. Public sector bodies do this through:
embedding reasonable adjustment in pre-employment paperwork;
ongoing promotion of disability awareness and support from HR areas;
provision of workstation assessments for staff by qualified occupational health and safety assessors;
promotion of the Whole of Government Reasonable Adjustment Policy;
workshops and training for managers and supervisors on disability awareness and recruiting to identified positions; and
public sector body specific WHS framework.
All of the nine public sector bodies reported that they did not make any applications for reasonable adjustment or financial assistance to the Commonwealth Job Access Program in the 2017-18 reporting period.
Performance and Capability Development The 2018 Agency Survey asked public sector bodies to report on whether they monitored the utilisation of the ACTPS Performance Framework during the 2017-18 reporting period.
Table 33 – Utilisation of the ACTPS Performance Framework by ACT Public Sector Bodies (2017-18)
Total Public Sector Bodies
Yes 5
No 4
103 State of the Service Report 2017-18
Of the nine public sector bodies, five identified that they monitored the utilisation of the ACTPS performance framework during the 2017-18 financial year.
Table 34 – Strategies used by ACT Public Sector Bodies during 2017-18 to enhance, develop or improve employee capability and performance
Number of Public Sector Bodies
Mentoring programs 4
Funded training 6
Secondments 3
Job swap opportunities 2
Communities of practice 1
Other 6
Public sector bodies were asked to report on the strategies used during the 2017-18 reporting period to enhance, develop or improve employee capability and performance. As shown in table 34, the most utilised strategy by public sector bodies was the use of funded training (six public sector bodies) followed by mentoring programs (four public sector bodies).
Underperformance Public sector bodies were asked to identify whether they monitored the number of preliminary performance discussions held during the 2017-18 reporting period. Of the eight public sector bodies, five reported that they did monitor preliminary performance discussions and that there was one discussion that proceeded to formal underperformance processes during the 2017-18 reporting period.
Public sector bodies were also asked to provide details of the number of formal underperformance processes that were commenced in the 2017-18 reporting year under the procedures set out in the relevant ACTPS Enterprise Agreement. Table 35 provides details of these processes.
Table 35 – ACT Public Sector Bodies Underperformance Processes (2017-18)
Total Processes
Number commenced in 2016-17 but finalised in 2017-18 0
Number commenced in 2017-18 4
Number commenced and finalised in 2017-18 4
Number commenced in 2017-18 but yet to be finalised at 30 June 2018 0
One public sector body reported commencing formal underperformance processes as set out in the relevant ACTPS Enterprise Agreement during the 2017-18 reporting period. Of the four underperformance processes finalised during 2017-18, one employee returned to satisfactory performance, one employee was re-allocated to a role more suited to their capabilities and two resigned during the process.

APPENDICES
105 State of the Service Report 2017-18
APPENDIX 2 – ACTPS WORKFORCE PROFILE INFORMATION
Table 36 - Diversity by Directorate – (percentage)
Directorates ACTPS
Headcount
Aboriginal and Torres Strait
Islander People with
Disability
Culturally and Linguistically
Diverse Female
Chief Minister, Treasury and Economic Development
2,410 1.5% 4.7% 19.3% 51.3%
ACT Insurance Authority 19 n/a 5.3% 10.5% 84.2%
Community Services 933 4.4% 4.5% 15.9% 72.7%
Education 6,814 1.5% 2% 10.3% 76.6%
Environment, Planning and Sustainable Development
672 3.4% 3.3% 12.2% 51.8%
Health 7,607 1.1% 1.8% 27.3% 74.6%
Justice and Community Safety 1,869 2.8% 2.5% 9.1% 46.3%
Transport Canberra And City Services 1,906 2.3% 3.4% 17.3% 24.4%
Total ACT Public Service 22,230 1.7% 2.5% 17.9% 65.2%
n/a – numbers that are reported 1 or less.

106 State of the Service Report 2017-18
Table 37 – FTE by Directorate and employment mode
Directorates Total Permanent Temporary Casual
Chief Minister, Treasury and Economic Development 2,318.6 1,939.9 371.9 6.9
ACT Insurance Authority 18.3 16.3 2 n/a
Community Services 865.8 711.5 146.4 7.9
Education 5,664.1 4,318.6 948.8 396.8
Environment Planning and Sustainable Development 635.1 475.8 154.1 5.2
Health 6,661.2 5,045.4 1,399.8 216.1
Justice and Community Safety 1781 1,523.7 244.1 13.2
Transport Canberra and City Services 1,753.9 1,544.6 188.9 20.3
ACTPS Total 19,697.9 15,575.7 3,455.9 666.3
Table 38 - Average Salary by diversity group (2014-18)
Year ACTPS Female
Aboriginal and Torres Strait
Islander Peoples People With
Disability
Culturally and Linguistically
Diverse
2014 $81,534 $80,642 $75,188 $78,112 $78,398
2015 $84,590 $83,611 $77,137 $81,171 $81,102
2016 $87,584 $86,442 $78,330 $85,019 $84,091
2017 $90,350 $89,356 $79,838 $90,504 $86,295
2018 $91,046 $90,300 $82,798 $91,174 $87,199
107 State of the Service Report 2017-18
Table 39 - Headcount and FTE by Directorate
CMTEDD ACTIA CSD EDU EPSDD Health JACS TCCS ACTPS
FTE total 2,318.6 18.3 865.8 5,664.1 635.1 6,661.2 1,781 1,753.9 19,697.9
FTE permanent 1,939.9 16.3 711.5 4,318.6 475.8 5,045.4 1,523.7 1,544.6 15,575.8
FTE temporary 371.9 2 146.4 948.8 154.1 1,399.8 244.1 188.9 3,455.9
FTE - casual 6.9 n/a 7.9 396.8 5.2 216.1 13.2 20.3 666.3
Headcount total 2,410 19 933 6,814 672 7,607 1,869 1,906 22,230
Headcount permanent 1,993 17 754 4,783 498 5,651 1,574 1,647 16,917
Headcount temporary 393 2 162 1,149 162 1,518 257 196 3,839
Headcount casual 24 n/a 17 882 12 438 38 63 1,474
Age (average) 41.7 41.9 42.5 42.6 42.4 41.3 42.4 46.5 42.4
Length of service 8.4 9.1 7.7 9.7 9 7.9 9.6 9.7 8.8
Separation rate 7.7% n/a 10.1% 5.5% 5.7% 7.7% 7% 8.2% 7.1%
Aboriginal and Torres Strait Islanders Headcount
36 n/a 41 101 23 83 52 44 380
Aboriginal and Torres Strait Islanders FTE
25.6 n/a 40.9 83.8 21.4 73.6 50.4 40.9 336.7
People with Disability Headcount
113 n/a 42 138 22 138 47 64 565
People with Disability FTE 108.5 n/a 39.3 112.8 19.3 120.8 46.8 57.1 505.6
Culturally and Linguistically Diverse Headcount
465 2 148 700 82 2,077 170 330 3,974
Culturally and Linguistically Diverse FTE
451.3 2.0 139.5 597.0 75.3 1,876.8 161.7 293.3 3,596.9
Female Headcount 1,236 16 678 5,218 348 5,678 866 465 14,505
Female FTE 1,166.8 15.3 623.3 4,283.0 319.7 4,885.5 810.4 415.9 12,520.0
n/a – numbers that are reported 1 or less.

108 State of the Service Report 2017-18
Table 40 - Headcount and FTE by division
Directorate Reporting Division Total FTE Total
Headcount
Chief Minister, Treasury and Economic Development Graduate Program 18.0 18
Access Canberra 568.0 587
Corporate 48.2 60
Communications and Engagement 28.2 32
Economics and Financial Group 40.4 41
Enterprise Canberra 164.7 178
Finance and Budget 52.3 53
Infrastructure Finance and Capital Works 115.5 117
Office Of the Chief Digital Officer 11.9 12
Office of the Deputy Under Treasurer, Commercial Services and Infrastructure 2.0 2
Office of the Deputy Under Treasurer Economic, Budget and Industrial Relations
1.0 1
Office Of The Director-General 3.0 3
Office of the Under Treasurer 5.0 5
Policy and Cabinet 48.6 50
Procurement, Property and Venues 196.9 210
Revenue Management 104.2 108
Shared Services 778.1 797
Strategic Finance 21.5 22
Workforce Capability and Governance 44.1 46
Workplace Safety and Industrial Relations 67.2 68
Default Insurance Fund 0.7 1
Chief Minister, Treasury and Economic Development Sub-Total 2,319.3 2,411
ACT Insurance Authority 17.6 18
Chief Minister, Treasury and Economic Development Grand Total 2,336.9 2,429
Community Services Child, Youth and Families 440.4 486
Corporate Services 53.4 56
Family Safety 8.0 8
Housing ACT 221.9 233
Inclusion and Participation 56.6 60
Office of The Director-General 40.8 43
109 State of the Service Report 2017-18
Strategic Policy 44.6 47
Community Services Total 865.7 933
Education Business Services 155.8 163
Deputy Director-General’s Office 3.6 4
Director-General’s Office 4.0 4
Casual Staff 380.1 845
School Performance and Improvement 5,046.6 5,720
System Policy and Reform 73.1 78
Education Total 5,663.2 6,814
Environment, Planning and Sustainable Development Business, Governance and Capability 57.4 58
Engagement and Executive Support 25.6 26
Environment 273.8 295
Land Supply and Policy 23.0 23
Office of the Commissioner for Sustainability and Environment 6.0 6
Office of the Deputy Director-General Land Strategy and Environment 2.0 2
Office of the Deputy Director-General Sustainability and the Built Environment 2.0 2
Office of the Director-General 4.0 4
Planning Delivery 88.8 95
Planning Policy 41.7 46
Sustain and Climate Change 55.2 58
Urban Renewal 55.6 57
Environment, Planning and Sustainable Development Total 635.1 672
Health Canberra Hospital and Health Services 5,547.2 6,402
Corporate 533.6 580
Innovation 152.4 162
Office of the Director-General 51.1 56
Performance, Reporting and Data 47.1 50
Population Health Protection and Prevention 172.4 183
Quality, Governance and Risk 124.0 136
Special Purpose Account 2.9 5
University of Canberra Hospital 29.5 32
Health Total 6,660.2 7,606
Justice and Community Safety ACT Courts and Tribunal 182.2 196
ACT Government Solicitor 112.2 126

110 State of the Service Report 2017-18
Corporate 87.4 89
Corrective Services 404.4 419
Director of Public Prosecutions 84.5 87
Emergency Services 691.0 716
Human Rights Commission 47.3 51
Inspectorate of Custodial Services n/a n/a
Legislation Policy and Programs 78.2 86
Office of the Director-General 8.9 9
Parliamentary Counsel's Office 21.1 23
Public Trustee and Guardian 54.0 56
Security Emergency Management 8.8 10
Justice and Community Safety Total 1,781.0 1,869
Transport Canberra and City Services Chief Operating Officer 104.9 110
City Services 680.6 719
Finance, Legal and Sustainability 33.9 35
Office of The Director-General 3.0 3
Transport Canberra 931.5 1,039
Transport Canberra and City Services Total 1,753.9 1,906
Grand Total 19,697.9 22,230
n/a – numbers that are reported 1 or less.
Table 41 - FTE and headcount by gender across the ACT Public Service
Males Females ACTPS
FTE 7,177.9 12,520 19,697.9
Headcount 7,725 14,505 22,230
111 State of the Service Report 2017-18
Table 42 - Headcount by classification and gender across the ACT Public Service
Classification group Female
Headcount Male
Headcount Total
Headcount % Female % Male
Administrative Officers 4,127 1,372 5,499 75.1% 24.9%
Ambulance Officers 78 137 215 36.3% 63.7%
Ambulance Support Officers 24 24 48 50.0% 50.0%
Bus Operators 67 673 740 9.1% 90.9%
Correctional Officers 53 164 217 24.4% 75.6%
Dentists/Dental Officers 12 4 16 75.0% 25.0%
Disability Officers 2 1 3 66.7% 33.3%
Executives 112 131 243 46.1% 53.9%
Fire and Rescue Officers 14 322 336 4.2% 95.8%
General Service Officers and Equivalent 251 942 1,193 21.0% 79.0%
Health Assistants 87 27 114 76.3% 23.7%
Health Professional Officers 1,144 315 1,459 78.4% 21.6%
Information Technology Officers 29 147 176 16.5% 83.5%
Judicial Officers 7 7 14 50.0% 50.0%
Legal Officers 101 31 132 76.5% 23.5%
Legal Support 15 5 20 75.0% 25.0%
Linen Production and Maintenance 25 28 53 47.2% 52.8%
Medical Officers 457 475 932 49.0% 51.0%
Nursing and Midwifery 2,751 408 3,159 87.1% 12.9%
Professional Officers 148 78 226 65.5% 34.5%
Prosecutors 25 19 44 56.8% 43.2%
Rangers 12 35 47 25.5% 74.5%
School Leaders 538 214 752 71.5% 28.5%
Senior Officers 1,366 1,128 2,494 54.8% 45.2%
Statutory Office Holders 7 8 15 46.7% 53.3%
Teachers 2,889 846 3,735 77.3% 22.7%
Technical Officers 147 125 272 54.0% 46.0%
Trainees and Apprentices 13 25 38 34.2% 65.8%
Transport Officers 4 31 35 11.4% 88.6%
n/a – numbers that are reported 1 or less.

112 State of the Service Report 2017-18
Table 43 - Headcount by employment category and gender by agency (Directorates)
Employment Status (headcount) ACTPS CMTEDD ACTIA CSD EDU EPSDD Health JACS TCCS
Permanent Full time - Male 5,210 954 2 195 903 229 1,092 860 974
Permanent Full time - Female 7,251 855 13 425 2,322 192 2,577 576 291
Permanent Part time - Male 727 20 n/a 11 136 16 229 32 283
Permanent Part time - Female 3,729 163 2 123 1,422 61 1,753 106 99
Temporary Full time - Male 1,112 174 n/a 40 165 68 435 83 145
Temporary Full time - Female 1,687 183 n/a 97 383 76 752 153 42
Temporary Part time - Male 206 9 n/a n/a 136 4 46 7 3
Temporary Part time - Female 834 27 n/a 24 464 14 285 14 6
Casual - Male 463 10 n/a 8 255 7 126 21 36
Casual - Female 1,010 14 n/a 9 627 5 311 17 27
n/a – numbers that are reported 1 or less.
113 State of the Service Report 2017-18
Table 44 - Headcount by employment category and gender by agency (Public sector Bodies)
Employment Status (headcount) AC
T Au
dit O
ffice
ACT
Elec
tora
l Com
mis
sion
ACT
Teac
her Q
ualit
y In
stitu
te
Calv
ary
Heal
th C
are
(Pub
lic)
Canb
erra
Inst
itute
of T
echn
olog
y
City
Ren
ewal
Aut
horit
y
Cultu
ral F
acili
ties C
orpo
ratio
n
Inde
pend
ent C
ompe
titio
n an
d Re
gula
tory
Com
mis
sion
Long
Ser
vice
Lea
ve A
utho
rity
Offi
ce o
f the
Leg
isla
tive
Asse
mbl
y
Subu
rban
Lan
d Ag
ency
Permanent Full time - Male 15 n/a 2 n/a 156 8 18 5 2 14 35
Permanent Full time - Female 14 6 4 n/a 225 8 18 2 8 20 30
Permanent Part time - Male n/a n/a n/a n/a 12 n/a n/a n/a n/a 4 n/a
Permanent Part time - Female n/a n/a n/a n/a 43 3 11 n/a n/a 10 5
Temporary Full time - Male 5 2 n/a n/a 68 4 7 n/a n/a n/a 6
Temporary Full time - Female 2 n/a n/a n/a 102 n/a 5 n/a 2 n/a 4
Temporary Part time - Male n/a n/a n/a n/a 22 n/a n/a n/a n/a n/a n/a
Temporary Part time - Female n/a n/a n/a n/a 59 n/a 3 n/a n/a n/a n/a
Casual - Male n/a n/a n/a 42 108 n/a 40 n/a n/a 6 n/a
Casual - Female n/a n/a n/a 80 82 n/a 53 n/a n/a 7 n/a
n/a – numbers that are reported 1 or less.
Table 45 – Headcount by Age group, gender and average length of service (Directorates)
Age Range Female
Average Length of Service (years) –
Female Male
Average Length of Service (years) –
Male
Less than 20 years old 73 0.7 65 0.7
20-29 years old 2,517 2.7 1,112 2.8
30-39 years old 3,986 6.4 2,053 5.5
40-49 years old 3,775 9.6 1,969 9.3
50-59 years old 3,016 13.3 1,708 13.9
60-69 years old 1,069 15.7 736 16.2
70+ years old 69 16.6 79 18.2
Total 14,505 8.7 7,722 9.1

114 State of the Service Report 2017-18
Table 46 - Recruitment and Separation rates by classification group (Directorates)
Classification group Separation Rate Recruitment Rate
Administrative Officers 8.2% 12.7%
Ambulance Officers 2.7% 5.4%
Ambulance Support Officers 7.5% 25.1%
Bus Operators 1% 0%
Correctional Officers 2.9% 7.7%
Dentists/Dental Officers 20.7% 27.6%
Disability Officers 24.5% 0%
Executives 2.9% 15.8%
Fire and Rescue Officers 5.4% 7.2%
General Service Officers and Equivalent 6.0% 9.6%
Health Assistants 9.6% 18%
Health Professional Officers 9.1% 9.8%
Information Technology Officers 2.6% 11.2%
Legal Officers 9% 8%
Legal Support 37.3% 55.9%
Linen Production and Maintenance 5.5% 0%
Medical Officers 6.7% 8.6%
Nursing and Midwifery 7.4% 12%
Professional Officers 12.1% 16.6%
Prosecutors 10.8% 21.5%
Rangers 0% 0%
School Leaders 5.3% 0.3%
Senior Officers 8.2% 8.2%
Teachers 4.8% 9.7%
Technical Officers 6.2% 8.9%
Trainees and Apprentices 15.9% 15.9%
Transport Officers 7.4% 0%
ACTPS Total 7.1% 10.3%
115 State of the Service Report 2017-18
Table 47 - Recruitment and Separation rates by Directorate
Directorate Separation Rate Recruitment Rate
Chief Minister, Treasury and Economic Development 7.7% 11.1%
ACT Insurance Authority n/a 5.9%
Community Services 10.1% 13%
Education 5.5% 7.7%
Environment, Planning and Sustainable Development 5.7% 8.5%
Health 7.7% 11.3%
Justice and Community Safety 7.0% 11.4%
Transport Canberra and City Services 8.2% 12.6%
ACTPS Total 7.1% 10.3%
Table 48 - Recruitment and Separation rates by Classification Group (Public Sector Bodies)
Public Sector Bodies Separation Rate Recruitment Rate
ACT Audit Office 13.8% 10.3%
ACT Electoral Commission 0% 0%
ACT Teacher Quality Institute 54.2% 13.5%
Calvary Health Care (Public) 11% n/a
Canberra Institute of Technology 7.3% 4.6%
City Renewal Authority 5.6% 16.8%
Cultural Facilities Corporation 6.4% n/a
Independent Competition and Regulatory Commission n/a 31.7%
Office of the Legislative Assembly 10.4% n/a
Long Service Leave Authority 19.8% 29.8%
Suburban Land Agency 12.7% 12.7%
n/a – numbers that are reported 1 or less.

116 State of the Service Report 2017-18
APPENDIX 3 – DEFINITIONS
Appointments
Appointments refer to the recruitment of permanent officers. Appointees can come from outside the ACTPS, or be already working internally in the organisation as temporary or casual employees. The table below describes the subsets of appointment.
Definition
Appointment from External This is any commencement with the ACT Public Service where the person has commenced directly as a permanent officer.
Total Appointment from Temporary Contract
This is the total of temporary contract staff who were appointed as permanent officers.
Total Promotion from Higher Duties Allowance (HDA)
This is the total number of promotions immediately following a period of HDA.
Total Permanent Transfer/Promotion This is the total number of permanent transfers and promotions (not following higher duties).
ACT Public Service
The ACT Public Service comprises seven directorates that report to the Head of Service as constituted by the Administrative Arrangements 2017 (No 1).
ACT Public Sector
The ACT Public Sector encompasses the employees of the seven directorates that report to the Head of Service, as well as staff employed under the Public Sector Management (PSM) Act 1994 in other ACT Government entities.
Employees
Employees include permanent officers, temporary and casual employees.
Employees – casual
Casual employees are those engaged on an ad hoc hourly or daily basis with no ongoing tenure of employment. This category of employment can also be referred to as non-ongoing and usually consists of an employment arrangement which is not considered systematic, continuous or permanent.
Employees – full time
Full time employees can be either permanent or temporary who work full time hours in accordance with their provisions.
Employees – part time
Employees either permanent or temporary, who work less than full time hours.
General Service Officers (GSOs)
Examples include tradespeople, gardeners, drivers and labourers.
117 State of the Service Report 2017-18
Gender pay gap
Gender pay gap is equal to one minus female weekly ordinary time earnings, divided by male weekly ordinary time earnings, multiplied by 100. Annual salary represents the salary increment point, pro-rated for part time employees, and does not include allowances or other pay components.
Headcount and Full Time Equivalent
The Workforce Profile information is based on paid employees. Paid headcount for all employees includes employees on paid leave or with back pay, as at the end of the financial year. Headcount and Full Time Equivalent (FTE) are standard measures of staff numbers. Headcount considers each employee as one regardless of whether they are full time or part time. In contrast, FTE represents total employee numbers based on equivalent full time hours worked. For example, an employee working standard full time hours attracts an FTE of 1.0 whereas an employee working half the standard full time hours attracts an FTE of 0.5. The total FTE in this example would be 1.5 whereas the headcount would be two.
Average FTE and average headcount are based on the 26 pay periods in each financial year. The average over time removes seasonality that can be experienced at a point in time, particularly with temporary and casual employees, and for this reason it is used to calculate year-on-year percentage increases.
Leave
Staff can access annual leave and personal leave entitlements. Annual leave is often referred to as recreational leave. Personal leave can be taken in instances of personal illness or injury, for bereavement, or when caring for a dependent due to illness or injury. Leave can experience a time-lag in processing.
Entitlements can be found in the relevant section of enterprise and collective agreements, see the ACTPS Employment Portal for details: http://www.cmd.act.gov.au/employment-framework/home.
Permanent Officers
Permanent officers can be full time or part time, who have been appointed to an office or as an unattached officer under the Public Sector Management Act 1994.
Reconciliation Action Plan (RAP)
A Reconciliation Action Plan (RAP) is a business plan that documents what an organisation commits to do to contribute to reconciliation in Australia. A RAP allows organisations to realise their vision for reconciliation, and provides a platform for each individual and community to advance on their reconciliation journey. RAPs are practical plans of action built on relationships and respect by creating social change and economic opportunities for Aboriginal and Torres Strait Islander Australians.
Recruitment Rate
The Recruitment Rate is determined by dividing the number of permanent appointments by the average permanent headcount for the reporting period. Permanent appointments include staff who commence as a permanent officer directly, as well as staff who were already engaged as a temporary officer and were subsequently permanently appointed

118 State of the Service Report 2017-18
Separation Rate
The separation rate is determined by dividing the total number of permanent separations by the average permanent headcount, over the financial year, for the ACTPS, and excludes transfers between directorates. This calculation is consistent with other jurisdictions including the Australian Public Service.
Territory Owned Corporations (TOCS)
Government enterprises (known as Territory Owned Corporations) under the Territory Owned Corporations Act 1990 (TOCS), are separate entities to the ACTPS and other public sector bodies and are not included in this report. As at June 2018 the single TOCS is Icon Water Limited.
Workforce Average
The calculation of a workforce average is based on the total available data for ACT Public Service directorates only. The average is a weighted means of groups that have varying numbers of employees and it is not a simple average of the figures for groups shown.
119 State of the Service Report 2017-18
APPENDIX 4 – 2018 AGENCY SURVEY
The 2018 Agency Survey is used to gather information to support the production of the annual State of the Service Report incorporating the Head of Service Annual Report. The information provided in the responses will assist the Head of Service to meet the obligations under the Annual Reports (Government Agencies) Act 2004, and the Annual Reports (Government Agencies) Directions 2017.
The survey is broken into five sections as follows:
Head of Service Annual Report: focuses on recognising the significant achievements and highlighting some of the successes of the ACT Public Service and more broadly across the ACT Public Sector. This will be achieved through the inclusion of case studies that highlight:
- the major activities and programs delivered by directorates to meet the needs of the ACT community;
- awards, nominations and recognition that have been received by individuals and teams; and
- significant achievements that have been celebrated throughout the service.
Objective A: An AGILE workforce: meeting the needs of the ACT community and effectively serving the Government of the day;
Objective B: INNOVATIVE: people planning for the future;
Objective C: A RESPONSIVE workforce: reflecting the ACT community; and
Objective D: An ENGAGED workforce: getting the best from people at work.
Included within the survey is space for commentary to support your data. Please use the free text boxes to showcase the action or initiative your directorate/agency is undertaking for each topic, or to include any other contextual information you feel is important.
Guidance The Agency Survey is due by COB Wednesday 18 July 2018. To ensure that publishing deadlines
are met, extensions to this deadline will not be granted.
Please use the text boxes to complete your responses. Should you find that your response exceeds the amount of space available in the designated text box, please utilise the ‘add page’
buttons available throughout the survey.
Upon completion of the survey, please print and provide to your delegate for verification and approval.
Once your delegate has signed the hard copy of your survey it should be scanned and emailed to [email protected] along with the original electronic version of your completed PDF.
Please note: your survey responses will not be considered complete until both the signed copy of your responses and the original electronic PDF have been received by Workforce Capability and Governance, Chief Minister, Treasury and Economic Development Directorate.
All hard copy and electronic PDF responses will be validated.

120 State of the Service Report 2017-18
Directorate/Agency Information 1. Which directorate/agency are you responding
from? Insert text
Head of Service Annual Report The 2017-18 Head of Service Annual Report will be focussing on recognising the significant achievements right across the ACT Public Sector to meet the needs of the ACT community and achieve the ACT Governments priorities. The comments, examples, case studies and stories provided will contribute to this section of the State of the Service report.
This theme will continue into the 2018-19 report where the major focus will be on celebrating the 25th anniversary of the ACT Public Sector, and recognising how it has matured and developed into a modern and contemporary public service over this time.
Celebrating achievements 2. During the 2017-18 financial year, what are some of the significant achievements that the
teams/divisions within your directorate/agency achieved or celebrated?
Insert text
3. During 2017-18 financial year, what awards, nominations or recognition did
teams/individuals within your directorate/agency receive? Please provide details of the award, nomination or recognition including the activities and actions that led to this achievement. This may include any significant speeches, papers and research released by your directorate/agency.
Insert text
4. In the 2017-18 financial year, what are some of the major activities/programs your
directorate/agency has undertaken to meet the needs of the ACT community?
Insert text
This question is for Directorates only. Public sector entities are not required to answer this question.
5. The priority areas for the Strategic Board are: 1. Drive the growth and diversification of the ACT economy (including by reforming our
regulatory approach) 2. Lead the Digital Transition in the ACT 3. Drive Social Inclusion and domestic violence prevention and responses 4. Position the ACT within the nation and region 5. A) Build an agile, streamlined and engaged ACT Public Service
B) Create agile procurement processes and deliver on capital works in a timely manner 6. Support the Government to engage the ACT community
121 State of the Service Report 2017-18
In the 2017-18 financial year, what are some of the major activities and initiatives your directorate has delivered under the priority areas identified by the Strategic Board?
Drive the growth and diversification of the ACT economy:
Please provide details
Lead the Digital Transition in the ACT
Please provide details
Drive Social Inclusion and domestic violence prevention and responses
Please provide details
Position the ACT within the nation and region
Please provide details
A) Build an agile, streamlined and engaged ACT Public Service
Please provide details
B) Create agile procurement processes and deliver on capital works in a timely manner
Please provide details
Support the Government to engage the ACT community
Please provide details
6. In the 2017-18 financial year, what are some of the activities undertaken in your
directorate/agency to promote the ACTPS Values of Respect, Integrity, Collaboration and Innovation under the Public Sector Management 1994?
Respect
Please provide details
Integrity
Please provide details
Collaboration
Please provide details
Innovation
Please provide details

122 State of the Service Report 2017-18
AN AGILE WORKFORCE: MEETING THE NEEDS OF THE ACT COMMUNITY AND EFFECTIVELY SERVING THE GOVERNMENT
OF THE DAY
Attraction and Retention Strategies 7. Are there any areas in your directorate/agency which would benefit from attraction and
retention initiatives?
☐ Yes (provide details below) ☐ No
Please comment on any areas associated with the attraction and retention of the following groups: Mature age employees; Aboriginal and Torres Strait Islander employees; People with Disability; Entry level positions/traineeships/graduates; People with specialist skills, including leadership skills at the Executive level; Veterans; and Other
Mature age employees
Please provide details
Aboriginal and Torres Strait Islander employees
Please provide details
People with Disability
Please provide details
People recruited as part of a formal graduate program
Please provide details
People with specialist skills, including leadership skills at the Executive level
Please provide details
Entry level positions/traineeships
Please provide details
Veterans
Please provide details
Other
Please provide details
123 State of the Service Report 2017-18
8. Please comment on any attraction and retention initiatives undertaken during 2017-18 or proposed plans for attraction and retention initiatives for 2018-19.
Mature age employees
Please provide details
Aboriginal and Torres Strait Islander employees
Please provide details
People with Disability
Please provide details
People recruited as part of a formal graduate program
Please provide details
People with specialist skills, including leadership skills at the Executive level
Please provide details
Entry level positions/traineeships
Please provide details
Veterans
Please provide details
Other
Please provide details
9. Were there any machinery of government changes in your directorate/agency during the
2017-18 financial year?
☐ Yes ☐ No
If yes, please provide some details:
Insert text
INNOVATIVE: people planning for the future
10. Does your directorate/agency have a strategic workforce plan in place? ☐ Yes ☐ No

124 State of the Service Report 2017-18
11. When was the strategic workforce plan last reviewed? __/__/____
12. What are the key workforce strategies in the workforce plan that position your entity to
meet future workforce demands?
Note: Please provide commentary on any strategies or ‘case studies’ during the 2017-18 financial year.
Insert text
A RESPONSIVE WORKFORCE: REFLECTING THE ACT COMMUNITY
Respect, Equity and Diversity (RED) Framework The RED Framework was introduced in 2010 and has been supported since this time by the provision of training and refresher training across directorates/agencies.
13. In the 2017-18 financial year did your directorate/agency provide RED specific training to employees? ☐ Yes ☐ No
If so, how many employees completed RED specific training in the 2017-18 financial year?
Insert number
14. Please provide comment on activities which occurred within your directorate/agency during
the 2017-18 financial year to continue to reinforce the RED message, including, but not limited to the following:
Executive Support of NAIDOC week activities; Workplace celebrations of Harmony Day; International Women’s Day events; Disability training; Aboriginal and Torres Strait Islander cultural awareness training; LGBTIQ awareness training
Executive support of NAIDOC week activities
Please provide details
Workplace celebrations of Harmony Day
Please provide details
International Women’s Day events
Please provide details
Disability training
125 State of the Service Report 2017-18
Please provide details
Aboriginal and Torres Strait Islander cultural Awareness training
Please provide details
LGBTIQ awareness training
Please provide details
15. As at 30 June 2018, what is the total number of staff in your directorate/agency that are:
a) RED Contact Officers Insert number
b) Executive RED Sponsors Insert number
16. In the 2017-18 financial year, which of the following strategies has your directorate/agency
used to promote the RED framework?
RED overview sessions (separate from formal RED training) ☐
Regular discussions regarding RED issues ☐
A RED network that meets quarterly or more frequently ☐
None of the above ☐
Other – please specify: ☐
Please provide details
17. In the 2017-18 financial year, how has your directorate/agency ensured that all staff have
access to the details of RED Contact Officers?
Intranet ☐
Website ☐
Staff Directory ☐
Common areas/notice boards ☐

126 State of the Service Report 2017-18
Agency switchboard ☐
None ☐
Other – please specify: ☐
Please provide details
18. In the 2017-18 financial year, did your directorate/agency
implement any RED initiatives not previously mentioned? ☐ Yes ☐ No
If so please provide a case study of the initiative/s and its outcomes.
Please provide details
19. In the 2017-18 financial year, did your directorate/agency conduct a Diversity Census or
“Update your Details” process to encourage the disclosure of diversity?
☐ Yes (provide details below and tick all that apply) ☐ No
Diversity Census ☐
"Update your Details" process ☐
20. In the 2017-18 financial year, what initiatives did your directorate/agency implement to
support employees and potential employees from diversity target groups? Please describe the steps taken to support these groups:
People from a culturally and linguistically diverse background
Please provide details
Aboriginal and Torres Strait Islander people
Please provide details
People from a culturally and linguistically diverse background
Please provide details
Lesbian, Gay, Bisexual, Transgender, Intersex and Queer (LGBTIQ) people
127 State of the Service Report 2017-18
Please provide details
21. In the 2017-18 year, did your directorate/agency engage any of the following inclusion
strategies:
Job advertisements written in plain English ☐
Reasonable adjustments made at interview for People with Disability ☐
Reasonable workplace adjustments made for successful applicants with a disability
☐
Training for panel members on the inclusion of the needs of diverse applicants ☐
Roles and responsibilities clearly defined in job descriptions ☐
Other – please specify: ☐
Please provide details
22. In the 2017-18 financial year, did your directorate/agency introduce any broader activities or
initiatives to raise awareness of diversity in the workplace (e.g. cultural and linguistic diversity, LGBTIQ diversity, international/national days celebrating diversity)?
☐ Yes (provide details below) ☐ No
Please provide details
ACTPS Employment Strategies
23. In the 2017-18 financial year, did your directorate/agency have a Reconciliation Action Plan in place?
☐ Yes (provide details below) ☐ No
If so, what were the key attributes of the plan and what activities/initiatives were undertaken by your directorate/agency to promote or implement the plan?
Please provide details

128 State of the Service Report 2017-18
24. In the 2017-18 financial year, which of the following strategies did your directorate/agency implement to attract Aboriginal and Torres Strait Islander employees?
Designated positions ☐
Aboriginal and Torres Strait Islander traineeship ☐
Work experience ☐
Positions in the Whole of Government Graduate Program for Aboriginal and Torres Strait Islander people
☐
Aboriginal and Torres Strait Islander people cadetship ☐
Mentoring programs ☐
School based apprenticeships for Aboriginal and Torres Strait Islander people ☐
Other – please specify: ☐
Please provide details
25. In the 2017-18 financial year, what skills or resources were used to support Aboriginal and
Torres Strait Islander employees? (tick all applicable)
Aboriginal and Torres Strait Islander employee networks ☐
Aboriginal and Torres Strait Islander study awards ☐
Aboriginal and Torres Strait Islander cultural awareness training ☐
Promote the ACTPS as an employer of choice for Aboriginal and Torres Strait Islander people
☐
Having a dedicated Indigenous Liaison Officer in place ☐
Other – please specify: ☐
Please provide details
129 State of the Service Report 2017-18
26. In the 2017-18 financial year, what did your directorate/agency do to ensure that when recruiting to an Aboriginal and Torres Strait Islander identified position there was an Aboriginal and Torres Strait Islander person on the selection panel?
Please provide details
27. In the 2017-18 financial year, did your directorate/agency have a Disability Action Plan in
place?
☐ Yes (provide details below) ☐ No
If so, what were the key attributes of the plan and what activities/initiatives were undertaken by your directorate/agency to promote or implement the plan?
(Examples may include advertising jobs in both mainstream and disability publications/disability employment services, promoting flexible working conditions and reasonable adjustments, promotion and recognition of International Day of People with Disability, review of policies and procedures to ensure they promote inclusive work practices, building “disability confidence” of co-workers, delivery of mental health awareness training, etc)
Please provide details
28. In the 2017-18 financial year, select the following strategies your directorate/agency used to attract People with Disability to the ACT Public Service? (tick all applicable)
☐ Yes (provide details below) ☐ No
Employment Strategy
How many People with Disability
were engaged into positions as a result of each
strategy?
Designated positions ☐
Disability traineeship ☐
Work experience ☐
Positions in the Whole of Government Graduate Program for People with Disability
☐
Disability cadetship ☐

130 State of the Service Report 2017-18
Mentoring programs ☐
School based apprenticeships for People with Disability ☐
Other – please specify: ☐
Please provide details
29. Does your directorate/agency use any of the following strategies to support employees with
a disability? (tick all applicable)
Disability employee networks ☐
Directorate/agency specific Reasonable Adjustment Policy ☐
Whole of Government Reasonable Adjustment Policy ☐
Disability awareness training ☐
Other – please specify below: ☐
Please provide details
30. How does your directorate/agency make managers and supervisors aware of the
requirement to investigate and where practical make reasonable adjustment(s) following disclosure of a disability?
Please provide details
31. Did your directorate/agency make any applications for reasonable adjustment and/or
financial assistance to the Employee Assistance Fund in the 2017-18 financial year (via Job Access)?
☐ Yes (provide details below) ☐ No
If yes, please indicate how many applications were made, how many were approved and what was the total value of approved applications.
Please provide details
131 State of the Service Report 2017-18
A. Amount of applications made? B. Amount of applications approved? C. Total value of approved applications?
32. What strategies does your directorate/agency implement to ensure workplaces are
accessible?
Please provide details
33. In the 2017-18 financial year, did your directorate/agency work with a Disability
Employment Service provider to place People with Disability in employment within your directorate/agency?
☐ Yes (provide details below) ☐ No
If so, which providers did your directorate/agency use?
Please provide details
34. In the 2017-18 financial year, what inclusion strategies did your directorate/agency employ
to maximise participation of Aboriginal and Torres Strait Islander employees and People with Disability on training courses such as the Manager Development Program? (tick all applicable)
Targeted invitations to apply ☐
Targeted advertising through networks ☐
Reserved place for target group employees ☐
None ☐
Other– please specify below: ☐
Insert text

132 State of the Service Report 2017-18
Preventing Bullying and Harassment
Note: information captured in this section is intended to gain insight into the mechanisms of the reporting of bullying and harassment.
In the ACTPS, work bullying is defined as unreasonable, undesirable behaviour that:
is repeated; is unwelcome and unsolicited; creates, or could create, a risk to health and safety (including physical or psychological
harm); occurs between workers of an organisation; and a reasonable person would consider to be offensive, intimidating, humiliating or
threatening.
For more information visit: https://www.cmtedd.act.gov.au/employment-framework/
It should be noted that the figures captured are not a one for one indicator of bullying and harassment as it is possible for an employee to report through multiple mechanisms, or multiple employees may report the same incident.
35. Does your directorate/agency have a formal reporting system in
place for the management of bullying and harassment? ☐ Yes ☐ No
36. For the 2017-18 financial year, please list the total number of bullying and harassment
contacts:
Contacts received by your Agency’s RED Contact Officers Insert number
Contacts Received by HR (not by RED Contact Officer); Insert number
Contacts received through RiskMan; and Insert number
Contacts received through other mechanisms Insert number
37. What is the number of reports of bullying or harassment where
a preliminary assessment under Section H of ACTPS Enterprise Agreements was commenced during the 2017-18 financial year.
Insert number
38. What is the number of reports of bullying or harassment received during the 2017-18 financial year that resulted in a misconduct process under Section H of ACTPS Enterprise Agreements.
Insert number
133 State of the Service Report 2017-18
39. What is the number of bullying or harassment related misconduct processes completed during the 2017-18 financial year where a breach of section 9 of the PSM Act was found to have occurred.
Note: number completed, regardless of when commenced.
Insert number
40. What is the number of bullying or harassment related misconduct processes that are currently underway/being investigated, as at 30 June 2018.
Note: total number of investigations commenced, completed and ongoing may not reconcile due to action across financial years.
Insert number
Misconduct or Discipline Matters On behalf of the Public Sector Standards Commissioner, the Professional Standards Unit maintains centralised data for misconduct investigations across the ACTPS for inclusion into the State of the Service Report.
41. In the 2017-18 financial year, how many misconduct matters were subject to a preliminary assessment that were not referred for a misconduct investigation?
Insert number
42. In the 2017-18 financial year, did your directorate/agency
undertake misconduct process that were NOT referred to the Professional Standards Unit?
☐ Yes (provide details below)
☐ No
If so, please provide the following misconduct investigation data for matters relating to the 2017-18 financial year:
Total matters Misconduct investigations
Admission statements
Summary dismissals
Other
Insert number Insert number Insert number Insert number Insert number
43. Please outline the number of allegations that there
proven and not proven. Proven Not Proven
Insert number Insert number
44. Please provide the number of sanctions applied under the Enterprise Agreement for the 2017-
18 financial year, only for matters NOT referred to the Professional Standards Unit:
Written warning and admonishment Insert number

134 State of the Service Report 2017-18
Financial penalty (includes reduction in increment, deferred increment, fine, and/or reimbursement of damages) Insert number
Employee transferred to another position either at level or lower lever Insert number
Termination of employment Insert number
Employee resigned prior to imposition of sanction Insert number
45. Please outline any themes to these misconduct processes NOT referred to the Professional Standards Unit. For example, fraud and integrity, asset management, procurement and contract management, financial processes etc.
Please provide details
AN ENGAGED WORKFORCE: GETTING THE BEST FROM PEOPLE AT WORK
Performance and Capability Development
46. In the 2017-18 financial year, did your directorate/agency monitor the utilisation of the ACTPS performance framework? ☐ Yes ☐ No
47. As at 30 June 2018, what percentage of your directorate/agency’s
employees had a performance agreement in place? Insert percentage
48. In the 2017-18 financial year, what strategies did your directorate/agency employ to
enhance, develop or improve employee capability and performance? (tick all applicable)
Mentoring programs ☐
Funded training ☐
Secondments ☐
Job swap opportunities ☐
Communities of practice ☐
Other – please specify below: ☐
135 State of the Service Report 2017-18
Please provide details
49. Please provide some details of any of these strategies implemented in your
directorate/agency.
Please provide details
Underperformance
Note: In cases where an employee’s performance consistently falls below expectations, a manager should communicate this to the employee (a preliminary underperformance discussion). The employee is then given a reasonable period to address the identified deficiencies.
50. During the 2017-18 financial year, did your directorate/agency monitor the number of preliminary performance discussions held?
☐ Yes ☐ No
If so, how many were there that realised the required improvements and did not proceed to formal underperformance processes?
Insert number
Please provide details
51. Please provide details of the number of formal underperformance processes that were
commenced in the 2017-18 financial year under the procedures set out in the relevant ACTPS Enterprise Agreement.
Number commenced in 2016-17 but finalised in 2017-18 Insert number
Number commenced in 2017-18 Insert number
Number commenced and finalised in 2017-18 Insert number
Number commenced in 2017-18 but yet to be finalised as at 30 June 2018 Insert number
52. Of the underperformance processes that were finalised during the 2017-18 financial year,
please indicate how many of the following outcomes occurred:
Satisfactory performance achieved at the completion of the process Insert number
Development program instituted Insert number

136 State of the Service Report 2017-18
Assignment to other duties Insert number
Deferral of increment Insert number
Reduction in classification Insert number
Termination of employment Insert number
Resignation of employee during process Insert number
Validation and Final Approval Contact Officer details
Name of Contact Officer/s Insert text
Position Title Insert text
Signature
Date
Approval by the Delegate
Name Insert text
Position Title Insert text
Signature
Date