ACH Annual Report 2018 - Alberta Health Services...1 ALBERTA CHILDREN’S HOSPITAL PEDIATRIC TRAUMA...
69
1 ALBERTA CHILDREN’S HOSPITAL PEDIATRIC TRAUMA PROGRAM ANNUAL REPORT 2018 ACH Trauma Program Staff Dr. Jonathan Guilfoyle ............................................... Trauma Medical Director Dr. Natalie Yanchar ........................................ In-Patient Trauma Surgical Lead Jennifer Tweed ....................................................... Trauma Program Manager Sherry MacGillivray ........................................................... Trauma Coordinator Lisette Lockyer ........................................................ Trauma Nurse Practitioner Linda-Mae Grey................................................................. Trauma Data Analyst
Transcript of ACH Annual Report 2018 - Alberta Health Services...1 ALBERTA CHILDREN’S HOSPITAL PEDIATRIC TRAUMA...
1
ALBERTA CHILDREN’S HOSPITAL
PEDIATRIC TRAUMA PROGRAM
ANNUAL REPORT
2018
ACH Trauma Program Staff
Dr. Jonathan Guilfoyle ............................................... Trauma Medical Director
Dr. Natalie Yanchar ........................................ In-Patient Trauma Surgical Lead
Jennifer Tweed ....................................................... Trauma Program Manager
Sherry MacGillivray ........................................................... Trauma Coordinator
Lisette Lockyer ........................................................ Trauma Nurse Practitioner
Linda-Mae Grey ................................................................. Trauma Data Analyst

2
TABLE OF CONTENTS
1. Introduction .................................................................................................... 3
2. Clinical Care .................................................................................................. 8
3. Education .................................................................................................... 11
4. Research ..................................................................................................... 14
5. Quality Assurance ....................................................................................... 17
6. Future Planning .......................................................................................... 18
APPENDICES
Appendix A Trauma Quality Indicators ............................................................. 19 Appendix B Major Trauma Statistics .................................................................. 36

3
1. Introduction The ACH Trauma Program strives to achieve excellence across the entire spectrum of trauma care. We believe that our Trauma Program’s emphasis on prevention, education, and coordinated, collaborative, evidence-based, multi-disciplinary care are fundamental to our success. The past year has been one of self-reflection as our program has prepared for our upcoming accreditation with Accreditation Canada. We have used the accreditation process as an opportunity to critically appraise our program, to identify opportunities for growth and to celebrate our accomplishments. We look forward to showcasing our program in September 2019. The first step in trauma care is Injury Prevention. Our Program is a vocal advocate for injury prevention and we are fortunate to have partners at both the provincial and national level. Through both our own ACH Trauma database and the Canadian Hospital Injury Reporting Prevention Program (CHIRPP), we are able to monitor injury trends and target areas of intervention. One such intervention stemmed from the recognition of the frequency of falls from second-storey windows, particularly in the summer months. The ACH Trauma Program has partnered with the City of Calgary to bring forward an amendment to the National Building Code to restrict the opening of windows in an effort to prevent such injuries. Other initiatives include educational efforts to highlight the risk of ATV use in children as well as petitioning the provincial government to legislate stricter regulations for their use in minors. We are also collaborating with the City of Calgary Animal Services to highlight the number of dog bites treated at ACH and to ensure follow-up assessment is done. Education has always been one of the great strengths of this Trauma Program. The ACH Trauma Program provides educational leadership for both ACH clinical staff, as well as outreach education to rural and regional providers. On-going education includes: monthly telehealth Pediatric Trauma Rounds; twice yearly Trauma Nursing Core Courses (TNCC); and outreach education to referral centers by partnering with KidSIM. We run regular mock trauma codes that involve the entire trauma team, beginning in the trauma bay and continuing to the OR. In March of 2018 the ACH Trauma Program was again involved in the Pediatric Emergencies Alberta Children’s Hospital (PEACH) conference, offering plenary lectures and simulations focused on trauma care for rural providers. Other ongoing initiatives include the KidSono project which has made point of care ultrasound a standard practice in our trauma bay. The majority of our TTLs are now certified in the Focused Assessment with Sonography in Trauma (FAST) and with the implementation of the KidSono online learning modules, many are learning advanced ultrasound skills as well. Another ongoing educational initiative is our Emergency Department’s monthly, multi-disciplinary simulation program. This program has been developed to help our entire team maintain competency in critical resuscitation skills. They occur in our trauma bay and include two staff physicians, a full complement of nurses and an RRT.

4
The scenarios are designed to highlight real challenges faced by our teams and the debriefing sessions allow the team to discuss issues around communication and team dynamics. This has been coupled with the ACH Pediatric Airway Course that most of the physician group has completed. The Brain Injury and Rehabilitation Program continues to provide services for patients who have suffered traumatic brain injuries. This program includes in-patient comprehensive rehabilitation services, as well as outpatient services in coordination with Gordon Townsend School. The ACH Trauma Program would like to extend a heartfelt thank you to our amazing Emergency Medical Services team. They provide exceptional care, with limited resources, in the most austere environments and we are greatly appreciative of the work they do and the lives they save. We are in regular communication with our EMS colleagues and they frequently attend our various meetings, so that together we can optimize the pre-hospital care of pediatric patients. Our rural partners do an excellent job of providing high-level care despite the broad geography of Southern Alberta and the disparate allocation of resources that can pose significant logistical challenges. The Trauma Program works closely with both the ACH Transport Team and Shock Trauma Air Rescue Society (STARS) to ensure the timely transport of these critically injured patients to ACH where they can receive definitive care. We are also in close contact with our rural partners, providing both feedback and educational outreach. Upon arrival to ACH, trauma patients are met by a world class, multi-disciplinary trauma team. The Trauma Program has developed and refined a trauma activation system that ensures that this team is assembled and ready promptly. The Trauma Team Leader (TTL) is a designated Emergency Physician currently on shift whose first priority is to manage resuscitations in the Trauma Bay. The Trauma Surgery Team responds to all trauma activations and co-manages the patient alongside the TTL, then assuming responsibility for the in-patient management of these children. The Pediatric Intensive Care Team also responds to all activations providing their expertise in the management of critically ill patients and providing on-going care for those patients requiring intensive care. In addition to a Trauma Team Activation, we also have an OR Activation system which immediately mobilizes the OR Team and the on-call anesthesiologist for patients with airway emergencies or those that require an immediate operation. A child with multi-system injuries may also require the services of multiple other surgical subspecialties. We enjoy a great working relationship with our radiology department who also respond to all trauma activations, providing timely access to diagnostic imaging around the clock. The radiology department has committed to providing attending reads of all trauma activations within the hour in order to ensure accuracy and minimize discrepancies

5
between preliminary and final reports. They have also committed to providing interventional radiology support 24/7. We are most fortunate to have such an incredible group of trauma nurses in our emergency department who are invaluable members of our team. Nurses have the opportunity to maintain their skill set through the Trauma Nursing Core Course (TNCC) that is provided bi-annually, as well as a wide range of simulation programs with which our nurses are integrally involved. We also have an exceptional respiratory therapy team that respond to all activations. As one can well imagine, the coordination of all of these disciplines for a critically injured child with competing medical issues is essential to provide the highest level of care. The ACH Trauma Program continually endeavors to bridge gaps and to optimize seamless care for these patients. We have broad subspecialty representation at our monthly Trauma Committee meetings which provides a forum to share concerns and make recommendations to further optimize our system. Our mock codes serve to further foster the close working relationship and teamwork among the various specialties caring for these patients. The In-patient Trauma Program provides integrated care for patients and families, from time of first assessment through hospital discharge. They are supported by multiple surgical subspecialties, including but not limited to pediatric general surgery, orthopedic surgery, neurosurgery, plastic surgery, and urology. In-patient pediatrics and rehabilitation medicine are instrumental in long-term return to function and getting kids home as quickly as possible. Obviously the care of children with multi-system injuries is complex but is supported by a dedicated group of healthcare professionals including nursing, physical therapy, and social work. The Pediatric Trauma Program continues to collaborate on many provincial and national projects. Although Alberta is a large and diverse province with a wide variety of medical facilities we all come together through the Alberta Trauma Services Core Leadership Team to provide coordinated provincial care. Recently we develop a provincial Trauma Team Activation Criteria for pediatrics and we are currently working on a provincial ‘No Refusal Policy’. We are very proud of Dr. Natalie Yanchar our Surgical Lead and our Trauma Coordinator Ms. Sherry MacGillivray who were elected to the Trauma Association of Canada (TAC) Board of Directors. Calgary will be hosting the next TAC meeting in February of 2019, which we hope many of you will attend. Our program is very fortunate to have a fantastic data analyst, Linda-Mae, who along with our amazing Trauma Coordinator Sherry MacGillivray, collect and compile all of our trauma data. In Appendix A you will find a compilation of all of our Trauma Quality Indicators covering such aspects of care as length of stay, time to imaging, time to operative intervention, appropriate airway management, missed injuries, unplanned re-admissions and patient outcomes. We track indicators such as Trauma Team Activation and use this data to fine tune our activation criteria (Table 6). Overall, we have been performing quite well on the majority of indicators but there are areas that we would like

6
to see improved. Our ED Length of stay is frequently over 4 hours which demonstrates our facilities need to streamline our admission process and enhance our in-patient capacities (Table 13). Tracking of such indicators is invaluable for quality assurance purposes and we are currently working on securing funding to join the American College of Surgeons Trauma Quality Improvement Program so that we can compare our results to a national benchmark. Appendix B provides detailed and comprehensive trauma statistics including etiology of injury, patient care and outcomes. The most striking statistic this year is a dramatic increase in the number of deaths. In 2018 there were 13 trauma related deaths, which is twice that of the previous 5 year average and accounts for 22% of patients with an ISS > 12 (Table 1 & Figure 37). Violence as a mechanism of injury has increased from 13% to 20%, accounting for 7 of the 13 fatalities (Figure 3). The mortality rate of children who suffer violent trauma is very high (58%). Sadly, self-inflicted trauma has nearly tripled from 12% to 33% and accounted for nearly a quarter of all fatalities (Figure 10). Additionally four young children died from an inflicted non-accidental injury. In total, over half of all deaths this year were from non-accidental, violent trauma. We certainly hope this year was an anomaly and does not represent a new trend. Finally, we wish to express our appreciation for all of the staff at the Alberta Children’s Hospital, who continue to support our goals in caring for critically injured children and youth. Dr. Jonathan Guilfoyle would like to personally thank all the members of the Trauma Program for their hard work and commitment to ongoing excellence in Pediatric Trauma Care at the Alberta Children’s Hospital. Above all, he would like to thank Ms. Sherry MacGillivray for her tireless dedication and commitment to our Pediatric Trauma Program. Trauma Committee Members 2018: Dr. Jonathan Guilfoyle (chair) Dr. Natalie Yanchar (surgery lead) Dr. Andrea Boone (emergency lead) Dr. Karl Phillips (emergency fellow) Dr. Eli Gilad (PICU) Dr. Jeremy Luntley / Dr. Jamin Mulvey (anesthesiology) Dr. Cathy Chrusch (diagnostic imagining) Dr. Clare Gallagher (neurosurgery) Dr. Fabio Ferri de Barros / Dr. Marcel Abouassaly (orthopedics) Dr. Michelle Simonelli (CHIRPP) Wendy Bissett (PICU) Lisette Lockyer (trauma NP) Jessica Graham / Leah Harburn (OR) Jennifer Tweed / Carla Stiles (emergency)
7
Lenora Thorkelson / Colleen Belanger (in-patient trauma unit) Kathy Lyons (social work) Nora Ansah (injury prevention) Sherry MacGillivray (trauma coordinator) NOTE: The patients included in this report are those with an Injury Severity Score (ISS) > 12 and who are admitted to the hospital or die in the emergency department at the Alberta Children’s Hospital (ACH). Patients who die at the scene of their traumatic event are not represented in this report. ISS is an anatomical scoring tool that provides an overall score for patients with single or multiple system injuries. The ISS captured in the Alberta Trauma Registry ranges between 12 and 75. The assumption is the higher the ISS score, the more serious the injury suffered.

8
2. Clinical Care Identifying ways to improve the clinical care of the trauma patient at the ACH is a major focus of the Pediatric Trauma Program.
i) Trauma In-patient Unit • Unit 4 continues to be the ACH trauma unit. This has allowed the care of
all traumatic injuries to be consolidated within one group of care providers who continue to show dedication and excellence in the care they provide.
ii) Pediatric In-patient Trauma Service
• A dedicated in-patient trauma service, to provide and direct the primary clinical care of multiply injured trauma patients, continues to be well led by the Division of Pediatric General Surgery. They provide attending physician coverage for this service 24/7.
iii) Trauma Tertiary Survey • The Pediatric Trauma Tertiary Survey is to be completed by the in-patient
trauma service on all major trauma patients at 24 hours after admission. This helps to identify missed injuries or issues early in the patients stay.
iv) Pediatric Trauma Nurse Practitioner • This position supports the in-patient trauma service, as well as plays a
significant role on the Brain Injury Team. The Trauma Nurse Practitioner also runs an outpatient follow up Trauma Clinic.
v) Trauma Team Activation Guidelines (Code 77) • A Code 77 is activated by a nurse in the Emergency Department for major
trauma patients using specific guidelines that include physiological, anatomical and mechanism of injury. In 2018 these guidelines were adopted by the Stollery in Edmonton as well as Level 3 Trauma Centres in Alberta that treat children. These guidelines are continuously monitored for ‘over’ ‘under’ and ‘missed’ call and for any issues that arise. See Appendix A for 2018 details.
vi) OR Activation (Code 88)
• A Code 88 activation is called in order to mobilize the OR team for an anticipated emergent airway intervention and/or an anticipated need for an emergent OR. This is an automatic 24/7 response from Anesthesiology, Anesthesia RRT, OR Nursing team (3 RN’s), PACU nursing team (2 RN’s). The Pediatric Intensivist is also on the activation for those times they are in-house and can assist with a difficult airway. Activations are monitored and reviewed by the Trauma Committee.

9
vii) Trauma Team Leader Record • This is the documentation tool to be used by Trauma Team Leaders
(Emergency Physicians) looking after major trauma patients. It was created to help address gaps in documentation that were identified in Quality Management reviews. The tool is a combination of ‘check boxes’ and various prompts to ensure complete documentation of the assessment and management of trauma patients. A regular audit for % of completion for Code 77 patients is done and reported to the Trauma Committee. The 2018 completion rate was 100%.
viii) Provincial Nursing Trauma Resuscitation Record • As a directive from the Provincial Trauma Committee, the Alberta Trauma
Coordinators developed the provincial nursing trauma record to be used in all emergency departments and urgent care centers in the province. This record was felt to be an important standardization of trauma care and management.
ix) Pediatric Massive Transfusion Protocol
• The Pediatric Massive Transfusion Protocol is available for use for all patients in ACH. These activations are evaluated in partnership with Transfusion Medicine. Additionally, there are 2 units of O negative pRBCs in the ED trauma room for immediate use.
x) Trauma ‘No Refusal’ Policy
• An ACH ‘No Refusal’ Policy for pediatric trauma patients was endorsed by the Pediatric Trauma Committee in 2010. It states that no pediatric trauma patient in the ACH catchment area will be refused or turned away from our facility. This is the case even when there are no PICU or in-patient beds available. Under those circumstances, patients will be accepted and stabilized in the ED at ACH while further disposition is arranged.
xi) Trauma Beading Program
• Thanks to continual generous grants from the Alberta Children’s Hospital Foundation, the Trauma Beading Program for major trauma patients has completed its 10th year! The opportunity for admitted trauma patients to mark and remember their journey by earning beads for length of hospital stay, diagnostic tests and treatment procedures has been well received by both trauma patients and their families. This program, administered by the Pediatric Trauma Coordinator and operationalized by the ACH Child Life Specialists, has been a huge success. We would like to extend our gratitude to the ACH Child Life Specialists for making this important program a continued success.

10
xii) ACH Trauma Manual • The ACH Trauma Manual is for new residents and staff physicians, as well
as other disciplines working with trauma patients. The manual lives on the Trauma Services page on the internal website for AHS. It is revised as necessary by the Trauma Committee.
xiii) Liaising with Regional, Provincial and National Groups
• Provincial Trauma Committee - Members • Interdisciplinary Trauma Network of Canada - Members • Trauma Association of Canada - Members • National Emergency Nurses Association - Member • Canadian Hospitals Injury Prevention & Reporting Prevention Programs
(CHIRPP) - Members • Alberta Children’s Hospital Foundation liaison - for trauma families who
want to ‘give back’ by discussing their trauma experience in venues such as the annual Radiothon
• Shock Trauma Air Rescue Service (STARS) liaison for pediatric trauma patients
• Referral Access Advice Placement Information Destination (RAAPID) liaison for pediatric trauma patients

11
3. Education
i) Trauma Rounds Rounds are held in the ACH Ampitheatre to accommodate telehealth to outside centres
• January 25, 2018 – Dr. Meaghan Mahoney “Organ and Tissue Donation at
ACH – Opportunities for the Trauma Service ”
• March 22, 2018 – Detective Mike Cavilla “Child Homicide Case” • May 24, 2018 – Dr. Nadia Sultan “Normal Pediatric Skeleton, Disease
Mimickers & Common Pediatric Fractures”
• September 27, 2018 – Dr. Danny Mireault “Inhalation Injuries”
• October 25, 2018 – Dr. Kimberly Sass, Dr. Warren Yunker, Sherry MacGillivray “Dog Bites”
ii) Trauma Nursing Core Course • The Trauma Nursing Core Course (TNCC) continues to be held at ACH
twice per year. This course is designed for nurses caring for patients in any part of the trauma spectrum and has international recognition. This course is taken by the ED nurses prior to working in the trauma room and has also been endorsed by management of the in-patient trauma unit.
iii) Mock/Just-in-Time Trauma Simulation
• These mocks provide physicians, fellows, residents, nurses, respiratory therapists, nursing aides and unit clerks with an opportunity to learn from simulated trauma cases. At least once per year, one of these mocks start in the ED with a full activation of both Code 77 & 88 moving up to the OR to involved the entire OR team as well as General Surgery and other surgical services (i.e. Neurosurgery, ENT).
iv) Outreach Mobile Education • The partnership between the ACH Trauma Program and KidSIM™, the
Pediatric Human Patient Simulation Program, continues to deliver education to both regional and rural partners. These are very popular multidisciplinary educational sessions that include pre-hospital as well as in hospital care givers.

12
The following centres were visited in 2018:
January Golden BC February Airdrie March Vulcan April Banff, Olds May Rocky Mountain House June Cranbrook BC, Okotoks September Sheldon Chumir October Medicine Hat November Red Deer, Cardston, Fort Macleod, Pincher
Creek, Crowsnest Pass, Canmore December Taber, Raymond
v) Emergency Department Trauma Simulation Sessions
• Trauma simulation sessions are held for the ED trauma team on an annual basis including staff physicians, nursing, RRT and other support staff. These sessions have been developed to help our entire ED team maintain competency in critical resuscitation skills. They occur in the ED trauma bay and the scenarios are designed to highlight real challenges faced by our teams and the debriefing sessions allow the team to discuss issues around communication and team dynamics.
vi) Trauma Simulation Sessions
• Trauma education is included in General Nursing Orientation for all new PICU, ED and Unit 4 (trauma unit) nurses at the ACH as well as the rotating Nursing Support Team and the ACH Pediatric Critical Care Transport Team. Adult ED nurses in the Calgary area also have one day with the pediatric educators, where trauma education and simulation are introduced.
vii) Trauma Association of Canada Annual Conference (Toronto, On – February 21-23, 2018) • Presidential Address – Dr. Natalie Yanchar • “The Use of a Pediatric Pre-arrival & Pre-departure Trauma Checklist to
Improve Clinical Care in a Simulated Trauma Resuscitation: a randomized trial” – Sherry MacGillivray
viii) Pediatric Emergencies Alberta Children’s Hospital (PEACH) (Calgary – March 9 & 10, 2018) • Trauma Track including lecture, skills and simulations – Leads: Dr.
Jonathan Guilfoyle, Sherry MacGillivray
ix) Canadian Association of Emergency Physicians (CAEP) (Calgary – May 29 & 30, 2018) • Pediatric Trauma Track – Lead: Dr. Jonathan Guilfoyle

13
x) Teleflex EZ-IO Workshop (Calgary, ACH – October 30 & November 1, 2018)
xi) University of Calgary, Medical Education
• Medical Student Course VI Lecture: Introduction to Pediatric Trauma – Dr. J. Guilfoyle
• Family Medicine Resident Academic Half-Day: Approach to Pediatric Trauma – Dr. J. Guilfoyle
• Pediatric Resident Academic Half-Day: Multi-trauma in the ED– Dr. J. Guilfoyle
• Emergency Medicine Resident Academic Half-Day: Pediatric Trauma: Pitfalls and Pearls – Dr. J. Guilfoyle
• PEM Fellow Academic Day: An Evidence Based Review of Severe TBI – Dr. J. Guilfoyle

14
4. Research
The following research projects were in progress or completed during 2018:
PUBLICATIONS:
1) Pandya A, Chaput K, Schertzer A, Moser D, MacGillivray S, Guilfoyle J, Blackwood J, Joffe A, Thompson GC. “Risk of Infection and Sepsis in Pediatric Patients with Traumatic Brain Injury Admitted to Hospital Following Major Trauma” Scientific Reports 2018 8:9798
2) Mikrogianakis A, Grant V “The Kids are Alright: Pediatric Trauma Pearls” Emergency Medicine Clinics of North America 2018 36(1):237-257
3) Lee P, Lam R, MacGillivray S, Lin Y, Cheng A, Guilfoyle, J, Mikrogianakis A, Grant V. “The Use of a Pediatric Trauma Checklist to Improve Clinical Performance in a Simulated Trauma Resuscitation: a randomized trial” Trauma Association of Canada Annual Scientific meeting 2018. Abstract Canadian Journal of Surgery 2018
4) Assen S, MacGillivray S, Ball C, Lall R, Vis C, Yanchar NL. Trauma care for teens: To peds or not to peds? Podium presentation. Trauma Association of Canada Annual Scientific meeting 2018. Abstract Canadian Journal of Surgery 2018
5) Gill PJ, McLaughlin T, Rosenfield D, Hepburn CM, Yanchar NL, Beno S. All-terrain vehicle serious injuries and death in children and youth: a national survey of Canadian paediatricians. Poster presentation. Trauma Association of Canada Annual Scientific meeting 2018. Abstract Canadian Journal of Surgery 2018
6) Jessula S, Asbridge M, Romao R, Green R, Yanchar NL. Where to Start? Injury Prevention Priority Scores in Canadian Children. Podium presentation. Canadian Association of Pediatric Surgeons Annual Scientific meeting 2018. Abstract Canadian Journal of Surgery 2018
7) Pitt TM, Aucoin J, Nettel-Aguirre A, McCormack GR, Howard AW, Graff P, Rowe BH, Hagel BE. “Adaptation of a Canadian culpability scoring tool to Alberta police traffic collision report data”. Traffic Injury Prevention, 1-6. doi: 10.1080/15389588.2019.1567916
8) Han CS, Mâsse LC, Wilson A, Janssen I, Schuurman N, Brussoni M, & the Playability Research Team (including Hagel BE). “State of Play: Methodologies for Investigating Children’s Outdoor Play and Independent Mobility”. Children, Youth and Environments 2018;28(2):194-231

15
9) Audet O, Hagel BE, Nettel-Aguirre A, Mitra TP, Emery CA, Macpherson A,
Lavoie MD, Goulet C. “What are the risk factors for injuries and injury prevention strategies for skiers and snowboarders in terrain parks and half-pipes? A systematic review”. British Journal of Sports Medicine, Epub ahead of print: [04/09/2018] doi:10.1136/bjsports-2018-099166
10) Richmond SA, Donaldson A, Macpherson A, Bridel W, Van den Berg C, Finch C, Hagel BE, Emery CA. “Facilitators and barriers to the implementation of iSPRINT: a sport injury prevention program in junior high schools”. Clinical Journal of Sport Medicine: March 26, 2018 - doi: 10.1097/JSM.0000000000000579
11) Sran R, Djerboua M, Romanow NTR, Russell K, White K, Goulet C, Emery CA, Hagel BE. “Ski and snowboard school programs: Incidence and risk factors for injury”. Scandinavian Journal of Medicine and Science in Sport 2018, 28(5):1569-1577. doi: 10.1111/sms.13040
12) Schuurman N, Walker BB, Swanlund D, Amram O, Yanchar N. “Identification of unique risk signatures for pedestrian injuries in cities: A mixed-methods approach to characterizing risk factors at pedestrian injury hotspots in Halifax, Canada”. BMC Public Health 2018, submitted
13) Yanchar NL. 2018 Trauma Association of Canada Presidential Address: “ABCs of Trauma: Advocacy Because We Can”. J Trauma Acute Care Surg 2018: 85(2):285-9.
14) Yanchar NL, Beno S, “Trauma Association of Canada, Canadian Association of Emergency Physicians. Firearm injuries in Canada: Can we be better?” Annals of Surg 2018;267(6):1009-10.
15) Green RS, Yanchar N. “One size does not fit all for Canadian trauma systems”. CJEM 2018;20(2):160-161.
16) Moore L, Champion H, O'Reilly G, Leppaniemi A, Cameron P, Palmer C, Abu-Zidan FM, Gabbe B, Gaarder C, Yanchar N, Stelfox HT, Coimbra R, Kortbeek J, Noonan V, Gunning A, Leenan L, Gordon M, Khajanchi M, Shemilt M, Porgo V, Turgeon AF. “Impact of trauma system structure on injury outcomes: A systematic review and meta-analysis”. World J of Surgery 2018;42(5):1327-39

16
IN PROGRESS:
1) Charyk-Stewart T, MacGillivray S, Widas L, Falconer C, McDowall D, Brennan
M, Lake J, Bailey K. “National Pediatric Trauma Care Quality Indicators Project”
2) Yanchar N, MacGillivray S, Lockyer L, Lopushinsky S, Mikrogianakis A “Guiding the use of Computed Tomography in Children with Blunt Abdominal Trauma: a feasibility project”
3) Bal C, Bryan P, Wishart I, MacGillivray S, Grey LM. “Determining the Utility of
Laboratory Tests Ordered in the Trauma Lab Workup for Emergency Patients that Meet Code 77 or Trauma Team Activation Criteria at the Alberta Children’s Hospital”

17
5. Quality Assurance As part of the Pediatric Trauma Program quality improvement process, several performance indicators throughout the continuum of care are monitored on a regular basis as a measure of performance. Some of the indicators stem from audit filters set out by the American College of Surgeons’ Committee on Trauma and Trauma Registry performance measures published by the South Western Sydney Region Trauma Department, Liverpool, Australia. Other indicators were developed at the ACH as site specific performance indicators. All cases flagged by a performance indicator or audit filter are reviewed by the ACH Pediatric Trauma Quality Management Committee to determine appropriateness of care and follow-up to care providers and trauma systems. The list of performance indicators is listed below and are summarized in Appendix A. Pre-ACH care:
1. Presence of pre-hospital documentation from any phase of patient transport. 2. GCS < 8 at scene with mechanical airway intervention. 3. Length of stay at rural hospital > 2 hours. 4. Injury time to Trauma Center (TC) < 4 hours (for transferred patients). 5. Utilization of ACH Transport team for transfer.
Resuscitative care: 6. Trauma Team Activation. 7. Direct admission (bypassed the Emergency Department (ED)). 8. GCS <8 at the TC with mechanical airway intervention. 9. Presence of ED nursing documentation every 30 minutes. 10. Presence of sequential neurological documentation in the ED for suspected head/spinal cord
injuries. 11. Hypothermic in the ED (< 35.0˚C). 12. GCS < 12 in the TC with a CT head performed within 4 hours from trauma center arrival (TCA). 13. Patient stay in the ED less than 4 hours.
Definitive care: 14. Admission to a surgeon or intensivist. 15. Craniotomy within 4 hours after TCA with unstable epidural/subdural hematoma. 16. Missed cervical spine injury after 48 hours from TCA without maintaining spinal precautions. 17. Any laparotomy procedure performed. 18. Femur fracture to the OR within 24 hours from TCA. 19. Open long bone fracture to the OR within 6-12 hours from TCA (depending on the severity of #). 20. Unplanned return to the OR within 48 hours of initial procedure. 21. Missed injuries identified after 48 hours from TCA. 22. Reduction of joint dislocation/fracture dislocation after 1 hour from TCA. 23. Revascularization of an ischemic limb within 6 hours from the time of injury. 24. ORIF of facial fractures within 7 days after injury. 25. Operative repair of spinal fractures within 7 days after injury. 26. Pelvic ring fracture/acetabular fracture (with hemodynamic instability) provisional stabilization > 6
hours from TCA. 27. Definitive treatment of displaced acetabular fracture > 7 days from TCA. 28. Unplanned PICU admission or re-admission.
Outcome: 29. Death during the first 24 hours from TCA. 30. Did the patient die in ACH?

18
6. Future Planning The 2019 year will focus on the following activities: • Preparation for upcoming Trauma Accreditation • Continuing to focus on quality Pediatric Trauma Education • Continuing advocacy of Injury Prevention initiatives • Continuing leadership on a regional, provincial and national level • Continuing an active pediatric trauma research program • Continuing excellence in quality assurance leadership • Continuing to improve communication with all of the services impacted in trauma
delivery through the Trauma Committee • Establishing and growing connections with other Canadian Pediatric Trauma
Programs to work collaboratively on research, quality assurance projects and improving standards of care for pediatric trauma patients
• Continuation of running the Royal College Accredited, Trauma Resuscitation in Kids (TRIK) course

ACH Trauma Quality Indicators (ISS>12) 2018
19
Appendix A Alberta Children’s Hospital Trauma Quality Indicators for 2018 Pre-ACH Care: 1. Presence of pre-hospital documentation from any phase of patient transport.
Are all pre-hospital ambulance reports from all phases of patient transport present on the medical record? Exclusions: Inappropriate where patients arrived by private vehicle, walk-ins, and unknown how patient arrived at hospital. Unknown: missing PCR. Inclusions: n = all patients with pre-hospital care provider(s).
Indicator Yes No
2018 n = 49 44 5 2017 n = 43 43 0 2016 n = 33 32 1 2015 n = 63 62 1 2014 n = 76 71 5
Cooperation with Alberta Health Services EMS allows on-line record access, however obtaining out of province pre-hospital documentation is still challenging at times. This is routinely discussed at the Pediatric Trauma Quality Management Committee where EMS is an engaged member. 2. Glasgow Coma Scale (GCS) < 8 at scene with mechanical airway intervention.
Did the patient with a first recorded scene GCS < 8 receive mechanical airway intervention at the scene? Mechanical airway includes: oral intubation, nasal intubation, tracheostomy, and cricothyroidotomy. It does not include nasopharyngeal airway, laryngeal mask (LMA) or oropharyngeal airway. Exclusions: Inappropriate - patients with unknown GCS, patients without prehospital care, intubated patients prior to GCS calculation. Inclusions: n = all patients with first recorded GCS ≤ 8 at the scene.
Indicator Yes No 2018 n = 15 5 10 2017 n = 8 2 6 2016 n = 6 2 4 2015 n = 18 8 10 2014 n = 12 2 10
Pediatric experts advise that it is best practice to move the injured pediatric patient from the scene quickly to acute care for intubation, if required, rather than attempt intubation at the scene. EMS evidenced-based protocols have LMA insertion as first attempt rather than endotracheal tube intubation. All patients are reviewed at the Pediatric Trauma Quality Management Committee to ensure appropriate care was given.
93
98 97100
10
7
23
90
2014 2015 2016 2017 2018
%Yes %No
1744 33 25 33
8356 67 75 67
2014 2015 2016 2017 2018
%Yes %No

ACH Trauma Quality Indicators (ISS>12) 2018
20
3. Length of stay (LOS) at rural hospital greater than two hours.
Was the length of stay at a rural hospital > 2 hours? Exclusions: Inappropriate - patients had no first or second hospital. Unknown - missing arrival or departure time at first or second hospital Inclusions: n = all patients arriving at ACH from hospitals outside Calgary.
Indicator Yes No
2018 n = 14 13 1
2017 n = 19 13 6
2016 n = 11 8 3
2015 n = 25 15 10
2014 n = 30 20 10
If at any time the Pediatric Trauma Quality Management Committee feels that the Rural Hospital LOS is not acceptable, communication to that hospital is sent for clarification of the timeline and appropriately followed up. The significant percentage of cases with a prolonged rural stay remains a concern and education around the importance of timely disposition and transfer of major trauma patients remains a priority. This is also an Alberta Trauma Services indicator that is being monitored across the Province. 4. Injury time to trauma centre < 4 hours for transferred patients.
Did the patient arrive at a trauma centre < 4 hours from the time of injury? Trauma Centre is defined as ACH, FMC, U of A, Royal Alexandra or Stollery Hospitals in Edmonton. As well as Red Deer, Lethbridge or Medicine Hat Hospitals. Exclusions: Out of the patient transfers, 9 patients were transferred from within Calgary, 2 from Lethbridge, 3 from Red Deer and 2 from Medicine Hat resulting in a total (n=4) of patients for this indicator. 3 patients had an unknown time of injury. Inclusions: n = all patients transferred from a non-trauma centre hospital with a known time of injury and known time of arrival.
Indicator Yes No 2018 n = 4 0 4
2017 n = 8 4 4
2016 n = 8 1 7
2015 n = 16 5 11
2014 n = 13 5 8
Many factors contribute to delays, however, most are found to be related to challenges in mobilizing transfer of patients from rural health centers. RAAPID (Referral, Access, Advice, Placement, Information & Destination) protocols help mobilize transport more efficiently, while still not a mandatory service in Alberta, it is being used much more widely. This indicator has also been a priority for Alberta Trauma Services.
67 6073 68
93
33 40 27 327
2014 2015 2016 2017 2018
%Yes %No
3831
13
23
62 6987
50
100
2014 2015 2016 2017 2018
%Yes %No

ACH Trauma Quality Indicators (ISS>12) 2018
21
5. Utilization of ACH Transport team for transfer.
ACH Transport Team Utilization
Was the patient transported by the ACH Transport Team? Inclusions: n = all patients transferred from a primary or secondary hospital.
Indicator Yes No 2018 n = 23 8 15
2017 n = 22 6 16
2016 n = 16 3 13
2015 n = 34 8 26
2014 n = 38 10 28
The Alberta Children’s Hospital offers a specialized Pediatric Transport Team Service, which transports critically ill or injured children from referral centers located in southern Alberta, south-eastern British Columbia, and south-western Saskatchewan. The transport team travels by ambulance, helicopter or fixed-wing aircraft and provides quality pediatric critical care to the residents of these areas who do not otherwise have access to pediatric critical care specialists. Through RAAPID, medical control and mobilization of the team is achieved via the PICU attending physician. The team consists of a respiratory therapist (RT) and an ACH ED or PICU registered nurse (RN), with a physician on the team for difficult cases. Stabilization, if possible, is achieved prior to returning back to ACH, thus making the previous two indicators of ‘rural hospital LOS’ and ‘time to trauma centre’ longer on some occasions. All transport times are audited by the Trauma Coordinator and the Transport Team Clinical Nurse Specialist.
26 24 19 27 35
74 76 81 73 65
2014 2015 2016 2017 2018
%Yes %No

ACH Trauma Quality Indicators (ISS>12) 2018
22
Resuscitative care: 6. Trauma Team Activation
Trauma Team Activation (Code 77) is the responsibility of the ED nurse answering the EMS patch phone using specific criteria that were developed by the Pediatric Trauma Committee. These include physiologic and anatomic factors, as well as mechanism of injury. The above graph illustrates Code 77 activation for the major trauma population only (ISS > 12). In the past year, the total Code 77 activations for all patients (regardless of ISS) was 68. ‘Overcall’ (those not admitted) was 18%. ‘Missed call’ (those that should have had an activation according to guidelines) was 7%. We also monitor for ‘undercalls’ (those patients that had significant injuries (ISS > 12, but did not meet activation criteria). In 2018 the undercall rate was 49%, which is fairly high, but all of these cases were reviewed and there were no consistent variables that could be added to our current criteria to lower our undercall rate without significantly increasing the overcall rate. More importantly none of these patients were medically unstable and the undercalls were not found to impact patient care. The over, under and missed call is monitored closely by the Trauma Coordinator and reported monthly at the Trauma Committee. As aforementioned this past year this Pediatric Trauma Team Activation criteria has become a Provincial document and used at the Stollery Children’s Hospital as well as the Level 3 Trauma Centres that treat children.
2
01 1
32
6
3
1 1
3
5
1 12 2 2
1
34
10
21
43
1
3 32
1
3
12
100
1 1
5
32 2
4
1
43
0
Jan Feb Mar Apr May Jun Jul Aug Sep Oct Nov Dec
# of
Act
ivat
ions
Major Trauma Team Activation
2015 2016 2017 2018

ACH Trauma Quality Indicators (ISS>12) 2018
23
7. Direct Admission - Bypassed the Emergency Department (ED)
Direct Admission Exclusions: ED deaths Inclusions: n = all patients who were admitted to the trauma centre.
Indicator Yes No 2018 n = 57 6 51 2017 n = 46 5 41 2016 n = 39 1 38 2015 n = 66 9 57 2014 n = 96 6 90
There is currently a No Direct Admit Policy for trauma patients – meaning they should stop in the ED for an assessment. This policy was made to ensure that every patient gets an unbiased, good primary survey. If a patient was admitted to a referral hospital for more than 24 hrs prior to the transfer this policy does not apply. This past year two patients were transported from another Calgary hospital directly to PICU. Another from a Calgary hospital was transported directly to the OR. A fourth patient was admitted directly to the inpatient unit from a referral center. All 4 patients were deemed appropriate. The remaining two patients should have stopped in the ED as determined by the Pediatric Trauma Quality Management Committee. To ensure direct admissions have an appropriate trauma assessment, communication has been circulated stipulating that the Trauma Service will be consulted on all direct PICU admissions. 8. GCS < 8 at the trauma centre (TC) with mechanical airway intervention.
Did the patient with a first recorded trauma centre GCS < 8 receive a mechanical airway as an intervention in the ACH ED? Exclusions: Patients with GCS > 8 at ACH-ED. Inclusions: n = all patients with first recorded trauma centre GCS ≤ 8.
Indicator Yes No
2018 n = 5 5 0
2017 n = 3 3 0
2016 n = 1 1 0
2015 n = 2 2 0
2014 n = 4 4 0
This past year, as in previous years, all patients that arrived at the ACH ED with a recorded GCS < 8 were appropriately intubated.
6 143
11 11
94 86 97 89 89
2014 2015 2016 2017 2018
%Yes %No
100 100 100 100 100
2014 2015 2016 2017 2018
%Yes %No

ACH Trauma Quality Indicators (ISS>12) 2018
24
9. Presence of ED nursing documentation every one (1) hour.
After arrival at the trauma centre, was every (one) 1 hour documentation present on the ED record for the ED length of stay? Exclusions: Direct admits and unknown/missing ED notes. Inclusions: n = all patients seen in ED.
Indicator Yes No
2018 n = 53 33 20
2017 n = 42 29 13
2016 n = 39 31 8
2015 n = 57 28 29
2014 n = 90 36 54
ED documentation continues to be a challenge and is considered to be important for patient care. There is ongoing education sessions for ED nurses throughout the year to help them become more aware of this necessary standard. 10. Presence of sequential neurological documentation in the ED for suspected head/spinal cord injuries
After arrival at the trauma centre, was sequential neurological documentation present on the ED record for the ED length of stay, if the patient had a diagnosis of skull fracture, intracranial injury, or spinal cord injury? Exclusions: Direct admits and unknown/missing ED notes. Inclusions: n = all patients seen in ED
Indicator Yes No
2018 n = 46 37 9
2017 n = 34 28 6
2016 n = 33 24 9
2015 n = 48 44 4
2014 n = 74 54 20
The Provincial Trauma Nursing Record used in the ED trauma room has one dedicated page for this documentation, however once the patient leaves the trauma room this record is no longer used. A separate neurological documentation record has been added to the ‘trauma pack’ documentation to help improve compliance.
40 49
7969 62
60 5121 31 38
2014 2015 2016 2017 2018
%Yes %No
73 92 73 82 80
278 27 18 20
2014 2015 2016 2017 2018
%Yes %No
ACH Trauma Quality Indicators (ISS>12) 2018
25
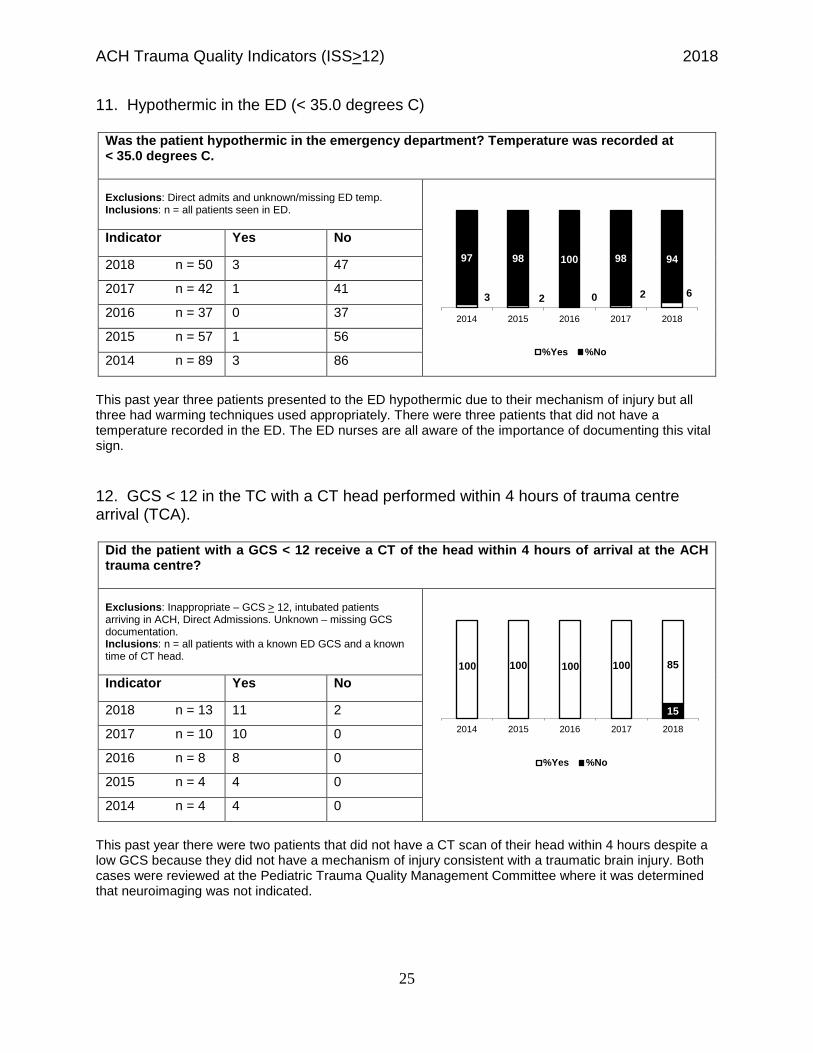
11. Hypothermic in the ED (< 35.0 degrees C)
Was the patient hypothermic in the emergency department? Temperature was recorded at < 35.0 degrees C. Exclusions: Direct admits and unknown/missing ED temp. Inclusions: n = all patients seen in ED.
Indicator Yes No
2018 n = 50 3 47
2017 n = 42 1 41
2016 n = 37 0 37
2015 n = 57 1 56
2014 n = 89 3 86
This past year three patients presented to the ED hypothermic due to their mechanism of injury but all three had warming techniques used appropriately. There were three patients that did not have a temperature recorded in the ED. The ED nurses are all aware of the importance of documenting this vital sign. 12. GCS < 12 in the TC with a CT head performed within 4 hours of trauma centre arrival (TCA).
Did the patient with a GCS < 12 receive a CT of the head within 4 hours of arrival at the ACH trauma centre? Exclusions: Inappropriate – GCS > 12, intubated patients arriving in ACH, Direct Admissions. Unknown – missing GCS documentation. Inclusions: n = all patients with a known ED GCS and a known time of CT head.
Indicator Yes No
2018 n = 13 11 2
2017 n = 10 10 0
2016 n = 8 8 0
2015 n = 4 4 0
2014 n = 4 4 0
This past year there were two patients that did not have a CT scan of their head within 4 hours despite a low GCS because they did not have a mechanism of injury consistent with a traumatic brain injury. Both cases were reviewed at the Pediatric Trauma Quality Management Committee where it was determined that neuroimaging was not indicated.
3 2 0 2 6
97 98 100 98 94
2014 2015 2016 2017 2018
%Yes %No
100 100 100 100
15
85
2014 2015 2016 2017 2018
%Yes %No
ACH Trauma Quality Indicators (ISS>12) 2018
26
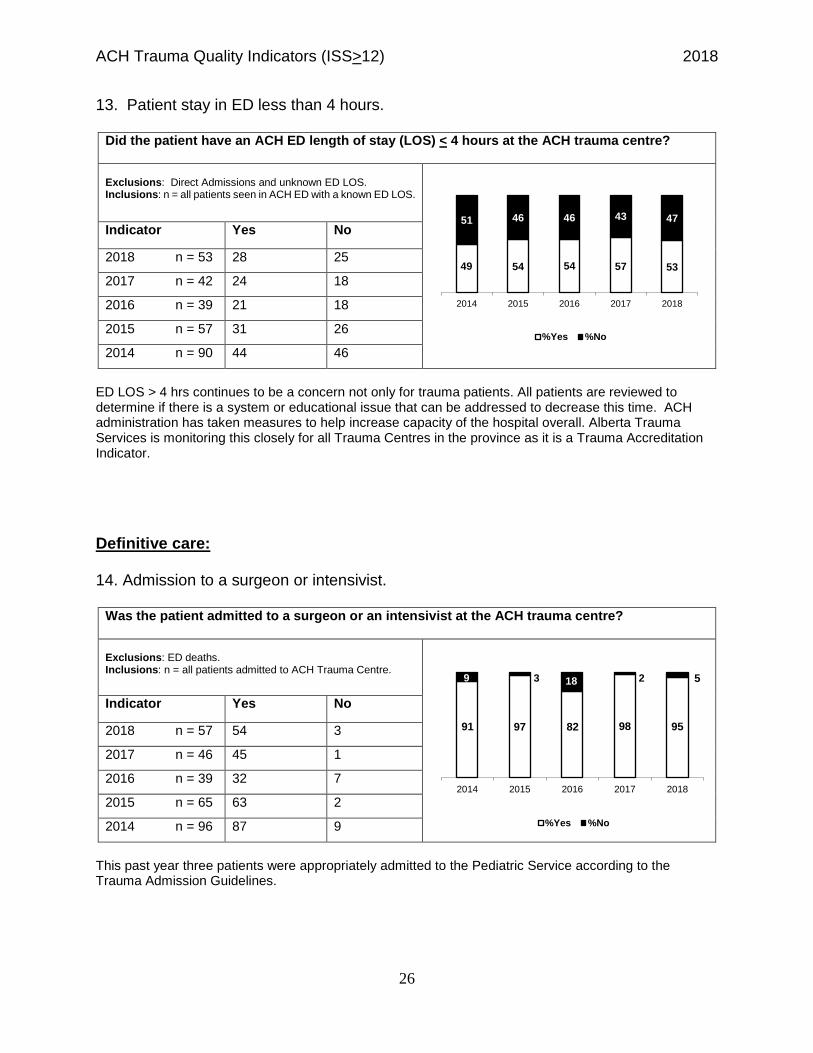
13. Patient stay in ED less than 4 hours.
Did the patient have an ACH ED length of stay (LOS) < 4 hours at the ACH trauma centre? Exclusions: Direct Admissions and unknown ED LOS. Inclusions: n = all patients seen in ACH ED with a known ED LOS.
Indicator Yes No
2018 n = 53 28 25
2017 n = 42 24 18
2016 n = 39 21 18
2015 n = 57 31 26
2014 n = 90 44 46
ED LOS > 4 hrs continues to be a concern not only for trauma patients. All patients are reviewed to determine if there is a system or educational issue that can be addressed to decrease this time. ACH administration has taken measures to help increase capacity of the hospital overall. Alberta Trauma Services is monitoring this closely for all Trauma Centres in the province as it is a Trauma Accreditation Indicator. Definitive care: 14. Admission to a surgeon or intensivist.
Was the patient admitted to a surgeon or an intensivist at the ACH trauma centre? Exclusions: ED deaths. Inclusions: n = all patients admitted to ACH Trauma Centre.
Indicator Yes No
2018 n = 57 54 3
2017 n = 46 45 1
2016 n = 39 32 7
2015 n = 65 63 2
2014 n = 96 87 9
This past year three patients were appropriately admitted to the Pediatric Service according to the Trauma Admission Guidelines.
49 54 54 57 53
51 46 46 43 47
2014 2015 2016 2017 2018
%Yes %No
91 97 82 98 95
9 3 18 2 5
2014 2015 2016 2017 2018
%Yes %No

ACH Trauma Quality Indicators (ISS>12) 2018
27
15. Craniotomy within 4 hours after TCA with unstable epidural/subdural hematoma.
If the patient had an epidural or subdural brain hematoma, was a craniotomy performed within 4 hours of arrival at ACH trauma centre? Exclusions: Inappropriate – all patients without epidural or subdural hematoma. Inclusions: n = all patients with epidural or subdural hematoma where operative management was the planned intervention.
Indicator Yes No
2018 n = 3 3 0
2017 n = 8 8 0
2016 n = 1 1 0
2015 n = 2 2 0
2014 n = 3 3 0
As in previous years all unstable epidural/subdural hematomas were taken quickly to the OR. 16. Missed cervical spine injury after 48 hours from TCA without maintaining spinal precautions.
Did the patient have a missed c-spine injury with spinal precautions removed at the ACH trauma centre? Exclusions: ED deaths. Inclusions: n = all patients admitted to ACH Trauma Centre.
Indicator Yes No
2018 n = 57 0 57
2017 n = 46 0 46
2016 n = 39 0 39
2015 n = 65 0 65
2014 n = 96 0 96
100 100 100 100 100
2014 2015 2016 2017 2018
%Yes %No
100 100 100 100 100
2014 2015 2016 2017 2018
%Yes %No
ACH Trauma Quality Indicators (ISS>12) 2018
28
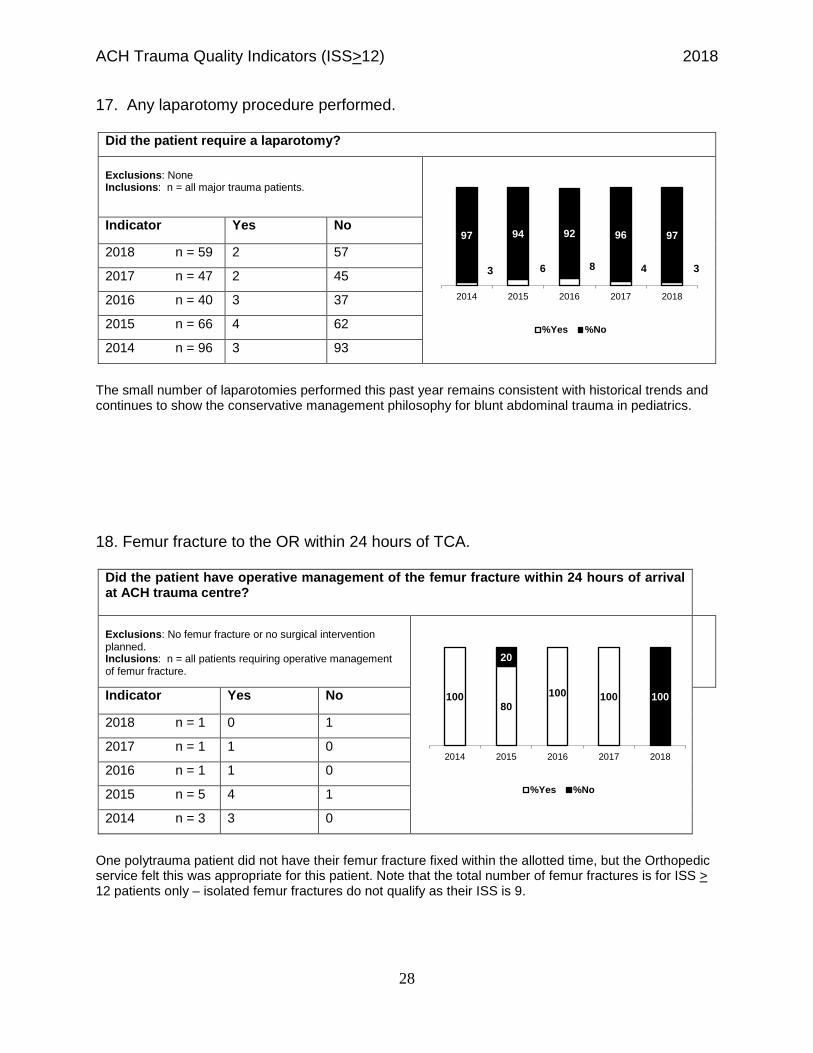
17. Any laparotomy procedure performed.
Did the patient require a laparotomy? Exclusions: None Inclusions: n = all major trauma patients.
Indicator Yes No
2018 n = 59 2 57
2017 n = 47 2 45
2016 n = 40 3 37
2015 n = 66 4 62
2014 n = 96 3 93
The small number of laparotomies performed this past year remains consistent with historical trends and continues to show the conservative management philosophy for blunt abdominal trauma in pediatrics. 18. Femur fracture to the OR within 24 hours of TCA.
Did the patient have operative management of the femur fracture within 24 hours of arrival at ACH trauma centre? Exclusions: No femur fracture or no surgical intervention planned. Inclusions: n = all patients requiring operative management of femur fracture.
Indicator Yes No
2018 n = 1 0 1
2017 n = 1 1 0
2016 n = 1 1 0
2015 n = 5 4 1
2014 n = 3 3 0
One polytrauma patient did not have their femur fracture fixed within the allotted time, but the Orthopedic service felt this was appropriate for this patient. Note that the total number of femur fractures is for ISS > 12 patients only – isolated femur fractures do not qualify as their ISS is 9.
3 6 8 4 3
97 94 92 96 97
2014 2015 2016 2017 2018
%Yes %No
10080
100 100
20
100
2014 2015 2016 2017 2018
%Yes %No

ACH Trauma Quality Indicators (ISS>12) 2018
29
19. Open long bone fracture to the OR after 6-12 hours from TCA (depending on the severity of the fracture).
Did the patient with open long bone fracture have operative management performed within 6 hours (grade 3) or 12 hours (grade 1, 2) of arrival to ACH trauma centre? The long bones include the radius, ulna, humerus, tibia, femur and fibula. Exclusions: No open long bone fractures; patients with open long bone #s but too unstable for operative repair within the timeframe; patients with open long bone #s who died within the timeframe. Inclusions: n = all patients requiring operative management of open fracture where grade of fracture is known.
Indicator Yes No
2018 n = 0 0 0
2017 n = 1 1 0
2016 n = 1 1 0
2015 n = 0 0 0
2014 n = 1 1 0
20. Unplanned return to the OR within 48 hours of initial procedure.
Did the patient have an unplanned return to the operating room at the ACH trauma centre? Exclusions: No operating room visit. Inclusions: n = all patients with at least one operating room visit.
Indicator Yes No
2018 n = 19 2 17
2017 n = 21 2 19
2016 n = 15 1 14
2015 n = 23 0 23
2014 n = 28 1 27
This past year two patients went back to the OR for the same injury. The first case was due to a complex fracture that was not healing properly. The second was taken initially to the Interventional Radiology suite which was unsuccessful to stop the bleeding so a full OR was needed. Both of these cases were deemed appropriate as per the Trauma Quality Management Committee.
100
0
100 100
0
2014 2015 2016 2017 2018
%Yes %No
4 10 11
96 100 100 90 89
2014 2015 2016 2017 2018
%Yes %No

ACH Trauma Quality Indicators (ISS>12) 2018
30
21. Missed injuries identified after 48 hours from TCA.
Did the patient have a delayed diagnosis or missed injury at the ACH trauma centre? Exclusions: ED deaths. Inclusions: n = all patients admitted to ACH Trauma Centre.
Indicator Yes No
2018 n = 57 1 56
2017 n = 46 2 44
2016 n = 39 1 38
2015 n = 65 1 64
2014 n = 96 2 94
A trauma tertiary survey (TTS) performed by the Trauma Surgery NP, Fellow or Resident at 24 hours of admission to the trauma centre helps to keep missed injuries to a minimum. However, in the past year there was a multiple injured patient that was found to have a finger fracture many days after admission; this was discussed at the Trauma Quality Management Committee. 22. Reduction of joint dislocation/fracture dislocation after 1 hour from TCA.
If the patient had a joint dislocation or fracture dislocation (hip, shoulder, knee, elbow), was it reduced within first hour of TCA. Exclusions: No joint dislocation, died within first hour, wrist or ankle dislocations. Inclusions: n = all patients with joint dislocation or fracture dislocation who survived at least 1 hour.
Indicator Yes No
2018 n = 0 0 0
2017 n = 0 0 0
2016 n = 0 0 0
2015 n = 1 1 0
2014 n = 1 1 0
2 2 3 4 2
98 98 97 96 98
2014 2015 2016 2017 2018
%Yes %No
100 100
0 0 0
2014 2015 2016 2017 2018
%Yes %No

ACH Trauma Quality Indicators (ISS>12) 2018
31
23. Revascularization of an ischemic limb within 6 hours from the time of injury.
If the patient had an ischemic limb, was it re-vascularized within 6 hours from the time of injury? Exclusions: No ischemic limb or patient died prior to repair. Inclusions: n = all patients with ischemic limb.
Indicator Yes No
2018 n = 0 0 0
2017 n = 0 0 0
2016 n = 0 0 0
2015 n = 0 0 0
2014 n = 0 0 0
24. ORIF of facial fractures within 7 days of injury.
Did the patient with a facial fracture go to the operating room at ACH trauma centre within 7 days of injury? Exclusions: No major facial fractures or died prior to repair. Inclusions: n = all patients requiring operative management of major facial fractures who survive at least 7 days.
Indicator Yes No
2018 n = 1 1 0
2017 n = 1 1 0
2016 n = 0 0 0
2015 n = 1 1 0
2014 n = 3 3 0
0 0 0 0 0
2014 2015 2016 2017 2018
%Yes %No
100 100
0
100 100
2014 2015 2016 2017 2018
%Yes %No
1

ACH Trauma Quality Indicators (ISS>12) 2018
32
25. Operative repair of spinal fractures within 7 days of injury.
If the patient had an operative repair of spinal fractures, was it completed within 7 days of injury? Exclusions: No operative repairs or patient died prior to repair. Inclusions: n = all patients with operative repair of spinal fracture who survive at least 7 days.
100
00
100100
2014 2015 2016 2017 2018
%Yes %No
Indicator Yes No
2018 n = 1 1 0
2017 n = 0 0 0
2016 n = 0 0 0 2015 n = 4 4 0
2014 n = 1 1 0
26. Pelvic ring fracture / acetabular fracture (with hemodynamic instability) provisional stabilization > 6 hours of TCA.
If the patient had an operative repair of pelvic fractures, was it completed > 6 hours after arrival? Exclusions: No operative repairs or patient hemodynamically stable. Inclusions: n = all patients with operative repair of pelvic fractures with hemodynamic instability.
0100000
2014 2015 2016 2017 2018
%Yes %No
Indicator Yes No
2018 n = 0 0 0
2017 n = 1 0 1
2016 n = 0 0 0
2015 n = 0 0 0
2014 n = 0 0 0
ACH Trauma Quality Indicators (ISS>12) 2018
33
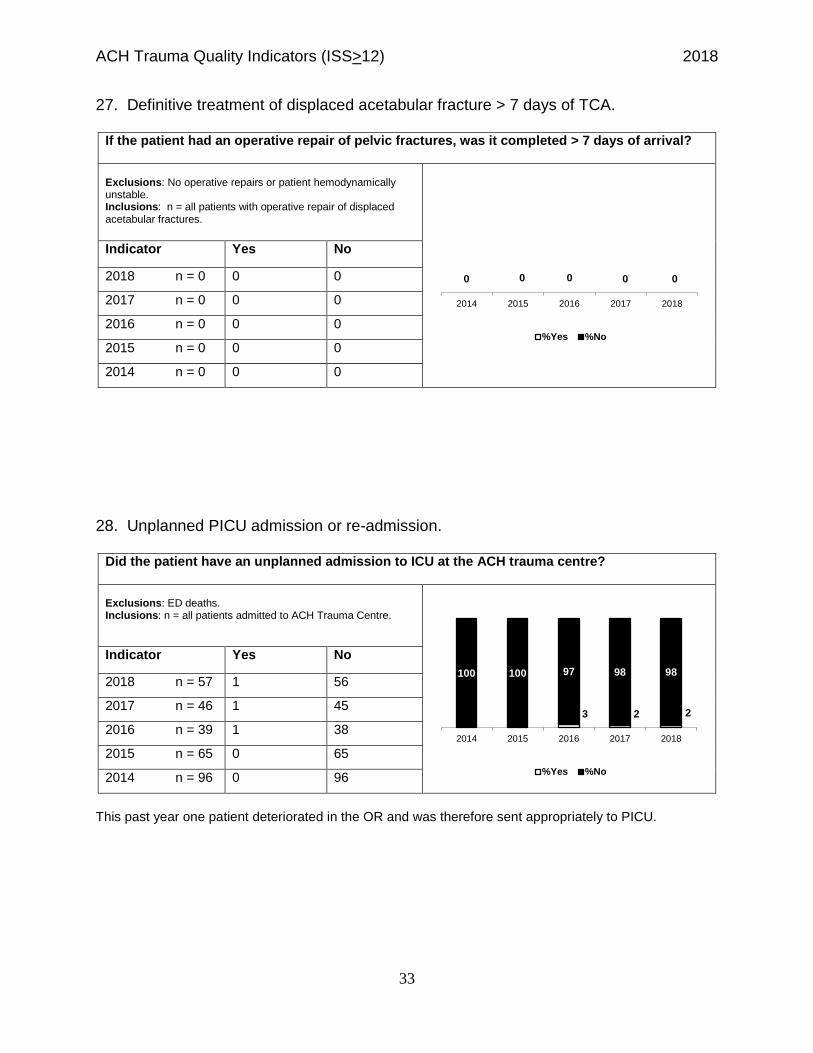
27. Definitive treatment of displaced acetabular fracture > 7 days of TCA.
If the patient had an operative repair of pelvic fractures, was it completed > 7 days of arrival? Exclusions: No operative repairs or patient hemodynamically unstable. Inclusions: n = all patients with operative repair of displaced acetabular fractures.
Indicator Yes No
2018 n = 0 0 0
2017 n = 0 0 0
2016 n = 0 0 0
2015 n = 0 0 0
2014 n = 0 0 0
28. Unplanned PICU admission or re-admission.
Did the patient have an unplanned admission to ICU at the ACH trauma centre? Exclusions: ED deaths. Inclusions: n = all patients admitted to ACH Trauma Centre.
Indicator Yes No
2018 n = 57 1 56
2017 n = 46 1 45
2016 n = 39 1 38
2015 n = 65 0 65
2014 n = 96 0 96
This past year one patient deteriorated in the OR and was therefore sent appropriately to PICU.
0 0 00 0
2014 2015 2016 2017 2018
%Yes %No
3 2 2
100 100 97 98 98
2014 2015 2016 2017 2018
%Yes %No

ACH Trauma Quality Indicators (ISS>12) 2018
34
Did the patient have an unplanned readmission to ICU at the ACH trauma centre? Exclusions: Patients without admission to ICU. Inclusions: n = all patients with at least one ICU admission.
Indicator Yes No
2018 n = 26 0 26
2017 n = 23 1 22
2016 n = 16 0 16
2015 n = 28 1 26
2014 n = 33 0 33
The PICU Specialized Transitional Educational Personnel (STEP) team follows patients that are transferred out of the PICU to ensure safety. Outcome: 29. Death during the first 24 hours of TCA.
Did the patient die within the first 24 hours of admission to the ACH trauma centre? Exclusions: All patients who survived. Inclusions: n = all patients who died.
Indicator Yes No
2018 n = 13 5 8
2017 n = 4 1 3
2016 n = 3 1 2
2015 n = 9 6 3
2014 n = 6 1 5
Sadly this past year we had 13 trauma related deaths which is significantly more than previous years. Of those that died within 24 hours of arrival, two patients died in the ED; one after a submersion injury and one after being struck by a vehicle. Three within 24 hours in the PICU; one from sports injury resulting in massive head and chest injuries, one from submersion injury and one after being struck by a vehicle. An additional 8 patients died in the PICU after 24 hours; four from non-accidental trauma causing catastrophic head injuries, four post hanging mechanism.
4 4
100 96 100 96 100
2014 2015 2016 2017 2018
%Yes %No
17
6733 25 38
83
3367 75 62
2014 2015 2016 2017 2018
%Yes %No

ACH Trauma Quality Indicators (ISS>12) 2018
35
30. Did the patient die in ACH?
Did the patient die? Exclusions: None. Inclusions: n = all trauma patients arriving at ACH trauma centre.
Indicator Yes No
2018 n = 59 13 46
2017 n = 47 4 43
2016 n = 40 3 37
2015 n = 66 9 57
2014 n = 96 6 90
This number of deaths (22%) is more than in the past 5 years; all death cases were reviewed by the Trauma Quality Management Committee and care was deemed appropriate.
6 14 8 9 22
94 86 92 91 78
2014 2015 2016 2017 2018
%Yes %No

ACH Major Trauma Statistics (ISS>12) 2018
36
APPENDIX B Major Trauma Statistics for 2018
1. General Overview Age Gender
2. Etiology of Injuries Mechanism of Injury Type of Injury Place of Injury
3. Referrals and Emergency Management Referrals from Health Regions Mode of Transportation to ACH Ground vs Air Transport ED Arrival By Month, Day and Time of Arrival Diagnostic Imaging Statistics Day of Week and Time of CT Non-Operative Procedures Performed in ED Patient Disposition from ED
4. In-Patient Care Management and Outcomes Surgical Procedures OR Data by Service Time to OR Length of Stay Admitting Physician Service Hospital Discharge Destination Trauma Readmissions Outcomes by Age and ISS TRISS Pre-Charts

ACH Major Trauma Statistics (ISS>12) 2018
37
1. General Overview Table 1. ACH Major Trauma Statistics – Five-year Trend Analysis Data Source: Alberta Trauma Registry at ACH
2014 2015 2016 2017 2018 Total Patients
96 66 40 47 59
Males
59 61.4%
31 47.0%
30 75.0%
36 76.6%
37 62.7%
Females
37 38.5%
35 53.0%
10 25.0%
11 23.4%
22 37.3%
Total Length of Stay (LOS) (days)
827 1078 387 516 706
Median LOS
5 5 5 4 4
Mean LOS
9 16 10 11 12
Total Emergency Department (ED) LOS (hours)
390.5 234.8 160.1 134.1 229.4
Median ED LOS (hours)
4.0 3.5 3.5 3.0 3.3
Mean ED LOS (hours)
4.3 4.1 4.0 3.1 4.1
ICU Admissions
33 34.3%
28 42.4%
16 40.0%
23 48.9%
26 44.1%
Median ICU LOS (days)
2 3 5 4 3
Mean ICU LOS (days)
4 6 7 5 4
Total ICU LOS (days)
143 179 109 118 103
Median ISS
18 21 17 21 21
Mean ISS
22 23 21 22 23
Direct Admits
6 9 1 5 6
Referrals to ACH from other centres
38 39.6%
34 51.5%
16 40.0%
22 46.8%
23 39.0%
Deaths 6 6.3%
9 13.6%
3 7.5%
4 8.5%
13 22.0%
The most striking statistic in this table is the 13 deaths in 2018 which accounts for 22% of our trauma patients with an ISS > 12. This is double the rate seen in the last five years and appears to be due in part to a rise in lethal self-inflicted injuries. We certainly hope this year was an anomaly and does not represent a new trend. In 2018, 59 major trauma patients (meeting criteria for inclusion in the trauma registry) were seen at the ACH. This volume is lower than the five-year average of 62 major trauma patients seen annually. This decrease was noticed in 2015 and was felt to be due to upgrading to the AIS 2005 coding system on

ACH Major Trauma Statistics (ISS>12) 2018
38
January 1, 2015 in order to prepare for submission to the National Trauma Data Bank based in the US in the near future. We would like to also speculate that pediatric trauma numbers are lower in Southern Alberta due to Injury Prevention awareness campaigns.
This 2018 trauma volume represents 8.0% of all patients admitted to the ACH with injuries (n=723), which is a 1.3% increase from last year.
The percentage of major trauma patients who are males (62.7%) were greater than females (37.3%).
Total LOS for major trauma patients ranged between 1 and 285 days. Median LOS of 4 days is consistent with the five-year trend of 5. Mean LOS of 12 days is equal to the five-year trend of 12.
The total ED LOS was 229.4 hours, and consistent with the five-year average of 229.8 hours. The median LOS of 3.3 is consistent with the five-year average of 3.5. The mean LOS of 4.1 is slightly higher than the five-year average of 3.9.
44.1% of major trauma patients were admitted to the ICU, which is higher than the five-year average of 41.9%. Total ICU LOS was 103 days, which is lower than the five-year average of 130. The median (3) is lower than the five-year average of 3.4 and the mean ICU LOS (4) is lower than the five-year average of 5.
The median ISS (21) for major trauma patients in 2018 was higher than the five-year average of 19.6. The mean ISS (23) was consistent with the five-year average of 22.2.
Major trauma patients referred in from other centers represented 39.0% of the major trauma volume for 2018. This is lower than the five-year average of 43.4%.
A total of 13 deaths were seen in major trauma patients in 2018. This represents 22.0% of major trauma volume, which is significantly higher than the five-year average of 11.6%.

ACH Major Trauma Statistics (ISS>12) 2018
39
Figure 1. Age and Gender Distribution for ACH Major Trauma Patients for 2018
Figure 1 shows the number of males and females for the above age groups. In 2018 the majority of trauma patients were male. On average males comprised 65% of the major trauma population over a period of five years. Figure 2a. Age Distribution of <15 year olds admitted to Calgary Adult Hospitals
This past year there was a pediatric submersion death at the South Health Campus Emergency Department.
4
6
14
9
44
7
2
9
00
2
4
6
8
10
12
14
16
<1 1 to 4 5 to 9 10 to 14 >14
# of
Pat
ient
s
Age Groups
Male Female
2015 2016 2017 2018FMC 0 1 0 0PLC 0 0 0 0RGH 0 0 0 0SHC 1 0 0 1
0
1
2
3
4
5
# of
Pat
ient
s
<15 year old Major Trauma Patients

ACH Major Trauma Statistics (ISS>12) 2018
40
Figure 2b. Age Distribution of 15 to 17 year olds admitted to Calgary Hospitals
Figure 2b shows the number of major trauma patients aged 15-17 admitted to Calgary Hospitals over the past five years. Current Alberta Health Services guidelines state that major trauma patients 15-17 years of age should be transported to and treated at the Foothills Medical Centre (FMC). However, if a patient in this age group arrives at ACH they will be treated.
2014 2015 2016 2017 2018ACH 8 8 6 7 4FMC 24 43 29 13 12PLC 0 0 0 0 0RGH 0 0 0 0 0SHC 0 0 0 0 0
05
101520253035404550
# of
Pat
ient
s15 to 17 year old Major Trauma Patients

ACH Major Trauma Statistics (ISS>12) 2018
41
2. Etiology of Injuries
Mechanism of Injury (MOI) describes the nature of the injury; transportation, falls, violence, and other mechanisms of injury. Figure 3. Breakdown by Mechanism of Injury
. Figure 3 shows the breakdown of the mechanism of injuries for the incidents in 2018 as compared to the historical trend. The biggest change this past year was an increase in violence related injuries and a decrease in the other injuries category.
Transport41%
Falls27%
Violence6%
Other26%
2007/2008 - 2011/2012
Transport42%
Falls24%
Violence20%
Other 14%
2018
Transport37%
Falls27%
Violence13%
Other23%
2014 - 2017

ACH Major Trauma Statistics (ISS>12) 2018
42
Mechanism of Injury – Transportation Figure 4. Transportation Statistics
Figure 4 shows the breakdown of transportation-related injuries in 2018 as compared to the historical trend. There was a significant increase in motorized recreational vehicle (MRV) and cyclist mechanisms with a decrease in motor vehicle collision (MVC) this past year. A total of 25 patients (42% of major trauma patients) were involved in transportation-related incidents in 2018.
Mortality: 8% 2 patients died. ISS ranged from 14 to 41. Mean ISS was 22 and median ISS was 21.
Figure 5. Five-Year Trend for Transportation as the MOI
Figure 5 shows an 8% increase in transportation-related incidents from 2017.
29%
50%43%
34%42%
0%10%20%30%40%50%60%
2014 2015 2016 2017 2018
% o
f Pat
ient
s
Years
MOI -Transportation
MVC16%
Pedestrian28%Cyclist
32%
MRV 24%
2018
MVC32%
Pedestrian26%
Cyclist24%
MRV17%
Railway1%
2014 - 2017

ACH Major Trauma Statistics (ISS>12) 2018
43
Figure 6. Transportation by Age Group
Figure 6 shows the breakdown of transportation incidents by age groups in 2018 as compared to the historical trend. No patients <1 year old were seen in this category.
In 2018: Age Group <1 (n=0, 0%) no patients in this age group. Age Group 1-4 (n=2 8%) included 1 passenger and 1 pedestrian. There was one death in this age
category. Age Group 5-9 (n=12 48%) included 2 passengers, 4 pedestrians, 4 cyclists, 1 ATV related injury and
1 non-motorized scooter injury. There was one death in this age category. Age Group 10-14 (n=10, 40%) 1 passenger, 4 ATV related injuries, 3 cyclists and 2 pedestrians. Age Group > 14 (n=1 4%) included 1 cyclist.
1 to 48%
5 to 948%
10 to 14
40%
>144%
2018
<12%
1 to 49%
5 to 931%
10 to 14
48%
>1410%
2014 - 2017

ACH Major Trauma Statistics (ISS>12) 2018
44
Mechanism of Injury – Falls Figure 7. Statistics for Falls as the MOI Figure 7 shows the breakdown of fall incidents in 2018 as compared to the historical trend. There has been a 17% increase in multi-level falls.
A total of 14 patients (24% of major trauma patients) were admitted for fall-related injuries.
Mortality: 0% all patients survived. ISS ranged from 13 to 43. Mean ISS was 21 and the median ISS was 17.
Figure 8. Five-Year Trend for Falls as the MOI
Figure 8 shows the comparison of falls as the mechanism of injury over the past five years. In 2018 there was a 5% increase from 2017 which is consistent with the five year average of 24%.
35%
18%23%
19%24%
0%5%
10%15%20%25%30%35%40%
2014 2015 2016 2017 2018
% o
f Pat
ient
s
Years
MOI Falls
Multi-Level93%
Same-Level7%
2018
Multi-Level76%
Same-Level24%
2014 - 2017
ACH Major Trauma Statistics (ISS>12) 2018
45
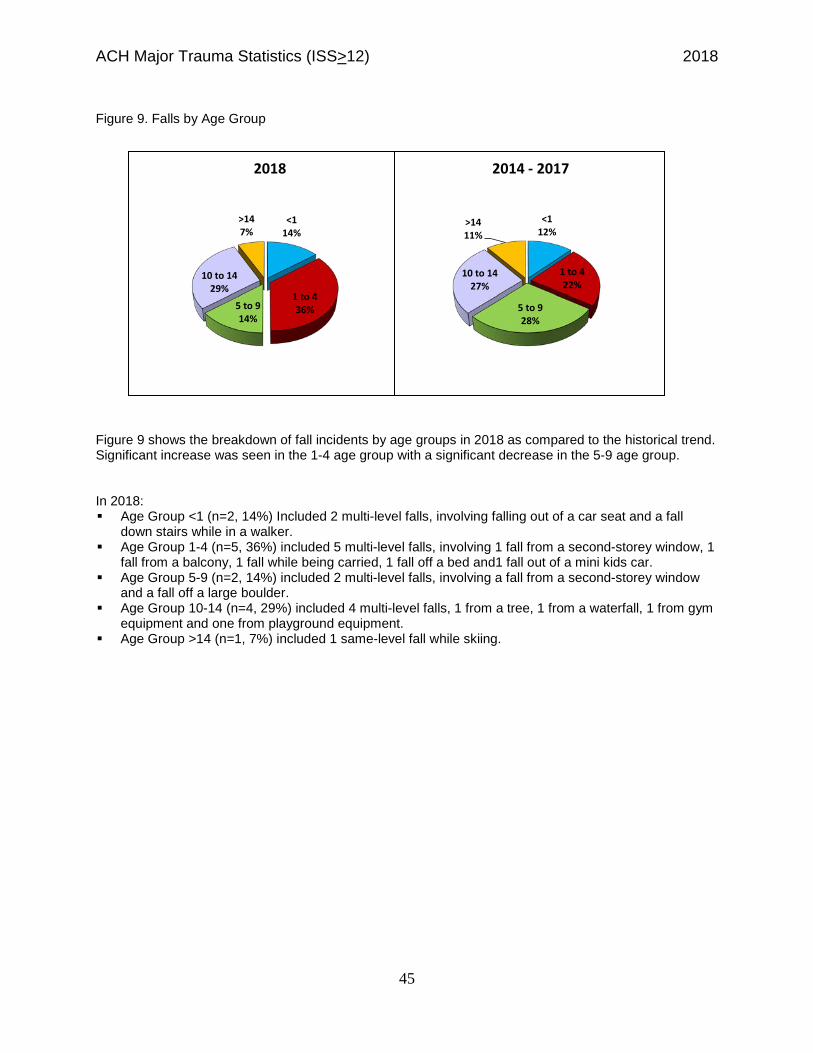
Figure 9. Falls by Age Group
Figure 9 shows the breakdown of fall incidents by age groups in 2018 as compared to the historical trend. Significant increase was seen in the 1-4 age group with a significant decrease in the 5-9 age group.
In 2018: Age Group <1 (n=2, 14%) Included 2 multi-level falls, involving falling out of a car seat and a fall
down stairs while in a walker. Age Group 1-4 (n=5, 36%) included 5 multi-level falls, involving 1 fall from a second-storey window, 1
fall from a balcony, 1 fall while being carried, 1 fall off a bed and1 fall out of a mini kids car. Age Group 5-9 (n=2, 14%) included 2 multi-level falls, involving a fall from a second-storey window
and a fall off a large boulder. Age Group 10-14 (n=4, 29%) included 4 multi-level falls, 1 from a tree, 1 from a waterfall, 1 from gym
equipment and one from playground equipment. Age Group >14 (n=1, 7%) included 1 same-level fall while skiing.
<114%
1 to 436%5 to 9
14%
10 to 1429%
>147%
2018
<112%
1 to 422%
5 to 928%
10 to 1427%
>1411%
2014 - 2017

ACH Major Trauma Statistics (ISS>12) 2018
46
Mechanism of Injury – Violence Figure 10. Violence as the MOI Figure 10 shows the breakdown of violence-related incidents in 2018 as compared to the historical trend. Note that the rate of self-inflicted injuries has nearly tripled and sadly the mortality from such events is very high. The rates of assault have also increased dramatically.
A total of 12 patients (20% of major trauma patients) were admitted for violence-related injuries.
Mortality: 58% 7 patients died. ISS ranged from 13 to 30. For survivors, the mean ISS was 24 and the median ISS was 25. For non-survivors, the mean ISS was 25 and median ISS was 26.
Figure 11. Five-Year Trend for Violence as the MOI
Figure 11 shows a 3% increase in violence related injuries in the past year, which is above the five year average of 15%.
15%11% 10%
17%20%
0%
5%
10%
15%
20%
25%
2014 2015 2016 2017 2018
% o
f Pat
ient
s
Years
MOI - Violence
Unarmed assault
34%
Self-inflicted
33%
Other & Unspecified
33%
2018
Unarmed assault
9%
Self-Inflicted
12%
Other & Unspecified
67%
Assault with
Object12%
2014 - 2017

ACH Major Trauma Statistics (ISS>12) 2018
47
Figure 12. Violence Incidents by Age Group
Figure 12 shows the breakdown of violence incidents by age groups in 2018 as compared to the historical trend. There was a large increase in the 10-14 age category, with a significant decrease in 1-4 age groups. Note there were no 5-9 age in this mechanism.
Age Group <1 (n=5, 41%) 5 non-accidental trauma or intentional injury in this age category. There
were 3 deaths in this age category. Age Group 1-4 (n=2, 17%) 2 non-accidental trauma. There was 1 death in this age category. Age Group 5-9 (n=0, 0%) No patients in this age category. Age Group 10-14 (n=3, 25%) 3 self-inflicted injuries. There were 2 deaths in this age category. Age Group >14 (n=2, 17%) 1 unarmed assault and 1 self-inflicted injury. There was 1 death in this
age category.
<141%
1 to 417%
10 to 1425%
>1417%
2018
<137%
1 to 430%
5 to 96%
10 to 1412%
>1415%
2014 - 2017

ACH Major Trauma Statistics (ISS>12) 2018
48
Mechanism of Injury – Other Figure 13. Statistics for Other Mechanism of Injury
Figure 13 shows the breakdown of other mechanism of injuries in 2018 as compared to the historical trend. Note the large increase in submersion & drowning mechanism as well as the other & unspecified. Mechanical (striking or being struck by another object) has decreased. There were no fire & explosion or inhalation & ingestion injuries this year. A total of 8 patients (14% of major trauma patients) were admitted for other mechanism of injuries.
Mortality: 50% 4 patients died. ISS ranged from 17 to 50. For survivors, the mean and median ISS were 22. For non-survivors, the mean ISS was 25 and median ISS was 26.
Figure 14. Five-Year Trend for Other Mechanism of Injury
Figure 14 shows an 8% decrease in the number of patients whose injuries are caused by animal, burn, inhalation, submersion injury, and mechanical-related incidents when compared to the five year average of 22%.
21% 21%25%
30%
14%
0%
10%
20%
30%
40%
2014 2015 2016 2017 2018
% o
f Pat
ient
s
Years
MOI - Other
Animal 25%
Mechanical37%
Submersion & Drowning
25%
Other & Unspecified
13%
2018
Animal 23%
Mechanical54%
Submersion & Drowning
11%
Inhalation & Ingestion
4%
Fire & Explosion
4%
Other & Unspecified
4%
2014 - 2017

ACH Major Trauma Statistics (ISS>12) 2018
49
Figure 15. Other Mechanism by Age Group
Figure 15 shows the breakdown of incidents involving other mechanism of injury by age groups in 2018 as compared to the historical trend. There was a large increase in both the <1 and 1-4 age categories and there were no patients in the >14 age category this year. In 2018: Age Group <1 (n=1, 13%) included 1 animal-related injury. Age Group 1-4 (n=4, 50%) included 1 penetrating neck injury, 1 accidental strangulation injury, 1
animal-related injury and 1 drowning. There were 2 deaths in this age category. Age Group 5-9 (n=2, 25%) included 1 drowning and 1 struck by objects in sports injury. There was 1
death in this age category. Age Group 10-14 (n=1, 13%) included 1 striking object when skiing which resulted in death. Age Group >14 (n=0, 0%) no patients in this age category.
<112%
1 to 450%
5 to 925%
10 to 1413%
2018
<12%
1 to 429%
5 to 930%
10 to 1425%
>1414%
2014 - 2017

ACH Major Trauma Statistics (ISS>12) 2018
50
Type of Injury
Type of Injury indicates whether the most serious injury is blunt, penetrating, burn, or other type of injury (submersions and drownings). Figure 16. Type of Injury
Figure 16 shows the different types of injuries sustained by the major trauma patients in 2018. Blunt injuries comprised 88% of major trauma population. Note that submersion is reported as ‘other’. Figure 17. Five-Year Trend for Type of Injury
Figure 17 compares the different types of injuries from 2014 up to 2018.
52
4 0 30
50
100
Blunt Penetrating Burn Other
Type of Injury - 2018Total Pts = 59
Blunt Penetrating Burn Other
88
62
35 3952
3 1 3 5 42 0 1 0 03 3 1 3 30
20
40
60
80
100
2014 2015 2016 2017 2018
# o
Patie
nts
Fiscal Years
Type of Injury - Five Year TrendTotal Pts = 308
Blunt Penetrating Burn Other

ACH Major Trauma Statistics (ISS>12) 2018
51
Figure 17b. Penetrating Trauma All ISS
On April 1, 2012 all 10 AHS Trauma Centers began capturing data on all penetrating traumas regardless of ISS in the Alberta Trauma Registry. In 2018 there were 18 penetrating traumas, which is significantly higher than the five year average of 11. All these cases are either admitted more than 24 hours and/or go to the OR for repair. Severe dog bites made up the majority of these cases. Place of Injury Figure 18. Statistics for Place of Injury
Figure 18 shows where the patients were injured in 2018 as compared to the historical trend.
74 4
2118
0
10
20
30
40
50
2014 2015 2016 2017 2018
# of
Pat
ient
s
Fiscal Years
Penetrating Trauma All ISS
Home/Res Inst36%
Other7%
Public Building
3%Recreation
14%
Street34%
Unspecified6%
2018
Farm1%
Home/Res Inst33%
Other10%
Public Building
4%
Recreation13%
Street30%
Unspecified9%
2014 - 2017

ACH Major Trauma Statistics (ISS>12) 2018
52
3. Referrals and Emergency Management Referral Patterns Out of 308 major trauma patients from 2014 to 2018, a total of 133 patients (43%) were referred to ACH by other hospitals. The highest number of out of region referrals to ACH was made by Lethbridge Regional Hospital with a total of 15 patients (11% of total referrals) and Medicine Hat Regional Hospital with a total of 14 patients (10% of total referrals) over five years. Red Deer and South Health Campus also continue to be major referral centres.
Note that the province of Alberta no longer has specified health regions. All are now classified as Alberta Health Services, however the below transfer summary continues to report in the regions for historic consistency. Table 2. Transfers from Other Centres by Health Region
Region Hospital 2014 2015 2016 2017 2018 Total Region 1 - Chinook Health Region, Total = 27 Cardston – Municipal 1 1 2 Fort Macleod H.C.C. 1 3 1 5 Lethbridge Regional 5 4 4 2 15 Pincher Creek Municipal 1 1 2 Taber H.C.C. 1 1 1 3 Region 2 - Palliser Health Region, Total = 18 Brooks Health Centre 1 1 1 1 4 Medicine Hat Regional 5 1 2 4 2 14 Region 3 - Calgary Health Region, Total = 47 Banff - Mineral Springs 3 1 4 Black Diamond – Oilfields General 1 1 2 Calgary – Foothills 1 2 2 5 Calgary – General/Peter Lougheed 2 3 1 1 1 8 Calgary – Rockyview General 4 1 4 9 Calgary – South Health Campus 1 3 2 1 3 10 Calgary – Sheldon M. Chumir Centre 1 1 Calgary - South Calgary Health Centre 1 1 2 Canmore General 1 2 3 Claresholm General 1 1 Cochrane Urgent Care 1 1 High River General 1 1

ACH Major Trauma Statistics (ISS>12) 2018
53
Region 4 - David Thompson Health Region, Total = 27 Didsbury – Mountain View H.C. 1 1 2 Drumheller Regional 1 1 2 Hanna H.C.C. 1 1 Olds General 1 1 Red Deer Regional 6 2 1 1 3 13 Rocky Mountain House 1 2 3 Stettler General 1 1 2 Three Hills H.C.C. 1 1 1 3 British Columbia, Total = 14 Cranbrook Regional Hospital 5 1 2 8 Fernie District Hospital 1 1 2 Golden & District General Hospital 1 1 Invermere District Hospital 1 1 2 Penticton Regional Hospital 1 1

ACH Major Trauma Statistics (ISS>12) 2018
54
Mode of Transport for Patients Arriving at ACH Figure 19. Direct from the Scene
Figure 19 shows the patients arriving at ACH ED directly from the scene in 2018 as compared to the historical trend. Note the decrease in ground transports and increase in private vehicle/walk-ins for direct from the scene patients.
Figure 20. Referrals
Figure 20 shows the patients who were referred to ACH for further treatment in 2018 as compared to the historical trend. Note the significant increase in ground transports and decrease in fixed-wing transports. The appropriateness of the means of transport is part of the review process for each major trauma patient.
Ground 53%
Helicopter19%
Private Vehicle/Walk-in
28%
2018
Ground 61%Helicopter
16%
Private Vehicle/Walk-in
23%
2014 - 2017
Ground74%
Helicopter17%
Fixed-wing9%
2018
Ground 60%
Helicopter21%
Private Vehicle/Walk-in
1%
Fixed-wing18%
2014 - 2017
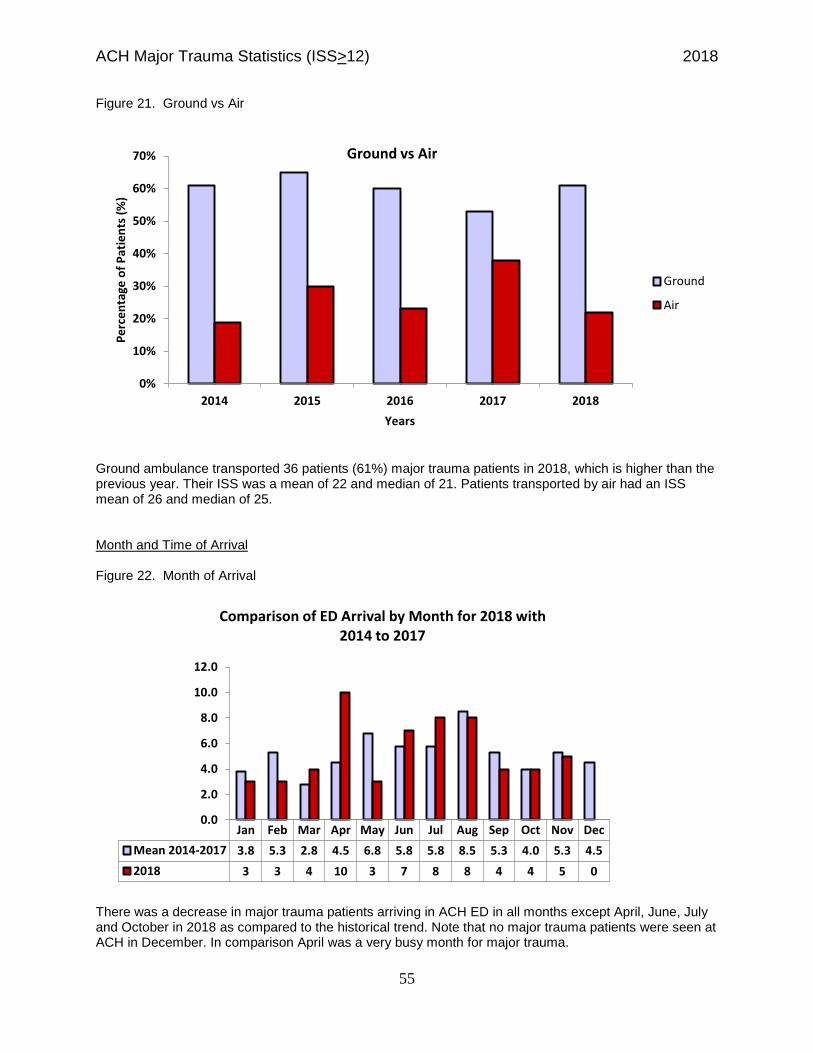
ACH Major Trauma Statistics (ISS>12) 2018
55
Figure 21. Ground vs Air
Ground ambulance transported 36 patients (61%) major trauma patients in 2018, which is higher than the previous year. Their ISS was a mean of 22 and median of 21. Patients transported by air had an ISS mean of 26 and median of 25. Month and Time of Arrival Figure 22. Month of Arrival
There was a decrease in major trauma patients arriving in ACH ED in all months except April, June, July and October in 2018 as compared to the historical trend. Note that no major trauma patients were seen at ACH in December. In comparison April was a very busy month for major trauma.
0%
10%
20%
30%
40%
50%
60%
70%
2014 2015 2016 2017 2018
Perc
enta
ge o
f Pat
ient
s (%
)
Years
Ground vs Air
Ground
Air
Jan Feb Mar Apr May Jun Jul Aug Sep Oct Nov DecMean 2014-2017 3.8 5.3 2.8 4.5 6.8 5.8 5.8 8.5 5.3 4.0 5.3 4.52018 3 3 4 10 3 7 8 8 4 4 5 0
0.0
2.0
4.0
6.0
8.0
10.0
12.0
Comparison of ED Arrival by Month for 2018 with 2014 to 2017

ACH Major Trauma Statistics (ISS>12) 2018
56
Figure 23. Day of Arrival
In 2018, there was a decrease in major trauma patients arriving in ACH ED all days except Wednesday, Friday and Saturday, when compared to previous years. Saturday was the busiest day of the week in 2018. Time of Arrival Figure 24. Time of Arrival
Figure 24 shows and increase in the 00:01-08:00 category in 2018. The majority of patients still arrive between 16:01-24:00.
Sun Mon Tues Wed Thu Fri SatMean 2014 - 2017 13.0 8.8 5.5 8.8 8.8 8.0 9.32018 9 5 8 9 8 9 11
0.02.04.06.08.0
10.012.014.016.018.0
Comparison of Arrival by Day for 2018 with 2014 - 2017
00:01-08:00 08:01-16:00 16:01-24:00Mean 2014-2017 7.8 18.8 35.82018 10 15 34
0.05.0
10.015.020.025.030.035.040.0
Comparison of Time of Arrival for 2018 with 2014 - 2017

ACH Major Trauma Statistics (ISS>12) 2018
57
Figure 25. Time of Arrival of Patients Arriving Directly from the Scene
Figure 25 shows the patients that arrive at ACH directly (without going to another medical facility). The majority arrived between 16:01-24:00 which is consistent with the historical trend.
Diagnostic Imaging Performed in 2018 Table 3. Diagnostic Imaging A total of 34 patients (58% of major trauma patients) went urgently (within 6 hours of arrival) to CT for imaging of the following body locations. This is lower than the 5 year average of 67% for urgent CT’s for major trauma patients.
Diagnostic Imaging CT Locations
# Patients Percent of Total Patients (n=36)
Percent of Positive Results
Head 25 69% 92% Abdomen 21 58% 81% Pelvis 21 58% 81% Spine 18 50% 44% Chest 7 19% 86% Face 5 14% 80%
Note: Some patients had CT’s done on multiple body locations and often the spine is retrospective so not a specified image. Note the percentage of positive results of the various body parts. Also note some patients had CT’s done at referral centres prior to coming to ACH.
00:01-08:00 08:01-16:00 16:01-24:00Mean 2014-2017 1.8 13.5 19.52018 3 13 20
0.0
5.0
10.0
15.0
20.0
25.0
Comparison of Patients Arriving Directly From the Scene for 2018 with 2014 -2017

ACH Major Trauma Statistics (ISS>12) 2018
58
Figure 26. Time of Day of Urgent CT
Figure 26 compares the time of urgent CT’s from 2014 to 2018. Note the consistency that the majority of urgent CT’s are performed between 16:01-24:00 which is when the majority of major trauma patients arrive at the ACH ED. In 2018, 71% (n=24) of patients had CT’s done from 16:01 to midnight. Only 12% of patients had CT’s from midnight to 8:00 AM and 18% of patients had CT’s from 08:01 to 16:00.
Figure 27. Day of the Week CT performed
Figure 27 compares the day of the week CT was performed from 2014 to 2018. In 2018 there is an increase in the CT’s performed on all days except Mondays, Wednesdays and Thursdays when compared to 2017.
5
20
39
6
16
26
3 2
26
38
19
4 6
24
0
10
20
30
40
50
00:01-08:00 08:01-16:00 16:01-24:00
# of
Pat
ient
s
Time of Day
Time of Day of Urgent CT (within 6 hours of arrival, n=34)
2014 2015 2016 2017 2018
11
4
14
4
8
17
68
34
11
65
11
23 3
7
32
11
6
2
54
2
65
2
5 54
5
87
02468
1012141618
Monday Tuesday Wednesday Thursday Friday Saturday Sunday
# of
Pat
ient
s
Years
Day of the Week CT Performed
2014 2015 2016 2017 2018

ACH Major Trauma Statistics (ISS>12) 2018
59
Figure 28. CT done within 1 hour of ED Arrival
Figure 28 shows the past five years comparisons if CT was done within one hour of arrival at ACH ED. In 2018 38% of patients did not have a CT done within this timeframe. Time to CT scan is reviewed at the Trauma Quality Management Committee for all major trauma patients and recommendations are made for individual cases. Of note, the staff Radiologists at ACH have committed to reading and reporting all Trauma Team Code 77 Activation CT scans within one hour of the scan, however, not all major trauma patients meet criteria for a Code 77. Non-Operative Procedures Performed in 2018 Table 4. Non-operative Procedures Performed on Patients while in ACH ED
Non-Operative Procedures # Patients Percent of Total Patients (n=42)
Gastric Tube Insertion 9 17% Foley Catheter Insertion 8 15% Intubation 8 15% Blood Product Administration 7 13% Chest Tube Insertion 2 4%
Many patients have these types of non-operative procedures done at referral centres prior to transport, so therefore are not represented in this table.
0
10
20
30
40
50
60
2014 2015 2016 2017 2018
# of
Pat
ietn
s
Years
CT within 1 hour of ED Arrival
Yes
No

ACH Major Trauma Statistics (ISS>12) 2018
60
Patient Disposition from ED Figure 29.
Figure 29 shows the breakdown of patient disposition from the ED in 2018 as compared to the historical trend. This past year, there were no patients that went from OR to Ward. There were 2 ED deaths in 2018.
4. In-Patient Care Management and Outcomes Surgical Procedures Table 5. Five-Year Trend
2014 2015 2016 2017 2018 Total Major Trauma Patients 96 66 40 47 59 Total Patients Requiring Surgery 27 22 15 21 19 Total OR Visits 52 29 27 51 25 Total OR Hours 130 63 57 110 68 Mean (hours per case) 2.5 2.8 2.1 5.2 3.4 Mean (visits per case) 2 1 2 2 1
In 2018 15 (32%) of trauma patients went to the OR. This is lower than the 5 year average of 36%. Note the total OR hours have significantly decreased this past year as compared to 2017, and are well below the 5 year average of 86. This year four patients alone accounted for over half of the OR visits and over 23 OR hours.
Died in ED4%
ICU27%
OR/ICU3%
Direct Admit10%
Ward56%
2018
Died in ED1%
ICU24%
OR/ICU10%
OR/Ward4%Direct
Admit 8%
Ward53%
Died in OR0.3%
2014-2017

ACH Major Trauma Statistics (ISS>12) 2018
61
Figure 30. Total Patients Requiring Surgery
Figure 30 shows a 13% decrease in the number of patients requiring surgery, compared to 2017.
Table 6. OR Data by Service
OR Data by Service - 2018
Physician Service # of Procedures Neurosurgery 6 Orthopedics 5 Pediatric General Surgery 7 Plastics 6 Urology 2 ENT 1
Table 6 shows the physician services that performed the surgical procedures. During some procedures there were multiple physician services in the OR at one time.
28%33%
38%
45%
32%
0%
10%
20%
30%
40%
50%
2014 2015 2016 2017 2018
# of
Pat
ient
s
Total Patients Requiring Surgery

ACH Major Trauma Statistics (ISS>12) 2018
62
Figure 31. Time of Day to OR
Figure 31 compares the time patients went to the OR from 2014 to 2018. In 2018, the majority of patients went to OR between 08:01 - 16:00. Length of Stay Statistics Figure 32. Patient LOS
Figure 32 compares the hospital admission LOS of patients from 2014 to 2018. In 2018, the median LOS for all patients was 12 days - consistent with the previous 5 year average of 12 days. A majority of patients (73%) stayed between 1 and 6 days, while 27% of patients stayed between 7 and 285 days.
3
9
15
0
14
8
2
6 7
1
6
14
4
11 10
0
5
10
15
20
00:00 -08:00 08:01 - 16:00 16:01 - 24:00
Time of Day to OR
20142015201620172018
0%
10%
20%
30%
40%
50%
1-3 4-6 7-12 13-60 61-98 99-285Perc
entil
e of
Pat
ient
s
Number of Days
LOS by Percentile of Patients
2014
2015
2016
2017
2018

ACH Major Trauma Statistics (ISS>12) 2018
63
Admitting Physician Service Analysis – 2018 Table 7.
In 2018, a total of 23 patients (40%) were initially admitted to ICU. Those patients were subsequently transferred to the following:
2 patients went to Neurosurgery 4 patients went to Pediatrics 5 patients went to General Surgery 1 patient went to Urology 11 died in ICU
3 patients were transferred into the ICU from the in-patient units.
2 patients were transferred back to General Surgery and 1 patient was transferred back to Urology.
Physician Service # Patients Initially
Admitted to
Service
Percent of Total
Patients Admitted n=57 (2 ED
deaths)
# Patients Trans-
ferred to Service
Total Trauma Cases
per Service
Total Days
on Service
Mean LOS on Service
Median LOS on Service
ICU 23 40% 3 26 103 4 3 Neurosurgery 10 18% 2 12 60 5 3 Orthopedics 0 0% 1 1 6 6 6 Pediatrics 3 5% 4 7 392 56 9 General Surgery 19 33% 5 24 133 6 3 Urology 2 4% 1 3 14 5 4
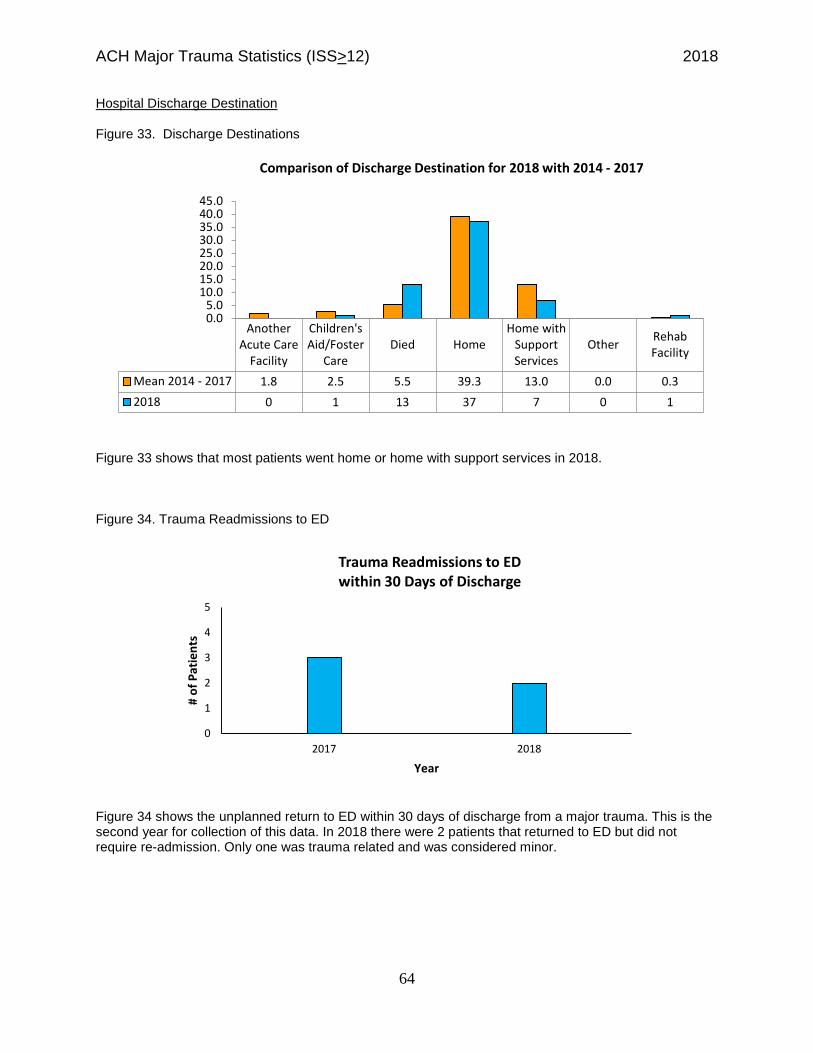
ACH Major Trauma Statistics (ISS>12) 2018
64
Hospital Discharge Destination Figure 33. Discharge Destinations
Figure 33 shows that most patients went home or home with support services in 2018. Figure 34. Trauma Readmissions to ED
Figure 34 shows the unplanned return to ED within 30 days of discharge from a major trauma. This is the second year for collection of this data. In 2018 there were 2 patients that returned to ED but did not require re-admission. Only one was trauma related and was considered minor.
AnotherAcute Care
Facility
Children'sAid/Foster
CareDied Home
Home withSupportServices
Other RehabFacility
Mean 2014 - 2017 1.8 2.5 5.5 39.3 13.0 0.0 0.32018 0 1 13 37 7 0 1
0.05.0
10.015.020.025.030.035.040.045.0
Comparison of Discharge Destination for 2018 with 2014 - 2017
0
1
2
3
4
5
2017 2018
# of
Pat
ient
s
Year
Trauma Readmissions to ED within 30 Days of Discharge

ACH Major Trauma Statistics (ISS>12) 2018
65
Figure #35 Trauma Readmissions to Inpatient Unit
Figure 35 show the unplanned return and admitted within 30 days of discharge from a major trauma. This is the second year for collection of this data. In 2018 there were 2 patients that had an unplanned return within 30 days of discharge that required admission. Both were directly related to their major trauma and had resulted in deterioration of condition. Both were reviewed at the Pediatric Trauma Quality Management Committee where their discharge teaching/advice and care was reviewed and felt to be appropriate. Outcomes by Age Figure 36. Survivors
Figure 36 compares all age groups of survivors.
00
1
2
3
4
5
2017 2018
# of
Pat
ient
s
Year
Trauma Readmissions to IP Unit within 30 Days of Discharge
< 1 1-4 5-9 10-14 > 14Mean 2014-2017 4.5 11.3 15.3 19.0 6.82018 5 9 14 15 3
0.0
5.0
10.0
15.0
20.0
Comparison of Survivors by Age Group for 2018 with 2014 - 2017

ACH Major Trauma Statistics (ISS>12) 2018
66
Figure 37. Non-Survivors
Figure 37 shows 13 deaths in 2018. The deaths in the < 1 age category all died from non-accidental trauma causing catastrophic head injuries. The 1-4 age category saw 1 non-accidental trauma, one accidental hanging, one struck by a vehicle and one submersion. The 5-9 age category saw one struck by a vehicle and one submersion. The 10-14 age category saw 1 sports injury resulting in massive head and chest injuries and two intentional hanging. The > 14 age category saw one intentional hanging.
Outcomes by ISS Figure 38. Survivors vs Non-Survivors by ISS
Most survivors (78%, n=46) had an ISS from 16 to 35. Non-survivors were in the ISS ranges 16-25 and 26-35, and 36-45 with a 46%, 46% and 8% mortality rate respectively.
< 1 1-4 5-9 10-14 > 14Mean 2014 - 2017 1.0 1.5 1.3 1.3 0.52018 3 4 2 3 1
0.0
1.0
2.0
3.0
4.0
5.0
Comparison of Non-Survivors by Age group for 2018 with 2014 - 2017
3
30
11
2 00
6 61 0
05
101520253035
12 - 15 16 - 25 26 - 35 36 - 45 45 +
# of
Pat
ient
s
ISS
2018
Survivors Non-Survivors

ACH Major Trauma Statistics (ISS>12) 2018
67
TRISS Pre Charts for 2018 The following charts identify patients according to their probability of survival (Ps). Each patient is characterized by the Revised Trauma Score (RTS) and the Injury Severity Score (ISS) and then plotted on a graph. The shaded area represents the combination of the RTS and the ISS which yield a probability of survival (Ps) of >.50. The area above the line represents a probability of survival of <.50. Patients who are above the shaded area and survive and those who die and are plotted in the shaded area are atypical cases and subject to medical review. The age groups are standard age groups used in the development of the TRISS analysis. Figure 39. Pediatric Pre Charts include blunt and penetrating mechanisms for patients < 15 years.
Pediatric AIS 2005 Coding Generated 07/08/2019
Arrival Dates 01/01/2018 - 12/31/2018 Query ISS_12_OR_HIGHER
1 5 10 15 20 25 30 35 40 45 50 55 60 65 70 75 + +---+----+----+----+----+----+----+----+----+----+----+----+----+----+----+ + | | 0 + DD D + 0 | | + + | .. | 1 + .... + 1 | ....... | R + ......... + E | ............ | V 2 + .............. + 2 I | ................ | S + ................... + E | ..................... | D 3 + ..................D..... + 3 | .......................... | T + ............................. + R | ...................L........... | A 4 + ................L........D...L... + 4 U | ........................D........... | M + ...................................... + A | ......................................... | 5 + ........................................... + 5 S | ............................................. | C + ................................................ + O | .................................................. | R 6 + ..................................................... + 6 E | ....................................................... | + ........................................L................. + | .........................L..L............................... | 7 + ................L.L.L....L.................................... + 7 | ................................................................. | + ...............LL...L..L.L......................................... + | ............LL.LL..LLL..LLL..L............L........................... | 8 + +---+----+----+----+----+----+----+----+----+----+----+----+----+----+----+ + 8 1 5 10 15 20 25 30 35 40 45 50 55 60 65 70 75 L = SURVIVOR(S) SHADED = Ps >= 0.50 D = DEATH(S) INJURY SEVERITY SCORE B = BOTH
There were three unexpected deaths for patients less than 15 years using the TRISS methodology. All deaths were reviewed at the Trauma Quality Management Committee to ensure appropriateness of care.

ACH Major Trauma Statistics (ISS>12) 2018
68
Figure 40. Adult Pre Charts include blunt and penetrating mechanisms between 15 and 17 years.
Adult Blunt (15 - 54) AIS 2005 Coding Generated 07/08/2019
Arrival Dates 01/01/2018 - 12/31/2018 Query ISS_12_OR_HIGHER
1 5 10 15 20 25 30 35 40 45 50 55 60 65 70 75 + +---+----+----+----+----+----+----+----+----+----+----+----+----+----+----+ + | | 0 + + 0 | | + + | .. | 1 + .... + 1 | ....... | R + ......... + E | ............ | V 2 + .............. + 2 I | ................ | S + ................... + E | ..................... | D 3 + ........................ + 3 | .......................... | T + ............................. + R | ............................... | A 4 + .........................D....... + 4 U | .................................... | M + ...................................... + A | ......................................... | 5 + ........................................... + 5 S | ............................................. | C + ................................................ + O | .................................................. | R 6 + ..................................................... + 6 E | ....................................................... | + .......................................................... + | ............................................................ | 7 + .............................................................. + 7 | ................................................................. | + ................................................................... + | ................L...L................................................. | 8 + +---+----+----+----+----+----+----+----+----+----+----+----+----+----+----+ + 8 1 5 10 15 20 25 30 35 40 45 50 55 60 65 70 75 L = SURVIVOR(S) SHADED = Ps >= 0.50 D = DEATH(S) INJURY SEVERITY SCORE B = BOTH
There was one unexpected deaths for patients 15 years and older using the TRISS methodology in 2018. This death was reviewed at the Trauma Quality Management Committee to ensure appropriateness of care.

ACH Major Trauma Statistics (ISS>12) 2018
69
TRISS is an internationally accepted method of estimating the probability of survival by combining age, RTS, ISS, and method of injury. For example, patients with a TRISS of > 0.5 would not be expected to die. For the purpose of this annual report, TRISS is also used to benchmark ACH mortality with international standards. The Z score compares observed death rates at ACH compared with the international standards delineated in the Major Trauma Outcome study (MTOS) (Champions, Copes, Sacco, et al., J Trauma, 1990). Z scores can only be calculated for those patients with a known TRISS probability of survival. Of our 59 patients, only 54 had the information required to calculate TRISS. W measures the clinical significance of the differences between the actual and unexpected survivors. W is the number of survivors more than would be expected from the outcome norms per 100 patients treated. The W score can only be calculated if the absolute value for the Z score is equal or greater than 1.96. Due to the physiologic parameters used in the Revised Trauma Score, patients who do not have a recorded Glasgow Coma Scale (GCS) will not have a TRISS value calculated. TRISS Summary January 2018- December 2018 Z Score W Score Sample Size 15-17 year olds -1.23 - 4 Pediatric (0-14 years old) -0.95 - 50 Total Subset -1.26 - 54
TRISS Statistics Statistic Value Count of Valued 54 (91.5%) Minimum 0.03595 Maximum 0.99187 Average 0.85637 Median 0.97630 Standard Deviation 0.25552 Count of Not Valued 5 (8.5%)
RTS refers to the Revised Trauma Score and is calculated using the Glasgow Coma Scale (GCS), Respiratory Rate (RR), and Systolic Blood Pressure (SBP) on arrival at the Trauma Centre. Higher RTS values are usually associated with better prognosis.