Academy of Accounting and Financial Studies - Allied … · Proceedings of the Academy of...
111
Volume 10, Number 2 2005 Allied Academies International Conference Las Vegas, Nevada October 12-15, 2005 Academy of Accounting and Financial Studies PROCEEDINGS Volume 10, Number 2 2005
Transcript of Academy of Accounting and Financial Studies - Allied … · Proceedings of the Academy of...

Volume 10, Number 2 2005
Allied AcademiesInternational Conference
Las Vegas, NevadaOctober 12-15, 2005
Academy of Accountingand Financial Studies
PROCEEDINGS
Volume 10, Number 2 2005

page ii Allied Academies International Conference
Las Vegas, 2005 Proceedings of the Academy of Accounting and Financial Studies, Volume 10, Number 2
Allied Academies International Conference page iii
Proceedings of the Academy of Accounting and Financial Studies, Volume 10, Number 2 Las Vegas, 2005
Table of Contents
CAPITAL EXPENDITURE AND LONG-RUNPROFITABILITY: EVIDENCE FROM THE PAPERAND FOREST PRODUCTS INDUSTRY . . . . . . . . . . . . . . . . . . . . . . . . . . . . . . . . . . . . 1Confidence W. Amadi, Florida A&M University
INDIVIDUAL INVESTORS, ELECTRONIC TRADINGAND TURNOVER . . . . . . . . . . . . . . . . . . . . . . . . . . . . . . . . . . . . . . . . . . . . . . . . . . . . . 11Vaughn S. Armstrong, Utah Valley State CollegeNorman D. Gardner, Utah Valley State College
ETHICS STANDARDS FOR THE PROFESSIONALTAX PRACTICE: NEW DEVELOPMENTS . . . . . . . . . . . . . . . . . . . . . . . . . . . . . . . . 13Cynthia E. Bolt, The Citadel
THE DETERMINANTS OF THE REINSURANCEDECISION BY LIFE INSURANCE COMPANIES . . . . . . . . . . . . . . . . . . . . . . . . . . . . 15Raja Bouzouita, Central Missouri State UniversityArthur J. Young, Central Missouri State University
PREDICTING DOWNGRADES OF A.M. BEST’SRATINGS FOR PROPERTY AND CASUALTYINSURANCE COMPANIES . . . . . . . . . . . . . . . . . . . . . . . . . . . . . . . . . . . . . . . . . . . . . . 17Raja Bouzouita, Central Missouri State UniversityArthur J. Young, Central Missouri State University
CHARITABLE ORGANIZATIONS AND ADYNAMIC TAX ENVIRONMENT . . . . . . . . . . . . . . . . . . . . . . . . . . . . . . . . . . . . . . . . 19William P. Brown, Longwood UniversityEvelyn C. Hume, Longwood University
INTERVENTION ANALYSIS OF THE EFFECTS OFTAX REFORM ACT ON THENUMBER OF BUSINESS FAILURES . . . . . . . . . . . . . . . . . . . . . . . . . . . . . . . . . . . . . 21Askar H. Choudhury, Illinois State UniversitySteven V. Campbell, University of Idaho
STATE SARBANES OXLEY LEGISLATION:A SURVEY OF THE PERCEPTIONS OF CPAsIN SMALL FIRMS IN CALIFORNIA . . . . . . . . . . . . . . . . . . . . . . . . . . . . . . . . . . . . . . 23Nancy L. Christie, Western Washington UniversityJohn Corless, California State University-SacramentoDonna Phillips, University of Houston-DowntownThomas Beirne, Jr., California State University-Sacramento

page iv Allied Academies International Conference
Las Vegas, 2005 Proceedings of the Academy of Accounting and Financial Studies, Volume 10, Number 2
THE EFFECTS OF EXPECTATION FORMATIONON DETECTING UNEXPECTED NON-CHANGESIN ACCOUNT BALANCES DURING ANALYTICALPROCEDURES . . . . . . . . . . . . . . . . . . . . . . . . . . . . . . . . . . . . . . . . . . . . . . . . . . . . . . . . 25Charles P. Cullinan, Bryant University
THE VALUE RELEVANCE OF VALUE ADDEDAND STAKEHOLDER COMPENSATION ACROSSBUSINESS CULTURES . . . . . . . . . . . . . . . . . . . . . . . . . . . . . . . . . . . . . . . . . . . . . . . . . 27John Darcy, The University of Texas - Pan American
WALL STREET JOURNAL DISTRESSDISCLOSURES AND BANKRUPTCY RESEARCH . . . . . . . . . . . . . . . . . . . . . . . . . . 29Mark C. Dawkins, University of GeorgiaEna Rose-Green, Southern Illinois University Edwardsville
MARKET REACTIONS TO TERRORIST INCIDENTS:AN ANALYSIS . . . . . . . . . . . . . . . . . . . . . . . . . . . . . . . . . . . . . . . . . . . . . . . . . . . . . . . . 31Prakash Dheeriya, California State University-Dominguez Hills
AN ANALYSIS OF THE INITIAL ADOPTION OF FAS141 AND 142 IN THE PHARMACEUTICAL INDUSTRY . . . . . . . . . . . . . . . . . . . . . 35Jonathan Duchac, Wake Forest UniversityEd Douthett, George Mason University
THE DEATH OF THE ESTATE TAX:PROS AND CONS . . . . . . . . . . . . . . . . . . . . . . . . . . . . . . . . . . . . . . . . . . . . . . . . . . . . . 37Janet Dye, University of Alaska Southeast
ENGAGEMENT RISK: A PRELIMINARY ANALYSIS OFAUDIT FIRM’S CLIENT ACCEPTANCE DECISIONS . . . . . . . . . . . . . . . . . . . . . . . . 39Jack R. Ethridge, Stephen F. Austin State UniversityTreba Lilley Marsh, Stephen F. Austin State UniversityKurt Canfield, Deloitte
ACTIVE LEARNING: AN EMPIRICAL STUDY OFTHE USE OF SIMULATION GAMES IN THEINTRODUCTORY FINANCIAL ACCOUNTING CLASS . . . . . . . . . . . . . . . . . . . . . . 41Lou Fowler, Missouri Western State University
ACADEMIC DISHONESTY:A PREDICTOR OF EMPLOYEE DEVIANCE . . . . . . . . . . . . . . . . . . . . . . . . . . . . . . . 45Sharron M. Graves, Stephen F. Austin State University
TOWARD AN ORDERED MARKET HYPOTHESIS:EVIDENCE AGAINST ACCEPTED THEORY . . . . . . . . . . . . . . . . . . . . . . . . . . . . . . 47David Harris, Institute for Scientific Research

Allied Academies International Conference page v
Proceedings of the Academy of Accounting and Financial Studies, Volume 10, Number 2 Las Vegas, 2005
DETERMINANTS OF EMERGING STOCKMARKET CORRELATIONSIN THE GRAVITY EQUATION . . . . . . . . . . . . . . . . . . . . . . . . . . . . . . . . . . . . . . . . . . 53Jui-Chi Huang, Harrisburg Area Community College, PennsylvaniaAysegul Ates, Akdeniz University, Antalya, TurkeyTantatape Brahmasrene, Purdue University North Central, Indiana
BUSINESS FAILURE PREDICTION IN RETAILINDUSTRY: AN EMPIRICAL EVALUATION OFGENERIC BANKRUPTCY PREDICTION MODELS . . . . . . . . . . . . . . . . . . . . . . . . . 55Yihong He, Monmouth UniversityRavindra Kamath, Cleveland State University
AN EXAMINATION OF THE RECENT INCREASEIN CORPORATE FINANCIAL RESTATEMENTSDUE TO INAPPROPRIATE LEASE ACCOUNTING . . . . . . . . . . . . . . . . . . . . . . . . . 57Troy Hyatt, University of Wisconsin - OshkoshAlan Ortegren, Southern Illinois University EdwardsvilleBrad Reed, Southern Illinois University Edwardsville
GEOGRAPHIC FOCUSED MUTUAL FUNDS:AN EMPIRICAL ANALYSIS OF THE PORTFOLIOPROPERTIES OF A HAWAII FUND . . . . . . . . . . . . . . . . . . . . . . . . . . . . . . . . . . . . . . 59Terrance Jalbert, University of Hawaii HiloChantelle Schieven, University of Hawaii Hilo
A REVIEW OF CIVIL WAR TAX LEGISLATIONAND ITS INFLUENCE ON THE CURRENT U.S.TAX SYSTEM . . . . . . . . . . . . . . . . . . . . . . . . . . . . . . . . . . . . . . . . . . . . . . . . . . . . . . . . . 61Darwin L. King, St. Bonaventure UniversityMichael J. Fischer, St. Bonaventure UniversityCarl J. Case, St. Bonaventure University
ON DISCOUNTING DEFERRED INCOME TAXES . . . . . . . . . . . . . . . . . . . . . . . . . . . . . . . . 63John N. Kissinger, Saint Louis University
INFORMAL REGULATORY PRESSURE TO ALTERFINANCIAL REPORTING BEHAVIOR:THE CASE OF IN-PROCESS RESEARCHAND DEVELOPMENT . . . . . . . . . . . . . . . . . . . . . . . . . . . . . . . . . . . . . . . . . . . . . . . . . 65Gyung Paik, Brigham Young UniversityJacob Findlay, Deloitte Touche
THE SURVIVAL OF FIRMS THAT TAKESPECIAL CHARGES FOR RESTRUCTURINGSAND WRITE-OFFS . . . . . . . . . . . . . . . . . . . . . . . . . . . . . . . . . . . . . . . . . . . . . . . . . . . . 67Gyung Paik, Brigham Young UniversityKip R. Krumwiede, Boise State University

page vi Allied Academies International Conference
Las Vegas, 2005 Proceedings of the Academy of Accounting and Financial Studies, Volume 10, Number 2
IKEA: A UNIQUE EXAMPLE OF THE EVOLUTIONOF MANAGEMENT ACCOUNTING TECHNIQUES . . . . . . . . . . . . . . . . . . . . . . . . . 69Donna Phillips, University of Houston--DowntownWarren B. Idsal, AKB Associates, Dallas, Texas
AUDITOR CHOICE AND AGENCY COSTS . . . . . . . . . . . . . . . . . . . . . . . . . . . . . . . . . . . . . . 71Tae Ryu, Metropolitan State College of Denver
AN ANALYSIS OF THE INFLUENCE OF ERPIMPLEMENTATION ON FINANCIAL ACCOUNTINGMEASURES . . . . . . . . . . . . . . . . . . . . . . . . . . . . . . . . . . . . . . . . . . . . . . . . . . . . . . . . . . 73Martha Lair Sale, Sam Houston State University
LOSING LIKE FORREST GUMP: WINNERS ANDLOSERS IN THE FILM INDUSTRY . . . . . . . . . . . . . . . . . . . . . . . . . . . . . . . . . . . . . . . 79Martha Lair Sale, Sam Houston State UniversityPaula Diane Parker, University of South Alabama
USING RESPONSE CARD TECHNOLOGY . . . . . . . . . . . . . . . . . . . . . . . . . . . . . . . . . . . . . . 83Charles R. B. Stowe, Sam Houston State University
FURTHER EVIDENCE ON CASH FLOWS’PREDICTIVE VALUE . . . . . . . . . . . . . . . . . . . . . . . . . . . . . . . . . . . . . . . . . . . . . . . . . . 85Ronald Stunda, Birmingham-Southern College
THE NOVEMBER EFFECT AND TAX LOSS SELLING:AN EMPIRICAL INVESTIGATION . . . . . . . . . . . . . . . . . . . . . . . . . . . . . . . . . . . . . . . 89Randall Valentine, Georgia Southwestern State UniversityJohn Kooti, Georgia Southwestern State University
DEMAND FOCUSED SUPPLY CHAIN MANAGEMENT . . . . . . . . . . . . . . . . . . . . . . . . . . . 91Sankaran Venkateswar, Trinity University
RESPONSE MEASURES USED FOR FINANCIALDISTRESS AND THEIR IMPACT ON RESULTS . . . . . . . . . . . . . . . . . . . . . . . . . . . . 93Terry J. Ward, Middle Tennessee State University
REINSURANCE ACCOUNTING UNDER SFASNO. 113: AN EMPIRICAL EXAMINATION OFACCOUNTING POLICY AND ITS DIFFERENTIALIMPACT TO INSURERS . . . . . . . . . . . . . . . . . . . . . . . . . . . . . . . . . . . . . . . . . . . . . . . . 95Jane M. Weiss, Arizona State University
REINSURANCE ACCOUNTING UNDER SFAS NO. 113:AN EMPIRICAL EXAMINATION OF ITSVALUE-RELEVANCE . . . . . . . . . . . . . . . . . . . . . . . . . . . . . . . . . . . . . . . . . . . . . . . . . . 97Jane M. Weiss, Arizona State University

Allied Academies International Conference page vii
Proceedings of the Academy of Accounting and Financial Studies, Volume 10, Number 2 Las Vegas, 2005
THE VALUATION IMPLICATIONS OF PAST ANDFUTURE INVESTMENTS IN INFORMATIONTECHNOLOGY: THE CASE OF FIRM'S Y2KCOMPLIANCE COSTS . . . . . . . . . . . . . . . . . . . . . . . . . . . . . . . . . . . . . . . . . . . . . . . . . 99Samuel L. Tiras, Suny At BuffaloJerry L. Turner, The University Of MemphisClark M. Wheatley, Florida International University
THE DETERMINANTS OF THE REINSURANCE DECISION BY LIFE INSURANCE COMPANIES . . . . . . . . . . . . . . . . . . . . . . . . . . 101Raja Bouzouita , Central Missouri State UniversityArthur J. Young, Central Missouri State University
Authors’ Index . . . . . . . . . . . . . . . . . . . . . . . . . . . . . . . . . . . . . . . . . . . . . . . . . . . . . . . . . . . . . . 103

Allied Academies International Conference page 1
Proceedings of the Academy of Accounting and Financial Studies, Volume 10, Number 2 Las Vegas, 2005
CAPITAL EXPENDITURE AND LONG-RUNPROFITABILITY: EVIDENCE FROM THE PAPER
AND FOREST PRODUCTS INDUSTRYConfidence W. Amadi, Florida A&M University
ABSTRACT
Using the Johansen’s procedure I investigate the long-run relationship between operatingcash flow and gross capital expenditure for the paper and forest products industry. I find that along-run relation ship exists between operating income and capital expenditure, for a significantnumber of the firms in the industry. For a large number of the firms, this does not hold. Moreoverfor the firms that exhibit this long-run relationship, operating income Granger causes capitalexpenditure. This is in contrast to accepted finance theory, which requires that capital expendituredetermine the firm’s level of operating cash flow.
INTRODUCTION
The primary objective of a business enterprise is the maximization of its shareholders’wealth. To achieve this, management is supposed or required to select capital projects that areexpected to increase the value of the firm by costing less than they generate in revenue. The netpresent value (NPV) has generally been accepted as the amount by which shareholders’ wealth isexpected to increase due to the acceptance of this project. Moreover capital budgeting techniquesrequire that projects be evaluated on a stand alone basis; requiring that incremental cash flow beused in evaluating the acceptability of a proposed project. The sum of the accepted project in afiscal year comprises the capital budgeting expenditure for the enterprise. Considering that capitalexpenditures involve current outlays in expectations of future pay off, the question becomes: is therea relationship between the level of capital budgeting expenditures and a firm’s profitability. Grantedthat the answer should be yes, but there is, to the author’s best knowledge, no direct empiricalinvestigation of this relationship on a micro level.
Fama and French (1999) studied the relationship between firm investment and profitabilityfor the aggregate non-financial U. S. corporations, by computing the overall internal rate of returnon investment. A positive internal rate of return led them to conclude that “on average corporateinvestment seems to be profitable”. The present study is aimed at extending their work by lookingat individual firms. Specifically, it attempts to investigate the relationship between operatingincome and the level of investment. In the Fama and French study, the difference between these twovariables (less tax) was one of the three cash flow terms in their present value equation.
The concept of business risk defined as the degree of operating leverage (DOL), measuresthe sensitivity of operating income to changes in the firm’s revenue. The financial press is repletewith news of firms reporting a small percentage decline in sales along with disproportionate declinesin income. This goes against the finance theory that requires that firms make investment decisionon the margin. The concept of DOL aggregates the firm’s fixed operating expenses, a practice thatignores the fact that these operating expenses are a result of individual capital budgeting decisions.Such declines in income may be indicative of divergence between theory and practice.

page 2 Allied Academies International Conference
Las Vegas, 2005 Proceedings of the Academy of Accounting and Financial Studies, Volume 10, Number 2
SOME BACKGROUND
Since the seminal work of (Jensen and Meckling,1976) on agency theory, both practitionersand academicians have devoted a considerable amount of resources to design a system ofcompensation that aligns the interest of management with that of shareholders. At the core of thisscheme is the question of how to measure management effectiveness. The most direct measure ofmanagement effectiveness as agents of the shareholders is the firm’s stock price. But the use ofstock price as a sole measure of effectiveness as argued by (Jensen and Murphy,1990) exposes themanagers to excessive risk due to market factors that are beyond the control of management.
McConnell and Muscarella (1985) find that on average the stock market reacts positively toannouncements of increases in planned capital expenditures and negatively to decreases in plannedcapital expenditures. (Woolridge,1988) also reports positive stock price reaction to a variety oflong-term strategic investments such as joint ventures, plant and equipment purchases, new productintroductions, and research and development expenditures. In addition, (Martin andKensinger,1990), studied the share-price response to announcements of increases in research anddevelopment spending. They find, on the average, significant positive reaction even when theannouncement occurs in the face of an earnings decline. Stock prices are the present value ofexpected future cash flows. Capital expenditures are accepted on the basis of expected increase incash flow as a result of undertaking the investment. Thus there should be a positive long-runrelationship between cash flow and capital investment.
Whereas academicians were focusing on stock price, practitioners emphasized accounting–based measures of performance such as EVA (Economic Value Added), CFROI (Cash Flow Returnon Investment), TBR (Total Business Return, Economic Profit, and SVA (Shareholder ValueAdded). Accounting-based measures of firm performance can be manipulated in the short-run atleast, through revenue and/or cost recognition. Moreover, any measure of performance must belinked to the goal of shareholder wealth maximization as evidenced by the firm’s stock price.(Biddle, Bowen and Wallace,1996) studied the association of EVA and earnings with stock returns.Their findings reveal that earnings is more highly associated with stock returns and firm value thanEVA, residual income or cash flow from operations. Farsio, Degel and Degner (2000) in their studyof the relationship between EVA and stock returns reported that “a regression of 1998 total returnagainst 1998 EPS and EVA resulted in a model that explained 99% of the variability in total returnwhereas the same regression using EVA as an explanatory variable resulted in only 7% explanationof variation.” (Chen and Dodd,2001) examined the value relevance of operating income, residualincome and economic value added in explaining stock returns. They conclude that operating incomehas a higher relative information value than residual income.
All of the performance measures examined have one thing in common: they are aconsequence of actions and decisions taken and made by management. From a managementstandpoint, the actions they can take to affect these performance measures rests squarely on theirinvestment decisions. Operating income correlates better with stock returns than any other singlemeasure of performance as well as a direct consequence of management’s investment decision, itis necessary to ask if it has a long-run relationship with the firm’s investment decision as evidencedby the firm’s capital expenditure. This is the objective of the present study.
DATA AND METHODOLOGY
The data for this study, obtained from the Compustat database, are the annual operatingincome before depreciation (OIBD) and gross capital expenditure (GCE) for the period 1960through 2000, for the paper and forest products industry. The choice of industry is completelyarbitrary. Capital projects define the firm and hence the industry or vice versa. Regardless of whichindustry selected, the goal of the firms within the industry is still the maximization of shareholders’

Allied Academies International Conference page 3
Proceedings of the Academy of Accounting and Financial Studies, Volume 10, Number 2 Las Vegas, 2005
wealth through the acceptance of positive net present value projects. Of the 114 firms listed in thedatabase, only 22 firms had complete data spanning the study period. A list of firms is presentedin Table 1. Establishing the long-run relationship between a pair of time series requires that thevariables be cointegrated. If a series must be differenced d times before it becomes stationary, it issaid to contain d unit roots and integrated of order d, expressed as I(d). For two series yt and xt tobe cointergrated, they each must be integrated of the same order d. Moreover, there must exist avector $, such that the error term from the regression (,t =yt – $xt) is of a lower order of integration,I(d-b), where b>0. According to Engle and Granger (1987), the two series are said to be cointegratedof order (d, b). Cointegration implies that even though the two or more series themselves maycontain stochastic trends, the series are linked to form an equilibrium relationship to which thesystem converges over time. The error term, ,t, can be interpreted as the distance that the systemis away from equilibrium at time t.
Table 1: Stationarity Test Results
Company Name Order of Integration Estimate of $ t-Value**
OIBD GCE OIBD GCE OIBD GCE
Panel A
International Paper Co (IP) 1 1 -1.8481 -2.297 -5.0912 -5.5493
Kimberly-Clark Corp (KMB) 1 1 -1.4496 -2.5017 -4.5095 -6.5049
Maxxam Group Holdings Inc (MXM2) 1 1 -1.0344 -1.3009 -3.4717 -4.0671
Mead Corp (MEA) 1 1 -1.8526 -1.6127 -4.1317 -4.8768
Nashua Corp (NSH) 1 1 -1.5621 -1.3578 -4.3147 -3.8498
Nortek Inc (NTK) 1 1 -1.2749 -1.2196 -3.923 -3.7907
Potlatch Corp (PCH) 1 1 -1.2934 -1.2754 -3.7208 -3.925
Sonoco Products Co (SON) 1 1 -0.9455 -0.6824 -5.2723 -4.004
Westvaco Corp (W) 1 1 -2.0569 -1.9251 -5.1416 -5.1271
Willamette Industries (WLL) 1 1 -1.3082 -1.2756 -4.0034 -3.9256
Panel B
Champion Enterprises Inc (CHB) 0 0 -1.0003 -1.0001 -2160.3 -7612.9
Domtar Inc (DTC) 0 0 -0.9909 -0.4882 -3.9988 -3.5435
Panel C
Chesapeake Corp (CSK) 1 0 -1.367 -1.3028 -4.0139 -4.0575
Georgia Pacific Group 1 0 -2.3309 -1.3357 -6.5344 -4.073
Georgia –Pacific CP (GPTG.CM) 1 0 -2.4438 -1.3065 -6.9975 -4.0019
Glatfelter (P H) Co (GLT) 1 0 -0.9444 -0.9166 -5.3513 -5.2181
Panel D
Pope & Talbot Inc (POP) 0 1 -0.503 -1.2754 -5.0632 -3.925
Weyerhaeuser Co (WY) 0 1 -0.8864 -1.8119 -4.2205 -4.4842

page 4 Allied Academies International Conference
Table 1: Stationarity Test Results
Company Name Order of Integration Estimate of $ t-Value**
OIBD GCE OIBD GCE OIBD GCE
Las Vegas, 2005 Proceedings of the Academy of Accounting and Financial Studies, Volume 10, Number 2
Panel E
Avery Dennison Corp (AVY) 2 1 -4.0453 -3.5916 -3.6592 -5.011
Bemis Co (BMS) 2 1 -2.2064 -1.8428 -4.9241 -4.2771
Panel F
Lynch Corp (LGL) >2 2 NA -2.648 NA -5.2068
Skyline Corp (SKY) >2 2 NA -2.5257 NA -4.3173
** Critical value @ 5% level = -3.40, @ 10% level = -3.13
In order to investigate the long-run relationship between operating income and capitalexpenditure, it is necessary to determine the integration of these variables for the firms under study.To achieve this, the augmented Dickey-Fuller (ADF) test of (Said and Dickey,1984) and (Said,1991)is employed. The test is based on the null hypothesis of unit root with drift process against thealternate of trend stationary process. The selection of the optimal lag length is based on the AkaikeInformation criterion (AC), multivariate (Hannan-Quinn,1979) criterion (HQ), and multivariate(Schwarz,1978) Bayesian (SC) criterion.
Given the integration characteristics of the income and expenditure variables for the firms,the Johansen maximum likelihood procedure is used to test for possible cointegration between thevariables. (Johansen,1988; 1991) and (Johansen and Juselius,1990) procedure is based on the error-correction representation of the vector autoregression VAR(k) model with Gaussian errors.(Johansen and Juselius,1990) likelihood-ratio tests (Lambda-max and Trace tests) are used todetermine the number of cointegrating vectors based on the maximum likelihood estimates of thecointegrating vectors. The lag length, k, is chosen by a combination of AC, HQ, and SC criteria.(Granger,1986;1988) pointed out that if two variables are cointegrated, then Granger causality mustexist in at least one direction. (Granger,1969) describes a variable xt as Granger causing anothervariable yt, if the inclusion of lagged values of x improves the forecast of y. (Engle andGranger,1987) point out that the standard Granger causality tests are inappropriate and misleadingin the presence of cointegration. Standard Granger causality tests that are augmented with error-correction terms, obtained from the cointegrating relationship, are used to investigate the long-runeffects. According to (Engle and Granger,1987), such tests assure that valid inferences can be madeon variables that are cointegrated.
STATIONARITY TEST RESULTS
The augmented Dickey-Fuller (ADF) test was conducted using the following regressionmodel:
)zt = "0 + $zt-1 + 0T + 1
Where zt is the time series, T is a time trend, and :t is white noise. The null hypothesis is that thetime series zt is a unit root with drift process: $ = 0, against the alternate that zt is a trend stationaryprocess: $ <0. The test statistic is the t-value of $. The selection of the optimal p was based on the

Allied Academies International Conference page 5
Proceedings of the Academy of Accounting and Financial Studies, Volume 10, Number 2 Las Vegas, 2005
Akaike, Hannan-Quinn and Schwarz information criteria. The results, though not presented in thetable, are available upon request. The results of the stationarity or unit root tests are presented inTable 1 for each of the firms in the sample.
The results indicate that the characteristics of the variables differ considerable across thefirms in the paper and forest products industry. The order of integration ranged from zero to morethan two for the industry. Panel A of the table lists the result for firms for which both the operatingincome and capital expenditure variables are I(1). Ten firms fall within this category. Two firms,shown in Panel B, have both variables that are I(0). Panel C contains the results for the four firms,which have the capital expenditure variable as I(0), while the operating income is I(1). Two firms,shown in panel D, have operating income series that is I(0) and capital expenditure series that is I(1).In panel E, two firms with operating income I(2) and capital expenditure I(1) are reported. Lastly,panel F reports the results for two firms for which one or both of the variables are integrated of ordergreater than two, I(>2). Given that a bivariate cointegration analysis requires that both variables beintegrated of the same order as well I(1), only the firms in Panel A will be studied for the long-runrelationship between operating income and capital expenditure.
COINTEGRATION TEST RESULTS
The use of the Johansen procedure requires the selection of the appropriate lag length for theVAR(p) model. The Hannan-Quinn and Schwarz information criteria are used to select the orderp that ensure the errors are approximately white noise. For all the series in the study, p=1 is theupper bound value that ensures white noise. Next the Johansen’s cointegration analysis wasperformed with cointegrating restriction on the time trend parameters imposed. The likelihood ratio(LR) tests, of the null hypothesis that the imposed cointegrating restrictions on the time trendparameters hold, are conducted to test the validity of the restrictions. The rejection of the nullhypothesis implies that the test results regarding the number of cointegrating vectors are invalid. Theresults of the tests indicate that the trend restriction is invalid for three of the firms (InternationalPaper, Sonoco Products Co, and Kimberly-Clark). The cointegrating vectors for these firms arerecalculated without imposing the restrictions on the time trend parameters.
The lambda-max and the trace test are performed to test for the number of cointegratingvectors. The lambda-max test, tests the null hypothesis that there are cointegrated vectors againstthe alternative that there are r+1cointegrated vectors. The trace test tests the null hypothesis thatthere are at most r cointegrated vectors against the alternative that there are 2 cointegrated vectors.Both test strongly support the existence of one cointegrating vector for most of the firms. Howeverthe results are mixed, hence inconclusive, for PCH and NSH. For the remainder of the firms, exceptfor MEA, the tests indicate that operating income and capital expenditure are strongly cointegratedat the 20% level of significance. For MEA, the tests are significant at the 5% level. Thecointegrating vectors for each of the firms are presented in table 2.
Next is the estimation of the error correction model. Since the number of lagged variablesnecessary to obtain white noise in the cointegrating equation is one, the error correction model takesthe form:
z(t) – z(t-1) = B.H’[z(t-1)’,t-1]’ + c + u(t) 2
for the case in which cointegrating restrictions on the time trend parameters are imposed or
z(t) – z(t-1) = B.H’z(t-1) + c.d(t) + u(t) 3
for the case without restrictions on the time trend parameters:where:

page 6 Allied Academies International Conference
Las Vegas, 2005 Proceedings of the Academy of Accounting and Financial Studies, Volume 10, Number 2
1) z(t) is a 2-vector with components: z(1,t) = OIBD(t) and z(2,t) = GEC2) H’[z(t-1)’, t-1]’ = e(t-1), is the 1-vector of error correction terms, with H the 3x1 matrix of
cointegrating vector3) H’z(t-1) = e(t-1), is the 1-vector of the error correction terms, with H the 2x1 matrix of cointegrating
vectors. 4) c is a 2-vector of constants5) d(t) is the 2-vector of deterministic variables, with components d(t,1) =1, and d(t,2) =t6) u(t) is the 2-vector of error terms.7) t = 2 ( = 1961), ……., 41 ( = 2000).
The maximum likelihood estimation results for the vector error correction model (VECM)are presented in Table3. Panel A displays the results for the case with restrictions on the time trendparameters, while panel B shows the results for the case without restrictions.
The result of the VECM estimation is used to test the direction of causality betweenoperating income and capital expenditure. A causal link exists between the variables if thecoefficient of the error correction term B1 and or B2 are statistically significant. Significance of theerror correction term reflects long-run causality. For each firm, if both coefficients are significant,it indicates that causality is bi-directional. This implies that changes in operating income areGranger caused by capital expenditure as well as changes in capital expenditure being Grangercaused by operating income.
Table 2: Standardized Estimate of the Cointegration Vector Based on the Johansen Procedure
Firm TickerSymbol
With Cointegrating Restrictions On Time Trend Parameter
Without Cointegrating RestrictionOn Time Trend Parameter
OIBD GCE T OIBD GCE
IP* -0.00021 -0.0239 1 0.003872 1
KMB* 0.01217 -0.06625 1 -0.1846 1
MEA -0.0973 0.05988 1 1 -0.6164
NTK 0.03572 -0.03559 1 1 -0.9824
PCH -0.5049 0.5439 1 -0.9324 1
NSH -0.6512 1 -0.2554 -0.6518 1
SON* 0.1991 -0.1557 1 1 -0.9493
W 0.0233 -0.1052 1 -0.2552 1
WLL -0.1127 0.1126 1 1 -0.9989
MXM2 -0.2712 1 -0.0969 -0.2716 1
*The null hypothesis that the imposed restrictions on the time trend holds was rejected for these firms.
As evidenced in Table 3 Panel B, causality runs strongly from operating income to grosscapital expenditure. In all of the firms studied, the coefficient of the error correction term (B2) inthe Operating income VECM are significant at the 5% level or better. The average R2 for the firmsstudied is 43.04%, with a high of 100% and a low of 17.15%. This contrasts with an average of15.37% and a high of 48.74% and a low of 0.43%. Bi-directional causality exists between operatingincome and capital expenditure for five of the firms (IP, KMB, MEA, SON, and W) although thecausality is much stronger flowing from operating income to capital expenditure as evidenced bythe magnitude t-statistic.

Allied Academies International Conference page 7
Proceedings of the Academy of Accounting and Financial Studies, Volume 10, Number 2 Las Vegas, 2005
Table 3: Maximum Likelihood Estimation Results for the VECM
Firm TickerSymbol
Change in Operating Income BeforeDepreciation ()OIBD)
Change in Gross Capital Expenditure ()GCE)
Panel A
B1 C1 R2 (%) B2 C2 R2 (%)
IP 26.429 -10.301 12.7 31.617 -107.51 38.33
KMB 14.359 -32.708 21.77 11.719 -68.437 39.08
MEA 4.721 -10.583 18.33 -7.103 42.245 34.31
NTK -0.849 2672.88 .18 14.089 -274.87 48.71
PCH -0.1735 6.386 2.77 -1.452 15.475 53.5
NSH 0.4008 2.411 6.86 -0.486 -2.64 21.6
SON -11.407 488.53 48.64 -11.409 479.067 48.65
W 3.723 -0.079 18.56 5.062 -23.811 23.74
WLL 0.2328 2586.4 .07 -8.874 137.43 100.0
MXM2 -0.160 0.654 0.12 -0.582 0.5448 17.05
Panel B (t-Statistic in Parenthesis)
B1 C (1,1) C (1,2) R2 (%) B2 C (2,1) C (2,2) R2 (%)
IP -0.575(-2.23)*
-194.72(-1.45)
31.859(2.83)*
17.35 -0.7717(-5.05)*
-99.57(-1.25)
30.087(4.52)*
38.95
KMB -0.7076(-2.32)*
-113.07(-1.95)
15.242(3.67)*
27.74 -0.825(-4.87)*
-61.191(-1.90)
11.482(4.97)*
39.75
MEA -0.458(-2.97)*
-16.011(-0.62)
4.742(2.66)*
18.31 0.6914(4.55)*
49.742(1.96)
-7.0743(-4.03)*
34.33
NTK -0.067(-0.58)
8828.92(1.66)
-279.68(-1.31)
4.3 0.5054(6.00)*
431.57(0.11)
-12.57(-0.08)
48.68
PCH -0.0924(-1.04)
9.319(0.92)
-0.302(-0.69)
2.97 -0.7895(-6.79)*
16.002(1.20)
-1.429(-2.49)*
53.54
NSH 0.4049(1.76)
6.918(1.31)
-0.3067(-1.42)
9.07 -0.4842(-3.33)*
-0.5625(-0.17)
0.0215(0.16)
22.76
SON -10.048(-5.74)*
-1168(-0.28)
92.74(0.54)
48.74 -10.046(5.74)*
-1159.67(-0.28)
91.94(0.54)
48.74
W -0.3645(-2.8)*
-23.214(-1.03)
4.298(3.13)*
20.4 -0.5662(-3.77)*
-4.695(-0.18)
3.929(2.48)*
26.63
WLL -0.0659(-0.42)
8847.54(1.69)
-286.28(-1.35)
4.41 1.0002(896.35)*
148.12(3.98)*
-8.957(-5.94)*
100.0
MXM2 -0.1486(-0.20)
9.957(0.34)
-0.4194(-0.35)
0.43 -0.5795(-2.86)*
2.36(0.29)
-0.0317(-0.09)
17.15
*Significant at the 5% level or better

page 8 Allied Academies International Conference
Las Vegas, 2005 Proceedings of the Academy of Accounting and Financial Studies, Volume 10, Number 2
To further evaluate the effect of operating cash flow on capital expenditure, the coefficientof the error correction term is multiplied by the coefficient of the operating income in thecointegration vector. The resulting product is an estimate of the long-run impact of operatingincome on capital expenditure. It measures the rate of change of the change in capital expenditurewith respect to change in operating income. The results are presented in Table 4 along with the rateof change of the change in operating income with respect to capital expenditure.
Table 4: Estimate of the Slope of the VECM
Dependent Variable: )GEC, Independent Variable: OIBD**
Dependent Variable: )OIBDIndependent Variable: GEC
FirmTickerSymbol
With Restrictions onTime TrendParameter
Without Restrictionson Time TrendParameter
With Restrictions onTime Trend Parameter
Without Restrictions onTime Trend Parameter
IP -0.0067 0.003 -0.6323* -0.5751*
KMB 0.1426 0.1524 -0.9513* -0.7076*
MEA 0.6912 -16.011 0.2828* 0.2823*
NTK 0.5033 0.5054 0.0302 0.0658
PCH 0.7329 0.7361 -0.0944 -0.0924
NSH 0.3168 0.3156 0.4008 0.4049
SON -2.2715 10.046 1.776* 9.538*
W 0.1178 0.1445 -0.3917* -0.3645*
WLL 1.0001 1.0002 -0.0262 0.0658
MXM2 0.1578 0.1574 -0.1599 -0.1485* Coefficient of the error correction term B1, significantat the 5% level.
**Coefficient if the error correction term B2,significant at the 5% level for all the firms.
The result of the analysis indicates that there is a long-run positive relationship betweencapital expenditure and operating income. Increase in operating income results in increase in capitalexpenditure except for MEA and SON that have mixed results depending on whether or notrestrictions are placed on the time trend parameter. In the case of the effect of capital expenditurein changes in operating income, of the firms where the error correction term is significant, the resultsare mixed. For IP, KMB and W, there seems to exist an inverse relationship between increase inoperating income and capital expenditure. Where as for MEA and SON, increase in capitalexpenditure results in a long-run increase in operating income.
ANALYSIS AND CONCLUSION
The result obtained from applying the Johansen procedure on the relationship betweenoperating income and gross capital expenditure, provides a mixed insight into the capital budgetingprocess in the paper and forest products industry. Firstly, the significance of the variation in thelevel of integration of the variables begs the issue of the data generating process across firms.Finance theory predicts that there should be a long-run relationship between the cash flow andcapital expenditure. The existence of different orders of integration between these variables raisesdoubt about their long-run relationship and the capital budgeting decision criteria.

Allied Academies International Conference page 9
Proceedings of the Academy of Accounting and Financial Studies, Volume 10, Number 2 Las Vegas, 2005
Secondly, the impact of time on the long-run relationship between these variables is highlysignificant. Of the firms studied only three of them rejected trend restriction on the cointegratingvector. This implies that time is a relevant variable in establishing the long-run relationship betweenoperating income and capital expenditure. Moreover, the coefficient of the time variable in theVECM is significant at the 5% level for all but two of the firms with a cointegrating relationship.
Thirdly, the Granger causality test provides mixed results on the impact of operating incomeon capital expenditure and vice versa. The result indicates that, for half the firms studied, causalityruns strongly from operating cash flow to capital expenditure. This implies that the level of capitalspending is determined to a significant degree by the operating income. This runs counter to theefficient market theory on capital rationing, wherein capital expenditure is supposed to depend onthe profitability of investment projects and the unlimited ability of the capital markets to fundprofitable investments. On the other hand, for the remaining five firms, the tests indicate andsupport the inter-dependence of operating cash flow and capital expenditure through the bi-directional Granger causality between operating income and capital expenditure.
Fourthly, the slope of the operating income on the capital expenditure VECM equation ispositive for each of the firms studied. This provides strong evidence in support of the indirectimpact of firm’s current performance on future profitability as a result of new investments. Finally,this study seems to suggest that there is a significant gap between the dictates of financial theory andthe practice of finance as it relates to capital budgeting decision process. This issue merits furtherinvestigation to determine whether it is unique to the paper and forest products industry. If not, whatare the possible factors responsible for the inconsistency in the data generating process across firmsin the same industry?
REFERENCES
Biddle, G. C., R. M. Bowen & J. S. Wallace (1997). Does EVA Beat Earnings? Evidence on Associations with StockReturns and Firm Values, Journal of Accounting and Economics 2, 301-336
Chen S. & J. L. Dodd (2001). Operating Income and EVA: Which Metric is More Value Relevant? Journal ofManagerial Issues 13 (1), 65-86
Engle, R. F.& C.W.J. Granger (1987). Co-integration and Error Correction: Representation, Estimation, and Testing.Econometrica 55, 251-76
Fama, E. F.& K. R French (1999). The Corporate Cost of Capital and the Return on Corporate Investment. Journal ofFinance 54 (6), 1939-1967
Farsio, F., J. Degel,&d .J. Degner (2000). Economic Value Added (EVA) and Stock Returns. Financier 7, 115-118
Granger, C.W.J. (1969). Investigating Causal Relations by Econometric Models and Cross SpectralMethods,Econometrica, 424-438
Granger, C.W.J. (1986). Developments in the Study of Cointegrated Economic Variables. Oxford Bulletin of Economicsand Statistics 48, 213-228
Granger, C.W.J. (1988). Some Recent Developments in a Concept of Causality. Journal of Econometrics 39, 199-211
Hannan, E.J. & B.G. Quinn (1979). The Determination of the Order of an Autoregressive. Journal of the RoyalStatistical Society, 190-195
Jensen, M. C. & W. Meckling (1976). Theory of a Firm: Managerial Behavior, Agency Costs and Ownership Structure,”Journal of Financial Economics 3,305-360

page 10 Allied Academies International Conference
Las Vegas, 2005 Proceedings of the Academy of Accounting and Financial Studies, Volume 10, Number 2
Jensen, M. C. & K. Murphy (1990). Performance Pay and Top Management Incentives. Journal of Political Economy98: 225-264
Johansen, S. (1988). Statistical Analysis of Cointegration Vectors. Journal of Economic Dynamics and Control 12, 231-254
Johansen, S. (1991). Estimation and Hypothesis Testing of Cointegration Vectors in Gaussian Vector AutoregressiveModels. Oxford Bulletin of Economics and Statistics 54, 1551-80
Johansen, S. & K. Juselius (1990). Maximum Likelihood Estimation and Inference on Cointegration with Applicationto the Demand for Money, Oxford Bulletin of Economics and Statistics 52, 169-210
Martin, J. D. & J.W. Kensinger (1990). Corporate Research and Development Expenditures and Share Value, Journalof Financial Economics 26, 255-276
McConnell, J. J. & C. J. Muscarella (1985). Corporate Capital Expenditure Decisions and the Market Value of the firm,Journal of Financial Economic 14, 399-422
Said, S.E. (1991). Unit Root Test for Time Series Data with a Linear Time Trend, Journal of Econometrics 47, 285-303
Said, S.E. & D.A. Dickey (1984). Testing for Unit Roots in Autoregressive Moving Average of Unknown Order,Biometrika, 71, 599-607
Schwarz, G. (1978). Estimating the Dimensions of a Model, Annals of Statistics, 461-464
Woolridge, J.R. (1988). Competitive Decline and Corporate Restructuring: Is a Myopic Stock Market to Blame? Journalof Applied Corporate Finance, 1, 26-36
Allied Academies International Conference page 11
Proceedings of the Academy of Accounting and Financial Studies, Volume 10, Number 2 Las Vegas, 2005
INDIVIDUAL INVESTORS, ELECTRONIC TRADINGAND TURNOVER
Vaughn S. Armstrong, Utah Valley State [email protected]
Norman D. Gardner, Utah Valley State [email protected].
ABSTRACT
We examine how changes in individual investors’ cost for information and trading costsaffect stock turnover, i.e., the portion of outstanding stock that trades during a specific period oftime. We also test how individual investors with relatively short investment horizons affect turnover.We find that stock turnover increases when electronic trading becomes available to individualinvestors and that, while turnover is negatively correlated with individual investors’ equityownership, it is positively correlated with the level of electronic trading by individuals. Thisconfirms the theory that investors trade relatively more actively when their costs of trading declineand provides further evidence that, when investors have the same trading costs and access toinformation, differences in their investment objectives leads to differences in their contribution tostock turnover.

page 12 Allied Academies International Conference
Las Vegas, 2005 Proceedings of the Academy of Accounting and Financial Studies, Volume 10, Number 2

Allied Academies International Conference page 13
Proceedings of the Academy of Accounting and Financial Studies, Volume 10, Number 2 Las Vegas, 2005
ETHICS STANDARDS FOR THE PROFESSIONALTAX PRACTICE: NEW DEVELOPMENTS
Cynthia E. Bolt, The [email protected]
ABSTRACT
Tax advisors have become the most recent profession exposed for their unethical practices.When an international firm receives penalties of almost one-half billion dollars due to fraudulenttax activities, the issue of professional accounting ethics again comes to the forefront. Existingethics standards related to tax services have been recently modified to provide better direction forpractitioners and greater authority for implementation.
Pressure to retain clients yet comply with the tax code creates a dilemma for the practitioner.More than half of all taxpayers use a professional preparer. Fees received by tax preparers exceed$11 billion annually. Noncompliance is growing at astounding rates. Due to low audit rates,taxpayers are prone to play the “audit lottery,” often insisting on aggressive or inappropriate taxpositions when using a professional preparer. Approximately one-fourth of all preparers receivepreparer penalties during their careers. In the year 2003, civil penalties for negligence (pre-abatement) totaled almost $18 million; fraud penalties (pre-abatement) totaled $70 million.
Two standards provide guidance for the professional tax practice. The AICPA’s Statements onStandards for Tax Services (SSTS) replaces the non-enforceable Statement on Responsibilities in TaxPractice. Additionally, all practitioners are subject to the Treasury Department’s Circular 230:Regulations Governing the Practice of Attorneys, Certified Public Accountants, Enrolled Agents,Enrolled Actuaries, and Appraisers before the Internal Revenue Service.
The SSTS (2000) creates mandatory standards for AICPA members. In response toCongressional concerns regarding abusive tax shelters, modifications in 2003 include interpretationof the “realistic possibility of success” standard, a pivotal component of the guideline. Additionally,these standards provide a step-by-step process to guide the practitioner’s professional judgment todetermine whether or not there is a “good-faith belief that the position is warranted by existing law orcan be supported by a good-faith argument for an extension, modification, or reversal of the existinglaw.”
Circular 230, applicable to all tax preparers, was designed to promote ethical practice amongtax practitioners and advocates “best practices” in providing advice. The regulations state that taxpractitioners must not sign returns if they determine that certain tax positions do not have a realisticpossibility (defined as approximately a one in three or greater likelihood) of being sustained on themerits if challenged. Tax advisors are required to communicate clearly with their client regarding thenature of the engagement, determine the reasonableness of facts before determining an appropriateconclusion, disclose potential penalties related to a position, and “act fairly and with integrity inpractice before the Internal Revenue Service.”
Failure to comply with the AICPA standards could result in expulsion from the association. TheIRS imposes censure, suspension, or disbarment from practice before the IRS. Additionally, penaltyprovisions of tax law provide sanctions for noncompliance. Yet the concepts of professional judgment,realistic possibility, best practices, and good-faith belief contained in the standards are arbitrary andsubject to interpretation. The required interpretation of such indeterminate concepts and terminologycontained in these ethics standards creates many challenges and more gray areas in the area ofcompliance.

page 14 Allied Academies International Conference
Las Vegas, 2005 Proceedings of the Academy of Accounting and Financial Studies, Volume 10, Number 2
This paper describes and analyzes the fundamental theory of the two primary tax ethicsstandards and addresses the potential effect they might have on current practice.

Allied Academies International Conference page 15
Proceedings of the Academy of Accounting and Financial Studies, Volume 10, Number 2 Las Vegas, 2005
THE DETERMINANTS OF THE REINSURANCEDECISION BY LIFE INSURANCE COMPANIES
Raja Bouzouita, Central Missouri State [email protected]
Arthur J. Young, Central Missouri State [email protected]
ABSTRACT
Risk management is central to any business including insurance companies, and reinsuranceis one of the several risk management tools available to insurance companies. Insurance companiesrely on reinsurance to expand capacity, reduce underwriting risk and reduce the likelihood of financialdistress. This article investigates the determinants of the reinsurance decision by life insurancecompanies using research hypotheses in accordance to the motives of risk management practices.Using a cross section data for U.S. life insurance companies, we find measures of underwriting risk,tax incentives, and agency costs are significant determinants of the reinsurance decision.

page 16 Allied Academies International Conference
Las Vegas, 2005 Proceedings of the Academy of Accounting and Financial Studies, Volume 10, Number 2

Allied Academies International Conference page 17
Proceedings of the Academy of Accounting and Financial Studies, Volume 10, Number 2 Las Vegas, 2005
PREDICTING DOWNGRADES OF A.M. BEST’SRATINGS FOR PROPERTY AND CASUALTY
INSURANCE COMPANIESRaja Bouzouita, Central Missouri State University
[email protected] J. Young, Central Missouri State University
ABSTRACT
With intense competition among property and casualty insurance companies and tougherstandards for ratings by A. M. Best Company, property and casualty insurers are very concerned withmaintaining the current ratings since downgrades will affect insurer’s ability to retain and attract newbusiness. A. M. Best Company groups insurers receiving a letter grade rating into two distinct groups,“secure” and “vulnerable.” Occasionally, A. M. Best Company uses quantitative and qualitativeinformation in a confidential analysis process to downgrade previously assigned ratings from secureto vulnerable. Using a matching sample of insurers whose rating is downgraded to vulnerable ascompared to insurers whose rating remains secure, have the same organizational form and are ofsimilar size, we analyze the level of firms’ financial ratios prior to a downgrade to predict subsequentdowngrades. This study differs from previous research in the focus on the secure and vulnerable ratingsand in the use of a logit model to analyze the data. Our results indicate that the complicated and vagueprocess of downgrading a secure rating to a vulnerable rating can often be predicted with a simplemodel and a small set of ratios that can be calculated from readily available information.

page 18 Allied Academies International Conference
Las Vegas, 2005 Proceedings of the Academy of Accounting and Financial Studies, Volume 10, Number 2

Allied Academies International Conference page 19
Proceedings of the Academy of Accounting and Financial Studies, Volume 10, Number 2 Las Vegas, 2005
CHARITABLE ORGANIZATIONS AND ADYNAMIC TAX ENVIRONMENT
William P. Brown, Longwood [email protected]
Evelyn C. Hume, Longwood [email protected]
ABSTRACT
This paper will describe the changing tax regulatory environment facing charitable and othernot-for-profit organizations in the United States, discuss the implications of these changes forcharitable organizations and their managers, and offer suggestions for coping with this increasedscrutiny.
For some time the IRS has expressed concern about abuses of the tax exempt status grantedunder IRC 503. In a news release dated August 10, 2004 the Service announced that increased effortswould be made “to identify and halt abuses by tax-exempt organizations that pay excessivecompensation and benefits to their officers and other insiders.” In another press release dated June 30,2004 the Service announced that it “intends to disallow improper charitable contribution deductionsfor transfers of easements on real property to charitable organizations and for transfers of easementsin connection with purchases of real property from charitable organizations.” Testimony before Houseand Senate committees has highlighted the concerns in this area and contributed to Congressionalwillingness to increase the IRS’s enforcement budget.
These enforcement initiatives of the Internal Revenue Service mean that charitableorganizations and their managers face a broad range of threats even for organizations that are notengaging in questionable transactions or activities. Since sanctions can be imposed upon the charitableorganization, its managers and its donors it is crucial that they
• Become familiar with all relevant regulatory and reporting requirements.• Compile and maintain complete, accurate records of all transactions.• Carefully review proposed transactions for compliance with tax regulations,
· particularly those involving insiders and those which are new for the organization.• Justify compensation for managers and document that justification.
Because some charitable organizations and their managers have entered into transactions thatare abusive and/or are not in keeping with the organizations’ exempt purposes, all charitableorganizations and their managers face increased scrutiny by the Internal Revenue Service andincreased skepticism regarding the bona fides of transactions.
This article will provide guidance to charitable organizations and their managers meeting thechallenges of that increased scrutiny and skepticism.

page 20 Allied Academies International Conference
Las Vegas, 2005 Proceedings of the Academy of Accounting and Financial Studies, Volume 10, Number 2
Allied Academies International Conference page 21
Proceedings of the Academy of Accounting and Financial Studies, Volume 10, Number 2 Las Vegas, 2005
INTERVENTION ANALYSIS OF THE EFFECTS OFTAX REFORM ACT ON THE
NUMBER OF BUSINESS FAILURESAskar H. Choudhury, Illinois State University
Steven V. Campbell, University of Idaho
ABSTRACT
We investigate whether, the Tax Reform Act of 1978 positively associated with business failuremomentum in favor of private workout arrangements as oppose to bankruptcy reorganization/liquidation by giving debtors an economic incentive. The data covers the period January 1967 throughDecember 1986 and divided into pre- and post-event periods for both large and small business failures.We employ intervention analysis with transfer function modeling for the full data set and maximumlikelihood time-series regression on the pre- and post-event periods. After controlling for the numberof new business formations, we find the Tax Reform Act of 1978 is associated with significant positivechange in business failure momentum. These results also echoed in the intervention analysis.

page 22 Allied Academies International Conference
Las Vegas, 2005 Proceedings of the Academy of Accounting and Financial Studies, Volume 10, Number 2
Allied Academies International Conference page 23
Proceedings of the Academy of Accounting and Financial Studies, Volume 10, Number 2 Las Vegas, 2005
STATE SARBANES OXLEY LEGISLATION:A SURVEY OF THE PERCEPTIONS OF CPAs
IN SMALL FIRMS IN CALIFORNIANancy L. Christie, Western Washington University
John Corless, California State University-SacramentoDonna Phillips, University of Houston-Downtown
Thomas Beirne, Jr., California State [email protected]
ABSTRACT
Because of the 2002 Sarbanes Oxley Act (SOX), auditors of public companies must now adhereto an unprecedented list of requirements. SOX has already had a major impact on large CPA firms,and some accountants are concerned about possible state-enacted SOX-type legislation and the impactsuch legislation may have on their practice.
Indeed, until recently, proposed reforms of the public accounting profession have had no impacton smaller firms. For example, there has been debate about whether large CPA firms should doconsulting work for their audit clients but smaller firms have not been included in this debate. Now,the provision of other kinds of services is also being questioned. Of major concern is that small CPAfirms will cease to perform audits if regulation continues to escalate. Recent evidence supports theconcern that audit firms are ceasing to perform SEC audits.
As in many states, the California State Legislature will determine how the SOX act will beimplemented for California CPA firms. The purpose of this paper is to present results of a surveyquestioning how CPAs in the Sacramento, California area perceive the need for legislative reform onspecific items and the effect such reform might have on their firms. The paper also includes apresentation and discussion of recent SOX-type legislative efforts in various states.
Results of the survey reveal that audit partners of small CPA firms take a negative view towardincreased regulation posed by possible state SOX-type legislation. Of particular concern are possiblerestrictions on audit partner rotation and rotation of audit firms. The paper contains several commentsfurnished by the survey respondents and are quite revealing. For example, one of the CPAscommented… "If the accounting profession really needs legislation to govern it, then it is a really sadday for the profession…and the term "professional" no longer has the meaning it had when I first joinedthe profession."

page 24 Allied Academies International Conference
Las Vegas, 2005 Proceedings of the Academy of Accounting and Financial Studies, Volume 10, Number 2
Allied Academies International Conference page 25
Proceedings of the Academy of Accounting and Financial Studies, Volume 10, Number 2 Las Vegas, 2005
THE EFFECTS OF EXPECTATION FORMATIONON DETECTING UNEXPECTED NON-CHANGES
IN ACCOUNT BALANCES DURING ANALYTICALPROCEDURES
Charles P. Cullinan, Bryant [email protected]
Susan B. Hughes, Butler University
ABSTRACT
The effectiveness of audit analytical procedures in identifying financial statement misstatementshas been studied from a variety of perspectives. Most analytical procedures research uses unexpectedchanges in an account balance or ratio to signal a possible misstatement. Some recent misstatements(e.g., Cendant, WorldCom) have involved financial statement accounts remaining the same when theyshould have changed (i.e., an unexpected non-change). This research assesses whether auditors formingexpectations are more sensitive to unexpected non-changes in account balances than auditors notforming expectations. Seventy nine auditors from three different firms participated in an experimentalanalytical procedure that contained both an unexpected change and an unexpected non-change in aclient’s accounts. Results indicate that explicit expectation formation increases auditor’s sensitivity tounexpected changes in accounts. In the unexpected non-change situation, however, there was nodifference between auditors forming expectations and those not forming expectations. Those with moreexperience were more sensitive to the risk implications of unexpected non-changes.
Keywords: Analytical procedures, expectation formation, audit experience.

page 26 Allied Academies International Conference
Las Vegas, 2005 Proceedings of the Academy of Accounting and Financial Studies, Volume 10, Number 2

Allied Academies International Conference page 27
Proceedings of the Academy of Accounting and Financial Studies, Volume 10, Number 2 Las Vegas, 2005
THE VALUE RELEVANCE OF VALUE ADDEDAND STAKEHOLDER COMPENSATION ACROSS
BUSINESS CULTURESJohn Darcy, The University of Texas - Pan American
ABSTRACT
Several prior studies indicate that value added is more value relevant or informative than netincome for U.S. companies. In addition, stakeholder theory suggests that lower degrees of informationasymmetry in stakeholder-oriented Japanese and German companies means that value added will bemore value relevant for those companies than for shareholder-oriented U.S. or U.K. companies. Thisstudy examines the value relevance of value added and two stakeholder compensation components ofvalue added, employee compensation and interest, in samples of companies from the U.S., the U.K.,Japan, and Germany.
Results of the relative value relevance tests indicate that income is more value relevant thanvalue added in all countries other than the U.S. Cross-country tests of the relative value relevance ofvalue added and income do not support the proposition that the value relevance of value added isrelated to whether a company is located in a shareholder-oriented or stakeholder-oriented businessculture. Cross-sectional value relevance tests support the proposition that wages provide incrementalvalue relevance for Japanese and U.K. companies, but not for German or U.S. companies.

page 28 Allied Academies International Conference
Las Vegas, 2005 Proceedings of the Academy of Accounting and Financial Studies, Volume 10, Number 2

Allied Academies International Conference page 29
Proceedings of the Academy of Accounting and Financial Studies, Volume 10, Number 2 Las Vegas, 2005
WALL STREET JOURNAL DISTRESSDISCLOSURES AND BANKRUPTCY RESEARCH
Mark C. Dawkins, University of GeorgiaEna Rose-Green, Southern Illinois University Edwardsville
ABSTRACT
This study assesses the extent to which the Wall Street Journal (WSJ) is a useful and reliablesource of distress disclosures for bankruptcy research. Prior accounting and finance studies documentthe importance of controlling for distress disclosures in bankruptcy research. These studies identifydistress disclosures from numerous sources: 8-Ks, 10-Ks, NT10-Ks, LEXIS, annual reports, Moody'sIndustrial Manuals, the F&S Index of Corporate Changes, the Dow Jones News Service, and the WSJ.Some sources are costly (e.g., 8-Ks, 10-Ks, NT10-Ks, and the Dow Jones News Service), while othersources do not provide timely distress disclosures (e.g., LEXIS, annual reports, Moody's IndustrialManuals, and the F&S Index of Corporate Changes). This study focuses on the WSJ since it potentiallyrepresents a low-cost, timely, and widely-disseminated source of distress disclosure information. Wefirst construct an aggregate WSJ distress disclosure measure, and find that this aggregate WSJ distressdisclosure measure mitigates bankruptcy filing price reactions. We then examine WSJ reporting of sixtypes of distress disclosures, and find that three types of WSJ distress disclosures mitigate bankruptcyfiling price reactions: qualified audit opinions, technical defaults, and possible bankruptcy filings. TheWSJ thus provides a useful and reliable source of distress disclosures for bankruptcy research.

page 30 Allied Academies International Conference
Las Vegas, 2005 Proceedings of the Academy of Accounting and Financial Studies, Volume 10, Number 2

Allied Academies International Conference page 31
Proceedings of the Academy of Accounting and Financial Studies, Volume 10, Number 2 Las Vegas, 2005
MARKET REACTIONS TO TERRORIST INCIDENTS:AN ANALYSIS
Prakash Dheeriya, California State University-Dominguez Hills
ABSTRACT
The recent bombings of the London underground stations have again brought the issue ofterrorism to the forefront. This paper focuses on the impact of terrorist incidents on stock marketreturns. We make use of data on terrorist incidents provided by the US Department of State, and stockmarket return data to see if stock markets are significantly impacted by terrorist incidents. Results ofour study indicate that the number of people killed in terrorist incidents is the only significant variableaffecting stock market returns.
INTRODUCTION
In the aftermath of the unfortunate events of September 11, 2001, terrorism is no longer anisolated challenge of a distant region. Increasingly, it is becoming a significant operational and businessrisk element that has the potential of causing large losses, both in terms of property damage and humantoll. In the past few years, terrorism has evolved into a valid transnational matter (National Commissionon Terrorism, 2000). According to the U.S. Congress Joint Economic Committee, terrorism has fourprimary economic impacts: the reduction of capital stock, increased uncertainity levels, increasedcounter-terrorism and security expenses, and industry specific negative impact (such as insurance ortravel/tourism). (United States Congress, Joint Economic Committee, 2002).
The purpose of this study is to investigate if terrorist attacks significantly impact the level ofstock market activity. This paper will review current related literature, discuss data collection andanalysis, and explain statistical methodology employed. The paper will conclude with implications forpolicy makers, both nationally and internationally.
LITERATURE REVIEW
While newspaper articles and discussions in television media regarding the economic impactof the terrorist attacks on September 11, 2001 are in abundance, not many studies have examined theimpact of other terrorist attacks on the stock markets using any scientific approach. Most ofconclusions reached are based on speculation and conjecture. However, there have been very fewstudies detailing the impact of terrorist activities. Chen and Siems (2004) investigate the effects ofterrorism on global capital markets using 14 different terrorist/military attacks. They found that “U.S.capital markets are more resilient than in the past and recover sooner from terrorist attacks than otherglobal capital markets”. According to Chen and Siems (2004), the ‘flight to quality’ behavior ofinvestors has the potential of turning a market bearish and into chaos.
A study by International Monetary Fund (2001) reviewed market trends prior to September 11,2001 terrorist attacks. It analyzed the impact into short-term macroeconomic channels (destruction oflife and property, the confidence level, financial market responses and commodity markets.) The firstchannel, destruction of life, included not only the loss of human life but also the temporarypostponement or loss of services such as the NYSE shut-down period, ceased airline travel, and delayedpostal service due to biological threats. The second channel, the confidence channel, addressed theindividual and corporate hesitations to have confidence in the market and to buy instead of save. Thethird channel, financial market response, looked at the short-term impact of financial instruments that

page 32 Allied Academies International Conference
Las Vegas, 2005 Proceedings of the Academy of Accounting and Financial Studies, Volume 10, Number 2
involve funding commitments over a period of time such as “equity and bond markets trade securitiesinvolving future dividend or coupon payments by corporations or governments”. The fourth channel,commodity markets, considered the demand lag and commodity weakening due to concerns with supplydisruption because of terrorist attacks.(IMF, 2001)
Abadie and Gardeazabal (2005) employ an economic model to explain the effects of terrorismon international capital flows. Implicit in the model is the idea that terrorism not only increasesuncertainity but it also “reduces the expected return to investment”. They conclude that “changes in theintensity of terrorism have an ambiguous effect on the overall investment position of the world …andmay cause large sudden movements of capital across countries.” (Abadie and Gardeazabal, 2005).
According to Neely (2004), the Federal Reserve responded to Sept 11, 2001 by instantlyincreasing the amount of liquidity five times more than the average on Sept 12. In the previous financialcrises, the Fed has stepped in with enough liquidity to forestall any adverse shocks to the system.
MODEL AND DATA
The purpose of this paper is to investigate the relationship between terrorist incidents and theconsequent impact on level of stock prices. To conduct this investigation, we develop a regressionmodel to explain the linkages between terrorist attacks, number of people killed and/or injured andwhether or not the incident took place in the same location as a major world financial center on closingprices on the New York Stock Exchange. The model tested was:
yt = fn (Tt, kt, lt) where
yt = change in level of a NYSE index on day t (measured by the % change in NYSE CompositeIndex or % change in NYSE World Leaders Index)Tt = a dummy variable that takes the value 1 if a terrorist incident took placekt = a variable measuring the severity of terrorist incident (number of people killed)and lt = a dummy variable indicating whether the incident took place in the same location as amajor world financial center.
The above model was estimated using closing price for the NYSE Composite Index as thedependent variable. The Composite Index “consists of all common stocks listed on the NYSE…andprovides an exceptional breadth of diversification, at it includes U.S. as well as non-U.S. companiesfrom a wide range of economic sectors” (NYSE, 2005). The Composite Index was selected as adependent variable because it represented 78% of the U.S. total market capitalization and 66% of theworld’s total market capitalization. It also has a 90% correlation to the overall U.S. equity market(NYSE, 2005).
To see if there is an impact on global stocks, we also estimated the model using the NYSEWorld Leaders index. This index consists of components from the U.S. 100 and International 100indexes. The NYSE World Leaders Index tracks, as a single asset class, the performance of 200 trueworld leaders across 10 industry sectors and all regions of the world. It tracks the performance of 200true world leaders across 19 countries …[representing] 37% of the world’s total marketcapitalization…with nearly $10 trillion in market capitalization” (NYSE, 2005).
We collected closing price data for indexes between the dates August 20, 2001 and September11, 2002 because the September 11, 2001 terrorist incident on U.S. soil was the largest attack to dateand seemingly had the greatest impact on the international financial markets. The sample included datafrom 263 trading days.
To measure the presence of a terrorist incidence, we employed the list of significant terroristincidents published by the U.S. Department of State. This chronology provided an incident date, thenumber of individuals killed and/or wounded in relation to the incident, the incident location and a brief
Allied Academies International Conference page 33
Proceedings of the Academy of Accounting and Financial Studies, Volume 10, Number 2 Las Vegas, 2005
description of the incident itself. Numerically, the terrorist attack data was recorded as “0” for noterrorist attack that day and as “1” if there was a terrorist incident on that given day. The data sample(from August 20, 2001 through September 11, 2002) included 39 terrorist incidents.
The “number of people killed and/or injured” data was also extracted from the U.S. Departmentof State’s terrorist incident chronology listing. In addition, data regarding the October and November2001 anthrax attacks was obtained from the Federation of American Scientists study (Hatch-Rosenberg,2005). In instances where one or more incidents occurred on the same day, numbers were combined.For example, on January 22, 2002 there were two separate terrorist attacks. There was a drive-byshooting at a U.S. Consulate in Calcutta, India killing 5 and wounding 13. There was also a bombexplosion in Kashmir that killed 3 and injured 9 that day. The dummy variable took on the value 0 ifthere were no terrorist attacks and therefore no resulting deaths or injuries. The dummy variableindicating location of terrorist incident was recorded as “0” if the terrorist attack did not occur in oneof the locations1 or if there was no attack and “1” if there was an attack in the same location as a majorworld financial center.
If a terrorist attack occurred on a non-trading day, the attack was recorded on the next open day.2
Our null hypothesis is that there is no relationship between variables measuring a terroristincident and stock market levels. The regression model estimated was:
yt = b1 + b2kt + b3lt + ut
where kt and lt measure the number of people killed and location of terrorist incident, respectively. Theerror term, ut is assumed to be distributed normally.
RESULTS AND CONCLUSIONS
Results indicate that only the number of people killed in a terrorist incident significantlyaffected stock market returns.
[INSERT TABLES 1 & 2 HERE]
This was true regardless of the index that was used in the analysis. Suspecting multicollinearitybetween independent variables, we ran the regression using number of people killed and location ofincident. Results were no different. The number of people killed in terrorist incidents was the onlysignificant variable explaining the change in stock market activity.3
The September 11, 2001 terrorist attacks undoubtedly had a negative impact on the worldeconomy and international stock market. The New York Stock Exchange was shut down for four days,impacting not only domestic trading but also international trade. While there is no argument for theglobal financial crisis the September 11, 2001 terrorist attacks caused, our analysis indicates that theseverity of the attack, as measured by number of people killed, significantly impacts international stockprices. Unfortunately, many terrorist attacks happen in the world multiple times a year as evidencedby the 39 incidents in the August 20, 2001 through September 11, 2002 data sample. The majority ofthese terrorist attacks kill and wound small numbers of people, occur in financially low visibilitylocations, and may be relatively unannounced by the international news media. This is perhaps anexplanation of why the location of terrorist attacks generally do not affect stock market returns.
This research could be expanded to include the data beyond 2002, especially with the recentsignificant terrorist attacks in London. Future studies may also want to look at market capitalizationstatistics in the NYSE World Leaders Index and Composite Index. Data from international stockmarkets such as the London Stock Exchange could also be incorporated. Other avenues of potentialinvestigation include monitoring the level of media coverage regarding a terrorist attack and reviewing

page 34 Allied Academies International Conference
Las Vegas, 2005 Proceedings of the Academy of Accounting and Financial Studies, Volume 10, Number 2
the significance of an attack on a trading or non-trading day. It would also be interesting to use the U.S.Department of Homeland Security’s data on threat levels and regress this variable against the stockmarket data to determine if the terrorism level (color) has a significant impact on stock marketfluctuation.
ENDNOTES
1. Major international offshore financial centers included: Belize, Panama, Cayman Islands, Aruba, Bahamas,Bermuda, Turks and Caicos, Virgin Isles, Anguilla, Antigua, Barbados, Montserrat, Netherlands Antilles, Alderney,Jersey and Guernsey, Dublin, Gibraltar, Isle of Man, Monaco, Malta, Dubai, Cyprus, Switzerland, Liechtenstein,Luxembourg, Bahrain, Singapore, Hong Kong, Mauritius, Labuan, Vanuatu, Western Samoa, and the Cook Islands(Eiteman, Stonehill, and Moffett, 2004).
2. For example, on December 1, 2001, two suicide bombers attacked a Jerusalem shopping mall, killing 10 personsand wounding 170 and on December 2, 2001, a suicide bomb attack aboard a bus in Haifa, Israel, killed 15 personsand wounded 40 (US Department of State, 2005). Those two days were a Saturday and a Sunday, respectively.Since neither of these incidents occurred on a trading day, both were logged on the next open trading day which wasDecember 3, 2001.
3. We ran several regressions, using one independent variable at a time. In all cases, results were uniformly consistent.The number of people killed seemed to be the only significant explanatory variable.
REFERENCES
Abadie, Alberto and Gardeazabal, Javier (July 2005). Terrorism and the World Economy. Working Paper, RetrievedSeptember 2, 2005, from http://ksghome.harvard.edu/~aabadie/twe.pdf
Chen, Andrew H. and Siems, Thomas F. (2004). The effects of terrorism on global capital markets. The European Journalof Political Economy, 20, 349–366.
Eiteman, David K., Stonehill, Arthur I., and Moffett, Michael H. (2004). Multinational Business Finance. PearsonEducation, p. 507.
Hatch-Rosenberg,Barbara. Analysis of the Anthrax Attacks (n.d.) Retrieved September 2, 2005, fromhttp://www.fas.org/bwc/news/anthraxreport.htm
International Monetary Fund (December 2001). The global economy after September 11. World Economic Outlook.Retrieved September 2, 2005, from http://imf.org/external/pubs/ft/weo/2001/03/pdf/chapter2.pdf
National Commission on Terrorism (2000). Countering the Changing Threat of International Terrorism. RetrievedSeptember 2, 2005, from http://www.fas.org/irp/threat/commission.html
Neely, Christopher J. (March/April 2004). The Federal reserve responds to crises: September 11th was not the first. FederalReserve Bank of St. Louis Review, 86(2), pp. 27-42. Retrieved September 2,, 2005, fromhttp://research.stlouisfed.org/publications/review/04/03/Neely.pdf NYSE Statistics Archive: NYSE Daily Index Closes(n.d.) Retrieved September 2, 2005, from http://www.nyse.com/marketinfo/datalib/1022221393023.html#Indices
NYSE Indexes, (n.d.) Retrieved September 2, 2005 from http://www.nyse.com/pdfs/NyseIndexes.pdf
Significant Terrorist Incidents, 1961-2003: A Brief Chronology (n.d.) Retrieved September 2, 2005, fromhttp://www.state.gov/r/pa/ho/pubs/fs/5902.htm
United States Congress, Joint Economic Committee (2002). The Economic Costs of Terrorism. Retrieved September 2,2005, from http://www.house.gov/jec/perform.htm
TABLES
Available from the author upon request

Allied Academies International Conference page 35
Proceedings of the Academy of Accounting and Financial Studies, Volume 10, Number 2 Las Vegas, 2005
AN ANALYSIS OF THE INITIAL ADOPTION OF FAS141 AND 142 IN THE PHARMACEUTICAL INDUSTRY
Jonathan Duchac, Wake Forest [email protected]
Ed Douthett, George Mason [email protected]
ABSTRACT
In 2001 the Financial Accounting Standards Board issued FAS 141 Business Combinations, andFAS 142 Goodwill and Intangible Assets. These new accounting standards significantly changed theaccounting for mergers and acquisitions, dramatically altering how business combinations are reflectedin the surviving company’s financial statements. These new rules are particularly relevant forcompanies in industries that rely heavily on intellectual capital to generate future cash flows, or thosethat are characterized by considerable mergers and acquisitions activity.
Documenting how these new standards are initially applied provides valuable insight into theirimpact on the structure and content of the resulting financial statements. This study addresses this issueby examining and documenting initial FAS 141 and 142 disclosures for firms in the pharmaceuticalindustry. We focus on the pharmaceutical industry because it is dominated by a few well definedbusiness models, and is characterized by firms that rely heavily on intangible assets and haveconsiderable mergers and acquisitions activity.
The results of our analysis identify several emerging trends within the pharmaceutical industry.First, strategic analysis indicates that a variety of business models currently exist in the pharmaceuticalindustry, and most pharmaceutical companies pursue more than one business model. Second, financialdisclosure analysis reveals that although different business models led to some variation in disclosures,disclosure practice across firms in the pharmaceutical industry is fairly consistent. Finally, analysisof recent acquisitions provides evidence of consistent reporting and disclosure of purchase typebusiness combinations under FAS 141 and 142. These results provide a benchmark for industrypractice that can be used to identify trends in financial reporting and disclosure related to these twoaccounting standards.

page 36 Allied Academies International Conference
Las Vegas, 2005 Proceedings of the Academy of Accounting and Financial Studies, Volume 10, Number 2

Allied Academies International Conference page 37
Proceedings of the Academy of Accounting and Financial Studies, Volume 10, Number 2 Las Vegas, 2005
THE DEATH OF THE ESTATE TAX:PROS AND CONS
Janet Dye, University of Alaska [email protected]
ABSTRACT
Congress is currently considering legislation to repeal the estate tax. Debate over the issue hasbeen heated. Proponents of ending the so-called death tax argue it hurts small businesses and farmersby forcing liquidation of family firms to pay the transfer taxes. Supporters of continuing the tax claimit encourages charitable donations, contributes greatly needed revenue to the government coffers, haslittle or no impact on small businesses, and is necessary to prevent the concentration of wealth in thehands of an elite few. This paper examines the support behind the claims and whether repeal of theestate tax might actually increase the overall taxes collected from family wealth transfers in the longrun.

page 38 Allied Academies International Conference
Las Vegas, 2005 Proceedings of the Academy of Accounting and Financial Studies, Volume 10, Number 2

Allied Academies International Conference page 39
Proceedings of the Academy of Accounting and Financial Studies, Volume 10, Number 2 Las Vegas, 2005
ENGAGEMENT RISK: A PRELIMINARY ANALYSIS OFAUDIT FIRM’S CLIENT ACCEPTANCE DECISIONS
Jack R. Ethridge, Stephen F. Austin State [email protected]
Treba Lilley Marsh, Stephen F. Austin State [email protected]
Kurt Canfield, Deloitte
ABSTRACT
The audit function creates several important relationships among the various parties. One ofthe most significant and potentially problematic relationships is between the audit firm and the auditclient. Accordingly, the decision by the audit firm to accept or retain a client is crucial because of thepotential risk of being associated with certain clients. This risk is called engagement risk. The potentialdamage can range from financial loss, loss of prestige, to the ultimate demise of the audit firm.Engagement risk is considered to be composed of three components: client’s business risk, audit risk,and auditor’s business risk.
Based upon previous research, it appears that auditing firms may not have significantlychanged their opinion about the importance of engagement risk in the post-Enron environment. Thisresearch questioned whether audit firms have significantly changed their views regarding engagementrisk and how they evaluate and manage this risk. A questionnaire was mailed to audit partners in thesouthwest region of the United States. A total of sixty-one useable responses was received and wasconsidered adequate for this preliminary study.
An analysis of the surveys revealed that 85 percent of the respondents believed their viewsregarding the importance of engagement risk have changed, but only to a moderate degree. In addition,90 percent of the respondents indicated they have standards in place to deal with clientacceptance/retention decisions. However, these standards were not considered to be very extensive.This may be because approximately 90 percent of the audit firms consider their clients low to moderaterisk clients. In evaluating engagement risk, audit partners considered management integrity to be themost important factor, followed by the effect on audit firm solvency. In addition, strategies (i.e. use ofspecialists, increased fees, etc.) to mitigate risks of being associated with clients were only used by 35percent of the respondents.
Based upon our preliminary results, it appears there has not been significant changes in auditpartners’ views regarding the importance of the client acceptance/retention decision. This study waslimited by regional impact and small sample size; therefore, the findings cannot be generalized.
Research funded by Stephen F. Austin State University Minigrant

page 40 Allied Academies International Conference
Las Vegas, 2005 Proceedings of the Academy of Accounting and Financial Studies, Volume 10, Number 2

Allied Academies International Conference page 41
Proceedings of the Academy of Accounting and Financial Studies, Volume 10, Number 2 Las Vegas, 2005
ACTIVE LEARNING: AN EMPIRICAL STUDY OFTHE USE OF SIMULATION GAMES IN THE
INTRODUCTORY FINANCIAL ACCOUNTING CLASSLou Fowler, Missouri Western State University
ABSTRACT
One of the major criticisms of accounting education today is that it is too oriented towardmemorization and produces graduates that are incapable of critical thinking and independentevaluation. This paper compares the use of the traditional lecture format using debit/credit journalingto the use of an active learning format using case analysis and a simulation game. The author’shypothesis is that the traditional pedagogy encourages lower level skills of Bloom’s taxonomy whichinvolve the ability to memorize and recall information. However the active learning format shouldresult in higher level skills on Bloom’s taxonomy which involve critical thinking. Both pedagogies are tested using a quiz constructed to follow Blooms taxonomy of learning. The quizhas questions that range from the ability to recall knowledge up to the ability to evaluate and makejudgments about material presented and the methods involved. Two introductory financial accountingclasses were designated as either the control class, which received the traditional lecture based format,or the treatment group which received the active learning format. Both classes received the same quiz,had the same instructor and the same textbook.
Contrary to what the evaluator was expecting, there were no significant differences between thetwo groups on any of the scales of Blooms taxonomy. One cannot help but wonder if the ability to thinkcritically and come to independent conclusions may be one of those skills that are hard-wired into ourbrains at an early age and can become very difficult to learn later? Or could it be that students, whoare proficient in memorization and prefer procedural methods, are more likely to choose accountingas a major? Answers to these questions, and more like them, are crucial in addressing the criticismsthat are being leveled at accounting education today and certainly warrant further research.
INTRODUCTION
Practice sets, debits/credits and the techniques of the accounting system are still the focus ofaccounting educators in the introductory financial accounting class today. Although one would guessthat these time honored techniques are effective, there has been little empirical evidence to support that.There has also been a growing concern that those techniques produce graduates that are good atmemorizing and processing data but not effective in developing graduates with critical thinking andindependent evaluation skills. Accounting educators, practitioners and students agree that accountingeducation has become increasingly procedure and knowledge oriented. According to the AccountingEducation Change Commission (AECC 1990), the curriculum for general education should developstudents that have the capacities for inquiry, abstract logical thinking and critical analysis. The AECCfurther identified (AECC 1992) that the first introductory accounting class should have as its’ objectivethe requirement that students be able to critically analyze and solve unstructured problems. Thesesentiments and others like them calling for change in accounting education have come from highlyrespected sources such as the American Accounting Association, the Institute of ManagementAccountants and American Institute of Certified Public Accounting.

page 42 Allied Academies International Conference
Las Vegas, 2005 Proceedings of the Academy of Accounting and Financial Studies, Volume 10, Number 2
RELATED RESEARCH AND HYPOTHESIS
In recent years accounting educators have made many efforts to respond to the demands forchange. A great deal of that research has focused on different types of active learning techniques.(Barkman 1998), (Hassall 1998) studied the effects of using case analysis to promote critical thinking.(Beets 2003) studied the effects of learning in groups. Alder and Milne studied the motivation behindproblem-based learning (Alder and Milne, 1997 ). (McEwen 1994) considers case studies and problemsolving as the most effective teaching method for developing critical thinking skills.
How to measure critical thinking has in itself been a topic of much discussion. The mostinfluential and widely recognized work in critical thinking is the Taxonomy of Educational Objectives(Bloom, et al. 1974). It was developed by a committee of college and university examiners andpublished as two handbooks- Cognitive Domain and Affective Domain. The categories listed inBloom’s range from what is referred to as lower level thinking skills such as knowledge, comprehensionand application to the higher level skills analysis, synthesis and evaluation.
In an effort to develop and measure critical thinking in the classroom, most educators strive toask questions that evokes the student’s abilities to reach the higher level thinking skills. Researchershave used many forms of active learning techniques to try to stimulate and measure those qualities(Burns, et al. 1990). Most agree that passive learning through reading and lectures, which havetraditionally been used, are thought to evoke lower level thinking. While interactive techniques likethose found in active learning evoke higher level skills (Gentry 1990).
In an effort to shed light on the subject, the author designed a study to capture the quantitativedifferences between active and passive learning in developing critical thinking and evaluation skills.The null hypothesis is that active learning will yield the same results as traditional learning in increasinghigher order thinking.
METHODOLOGY
At a Midwestern college, 101 students agreed to participate in a study that was conducted in theIntroductory Financial Accounting class. The study spanned two semesters. In each semester one classwas designated as the treatment group and the other class as the control group. The treatment groupreceived the active learning techniques to learn the difference between cash based accounting and fullaccrual accounting. The other class (control group) was given the traditional lecture format in anattempt to learn the same concepts. All classes had the same teacher, the same textbook, and were inthe same size and type of classroom. The average ACT in all four groups of students ranged from 20.5to 21. Each group received the same post-test. No pre-test was given because the topic tested over wasnew material for each group.
The treatment group received a case that involved a short scenario that covered a fullaccounting cycle (one month) of a lawn-mowing service. This was first done on a cash basis by usingplay money similar to that used in Monopoly. Groups of 4-5 students were formed and the group tookthe position of the business owner. The instructor assumed the role of various other parties that theowner conducted business with and cash actually changed hands as the transactions occurred. Thestudents were then asked to discuss the business’ success within the group and come up with aconsensus as to how well the business had fared.
The students were given the same case again. This time no cash was involved and instead thegroups were asked to use full accrual accounting and the accounting equation format. This required thestudents to analyze the transactions and identify which, if any, needed to be recorded. They had todetermine what accounts would be involved, and how that would effect the financial statements. Thestudents then discussed the results of the full accrual method and how it differed from the cash basis.To measure learning each student was asked to independently complete a ten point quiz. The quiz was

Allied Academies International Conference page 43
Proceedings of the Academy of Accounting and Financial Studies, Volume 10, Number 2 Las Vegas, 2005
created by the instructor and contained questions that were constructed to follow each domain ofBloom’s Taxonomy: Knowledge, Comprehension, Application, Analysis, Synthesis and Evaluation.
Students in the control group, were given the traditional lecture delivery of the same concepts,cash basis accounting and how it differs from accrual basis accounting. As usual students were shownsome exercises from the text and these were solved by recording debit/credit entries in the generaljournal format. Each student then completed the same quiz that had been given to the treatment group.Neither group was aware that the other group was involved until after the quizzes were returned in thenext class period.
RESULTS
As can be seen from Table 1, the difference in the means in the upper levels of Bloom’staxonomy indicate very little difference between the active learning group and the traditional lecturegroup. Therefore, the null hypotheses cannot be rejected.
Table 1 Descriptive Statistics for performance on domains of Bloom’s TaxonomyDomain Active Learning Group
N = 49Traditional Lecture Group
N = 52Difference Between Group
MeansMean SD Mean SD
Knowledge .86 .35 .78 .42 .08Comprehension .52 .50 .39 .49 .13Application .25 .43 .43 .50 -.18Analysis .41 .49 .39 .49 .02Synthesis .34 .48 .31 .47 .03Evaluation .36 .46 .33 .47 .03
DISCUSSIONS AND CONCLUSIONS
So what can we conclude from these results? Although this author found no significantdifferences between active learning and traditional passive learning, one cannot help but wonder if alongitudinal study covering the same groups of students over an extended period of time might yielddifferent results. However, those types of studies are often difficult to arrange. The logistics involvedin tracking the same groups over several semesters is daunting. Also, by its very nature active learningdoes not lend itself well to rigorous research design. Random selection of treatment and control groups,standardized pre-and post-tests, student-teacher relationships, class size and classroom features are oftendifficult to control and even more difficult to measure.
Jerry Gosenpud, (Gosenpud 1990) has done a monumental amount of work in reviewing theliterature about experiential learning research and has published a comprehensive evaluationsummarizing the results. The majority of the studies reviewed by Gosenpud, found no differencebetween the experiential and the traditional pedagogies. According to Gosenpud, “it should betentatively concluded that in university classrooms the experiential method is no better or worse thanother teaching methods for enhancing cognitive learning”.
Considering that one can do no harm with the active learning techniques perhaps a betterquestion would be “What would the students prefer?” Anecdotal evidence from student feedbackindicated that they enjoyed the active learning environment more and that they thought they had a bettergrasp of the material.

page 44 Allied Academies International Conference
Las Vegas, 2005 Proceedings of the Academy of Accounting and Financial Studies, Volume 10, Number 2
REFERENCES
Accounting Education Change Commission (AECC). 1990. Objectives of education for accountants: Position statementnumber one. Issues in Accounting Education (Fall): 307-312.
______1992. The first course in accounting: Position Statement Number Two. Issues in Accounting Education (Fall): 249-251.
Alder, R.W., and M.J. Milne. 1997. Improving the quality of accounting students’ learning through action-oriented learningtasks. Accounting Education 6(2): 191-215.
Barkman, A. I. 1998. The use of live cases in the accounting information systems course. Journal of Accounting Education16 (3): 507-516.
Beets, S. D. 2003. Differences In Student Leaning Techniques: Cooperative Learning, Quizzes, And Homework. Journalof the Academy of Business Education (Fall) 1-11.
Bloom, Benjamin S. and others. 1974. The Taxonomy of Educational Objectives: Affective and Cognitive Domains. NewYork: David McKay Company, Inc.
Burns A. C., J.W. Gentry, and J. Wolfe. 1990. A Cornucopia of Considerations in Evaluating the Effectiveness of ExperientialPedagogies. In Gentry, J.W. (Eds.), Guide to Business Gaming and Experiential Learning. (253-278). EastBrunswick NJ: Nichols/GP Publishing.
Gentry, J.W. 1990. What is Experiential Learning? In Gentry, J.W. (Eds.), Guide to Business Gaming and ExperientialLearning. (9-20). East Brunswick NJ: Nichols/GP Publishing.
Gosenpud, J. 1990. Evaluation of Experiential Learning. In Gentry, J.W. (Eds.), Guide to Business Gaming and ExperientialLearning. (301-329). East Brunswick NJ: Nichols/GP Publishing.
Hassall, T., S. Lewis, and M. Broadbent. 1998. Teaching and learning using case studies: A teaching note. AccountingEducation 7 (4): 325-334.
McEwen, B. C. 1994. Teaching Critical Thinking Skills in Business Education. Journal of Education for Business. 7 (2):99-103.

Allied Academies International Conference page 45
Proceedings of the Academy of Accounting and Financial Studies, Volume 10, Number 2 Las Vegas, 2005
ACADEMIC DISHONESTY:A PREDICTOR OF EMPLOYEE DEVIANCE
Sharron M. Graves, Stephen F. Austin State [email protected]
ABSTRACT
Many research and media reports have addressed the pervasiveness of academic dishonestyamong college students. In a study conducted by J. S. Baird in 1980, 75% of undergraduate business,liberal arts and education majors reported cheating in college. The same percentage was supportedby a research study conducted by D. L. McCabe in 1997. Some research studies report that thepercentage is as high as 95%.
This research investigates whether the level and severity of academic dishonesty relate toemployee deviance which is defined as any conduct that is detrimental to the organization and theemployee. Employee theft is at one extreme of employee deviance and counter productive behavior,such as surfing the web for personal use during working hours, is at the other extreme. Two groups ofbusiness students, accounting and non accounting majors, at multiple academic levels were surveyedto determine their academic behavior and their reported involvement in actual property and/orproduction deviance. Universities have long been concerned about the issue of academic dishonesty. This research indicates that employers should be equally concerned because students who admit toacademic dishonesty also admit to property and/or production deviant behavior. In addition, nonaccounting majors reported a higher level of deviant behavior than accounting majors.

page 46 Allied Academies International Conference
Las Vegas, 2005 Proceedings of the Academy of Accounting and Financial Studies, Volume 10, Number 2

Allied Academies International Conference page 47
Proceedings of the Academy of Accounting and Financial Studies, Volume 10, Number 2 Las Vegas, 2005
TOWARD AN ORDERED MARKET HYPOTHESIS:EVIDENCE AGAINST ACCEPTED THEORY
David Harris, Institute for Scientific [email protected]
ABSTRACT
This article uses the data provided by a portfolio at marketocracy.com that was managed incompliance with those for a diversified management investment company and compares it to the threeprincipal indices, the Standard and Poors 500 (S&P), the Dow Jones Industrial Average (DJIA) andthe NASDAQ 100 (NASDAQ). The author also managed parallel real portfolios, but they lack theindependent accounting provided by marketocracy.com. Returns were nominally different. There issufficient variation within the portfolio and the indices themselves to disprove the validity of the CAPMand to call deeply into question Black-Scholes.
On August 23, 2001, the portfolio in this case study began operations. The data from the firstyear of the portfolio is sufficient for the analysis in this article. The portfolio was managed by theauthor using traditional methods described by Drs. Graham and Dodd in their work, “SecuritiesAnalysis,” and in other subsequent works. The portfolio attempted to purchase securities deeplydiscounted to any fair estimate of future earnings capacity or cash flow. The securities chosen had highquality balance sheets, generally less debt than their competitors, favored firms that had a central rolein their customers’ markets, and had historical growth rates above the composite rate of the S&P 500.The portfolio was charged daily with a management fee equal to 2% annualized based on each day’snet asset value. Likewise, commissions generally ran about 5 cents per share. Generally the portfolioheld 23-25 stocks and carried an average daily cash balance of $72,404.18. The net cost ofcommissions, management fees and SEC fees less interest earned on cash balances was $32,904.60.The initial portfolio held $1,000,000 and for comparison purposes the three principal indices, the DJIA;the S&P; and the NASDAQ; were adjusted to be equivalent to $1,000,000 on the same starting date,however no fees or other costs were charged against the indices.
ANALYSIS
The portfolio outperformed the indices, against the initial investment of $1,000,000 ending$323,876.10 ahead of the NASDAQ, $262,461.90 ahead of the S&P 500 and $201,623.00 ahead of theDJIA. At the same time, a correlation analysis of first differences showed that Beta=.6277 in the DJIAvs. Portfolio relationship, while r2=.6344 and the t-test showed significance. The results for the otherindices were similar.The implication of this finding, if valid, would be that the portfolio significantly outperformed themarket while engaging in less risk. During the same period, the beta for the S&P 500 and DJIA was.9609 with 93.68% of the variance attributable to the movement of the DJIA. The alpha coefficient wasonly -.0003. While these two principal indices had a very high degree of covariance, the DJIAoutperformed the S&P 500 by $57,787.37 or almost 6% yet with nearly identical risk as implied by theBeta Analysis. The data will show that this relationship was not entirely describable as a memory freerandom walk.
Each of the three major indices, the DJIA, the S&P and the NASDAQ were compared againstthe portfolio and against each other. The chart shows the number of days that each element eitheroutperformed the first listed portfolio or failed to outperform it. It also shows the results of a sign testto determine the likelihood that differences in performance were the result of chance.
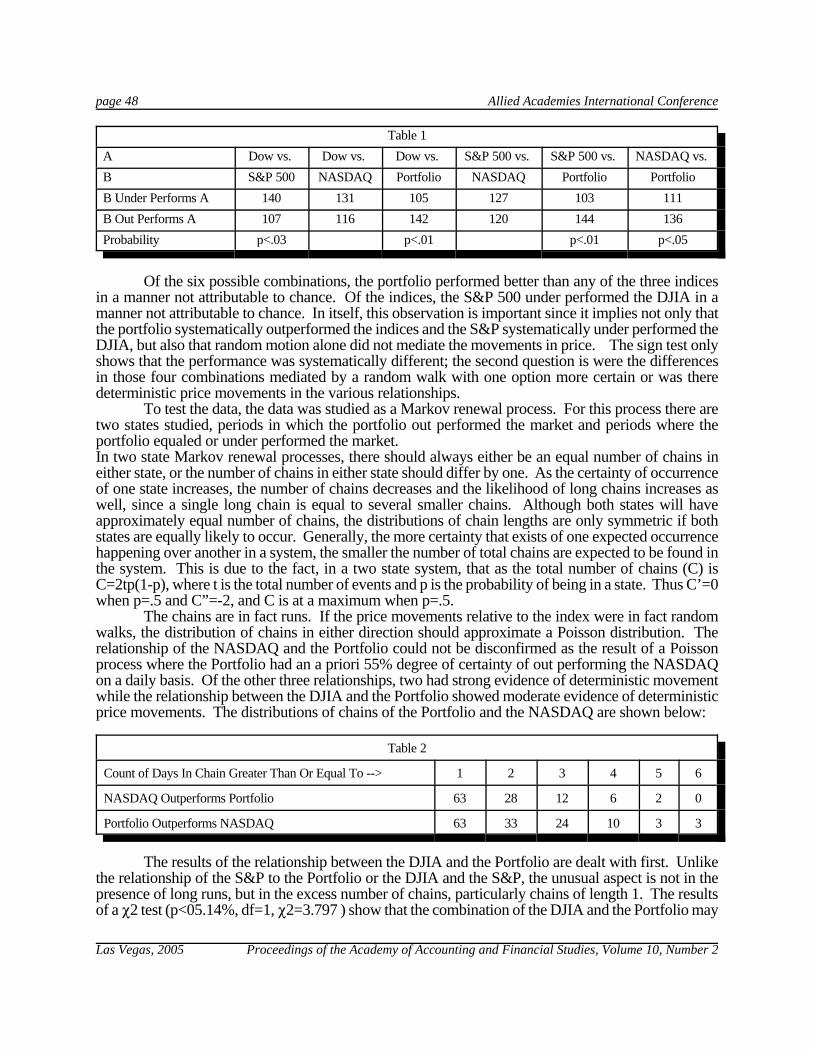
page 48 Allied Academies International Conference
Las Vegas, 2005 Proceedings of the Academy of Accounting and Financial Studies, Volume 10, Number 2
Table 1A Dow vs. Dow vs. Dow vs. S&P 500 vs. S&P 500 vs. NASDAQ vs. B S&P 500 NASDAQ Portfolio NASDAQ Portfolio PortfolioB Under Performs A 140 131 105 127 103 111B Out Performs A 107 116 142 120 144 136Probability p<.03 p<.01 p<.01 p<.05
Of the six possible combinations, the portfolio performed better than any of the three indicesin a manner not attributable to chance. Of the indices, the S&P 500 under performed the DJIA in amanner not attributable to chance. In itself, this observation is important since it implies not only thatthe portfolio systematically outperformed the indices and the S&P systematically under performed theDJIA, but also that random motion alone did not mediate the movements in price. The sign test onlyshows that the performance was systematically different; the second question is were the differencesin those four combinations mediated by a random walk with one option more certain or was theredeterministic price movements in the various relationships.
To test the data, the data was studied as a Markov renewal process. For this process there aretwo states studied, periods in which the portfolio out performed the market and periods where theportfolio equaled or under performed the market. In two state Markov renewal processes, there should always either be an equal number of chains ineither state, or the number of chains in either state should differ by one. As the certainty of occurrenceof one state increases, the number of chains decreases and the likelihood of long chains increases aswell, since a single long chain is equal to several smaller chains. Although both states will haveapproximately equal number of chains, the distributions of chain lengths are only symmetric if bothstates are equally likely to occur. Generally, the more certainty that exists of one expected occurrencehappening over another in a system, the smaller the number of total chains are expected to be found inthe system. This is due to the fact, in a two state system, that as the total number of chains (C) isC=2tp(1-p), where t is the total number of events and p is the probability of being in a state. Thus C’=0when p=.5 and C”=-2, and C is at a maximum when p=.5.
The chains are in fact runs. If the price movements relative to the index were in fact randomwalks, the distribution of chains in either direction should approximate a Poisson distribution. Therelationship of the NASDAQ and the Portfolio could not be disconfirmed as the result of a Poissonprocess where the Portfolio had an a priori 55% degree of certainty of out performing the NASDAQon a daily basis. Of the other three relationships, two had strong evidence of deterministic movementwhile the relationship between the DJIA and the Portfolio showed moderate evidence of deterministicprice movements. The distributions of chains of the Portfolio and the NASDAQ are shown below:
Table 2
Count of Days In Chain Greater Than Or Equal To --> 1 2 3 4 5 6
NASDAQ Outperforms Portfolio 63 28 12 6 2 0
Portfolio Outperforms NASDAQ 63 33 24 10 3 3
The results of the relationship between the DJIA and the Portfolio are dealt with first. Unlikethe relationship of the S&P to the Portfolio or the DJIA and the S&P, the unusual aspect is not in thepresence of long runs, but in the excess number of chains, particularly chains of length 1. The resultsof a P2 test (p<05.14%, df=1, P2=3.797 ) show that the combination of the DJIA and the Portfolio may

Allied Academies International Conference page 49
Proceedings of the Academy of Accounting and Financial Studies, Volume 10, Number 2 Las Vegas, 2005
not have been mediated by a random walk. The large number of chains and especially short chains ishighly unusual, but does not quite pass the generally accepted 5% threshold. However the other tworelationships do.
Table 3Number of Chains of Length 1 Total Number of Chains
Actual Observation 72 134Theoretically Efficient Value 60 121
The DJIA outperformed the S&P during 56.6802% of the days. The S&P had three long runsof underperformance. One run was of nine days in length and two runs were of eleven days in length.The odds of having three or more runs of 9 or more days in length is less than 2.72% while the odds ofhaving two runs of 11 or more days in length is less than 1.84%. The probability is likely smallerhowever. The one run of 9 days in length is only separated from another run of 11 days in length byone day. Between January 23rd, 2002 and February 21, 2002 there was only one trading day, onFebruary 7th, where the S&P out performed the DJIA. During that time, the DJIA appreciated in valueby 1.2446% while the S&P lost 3.427% of its starting value.
Table 4
Count of Days In Chain Greater Than OrEqual To -->
1 2 3 4 5 6 7 8 9 10 11
DJIA Outperforms S&P 60 35 19 6 4 3 3 3 3 2 2
S&P Outperforms DJIA 60 28 11 6 2 0 0 0 0 0 0
While not necessarily significant in itself, p<.0817, there were only 6 chains of out performanceby the DJIA of 4 or longer. Because this value is about 55% of the expected number, the longer runsare even more unusual. If this event is factored into the prospective probabilities, then the probabilityof having three or more runs of nine days in length is less than 0.04784%, while the odds of two or moreruns of length eleven days is less than .02196%.
Table 5
Count of Days In Chain Greater Than OrEqual To -->
1 2 3 4 5 6 7 8 9 10 11
S&P Outperform Portfolio 58 24 12 5 2 2 0 0 0 0 0
Portfolio Outperforms S&P 58 33 17 12 7 5 3 3 2 2 2
The relationship between the S&P and the Portfolio was also probably not mediated entirely bya random walk. Because the Portfolio outperformed the S&P 58.2996% of the time, longer runs are tobe expected. There were two runs of length 11 days where the Portfolio outperformed the S&P. Theprobability of this occurrence is less than 2.9095%. Additionally, there was an additional chain of 8days, p<14.9304%, where the portfolio outperformed the S&P and two chains of 6 days in length wherethe S&P outperformed the portfolio, p<16.6775%. While not significant in themselves, theirpositioning in the data makes them of interest. A visual review of chart 1 shows that the points of long

page 50 Allied Academies International Conference
Las Vegas, 2005 Proceedings of the Academy of Accounting and Financial Studies, Volume 10, Number 2
runs are along the points of disequilibria. They appear to be boundaries between periods of equilibriumand disequilibria. To clarify the path of the price movements, the trailing 10 days median value wassuperimposed upon the data. The two periods of underperformance are in yellow and the three periodsof out performance are in green and blue depending upon the length of the runs.
This same observation on long runs holds for the structure of the DJIA vs. S&P relationship,as shown in chart 2. Green dots are in periods of 11-day runs and blue dots are in the one 9-day run.

Allied Academies International Conference page 51
Proceedings of the Academy of Accounting and Financial Studies, Volume 10, Number 2 Las Vegas, 2005
This has two important implications. First, that on this data set the beta term is not a functionof just the covariance of the data, because the data is not differentiable. For many x there exist multipley terms. There is at least one significant confounding variable that has not been accounted for. Second,traditional Beta Analysis, where first differences are compared is a function of the higher order originaldata. It can be shown that the beta term in traditional Beta Analysis is in fact a function of (dy/dx)(x/y)of the raw data since the first difference terms are an approximation of the elasticity measure. In thisdata set, there does not exist a valid derivative. Since there is no valid function that can describe the rawdata, there does not exist a first difference regression that validly describes the data either. The longtransition between equilibrium states for the portfolio and the S&P 500 lasted 157 days. Given thestructure of the portfolio at the end of the transition, it would be difficult to argue that the portfolio wasefficiently priced even then. It would be challenging to hold even the weak form of the efficient markethypothesis under these circumstances.
As important as the question on randomness is the problem of out performing the S&P 500 overthe three and a half years from inception to the end period of analysis December 19th, 2004, which wasthe goal of the portfolio, as shown in Table 6.
Table 6DJIA FirstDifference
S&P FirstDifference
NASDAQ FirstDifference
Portfolio FirstDifference
Daily Mean 0.01% 0.01% 0.03% 0.08%Standard Deviation 1.23% 1.23% 1.71% 1.02%
The portfolio had less variance and a higher mean. Under the formula for the option-pricingmodel, because the mean is excluded from consideration, it would imply that call options on theportfolio should be less expensive than call options on the three indices. This implies that because theportfolio had a comparatively stable upward march, its option prices should be less. This would invokegreat losses to call writers on the portfolio. There does not exist a day where the sell of one year orgreater European style calls on the S&P or the DJIA of equal notional value to the purchase of Europeanstyle calls on the portfolio resulted in a loss, over the life of the portfolio. The purchase of similar callson the NASDAQ would have resulted in losses at the minimum value of the NASDAQ over the period.The author believes that different methods would have been necessary to out perform the NASDAQ inthe same manner it out performs the other indices and that the risks created were outside the scope ofthe goals of the portfolio.
Table 7 Dow S&P 500 NASDAQMinimum 1 Year Return vs. Indices 3.59% 2.39% -26.90%1st Quartile 1 Year Return vs. Indices 11.72% 9.25% -2.64%Median 1 Year Return vs. Indices 17.12% 17.16% 10.40%3rd Quartile 1 Year Return vs. Indices 21.37% 21.94% 16.46%Maximum 1 Year Return vs. Indices 35.68% 38.68% 43.95%<0 0.00% 0.00% 29.11%>=0 100.00% 100.00% 70.89%
DISCUSSION
The ability to construct an options portfolio with little risk of under performing an index withless volatility is deadly to the option pricing models. As well, CAPM as a model for price depends upon

page 52 Allied Academies International Conference
Las Vegas, 2005 Proceedings of the Academy of Accounting and Financial Studies, Volume 10, Number 2
a dynamic that catastrophe theory and singularity theory state should not exist (Lu, 1976; Saunders,1980). Consequent to this, portfolio price movements occur quite commonly that cannot be understoodas function of the markets alone. If the markets are not efficient, then they are ordered. Orderingcreates a very different state of dynamics than a perfectly efficient market. Statistics of order and themathematics of chaotic systems then apply. This also creates the rather interesting possibility that theonly way to meet goals with a margin of safety is to reduce risk and that by reducing risk it is possibleto significantly outperform the average security. This takes the ordinary risk reward ratio and turns iton its head, because in a goal oriented portfolio risk and reward become inversely related. It alsoimplies that pricing knowledge may not be as precisely knowable as CAPM and Black-Scholes implies.Order statistics are less powerful and generally do not provide the absolutely clear valuations ofparametric methods.
REFERENCES
Graham, Benjamin and Dodd, David L.(1934) Security Analysis. New York: Whittlesey House, McGraw-Hill BookCompany
Lu, Yung-chen. (1976) Singularity Theory and an Introduction to Catastrophe Theory. New York: Springer-Verlag
Neftci, Salih N. (1996) An Introduction to the Mathematics of Financial Derivatives. San Diego: California: Academic Press
Saunders, P.T. (1980) An Introduction to Catastrophe Theory. New York: Cambridge University Press

Allied Academies International Conference page 53
Proceedings of the Academy of Accounting and Financial Studies, Volume 10, Number 2 Las Vegas, 2005
DETERMINANTS OF EMERGING STOCKMARKET CORRELATIONS
IN THE GRAVITY EQUATIONJui-Chi Huang, Harrisburg Area Community College, Pennsylvania
Aysegul Ates, Akdeniz University, Antalya, TurkeyTantatape Brahmasrene, Purdue University North Central, Indiana
ABSTRACT
Gravity models borrowed the idea from Newtonian Physics, where the attraction between twoobjects is positively related to their mass and negatively related to their distance. The gravity modelshave been effectively employed in modeling bilateral trading between countries since the 1960s. Inthese models, geographical and cultural variables are found to be crucial factors of economic relations.This particular study suggests that application of gravity modeling also is useful for the explanation ofstock market correlations. This study uses panel data to examine the effect of geographical, culturaland market size variables on the stock market correlations in emerging markets. Empirical analysisfound that distance and market size have a profound impact on stock market correlations. The resultsprovide useful information about future vulnerabilities in emerging markets since physical closenessand market size variables are important linkages between stock market correlations among countries.

page 54 Allied Academies International Conference
Las Vegas, 2005 Proceedings of the Academy of Accounting and Financial Studies, Volume 10, Number 2

Allied Academies International Conference page 55
Proceedings of the Academy of Accounting and Financial Studies, Volume 10, Number 2 Las Vegas, 2005
BUSINESS FAILURE PREDICTION IN RETAILINDUSTRY: AN EMPIRICAL EVALUATION OF
GENERIC BANKRUPTCY PREDICTION MODELSYihong He, Monmouth University
[email protected] Kamath, Cleveland State University
ABSTRACT
This paper investigates whether generic bankruptcy prediction models can maintain theirvalidity when applied to firms from an individual industry, namely, the retail industry. The literaturesuggests that the classification accuracy of generic models is reduced considerably when they areapplied to samples drawn from an individual industry. Our study re-estimates two generic bankruptcyprediction models, one by Ohlson (1980) and one by Shumway (2001), with a mixed industry sampleof 354 over-the-counter (OTC) traded small firms during the 1990s. Given the limited sample size forthe retail industry, both models are validated with an ex post classification test by reclassifying thesample used to estimate the models, while Lachenbruch’s U method (1967) is utilized to overcome theproblem of classification bias. Our results indicate that the generic models by Ohlson (1980) andShumway (2001) are modestly robust in classifying bankruptcy incidence of retail firms one year priorbankruptcy, but the classification accuracy levels decrease sharply as the lead-time from bankruptcyincreases. Overall, the classification accuracies for the retail industry sample are lower than those forthe mixed industry sample.

page 56 Allied Academies International Conference
Las Vegas, 2005 Proceedings of the Academy of Accounting and Financial Studies, Volume 10, Number 2

Allied Academies International Conference page 57
Proceedings of the Academy of Accounting and Financial Studies, Volume 10, Number 2 Las Vegas, 2005
AN EXAMINATION OF THE RECENT INCREASEIN CORPORATE FINANCIAL RESTATEMENTS
DUE TO INAPPROPRIATE LEASE ACCOUNTINGTroy Hyatt, University of Wisconsin - Oshkosh
Alan Ortegren, Southern Illinois University EdwardsvilleBrad Reed, Southern Illinois University Edwardsville
ABSTRACT
The purpose of this paper is to describe the history surrounding the recent spike in financialstatement restatements regarding firms’ accounting for leases. The restatements were caused by a letterfrom the SEC that emphasized the rules for appropriate accounting for leases. This paper explains whythe large number of restatements caused by the SEC letter was such a surprise, and discusses theaccounting issues raised by the SEC letter. Prior research has found that restatements are more likelyin areas where GAAP is contradictory or unclear. GAAP for leases is well established and fairly clear.Also, prior research has found that restatements are more likely due to inappropriate accounting foritems that are not part of a company’s core earnings, however in this case the lease accounting that ledto the restatements was part of the company’ s core earnings. Finally the paper provides some analysisregarding the commitment to quality financial reporting practices by the companies that restated theirfinancial statements due to prior inappropriate lease accounting.

page 58 Allied Academies International Conference
Las Vegas, 2005 Proceedings of the Academy of Accounting and Financial Studies, Volume 10, Number 2

Allied Academies International Conference page 59
Proceedings of the Academy of Accounting and Financial Studies, Volume 10, Number 2 Las Vegas, 2005
GEOGRAPHIC FOCUSED MUTUAL FUNDS:AN EMPIRICAL ANALYSIS OF THE PORTFOLIO
PROPERTIES OF A HAWAII FUNDTerrance Jalbert, University of Hawaii Hilo
[email protected] Schieven, University of Hawaii Hilo
ABSTRACT
The economies of various states and geographic areas behave differently than the U.S. economyas a whole. Because of these differences, this paper explores the potential for offering geographicallyfocused mutual funds. Geographically focused mutual funds would allow investors to custom tailortheir geographic investments, risk exposure and diversification. In this paper, the development andportfolio properties of a Hawaii based mutual fund are discussed. Hawaii is distinct in its location andhas a unique blend of customs and cultures. Firms that operate in Hawaii tend to be quite different thanmainland firms. Because of these differences, Hawaii firms have unique portfolio properties that arenot present in mainland U.S. firms and thereby provide unique contributions to portfolios.
Many financial products have been developed to diversify portfolios and to insulate them fromvarious risks. One such financial product, mutual funds, have been developed for many industries,sectors, types of securities and along many other lines. While closed-end mutual funds trade based onthe stocks of a specific country, no known closed end-fund has been developed based on the stocks ofa specific state. Moreover, no known open-end equity fund or Exchange Traded fund (ETF) follows aspecific country or a specific state. In this paper we explore the desirability of mutual funds focusedon firms in specific geographic areas.
Geographic focused mutual funds are of interest because the economies and fortunes of firmsin various locations are not perfectly correlated. Individuals that might be interested in purchasingsuch a mutual fund include those that want to speculate on the prospects of an area, those who wantto hedge an existing risk and those that wish to incorporate specific risk reduction properties into theirportfolios. An investor that wishes to make a bet that the prospects of an area might improve or declinemight wish to invest in the portfolio. These might include individuals that wish to bet that a majorfacility will be constructed or closed in the area. Individuals desiring to use the fund for hedging mightinclude individuals that wish to hedge their own employment portfolio. Individuals with employmentfortunes that are closely tied to a particular state might wish to reduce the risk associated with theiremployment. Still others may simply wish to diversify their portfolio.
While geographic diversification is interesting in many geographic areas of the U.S., this paperfocuses on a Hawaii focused mutual fund. Hawaii is in a unique position because of its geographicallocation, cultural and ethnic diversity, and economic makeup. The uniqueness of Hawaii is examinedin the paper. The Hawaii mutual fund proposed here is compared to the Dow Jones Industrial Average,NASDAQ, Russell 2000, S&P 500 and Nikkei 225, over a period of 18 years. Geographic focusedmutual funds, specifically in this case a Hawaii Mutual fund, are found to hold substantial promise asan investment tool.

page 60 Allied Academies International Conference
Las Vegas, 2005 Proceedings of the Academy of Accounting and Financial Studies, Volume 10, Number 2

Allied Academies International Conference page 61
Proceedings of the Academy of Accounting and Financial Studies, Volume 10, Number 2 Las Vegas, 2005
A REVIEW OF CIVIL WAR TAX LEGISLATIONAND ITS INFLUENCE ON THE CURRENT U.S.
TAX SYSTEMDarwin L. King, St. Bonaventure University
Michael J. Fischer, St. Bonaventure UniversityCarl J. Case, St. Bonaventure University
ABSTRACT
This purpose of this paper is to analyze and compare tax legislation passed during the Civil Warby both the Union and the Confederacy and compare those features to our current system of taxation.During the Civil War, each side was forced to pass tax laws to raise huge sums of money to fund thewar effort. The major tax act for the Confederacy was entitled "An Act to lay taxes for the commondefense and carry on the Government of the Confederate States". This legislation was passed on April24, 1863 and represented the most comprehensive tax system employed by the Confederacy. The mostsignificant Union income tax law was titled the "National Tax Law as approved June 30, 1864". Thesetwo major pieces of legislation are compared and contrasted related to the types of taxes used by eachside, the rates of taxes employed, and the forms of deductions and tax credits available.
The intent of this paper is to review and examine the tax systems employed by the Union andConfederacy in raising sufficient cash to finance a very expensive war. This is similar to our currentsystem of taxation which is also financing a war effort. Income taxes laws are reviewed in an effort toreview inclusions, exclusions, deductions, and tax credits. The Union's "Internal Revenue Act of 1862"will be briefly examined in an attempt to review tax revisions needed in order to raise significantly morerevenue as the Civil War intensified.
The analysis of this legislation reveals the many forms of taxes, in addition to the income tax,required in order to raise needed war funds. In particular, "sin taxes" on sprits, ale, beer, porter, andtobacco were a major fundraiser during the Civil War for both sides. These taxes continue in ourcurrent system. Stamp duties were commonly assessed on thousands of products sold during the CivilWar era. License fees on all major professions also raised additional needed capital. Finally, estatetaxes were employed in an effort to supplement revenues generated by all other forms of tax. Themajority of these taxes still exist today in an effort to finance the Iraqi war.
Finally, this paper analyzes a variety of specific tax regulations required by both the Union andthe Confederacy. In particular, differences in filing requirements, due dates, related penalties, and taxcollection personnel and their duties are examined. The authors attempt to identify the rationale forvarious unique regulations employed by each. Finally, this paper reviews the many aspects of Civil Wartaxation legislation that remains in effect today. In particular, many income inclusions, exclusions, anddeductions found in these 1860's acts continue to exist in our current Internal Revenue Code.

page 62 Allied Academies International Conference
Las Vegas, 2005 Proceedings of the Academy of Accounting and Financial Studies, Volume 10, Number 2

Allied Academies International Conference page 63
Proceedings of the Academy of Accounting and Financial Studies, Volume 10, Number 2 Las Vegas, 2005
ON DISCOUNTING DEFERRED INCOME TAXESJohn N. Kissinger, Saint Louis University
ABSTRACT
This paper revisits the debate over whether the tax effects of temporary timing differencesbetween pretax accounting income and taxable income should be discounted. The paper provides anoverview of the history of that debate, identifies the conditions under which discounting is appropriatein current practice, and examines the extent to which the tax effects of the four basic types of timingdifference satisfy those conditions. The paper concludes that discounting is conceptually inappropriatewhen revenues and expenses appear in the tax return before they appear in the financial statements.It further concludes that, while discounting is conceptually appropriate when revenues and expensesappear in the financial statements before they appear in the tax return, discounting will be unnecessaryin most of these cases because the difference between discounted and undiscounted measures of the taxeffects will usually be immaterial.

page 64 Allied Academies International Conference
Las Vegas, 2005 Proceedings of the Academy of Accounting and Financial Studies, Volume 10, Number 2

Allied Academies International Conference page 65
Proceedings of the Academy of Accounting and Financial Studies, Volume 10, Number 2 Las Vegas, 2005
INFORMAL REGULATORY PRESSURE TO ALTERFINANCIAL REPORTING BEHAVIOR:
THE CASE OF IN-PROCESS RESEARCHAND DEVELOPMENT
Gyung Paik, Brigham Young [email protected]
Jacob Findlay, Deloitte [email protected]
ABSTRACT
In 1998, Arthur Levitt, then chairman of the Securities and Exchange Commission (SEC),claimed in a public address that companies making acquisitions frequently allocated overly-largeamounts of the purchase price to in-process research and development (IPR&D) instead of goodwill.The result was a one-time charge in the first year followed by several unrealistically rosy years ofearnings that were not disturbed by the amortization of goodwill. Levitt warned of increased SECscrutiny of acquisition purchase price allocations between IPR&D and goodwill. This study investigatesthe impact of the SEC's informal regulatory pressure by examining acquiring firms' allocation decisionsduring the three years following Levitt's speech, which we claim marked the beginning of a period ofinformal regulatory pressure. The results indicate that during this three-year period, the proportionof the acquisition cost firms allocated to IPR&D dropped significantly while the proportion allocatedto goodwill and other intangibles increased significantly. Moreover, more-profitable firms began takingbigger IPR&D charges while less-profitable firms began taking smaller charges. These results suggestthat the SEC's use of informal regulatory pressure promotes compliance with regulatory requirements.
Keywords: Financial Accounting, In-Process Research and Development, Regulatory Pressure, SEC,Earnings Management
Data Availability: The data used in this study are publicly available from the sources listed in the paper.
We wish to thank Ted Christensen, Richard Dalebout, Peter Johnson, and Kay Stice at Brigham YoungUniversity.

page 66 Allied Academies International Conference
Las Vegas, 2005 Proceedings of the Academy of Accounting and Financial Studies, Volume 10, Number 2

Allied Academies International Conference page 67
Proceedings of the Academy of Accounting and Financial Studies, Volume 10, Number 2 Las Vegas, 2005
THE SURVIVAL OF FIRMS THAT TAKESPECIAL CHARGES FOR RESTRUCTURINGS
AND WRITE-OFFSGyung Paik, Brigham Young University
Kip R. Krumwiede, Boise State [email protected]
ABSTRACT
In light of recent, well-publicized corporate failures, financial reporting practices areincreasingly being scrutinized. One area of scrutiny includes special charges for restructurings andwrite-offs. This study investigates the survival of firms that take restructuring charges and write-offs.We examine whether the survival of these firms is associated with management's choice of labeling (i.e.,restructuring charge or write-off) as well as with the amount and purpose of the charge. Using a sampleof large negative special charge announcements during 1986-1992 and 1996-1998, we find that firmsreporting smaller charges survive longer than those with larger charges, regardless of any businessactions for improvement mentioned. We also find evidence of a decreasing probability of survival forfirms using the label of "restructuring" for the charge. These results are consistent with the popularmedia perception that managers often seek to mask their firms' true performance using special chargelabeling.
Keywords: Financial accounting, special charges, restructuring charges, write-offs, survival.
We wish to thank Bruce Behn, Erv Black, Ted Christensen, Dennis Chambers, Richard Dalebout, YoungKwon, Theodore Sougiannis, and seminar participants at Brigham Young University and the Universityof Illinois at Urbana-Champaign.
Data Availability: The data used in this study are publicly available from the sources listed in the paper.

page 68 Allied Academies International Conference
Las Vegas, 2005 Proceedings of the Academy of Accounting and Financial Studies, Volume 10, Number 2

Allied Academies International Conference page 69
Proceedings of the Academy of Accounting and Financial Studies, Volume 10, Number 2 Las Vegas, 2005
IKEA: A UNIQUE EXAMPLE OF THE EVOLUTIONOF MANAGEMENT ACCOUNTING TECHNIQUES
Donna Phillips, University of [email protected]
Warren B. Idsal, AKB Associates, Dallas, [email protected]
ABSTRACT
In today’s dynamic international environment, IKEA, led by entrepreneur Ingvar Kampnard,serves as a forerunner in the employment of innovative management accounting techniques. At theheart of IKEA’s philosophy is the following concept:
“While most retailers use design to justify a higher price, IKEA designers work in exactly theopposite way. Instead they use design to secure the lowest possible price. IKEA designers design everyIKEA product starting with a functional need and a price. Then they use their vast knowledge ofinnovative, low-cost manufacturing processes to create functional products, often coordinated in style.Then large volumes are purchased to push prices down even further.
Most IKEA products are also designed to be transported in flat packs and assembled at thecustomer's home. This lowers the price by minimizing transportation and storage costs. In this way, theIKEA Concept uses design to ensure that IKEA products can be purchased and enjoyed by as manypeople as possible.” (http://franchisor.ikea.com/showContent.asp?swfId=concept1)
This concept, as we show in this paper, embodies the development of a target costing systemcoupled with just-in-time inventory systems, computer-integrated manufacturing, activity basedaccounting and management, value chain analysis and total quality management. We discuss theunique and unusual history of IKEA to show how Kampnard independently created these techniques.We further show how the successful employment of these techniques has created the IKEA we see today:a multinational company with 202 stores in 32 countries/territories employing more than 84,000 co-workers.

page 70 Allied Academies International Conference
Las Vegas, 2005 Proceedings of the Academy of Accounting and Financial Studies, Volume 10, Number 2
Allied Academies International Conference page 71
Proceedings of the Academy of Accounting and Financial Studies, Volume 10, Number 2 Las Vegas, 2005
AUDITOR CHOICE AND AGENCY COSTSTae Ryu, Metropolitan State College of Denver
ABSTRACT
There are many reasons that an organization chooses a specific auditor. Some prior researchhas used agency theory to partially explain auditor choice and auditor switches. Audit services aredemanded as monitoring devices because of the potential conflicts of interest between owners andmanagers as well as those among different classes of security holders. DeAngelo (1981) argues thatthe provision of audited financial statements is the least-cost contractual response to owner-managerand intra-owner conflicts of interest, i.e., agency costs. Wallace (1981) also identifies that one ofbenefits that may accrue from an audit is deterrence of management malfeasance. In this study, as anextension of prior studies related to the agency costs, a relation between the ownership control statusand the auditor choice is investigated. More specifically, I examine the effect of owner versusmanagement control on the choice of auditors. As in Dhaliwal et al. (1982), an owner-controlled firmas one in which one party owns 10 percent or more of the voting stock and exercise active control orone party owns 20 percent or more of the voting stock. Manager-controlled firms are firms in whichno single party controls more than 5 percent of the voting stock.

page 72 Allied Academies International Conference
Las Vegas, 2005 Proceedings of the Academy of Accounting and Financial Studies, Volume 10, Number 2

Allied Academies International Conference page 73
Proceedings of the Academy of Accounting and Financial Studies, Volume 10, Number 2 Las Vegas, 2005
AN ANALYSIS OF THE INFLUENCE OF ERPIMPLEMENTATION ON FINANCIAL ACCOUNTING
MEASURESMartha Lair Sale, Sam Houston State University
ABSTRACT
This paper compares the actual to the expected long term and short-term results experiencedby a company after implementation of an Enterprise Resource Planning (ERP) software system.Although ERP implementations are known to be unusually difficult, compared to other large-scalesystems development projects (Hitt, Wu, & Zhou, 2002), several financial improvements are generallyexpected to follow implementation. These expected financial improvements, along with operationalimprovements, are often cited as partial justification for the time and resources spent on suchimplementation. This study is limited to the impact of implementation on financial measures. Otherthan the costs of implementation, there is little actual data illustrating how Enterprise ResourcePlanning software systems implementation affects financial measures of performance.
BACKGROUND
Enterprise Resource Planning (ERP) software systems evolved from inventory control systemsof the 1960’s. Currently, ERP systems allow integration of all application processes; not only inmanufacturing, but also sales, accounting, and customer service (Olhager & Selldin, 2003). Thisintegration has extended to encompass information from supply chain management, vendors, andcustomers of companies using ERP systems. ERP systems, in the 21st century, are no longer a sourceof competitive advantage; they are needed to simply operate on par with peer companies. Companiesthat cannot or will not use ERP systems suffer a comparative disadvantage (Hitt, Wu & Zhou, 2002).
There are numerous vendors of ERP systems. Although SAP is most popular with large andmid-size companies, Oracle, PeopleSoft, Cincom, and Lilly Software are just a few vendors that offera fully integrated ERP system. These fully integrated ERP systems allow “real time” view of all thebusiness processes. The primary benefit of these ERP systems is the ability to capture and analyze non-financial information. The ERP system replaces both the accounting and the operations planningsystem and has the ability to provide better information about customers, sales, internal processes, andfinancial transactions. It allows the centralization of administration activities, and the consolidation ofmultiple information systems reduces redundant data entry, reduces errors and discrepancies betweensystems, and provides managers access to broader information. By improving operational andmanagement efficiency, ERP system installation and integration is thought to offer financial benefitsas well as operational benefits.
It is imperative that decision makers understand and analyze the cost-benefit relationship indeciding to implement an ERP software system and in deciding which ERP vendor’s software to use.These systems take an average of 21 months to install and cost a mid-size to large company severalmillion dollars to implement (Hitt, Wu & Zhou, 2002). According to one recent study (Umble, Haft& Umble, 2003), an estimated 50-75% of US firms experience some degree of failure in implementingthis type of advanced manufacturing technology. While all ERP systems are similar, they are verycomplex and diverse with regard to flexibility and the ability to tailor the system to specific needs.System differences make it important to examine the ERP software vendors to be sure of adequate

page 74 Allied Academies International Conference
Las Vegas, 2005 Proceedings of the Academy of Accounting and Financial Studies, Volume 10, Number 2
support and that the software will offer sufficient flexibility to accommodate the strategic plans ofmanagement.
So given the expense and the chance of implementation failure, what offsetting advantages domanagers expect from ERP systems? Al-Mashari, Al-Mudimigh, and Zairi (2003) present a list ofbenefits managers expected from implementation based on a survey by Deloitte & Touche. Theprimary benefits were inventory reduction, personnel reduction, increased productivity, improvementsin order management, monthly financial closings performed sooner, improved cash flow, reduction inIT, increased corporate data visibility, new or improved business processes, improved customer service,and Y2K compliance.
This list includes a number of expected outcomes that, while not expressed specifically infinancial performance terms should impact financial performance measures. Specifically, changes ininventory, improved cash flow, and increased productivity should have an immediate and measurableimpact on financial measures. Other changes, like improved business processes, improved customerservice and reduced operating cost from changes in personnel, should result in a positive impact onfinancial measures of performance.
It is in the best interest of the implementing company that there be sufficient internal researchon the ERP system under consideration to provide corroboration of its suitability for the needs of thecompany. They should keep in mind the strategic goals of the company and how well the ERP systemfits those goals.
Among the successful implementations reported on SAP’s web site (SAP, 2005), is HawaiianTropic. Hawaiian Tropic had enjoyed three years of double-digit growth, but their very poor inventorymanagement system threatened their ability for continued success (SAP, 2005b). Management washampered by the disjointed use of legacy systems. Inventory reports required data from systems thatused different nomenclature and different item numbers. They required multiple manual entries of thesame information on more than 500 Hawaiian Tropic products and 500 private label productsmanufactured for customers, assembled from a materials list with over 7,000 items. The system allowedthem no information on the availability of products at the regional distribution centers; a tremendousdisadvantage in a rapidly changing and highly seasonal environment where 80% of sales span only sixmonths of the year. Management was undoubtedly diligent in determining the best system to meetcompany needs. However, one must consider that the previous system was reportedly so poor thatchange to any organized inventory control system would have been a vast improvement. ERP systemsmay deliver immediate results in this type of environment, but these results might be argued to haveresponded to any of a number of appropriate actions.
Texas Instruments, Inc. (TI) implemented SAP as their ERP software system in August of 1999.The project took three and half years and $250 million dollars (Sarkis & Sundarraj, 2003). There weremultiple motivations for TI to invest so heavily in the ERP system. Customer service, a move tostandardized processes that support market trends, and standardize information systems are just a fewof the opportunities that TI saw in the investment (Sarkis & Sundarraj, 2003). Unlike Hawaiian Tropic,where the motivation was apparently operations driven, in the case of TI, investment in the system waspartially justified by an expected improvement in ROI (return on investment) and IRR (internal rate ofreturn). While Sarkis and Sundarraj (2003) report that the major goals were met nine months afterimplementation, they offer little to support this assessment and the timing of their study does not allowfor longer-term results. The financial data reproduced here illustrate these improvements are not evidentthat past the first year of implementation.

Allied Academies International Conference page 75
Proceedings of the Academy of Accounting and Financial Studies, Volume 10, Number 2 Las Vegas, 2005
Table 1Financial Data for TI
2002 2001 2000 1999 1998ROE (3.205) (1.692) 25 15 6ROI (2.974) (1.536) 22 14 5ROA (2.343) (1.274) 17 9 4Employees 34,589 34,724 42,481 38,197 35,948Productivity 242 236 279 248 235Inventory 790 751 1,233 845 583
In 1999 ROI of 13.582% was over double the 1998 level of 5.388%. By 2000, ROI hadincrease to 22.363% an increase of over four times the 1998 rate. For the next two years the ROIdropped dramatically. Overall, Return on Investment, one of the main justifications for theimplementation decreased from 22.363% in December 2000 to (2.97)% in December 2002. MirroringROI, the Return on Assets (ROA) decreased from 17.42% in December 2000 to (2.343)% in December2002. This was after an initial increase to double then quadruple the 1998 level of 3.618% for 1999 and2000. Return on Equity (ROE) followed a similar pattern of initially increasing from 6.236% in 1998to 15.192% and 24.523% then plummeting to a low of (3.205)% in 2002. The fact that these threeindicators moved similarly tends to support the assumption that the results are not anomalous resultsdue to some one-time occurrence, but fairly represent the financial results of the company. A measureof the operational advantage that was expected to follow implementation was a reduction in the numberof employees. Although the number of employees at December 2002 (34,589), was decreased 18.58%from the December 2000 high of 42481, at 3.78% the number has not decreased so substantially overthe December 1999 total of 35,948. Perhaps a better measure than the absolute number of employeesis the labor productivity as measured by sales/number of employees. Although, labor productivity rosefrom a low of 235.33 in December of 1998 to a high of 279.18 in December of 2000 and then fell fromthe December 2000 high it has not fallen below the 1998 level and at 242.36 is improved almost 3%.This is evidence of improved operational efficiency. The final measure examined here is the level ofinvestment in inventories. The value of inventory reported on the balance sheet December 2002,represented a 6.5% decrease compared to December 1999. The results reported in the table illustratesthat while there was improvement in the expected areas, the dramatic results reported in 2000, the firstfull year of implementation, do not appear to have been universally sustainable by TI.
The results indicated above do not take into consideration the impact of external factors thatmight affect the industry as a whole. In an attempt to normalize the results for economic influences thatwould affect the entire industry, the results for TI were analyzed in relationship to the average ofcompanies in the same NAICS (North American Industry Classification System) code. Data for thisanalysis was obtained from Standard and Poor’s Compustat Database with the aid of Research Insightin August 2005.
Table 2Comparison of TI to Their Industry Average (IND)
(All numbers are percentage points.)Return on Assets
2002 2,002 2,001 2,001 2,000 2,000 1999 1999 1998 1998TI IND TI IND TI IND TI IND TI IND
3.62 -15 9 -3 17 -43 -1.27 -26.32 -3.34 -94.97Difference 18 13 60 27.05 92.14

page 76 Allied Academies International Conference
Las Vegas, 2005 Proceedings of the Academy of Accounting and Financial Studies, Volume 10, Number 2
Return of Equity2002 2,002 2,001 2,001 2,000 2,000 1999 1999 1998 1998
TI IND TI IND TI IND TI IND TI IND6.27 24.51 15.19 8.41 24.52 0.11 -1.69 -20.98 -3.21 -13.5
Difference -18.27 6.78 24.41 19.29 10.3Return on Investment
2002 2002 2001 2001 2000 2000 1999 1999 1998 1998TI IND TI IND TI IND TI IND TI IND
5.39 -4.26 13.58 -2.27 22.36 -0.24 -1.54 -31.35 -2.97 -145.23Difference 9.65 15.85 29.6 29.82 142.26
Although it would not be judicious to make sweeping characterizations based on these results,it is not too reckless to claim that they fail to show development of an increasing advantage for TI.Considering ROA, a comparison of the results for TI compared to the industry average shows themgoing from a position that was 92 percentage points better than the industry average to one that was justover 18 points above the industry average, a negative change of 54.74 points. Considering ROE, TI’sresults went from a position 10.3 points above the industry average to one that was over 18 points belowthe industry average, representing a decrease of 28.57 points. On the third measure their comparativeposition fell from 142.26 points to 9.65 points showing a decrease of 132.61 points. So many elementsare captured in these measures that they cannot be considered to be only the results of ERPimplementation, but they do illustrate that the company failed to realize comparative advantage becauseof implementation.
According to Bartholomew (2003), one of the reasons that ERP systems sometime do notdeliver anticipated results is that ERP systems are focused on delivering data, not lean systems.Managers may confuse the availability of data by which progress toward lean manufacturing ismeasured with actual accomplishment of the goals of lean manufacturing. Bartholomew in explainingthe relationship between production and customer orders said, “Lean also emphasizes setting up theproduction process in the most efficient manner from the start and then continually finding ways tomake it more streamlined and waste free” (Bartholomew 2003). There is now a response by ERPsystem vendors to incorporate the data analysis necessary for managers to assess the degree to whichthey practice lean operations. These systems deliver better reporting and analytical capability to helpimprove operations rather than delivering the capability and depending upon management to analyzeit and use it to accomplish the objectives of lean manufacturing (Bartholomew, 2003).
While ERP systems may not always deliver the expected financial results, they do deliverseveral benefits in the form of improved information to management. This improved information,properly used, should result in financial benefits. Information is more easily accessible and theinteraction across the enterprise improves after implementation (Olhager & Selldin, 2003).
CONCLUSION
ERP Systems are no longer providing a competitive advantage; these systems are necessary forcompanies to remain competitive. While the improved financial performances companies may haveexpected may not be immediate, there are many benefits of ERP software. Initial financialimprovement may be the results of management attention to issues that should have been addressedindependent of implementation of an ERP system. These issues, once resolved, should improvefinancial performance to the extent the problem is solved, but to maintain improvement a company mustconstantly look for ways to improve the business process. These improvements may be facilitated byinformation made more readily available using an ERP system, but it should not be expected that

Allied Academies International Conference page 77
Proceedings of the Academy of Accounting and Financial Studies, Volume 10, Number 2 Las Vegas, 2005
implementation of the system should in itself accomplish dramatic sustainable improvement.Management should acknowledge the possibility of limited financial improvement from implementationof ERP itself and consider that they must be responsible for developing a strategic solution based on theimproved availability of information.
REFERENCES
Al-Mashari, Al-Mudimigh, and Zairi (2003). Enterprise Resource Planning: A taxonomy of criticalfactors. European Journal of Operational Research, Vol 146, pp 352-364.
Bartholomew (2003). ERP Learning to be Lean. Industry Week, July.
Hitt, Wu, and Zhou (2002). Investment in Enterprise Resource Planning: Business Impact andProductivity Measures. Journal of Management Information Systems, Vol 19, No 1, pp71-98.
Olhager and Selldin (2003). Enterprise resource planning survey of Swedish manufacturing firms.European Journal of Operational Research, Vol 146, pp 365-373.
SAP (2005). www.sap.com/solutions/smb/allinone/customersuccess/hawaiiantropic.epx mySAP All-in-One Customer Successes: Hawaiian Tropic.
SAP (2005b). www.sap.com/solutions/smb/pdf/CS_Hawaiian_Tropic_10-25-04.pdf
Sarkis and Sundarraj (2003). Managing large-scale global enterprise resouce planning systems: a casestudy at Texas Instruments. International Journal of Information Management, Vol 23, pp431-442.
Umble, Haft, and Umble (2003). Enterprise resource planning: Implementation procedures and criticalsuccess factors. European Journal of Operational Research, Vol 146, pp 241-257.

page 78 Allied Academies International Conference
Las Vegas, 2005 Proceedings of the Academy of Accounting and Financial Studies, Volume 10, Number 2

Allied Academies International Conference page 79
Proceedings of the Academy of Accounting and Financial Studies, Volume 10, Number 2 Las Vegas, 2005
LOSING LIKE FORREST GUMP: WINNERS ANDLOSERS IN THE FILM INDUSTRYMartha Lair Sale, Sam Houston State University
[email protected] Diane Parker, University of South Alabama
ABSTRACT
There are a number of high-profile cases where films that by most standards of revenue minuscost are very successful, but are reported as providing net losses to the studios. Most of the publicattention on these cases arises from lawsuits brought by participants who contracted to receive paymentbased on a percentage of the profit of the film.
This paper highlights some of the unique costing practices in the film industry and examinesseveral of these well-known “losers” in light of the difference between the gross receipts of the film andthe direct costs of production. It provides some insight into the difference between what would beconsidered a rational indirect cost allocation basis for other industries and the apparently erraticallocation process used in film.
The analysis includes an examination of the relationship between the gross receipts and theproduction costs of films in a number of categories that might be considered measures of success in thefilm industry.
INTRODUCTION
In 1999, entertainment accounts for less than one percent of the gross national product of theUnited States (Berton & Harris, 1999). Despite its small percentage, the film industry gains muchattention in the nineties because of its finances (Cheatham, Cheatham, & Davis, 1996). Buzzwords like“creative accounting” are used, and some accountants assert, “The accounting department is the mostcreative part of Tinseltown” (Cheatham et al., 1996, p. 1). Several major disputes aid in bringing thefilm industry’s accounting practices into the limelight.
In the 1990 court case Art Buchwald v. Paramount Pictures Corporation, the court rules inBuchwald’s favor Coming to America, it makes sense that he should receive the compensation set forthin his original contract with Paramount Pictures Corporation. In addition to a fixed fee, Buchwald’soriginal contract awards him a share of the net profits of the film. The film is a box office success.However, according to Paramount, it lost $18 million. The author of the novel Forrest Gum contractsto receive $350,000 and 3% of the net profits of the film for the rights to his book. When Groom triesto collect his 3%, he learns that Paramount is reporting a loss on the film. Forrest Gump earns millionsat the box office in 1994, yet Paramount reports its profitability in the red. Also fueling the controversyis the fact that director Robert Zemeckis and actor Tom Hanks receives a percentage of the films fees,but they are awarded their money based on gross box office receipts instead of net profits (Pfeiffer,Capettini, & Whittenburg, 1997). Other popular films report losses too. Batman shows a $20 millionloss, and net profit participants sue Warner Brothers. Net profit participants of the movie JFK go tocourt after no net profits are reported for the film. (Goldberg, 1997). Rain Man, Dick Tracy,Ghostbusters, Alien, On Golden Pond, Fatal Attraction are all films grossing over $100 million in the1990’s for which no net profits were reported (Pheiffer, Capettini, & Whittenburg, 1997).
The intriguing conflict surrounding the motion picture industry in the 1990’s understandablybrings attention to the accounting methods and practices of Hollywood. Accountants uncover costing
page 80 Allied Academies International Conference
Las Vegas, 2005 Proceedings of the Academy of Accounting and Financial Studies, Volume 10, Number 2
methods specific to the film industry, and changes are made in recent years to in an attempt to rectifyany wrongdoing. Beyond the actual costing methods, however, are the numbers themselves. After adiscussion of the unique accounting methods of the film industry, data is provided to illustrate somerelationships that exist between financial figures of films. Specifically, the study examines therelationship between profitability as measured as the difference between the budget of the film and thegross receipts of the film and the success of films as measured by gross receipts.
Studios offer gross profits to certain participants for several reasons. First, many actors requirethis kind of contract, and studios realize that actors draw audiences to movie theaters. Also, if an actoror director knows that his or her compensation is linked to the gross profitability of a film, he or shemay be more likely to promote the film and go the extra mile to ensure its success at the box office(Goldberg, 1997). Goldberg (1997) asserts that when gross profit participants become involved in films,net profits are likely to disappear. He cites examples like the 1993 movie Indecent Proposal, whichreports a loss of $35 million after paying its five gross profit participants. Star Robert Redfordreportedly receives over $20 million. Others cite similar examples like Hook, in which 40% of thefilm’s gross profits were given to Julia Roberts, Dustin Hoffman, Robin Williams, and Steven Spielberg(Pfeiffer, Capettini, & Whittenburg, 1997). According to Goldberg (1997), Indecent Proposal and Hookare naturally doomed for net profit failure because of their large number of gross profit participants. Lesser talent and participants often do not receive gross profit rights.
In the nineties, the film industry is surrounded by major public concern and controversy relatingto its accounting methods and practices. The financial accounting and reporting regulations for the filmindustry are originally established and governed by the Statement of Financial Accounting StandardsNumber 53. In June 2000, the findings from the investigation prompted the Financial AccountingStandards Board to issue the Statement of Financial Accounting Standards Number 139. This newstandard rescinds the Statement of Financial Accounting Standards Number 53 and amends three otherregulatory statements. The findings recognize that, first, the film industry is continuously undergoingmany relevant changes that affect their financial position and financial reporting; particularly regardingrevenue recognition as an increase in film revenue through ancillary forms and international marketsis apparent; second, film studios apply the Statement of Financial Accounting Standards Statement 53differently; and third, the accuracy of the film industry’s financial statements are questionable(Financial Accounting Standard Board, 2000).
In August 2000, the American Institute of Certified Public Accountants (AICPA) issues a newsrelease titled “AICPA Issues New Rules for Film Industry” that states three major changes in accountingfor the film industry. These include advertising expenses, film amortization, and abandoned projects.According to Berton and Harris (1999), advertising costs are now to be amortized against revenues forthe appropriate market rather than against revenues for a specific film. Film amortization is to be basedon ten years rather than the twenty-year standard previously used by most film studios. Finally,abandoned projects cannot be written off to the overhead pool as commonly done before.
The production budget for films includes all the classifications of costs accountants wouldgenerally associate with direct costs of a film. Gross receipts is a relatively concrete number analogousto what would be considered revenues in accounting for most products, not amenable to easy“management.” The controversy may be simplified to a question of what indirect costs should beassigned directly to films and what costs should be borne by the studio. Since major participants in thesuccess of a film are paid on gross receipts it seems that the less powerful providers of contract servicesfor the film industry are forced to bear a disproportionate burden of paying indirect costs.
In general GAAP requires that indirect costs be assigned in rational and consistent manner(Horngren, Foster & Datar, p. 486). In most products this rational and consistent manner would bebased on some measure of the cost of the direct inputs. In spite of the film industry’s unique costing methods, an examination of the relationships betweenprofitability and the success of films as measured by gross receipts and production costs offers

Allied Academies International Conference page 81
Proceedings of the Academy of Accounting and Financial Studies, Volume 10, Number 2 Las Vegas, 2005
interesting insight into whether or not some of these films that have been the center of controversywould have been considered profitable products using costing methods appropriate to most products.
ANALYSIS
This study identifies successful films in two distinct ways. First, the top grossing films of eachmajor film studio are studied (Box Office Report, 2004).then Academy Award-winning films for BestPicture are considered. (Academy Awards Database, 2004). Information on the gross revenues(ShowBIZ Data, 2004) and costs )Internet Movie Database, 2004) are compared.
Table 1 : Box Office and Budget Information for Top Films in Dollars
Film U.S. Gross Foreign Gross Budget Gross/Budget The Lion King 310,785,532 545,000,000 79,300,000 6.65Shrek 267,652,016 155,808,898 60,000,000 7.06Star Wars 460,195,523 319,100,000 11,000,000 70.84Gone with the Wind 198,933,802 N/A 3,900,000Titanic 600,787,052 1,234,600,000 200,000,000 9.17Spider-Man 403,706,375 380,900,000 139,000,000 5.64E.T. 399,804,539 305,000,000 10,500,000 67.12The Two Towers 340,478,898 577,400,000 139,000,000 6.6Note: Data from ShowBIZ Data and Internet Movie Database
Titanic, the top grossing film for all major film studios, is budgeted more money than any of theother films, perhaps suggesting the belief that budget can ensure large box office sales. However, thisdoes not seem to be the case. While Titanic’s return ratio is high, there are others significantly higher.The high ratios have another partial explanation; these films and Gone with the Wind are all re-released.The box office figures for Star Wars, Gone with the Wind, and E.T. actually represent two theatricalruns.
Table 2: Box Office and Budget Information for Academy Award Best Picture Winners
Film Worldwide Gross Budget Gross/Budget Return of the King (2003) 778,174,794 94,000,000 8.28Chicago (2002) 306,664,505 45,000,000 3A Beautiful Mind (2001) 295,256,996 60,000,000 4.92Gladiator (2000) 454,364,866 103,000,000 4.41American Beauty (1999) 336,104,047 15,000,000 22.41Shakespeare in Love (1998) 252,241,322 25,000,000 10.09Titanic (1997) 1,835,387,052 200,000,000 9.18The English Patient (1996) 230,351,430 27,000,000 8.54Braveheart (1995) 202,604,871 72,000,000 2.81Forrest Gump (1994) 629,699,757 55,000,000 11.45Note: Data from ShowBIZ Data and Internet Movie Database

page 82 Allied Academies International Conference
Las Vegas, 2005 Proceedings of the Academy of Accounting and Financial Studies, Volume 10, Number 2
Based on Table 2, it appears films that win Academy Awards do well at the box office and havehigher ratios of box office receipts to budgets. To further analyze this relationship between profitabilityand success as determined by Academy Award wins, data is analyzed on the four most recent OscarBest Picture winners compared to their opponents for the award.
The findings offer three very significant insights into the film industry and the relationshipbetween profitability and the success of films. First, a studio cannot guarantee box office success of afilm by allocating a large budget to it. Although a substantial budget may lead to large profits as in thecase of the 1997 film Titanic, other studies show that is not always the case. Second, one way toincrease profits is to re-release films. Last, some film studios may view success beyond profits, inqualitative ways such as winning the Best Picture Academy Award. If that is the case, film studiosshould focus on box office receipts since they seem to indicate winners.
REFERENCES
Academy Awards Database. (2004). Retrieved February 24, 2004, from http://www.oscars.org/awardsdatabase/.
AICPA issues new rules for film industry. (2000). Journal of Accountancy [online serial], 190,http://www.aicpa.org/pubs/jofa/aug2000/news3.htm.
Berton, L., & Harris, R. (1999). Reel-world accounting. CFO, 15, 34-40.
Box Office Report. (2004). Retrieved February 24, 2004, http://www.boxofficereport.com.
Buchwald v. Paramount Pictures Corporation, No C 706083, 1990 Cal. App. LEXIS 634, 13 U.S.P.Q.2D (BNA) 1497,January 31, 1990.
Cheatham, C., Cheatham, L. R., & Davis D. A. (1996). Hollywood profits: gone with the wind? CPA Journal, 66, 32-42.
Davis, C. E. (1997). Accounting is like a box of chocolates: a lesson in cost behavior. Journal of Accounting Education,15, 307-318.
Film Maker Tool (2005). www.filmmakertools.com/ production/easy_budget/ easybudget_products_feature.html
Financial Accounting Standard Board. (2000). Statement of Financial Accounting Standards No. 139. Norfolk, Connecticut.
Goldberg, V. P. (1997). The net profits puzzle. Columbia Law Review.
Goldstein, Michael. (2004). Studios shoot works on Oscar. New York Daily News. Retrieved March 21, 2004http://www.nydailynews.com/entertainment/movies.
Internet Movie Database, Inc. (2004). Retrieved February 24, 2004 http://www.imdb.com/.
Levine, M. H., & Siegel, J. G. (2001). Accounting changes for the film industry. CPA Journal, 71, 32-38.
Pfeiffer, G., Capettini, R., & Whittenburg, G. (1997). Forrest Gump – accountant: a study of accounting in the motion pictureindustry. Journal of Accounting Education, 15, 319 - 344.
ShowBIZ Data. (2004). Retrieved February 24, 2004 http://www.showbizdata.com/.

Allied Academies International Conference page 83
Proceedings of the Academy of Accounting and Financial Studies, Volume 10, Number 2 Las Vegas, 2005
USING RESPONSE CARD TECHNOLOGYCharles R. B. Stowe, Sam Houston State University
ABSTRACT
Those familiar with the television show “So You Want to be a Millionaire” will recall that oneof the options for the contestant is to ask the audience for their opinion as to which answer is correct.Whereupon the audience would punch a button and the totals would appear in percentages for eachanswer. This same technology is available for professors to use along with Power Point or some othersoftware to report not only how the class voted, but on how each student voted. The response padtechnology offers faculty a way of enhancing student involvement, creating some excitement, andpossibly enhancing the learning experience. .
This article reviews several studies done over the impact of response pad technology onlearning outcomes as well as reports on my experience in using response pad technology in twodifferent courses: International Business Law, and Global Entrepreneurship and Innovation. Theparticular pilot classes used Turning Point Technology LLC’s software which integrates intoMicrosoft’s PowerPoint software. The cost of obtaining and using this relatively new classroomtechnology is presented along with commentary on the pros and cons of altering a course to implementthe technology. This technology does require an investment of time for learning the software and aninvestment of time to rework a class preparation. There are some significant costs involved butpublisher-educator programs provide a practical way to finance the introduction of this technology tothe classroom.

page 84 Allied Academies International Conference
Las Vegas, 2005 Proceedings of the Academy of Accounting and Financial Studies, Volume 10, Number 2
Allied Academies International Conference page 85
Proceedings of the Academy of Accounting and Financial Studies, Volume 10, Number 2 Las Vegas, 2005
FURTHER EVIDENCE ON CASH FLOWS’PREDICTIVE VALUE
Ronald Stunda, Birmingham-Southern [email protected]
ABSTRACT
In the past fifteen years, the quantity of research concerning the implications of cash flow hasgreatly increased. Research concerning the relationship of cash flows to earnings and stock prices, aswell as the information content of cash flow can be found in most current accounting researchperiodicals. Many of the seminal investigations of cash flow used proxies and estimations for the cashflow component of financial statements. These studies utilized the best available information to furtherthe extent of accounting knowledge. Currently, the information available to accounting researchers hasimproved, therefore, it is now pertinent to question whether these proxies and estimations wereadequate measures of cash flow, or, given the improved accounting information, these studies shouldbe reviewed and the conclusions reexamined. This paper compares cash flow estimates used in priorresearch to the actual cash flow numbers reported by the firm. The finding is that actual cash flowsprovide a higher association with security returns than estimates of cash flows, which were used inprior research.
INTRODUCTION
Cash flows have been used in many studies to achieve several objectives. Perhaps the mostnotable cash flow studies are those of Peter Wilson (1986, 1987). In both studies, Wilson finds that“the cash and total accruals components of earnings have incremental information content beyondearnings themselves". These studies compelled other researchers to evaluate the information contentof cash flow components.
Livnat and Zarowin (1990) disaggregated cash flow into its operating, financing and investingcomponents. They concluded that the disaggregation of cash flows into operating cash flows andaccruals does not improve the relationship between cash flows and security returns beyond thecontribution of net income. Further, they find that there is an improved degree of association betweenfinancing and operating cash flows and security returns.
Sloan (1996) found that stock prices "fail to reflect fully information contained in the accrualand cash flow components of current earnings until that information impacts future earnings". Cash flowis defined in this study as the income from continuing operations less accruals. Again, the uncertaintyof the accrual calculations limits the accuracy of this proxy for cash flows.
Stunda (1996) found that reported cash flows, when disaggregated by operating, financing andinvesting components, have a greater relationship with security returns than with the disaggregatedestimates reported by Livnat and Zarowin (1990).
Dechow et al (1998) disaggregates the accrual components of cash flows and finds that somehave greater predictive value on security returns than others.
Barth et al (2002) pick up on the Dechow et al study (1998) and circle back to the findings ofthe studies from the 1980’s and re-assert that accruals have a greater predictive ability of security returnsthan do actual cash flows, thereby contradicting the finding of Stunda (1996).
So given all of this, the pertinent question becomes, what is a better predictor of security returns,actual cash flows reported by firms or estimates predicated on accrual components? This study seeksto answer that question using a sample that spans a period greater than any study previously along witha greater number of sample firms than ever before studied.

page 86 Allied Academies International Conference
Las Vegas, 2005 Proceedings of the Academy of Accounting and Financial Studies, Volume 10, Number 2
HYPOTHESIS DEVELOPMENT
As previously noted, recent studies [Dechow et al (1998) and Barth et al (2002)] conclude thatwhen accounting accruals are disaggregated by components, various components provide a greaterrelationship to security returns, than do actual reported cash flows, and thus greater predictive value.Stunda (1996) found that actual reported cash flows greater predictive value than accounting estimates(i.e., accruals) in total.
Using a larger sample of firms and periods, the predictive value of actual cash flows is testedagainst the accounting accrual components. The expectation of the study is that actual reported cashflows have greater predictive value in relation to security returns than do accounting estimates asrepresented by various accruals. Thus stated in the null form:H1: Reported actual cash flows are not significantly different from accounting accrual estimates intheir predictive value of security returns.
RESEARCH DESIGN
The sample firms are selected from the Compustat Annual Industrial File and from the CRSPMonthly Returns File for the period 1993-2004. Only firms with reported data for the entire sampleperiod are included in the study. Cumulative abnormal returns are generated for sample firms for athree day period centered on the release date of cash flow data. Each component of cash flow isassessed for information content relative to the abnormal returns for the three-day window. Table 1summarizes the sample firms included in the study.
Table 1Sample Summary
Number of FirmsOriginal sample 5,380Firms with insufficient Compustat data 619Firms with insufficient CRSP data 388Final sample 4,373
Utilizing a similar technique of previous cash flow studies, we estimate the expectation modelusing the Wilson (1987) method. Wilson applied OLS estimation to a pooled cross-section of firms,which assumes that model parameters are the same for all firms. The functional form of the expectationmodel is the same as that use in Wilson [1986 and 1987], and Bernard and Stober (1989). Thismethodology is perceived to be more accurate than the random walk model used by Livnat and Zarowin(1990).
Abnormal returns are generated for event days –1, 0, and +1, where day 0 is the release date offirm cash flow data. Derivation of abnormal returns is as follows:
Arit=Rit-BiRMtCARit=ΣARit
Where: Rit = Return for security iBi = Estimated slope coefficient of market model for security iRMt = Market adjusted model
Wilson (1987) finds that most firms’ earnings and cash flow releases are separate events.Documents used to release cash flow data include annual reports and 10-Ks. Therefore, primary releasedates of these documents are used to proxy for the release date of cash flow data. The market modelis utilized along with the CRSP equally weighed market index and regression parameters are estimated

Allied Academies International Conference page 87
Proceedings of the Academy of Accounting and Financial Studies, Volume 10, Number 2 Las Vegas, 2005
between days –290 and –91. Abnormal returns are then summed to calculate a cumulative abnormalreturn.
In order to assess the information content of cash flow from operations as utilized in the studiesof Dechow et al (1998), and Barth et al (2002), the following regression equation is utilized:
CARit=a+b1AR+b2AP+b3I+b4D+b5A+eit (1)
Where: CAR =The measure of abnormal returns for firm i, period ta =The intercept coefficientb1 =The coefficient associated with the annual change in accounts receivable accrualb2 =The coefficient associated with the annual change in accounts payable accrualb3 =The coefficient associated with the annual change in inventory accrualb4 =The coefficient associated with the annual change in depreciation accrualb5 =The coefficient associated with the annual change in amortization accruale =Error term for firm i, period t
The study by Stunda (1996) was evaluated utilizing the following equation:
CARit=a+b1CFO+b2CFI+b3CFF+eit (2)
Where: CAR =The measure of abnormal returns for firm i, period ta =The intercept coefficientb1 =The coefficient associated with operating cash flowsb2 =The coefficient associated with investing cash flowsb3 =The coefficient associated with financing cash flowse =Error term for firm i, period t
RESULTS
Equation (1) was run using year over year changes in accounting accruals for all 4,373 firms forthe periods 1993-2004. The accruals used represent those accruals to be significant in predictingsecurity returns in Dechow et al (1998) and Barth et al (2002). The results are presented in Table 2.As can be seen from the table, each of the accrual variables does have statistical significance rangingfrom a p-value of .07 (accounts receivable accrual) to .15 (amortization accrual). However, many ofthese values do not fall into traditional significant levels.
Table 2Regression Results for coefficients associated with accrual components
CARit=a+b1AR+b2AP+b3I+b4D+b5A+eit (1)Coefficient
(1)Mean
(2)t-statistic
(3)p-Value
(4)F-Statistic
(5)Mean
(Adjusted) R2 (6)B1-Accounts Receivable .15 2.12 .07 6.91 .054B2-Accounts Payable .11 1.96 .10 3.81 .034B3-Inventory .09 1.88 .11 4.19 .020B4-Depreciation .12 1.85 .12 3.98 .013B5-Amortization .08 1.62 .15 2.87 .014
Equation (2) was run using actual reported cash flow amounts, by the three disaggregated sub-categories of cash flow specified in SFAS #95. This is comparable to the methodology reported in

page 88 Allied Academies International Conference
Las Vegas, 2005 Proceedings of the Academy of Accounting and Financial Studies, Volume 10, Number 2
Stunda (1996). The results are presented in Table 3. As can be seen from the table, when using actualcash flow components, overall cash flows result in a higher R2. Also, cash flows from operatingactivities result in a p-value of .01, which is significant at traditional levels, although the cash flowsfrom investing and financing activities are not statistically significant (similar to Stunda (1996) andother past cash flow studies). These results lead to a rejection of the hypothesis that both accountingaccruals and actual cash flow components have similar information content, and thus predictive value,pertaining to security returns. It has been demonstrated that actual cash flows, operating cash flows inparticular, lend themselves to greater predictive capabilities than do accounting estimates, typifiedthrough accruals. These results support the findings of Stunda (1996).
Table 3Regression Results for coefficient of independent variables for operating, investing, and financing cash flows
CARit= a + b1CFO +b2CFI + b3CFF + eit (2)Model
[Mean (Adjusted) R2] (1)Coefficient
(2)Mean
(3)t-statistic
(4)p-Value
(5)F-Statistic
(6)
ReportedCash Flow
[.186]
Operating Cash Flow (b1) .12 2.65 .01 5.42Investing Cash Flows (b2) .08 .98 .19 .89Financing Cash Flows (b3) .05 .42 .87 .63
CONCLUSIONS
This study compares prior cash flow studies, which utilize cash flow estimates in determiningrelationships to security returns and predictive value, to actual cash flows as propounded in Stunda(1996), which indicates a higher relationship to security returns and predictive value. Even whendisseminating estimate components into their accruals, this study shows that actual cash flows reportedby firms still exhibit a higher degree of correlation to security returns and thus establish a moresignificant basis upon which to predict security returns.
The implication of this study on future cash flow research should be quite clear. Only actualcash flow amounts should be used for the purposes of conveying high quality and more realisticassociations to investors and managers.
REFERENCES
Barth, M.E., D.P. Cram, and K.K. Nelson. 2002. Accruals and the Prediction of Future Cash Flows. The Accounting Review76: 27-58.
Bernard, V.L. and T.L. Stober. 1989. The Nature and Amount of Information in Cash Floes and Accruals. The AccountingReview 64(4): 624-651
Livnat, J. and P. Zarowin. 1990. The Incremental Information Content of Cash-Flow Components. Journal of Accountingand Economics 13(1): 25-46
Stunda, R.A., 1996. An Investigation of Cash Flow Proxies in Accounting Research. Journal of Accounting and Finance
Wilson, G.P. 1986. The Relative Information Content of Accruals and Cash Floes: Combined Evidence at the EarningsAnnouncement and Annual Report Release Date. Journal of Accounting Research 24(Supp): 165-200
Wilson, G.P. 1987. The Incremental Information Content of the Accrual and Funds Components of Earnings AfterControlling for Earnings. The Accounting Review 62(2):293-321
Allied Academies International Conference page 89
Proceedings of the Academy of Accounting and Financial Studies, Volume 10, Number 2 Las Vegas, 2005
THE NOVEMBER EFFECT AND TAX LOSS SELLING:AN EMPIRICAL INVESTIGATION
Randall Valentine, Georgia Southwestern State [email protected]
John Kooti, Georgia Southwestern State [email protected]
ABSTRACT
The January Effect is a well-documented stock market anomaly that is characterized byabnormally high stock returns in the first couple of weeks of the New Year. The predominantexplanation of why this January Effect exists is the tax loss-selling hypothesis, which states that stocksare sold towards the end of the year for tax reasons and subsequently re-bought at the first of the year.The passage of the Tax Reform Act of 1986, which changed the fiscal year end for institutional investorsfrom December 31st to October 31st, allows the authors to test in isolation the tax loss-sellinghypothesis. Two things should be expected as a result of the Tax Reform Act: First, the existence of aso-called "November Effect" post 1986, and second, the dissipation of the January Effect. The evidencepresented in the paper cooborates neither.

page 90 Allied Academies International Conference
Las Vegas, 2005 Proceedings of the Academy of Accounting and Financial Studies, Volume 10, Number 2

Allied Academies International Conference page 91
Proceedings of the Academy of Accounting and Financial Studies, Volume 10, Number 2 Las Vegas, 2005
DEMAND FOCUSED SUPPLY CHAIN MANAGEMENTSankaran Venkateswar, Trinity University
INTRODUCTION
Supply chain superiority is the winning formula for successful companies in a competitiveglobal environment. This involves the ability to shape and respond to shifts in customer demand withinnovative products and services.
After much hype and fanfare surrounding the emergence of Supply Chain Management (SCM),the failure of large scale vendors such as i2 Technologies and write down of large investments in SCMby companies such as Cisco systems has soured the promise and potential of SCM. However, a carefulstudy indicates that the primary contributing factor was a failure to understand and properly gaugedemand.
The success of demand driven companies such as Dell and Wal-Mart underline the importanceof incorporating demand data into SCM. Incorporating demand data into SCM leads to a more dynamicDemand Focused Supply Chain Management (DFSCM) that integrates demand data and processesacross the supply networks of customers, suppliers and employees with the objective of balancingrevenues against costs.
DEMAND FOCUSED SUPPLY CHAIN MANAGEMENT
DFSCMs require reorienting existing SCMs to include the following:
Demand dataTraditional SCMs have focused on structured data pertaining to cost, demand, etc. DFSCMs
should attempt to incorporate unstructured and random demand signals from customers and suppliers.Incorporating accurate demand data leads to perfect order fulfillment, lower inventory levels and shortercash-to-cash cycle times. There are three types of demand signals that have to be incorporated intoDFSCM. They are:
• Replenishment-based demand: This is predictable in nature and forms the basis forforecasting and planning. Point-of sale (POS) data helps in predicting replenishment-based demand.
• Surge demand: This is unpredictable and requires sophisticated demand modeling andforecasting. Many SCM vendors are now focused on addressing this issue.
• Future demand: This involves strategic planning for future products and their effect oncustomer buying patterns.
Performance Metric for Supply Chain ExcellenceA valuable metric to measure supply chain excellence is demand fulfillment capability.
Tracking bottlenecks in fulfilling demand allows the manager to focus on the levers of supply chain thatyield the most benefit from investment. Demand fulfillment that assures customer satisfaction requiresthat the order is complete, accurate, on time and in perfect condition. Deficiencies that may preventdemand fulfillment may include:
page 92 Allied Academies International Conference
Las Vegas, 2005 Proceedings of the Academy of Accounting and Financial Studies, Volume 10, Number 2
Orders not delivered on time, due to:• Stock-out/manufacturing delay• Late Shipment• In transit/delivery delays
Orders not meeting customer requirements, due to:• Inaccurate shipment• Poor quality of finished goods• Damage to finished goods in transit
These deficiencies may be traced to the root cause of such problems through an analysis of SCM. Theanalysis may lead to:
• Inventories: Are there adequate levels of inventories?• Demand Visibility: Is there a good view of upcoming demand?• Schedule Variance: Are products manufacture according to schedule?• Supply meeting demand: If there is no coordination there may be enough quantities of
wrong inventory.
New Technologies New technologies such as Radio Frequency Identification (RFID), Point of Sale (POS) data are
emerging to tap into real time demand data. These technologies provide unit level demand visibilityand can help maximize profit by swiftly reacting to changing customer demand.
Radio Frequency Identification: This is a revolutionary way to keep track of inventory in thesupply chain. Real-time access to data will revolutionize all aspects of SCM in the following ways:
• RFID tags will provide 24x7 view of material availability• This information can be shared with suppliers and customers• Locating parts in real time reduces risk of loss and as well as costs associated with
physical inventories and cycle counting
The advantages that improved information availability generates and the likely supply chain costsavings that RFID creates makes it an essential technology for companies looking to remaincompetitive.
Summary
The keys to SCM success is characterized by the following supply chain metrics:• Perfect order rate resulting in demand fulfillment• Total supply chain costs• Demand forecast accuracy• Cash-to-cash cycle time
Of particular importance is demand forecast accuracy. It creates high responsiveness and cuts coststhrough the supply chain. It also correlates with perfect-order fulfillment. DFSCM performance isclosely linked to overall financial performance.

Allied Academies International Conference page 93
Proceedings of the Academy of Accounting and Financial Studies, Volume 10, Number 2 Las Vegas, 2005
RESPONSE MEASURES USED FOR FINANCIALDISTRESS AND THEIR IMPACT ON RESULTS
Terry J. Ward, Middle Tennessee State [email protected]
ABSTRACT
Since the 1960s, researchers have used an ability to predict financial distress criterion toevaluate the usefulness of competing accounting methods. These researchers used various responsevariables as proxies for economic financial distress. Many researchers used various dichotomousmeasures of financial distress such as nonfailed versus failed, healthy versus loan default, ornonbankrupt versus bankrupt response variables for financial distress. Some more recent studies usedmulti-state response variables for financial distress. Researchers often compare results across thesedifferent studies, attempting to make conclusions concerning the usefulness of particular accountinginformation. However, comparisons are valid only if the various response variables used by the variousstudies have construct validity; the different response variables all measure the same intendedconstruct, economic financial distress.
The primary purpose of this paper is to determine the validity of various response variables offinancial distress by observing the stability of results across these different response variables. Similarresults across the different response variables would suggest that researchers could validly compareresults of the various financial distress studies. However, results that vary depending on the responsevariable used would indicate that different response variables may actually measure differentconstructs, and that the results reported in previous studies may be dependent on the response variableused. The findings of this study suggest that results vary across the response variables used for financialdistress. Thus, one cannot validly compare the results of prior financial distress studies that useddifferent measures of financial distress. The results of this study suggest that the various responsevariables are not equal measure of financial distress. Results seem to suggest that a multi-state responsemeasure may be the more valid measure of economic financial distress.

page 94 Allied Academies International Conference
Las Vegas, 2005 Proceedings of the Academy of Accounting and Financial Studies, Volume 10, Number 2

Allied Academies International Conference page 95
Proceedings of the Academy of Accounting and Financial Studies, Volume 10, Number 2 Las Vegas, 2005
REINSURANCE ACCOUNTING UNDER SFASNO. 113: AN EMPIRICAL EXAMINATION OF
ACCOUNTING POLICY AND ITS DIFFERENTIALIMPACT TO INSURERS
Jane M. Weiss, Arizona State [email protected]
ABSTRACT
The purpose of this study is to examine whether insurers are differentially affected byaccounting policy because of their size. In examining SFAS No.113, I argue that the cost of reportingfor reinsurance activities under SFAS No. 113 are greater for smaller insurers because they are lessable to respond to the reinsurance reporting requirements under SFAS No.113.
Specifically, this study examines earnings volatility and leverage indicators in the periods priorto and following SFAS No. 113. Because various constituencies use these indicators as proxies inmeasuring operating, financing, and regulatory risks, identifying any changes in the measures betweenperiods is a necessary step in determining whether there are potential economic consequences from theimplementation of SFAS No. 113. Results from a paired-sample of 339 insurers find that earningsvolatility and leverage were impacted by the implementation of SFAS No 113 and that smaller insurerswere not able to counteract, with alternative actions, the impact of SFAS No. 113’s reportingrequirements.
Because of the current alleged misuse of finite reinsurance, FASB and the SEC is currently re-evaluating the deficiencies in the reporting of reinsurance contracts. Findings of this study are relevantto the debate on reinsurance accounting as well as to the debate on how accounting policy differentiallyaffects firms.

page 96 Allied Academies International Conference
Las Vegas, 2005 Proceedings of the Academy of Accounting and Financial Studies, Volume 10, Number 2

Allied Academies International Conference page 97
Proceedings of the Academy of Accounting and Financial Studies, Volume 10, Number 2 Las Vegas, 2005
REINSURANCE ACCOUNTING UNDER SFAS NO. 113:AN EMPIRICAL EXAMINATION OF ITS
VALUE-RELEVANCEJane M. Weiss, Arizona State University
ABSTRACT
This paper investigates whether SFAS No. 113, "Accounting and Reporting for Reinsurance ofShort-Duration and Long-Duration Contracts," provides incremental value-relevant informationrelative to the preceding statement, SFAS No. 60. There is a general concern among preparers, users,and regulators that more information about the impact of reinsurance contracts is needed.
SFAS No. 113 addresses these concerns by establishing criteria for classifying a contract asreinsurance and prescribing accounting and reporting standards for reinsurance contracts. My studyexamines the proper measurement of reinsurance assets and the mandated disclosures regardingreinsurance contracts. Implementing a dual-approach association model, I base my research on asample of 83 publicly-held property-liability insurance holding companies. I find that the measurementrequirements under SFAS No. 113 are incrementally value-relevant. I find marginal incrementalvalue-relevance on SFAS No. 113's disclosure requirements. The disclosure results support FASB'sdecision to re-evaluate reinsurance accounting.
Much of contemporary accounting research examines how financial information is used toassess firms' risks, especially financial performance risk. This study identifies a homogeneous settingwhere the regulation of risk related activities has escalated over time, thus requiring improvedreporting of risk management activities. The study provides an opportunity to make inferences aboutincreased reporting and disclosing for risk management activities by non-regulated firms.

page 98 Allied Academies International Conference
Las Vegas, 2005 Proceedings of the Academy of Accounting and Financial Studies, Volume 10, Number 2

Allied Academies International Conference page 99
Proceedings of the Academy of Accounting and Financial Studies, Volume 10, Number 2 Las Vegas, 2005
THE VALUATION IMPLICATIONS OF PAST ANDFUTURE INVESTMENTS IN INFORMATIONTECHNOLOGY: THE CASE OF FIRM'S Y2K
COMPLIANCE COSTSSamuel L. Tiras, Suny At Buffalo
Jerry L. Turner, The University Of MemphisClark M. Wheatley, Florida International University
ABSTRACT
This study examines the extent to which both past and expected future investments ininformation technology are value relevant. Prior research has provided mixed results on this issue. Bycontrolling for expected future costs as well as current expenditures, and showing that the valuerelevance of investments in information technology are conditional on future growth, our findingsprovide an explanation for the contradictory results of prior research. Our findings indicate thatexpected future expenditures are positively valuation relevant only for high-growth firms, and thisrelevance is significantly greater than that of aggregate accounting earnings. The value relevance ofcurrent period Y2K expenditures is found, for both high- or low-growth firms, to be consistent withother types of expenses recognized in earnings.

page 100 Allied Academies International Conference
Las Vegas, 2005 Proceedings of the Academy of Accounting and Financial Studies, Volume 10, Number 2

Allied Academies International Conference page 101
Proceedings of the Academy of Accounting and Financial Studies, Volume 10, Number 2 Las Vegas, 2005
THE DETERMINANTS OF THE REINSURANCE DECISION BY LIFE INSURANCE COMPANIES
Raja Bouzouita , Central Missouri State [email protected]
Arthur J. Young, Central Missouri State [email protected]
ABSTRACT
Risk management is central to any business including insurance companies, and reinsuranceis one of the several risk management tools available to insurance companies. Insurance companiesrely on reinsurance to expand capacity, reduce underwriting risk and reduce the likelihood of financialdistress. This article investigates the determinants of the reinsurance decision by life insurancecompanies using research hypotheses in accordance to the motives of risk management practices.Using a cross section data for U.S. life insurance companies, we find measures of underwriting risk,tax incentives, and agency costs are significant determinants of the reinsurance decision.

page 102 Allied Academies International Conference
Las Vegas, 2005 Proceedings of the Academy of Accounting and Financial Studies, Volume 10, Number 2

Allied Academies International Conference page 103
Proceedings of the Academy of Accounting and Financial Studies, Volume 10, Number 2 Las Vegas, 2005
Authors’ IndexAmadi, C . . . . . . . . . . . . . . . . . . . . . . . . . . . . . . . . . . . . . . . . . . . . . . . . . . . . . . . . . . . . . . . . . . . . 1Armstrong, V . . . . . . . . . . . . . . . . . . . . . . . . . . . . . . . . . . . . . . . . . . . . . . . . . . . . . . . . . . . . . . . . 11Ates, A . . . . . . . . . . . . . . . . . . . . . . . . . . . . . . . . . . . . . . . . . . . . . . . . . . . . . . . . . . . . . . . . . . . . . 53Beirne, Jr., T . . . . . . . . . . . . . . . . . . . . . . . . . . . . . . . . . . . . . . . . . . . . . . . . . . . . . . . . . . . . . . . . . 23Bolt, C . . . . . . . . . . . . . . . . . . . . . . . . . . . . . . . . . . . . . . . . . . . . . . . . . . . . . . . . . . . . . . . . . . . . . 13Bouzouita, R . . . . . . . . . . . . . . . . . . . . . . . . . . . . . . . . . . . . . . . . . . . . . . . . . . . . . . . . . . 15, 17, 101Brahmasrene, T . . . . . . . . . . . . . . . . . . . . . . . . . . . . . . . . . . . . . . . . . . . . . . . . . . . . . . . . . . . . . . . 53Brown, W . . . . . . . . . . . . . . . . . . . . . . . . . . . . . . . . . . . . . . . . . . . . . . . . . . . . . . . . . . . . . . . . . . . 19Campbell, S . . . . . . . . . . . . . . . . . . . . . . . . . . . . . . . . . . . . . . . . . . . . . . . . . . . . . . . . . . . . . . . . . 21Canfield, D . . . . . . . . . . . . . . . . . . . . . . . . . . . . . . . . . . . . . . . . . . . . . . . . . . . . . . . . . . . . . . . . . . 39Case, C . . . . . . . . . . . . . . . . . . . . . . . . . . . . . . . . . . . . . . . . . . . . . . . . . . . . . . . . . . . . . . . . . . . . . 61Choudhury, A . . . . . . . . . . . . . . . . . . . . . . . . . . . . . . . . . . . . . . . . . . . . . . . . . . . . . . . . . . . . . . . 21Christie, N . . . . . . . . . . . . . . . . . . . . . . . . . . . . . . . . . . . . . . . . . . . . . . . . . . . . . . . . . . . . . . . . . . . 23Corless, J . . . . . . . . . . . . . . . . . . . . . . . . . . . . . . . . . . . . . . . . . . . . . . . . . . . . . . . . . . . . . . . . . . . . 23Cullinan, C . . . . . . . . . . . . . . . . . . . . . . . . . . . . . . . . . . . . . . . . . . . . . . . . . . . . . . . . . . . . . . . . . . 25Darcy, J . . . . . . . . . . . . . . . . . . . . . . . . . . . . . . . . . . . . . . . . . . . . . . . . . . . . . . . . . . . . . . . . . . . . . 27Dawkins, M . . . . . . . . . . . . . . . . . . . . . . . . . . . . . . . . . . . . . . . . . . . . . . . . . . . . . . . . . . . . . . . . . 29Dheeriya, P . . . . . . . . . . . . . . . . . . . . . . . . . . . . . . . . . . . . . . . . . . . . . . . . . . . . . . . . . . . . . . . . . . 31Douthett, E . . . . . . . . . . . . . . . . . . . . . . . . . . . . . . . . . . . . . . . . . . . . . . . . . . . . . . . . . . . . . . . . . . 35Duchac, J . . . . . . . . . . . . . . . . . . . . . . . . . . . . . . . . . . . . . . . . . . . . . . . . . . . . . . . . . . . . . . . . . . . 35Dye, J . . . . . . . . . . . . . . . . . . . . . . . . . . . . . . . . . . . . . . . . . . . . . . . . . . . . . . . . . . . . . . . . . . . . . . 37Ethridge, J . . . . . . . . . . . . . . . . . . . . . . . . . . . . . . . . . . . . . . . . . . . . . . . . . . . . . . . . . . . . . . . . . . . 39Findlay, J . . . . . . . . . . . . . . . . . . . . . . . . . . . . . . . . . . . . . . . . . . . . . . . . . . . . . . . . . . . . . . . . . . . 65Fischer, M . . . . . . . . . . . . . . . . . . . . . . . . . . . . . . . . . . . . . . . . . . . . . . . . . . . . . . . . . . . . . . . . . . . 61Fowler, L . . . . . . . . . . . . . . . . . . . . . . . . . . . . . . . . . . . . . . . . . . . . . . . . . . . . . . . . . . . . . . . . . . . 41Gardner, N . . . . . . . . . . . . . . . . . . . . . . . . . . . . . . . . . . . . . . . . . . . . . . . . . . . . . . . . . . . . . . . . . . 11Graves, S. . . . . . . . . . . . . . . . . . . . . . . . . . . . . . . . . . . . . . . . . . . . . . . . . . . . . . . . . . . . . . . . . . . . 45Harris, D . . . . . . . . . . . . . . . . . . . . . . . . . . . . . . . . . . . . . . . . . . . . . . . . . . . . . . . . . . . . . . . . . . . . 47He, Y . . . . . . . . . . . . . . . . . . . . . . . . . . . . . . . . . . . . . . . . . . . . . . . . . . . . . . . . . . . . . . . . . . . . . . 55Huang, J . . . . . . . . . . . . . . . . . . . . . . . . . . . . . . . . . . . . . . . . . . . . . . . . . . . . . . . . . . . . . . . . . . . . 53Hughes, S . . . . . . . . . . . . . . . . . . . . . . . . . . . . . . . . . . . . . . . . . . . . . . . . . . . . . . . . . . . . . . . . . . . 25Hume, E . . . . . . . . . . . . . . . . . . . . . . . . . . . . . . . . . . . . . . . . . . . . . . . . . . . . . . . . . . . . . . . . . . . . 19Hyatt, T . . . . . . . . . . . . . . . . . . . . . . . . . . . . . . . . . . . . . . . . . . . . . . . . . . . . . . . . . . . . . . . . . . . . . 57Idsal, W . . . . . . . . . . . . . . . . . . . . . . . . . . . . . . . . . . . . . . . . . . . . . . . . . . . . . . . . . . . . . . . . . . . . 69Jalbert, T . . . . . . . . . . . . . . . . . . . . . . . . . . . . . . . . . . . . . . . . . . . . . . . . . . . . . . . . . . . . . . . . . . . 59Kamath, R . . . . . . . . . . . . . . . . . . . . . . . . . . . . . . . . . . . . . . . . . . . . . . . . . . . . . . . . . . . . . . . . . . . 55King, D . . . . . . . . . . . . . . . . . . . . . . . . . . . . . . . . . . . . . . . . . . . . . . . . . . . . . . . . . . . . . . . . . . . . . 61Kissinger, J . . . . . . . . . . . . . . . . . . . . . . . . . . . . . . . . . . . . . . . . . . . . . . . . . . . . . . . . . . . . . . . . . . 63Kooti, J . . . . . . . . . . . . . . . . . . . . . . . . . . . . . . . . . . . . . . . . . . . . . . . . . . . . . . . . . . . . . . . . . . . . . 89Krumwiede, K . . . . . . . . . . . . . . . . . . . . . . . . . . . . . . . . . . . . . . . . . . . . . . . . . . . . . . . . . . . . . . . 67Marsh, T . . . . . . . . . . . . . . . . . . . . . . . . . . . . . . . . . . . . . . . . . . . . . . . . . . . . . . . . . . . . . . . . . . . . 39Ortegren, A . . . . . . . . . . . . . . . . . . . . . . . . . . . . . . . . . . . . . . . . . . . . . . . . . . . . . . . . . . . . . . . . . . 57Paik, G . . . . . . . . . . . . . . . . . . . . . . . . . . . . . . . . . . . . . . . . . . . . . . . . . . . . . . . . . . . . . . . . . . 65, 67Parker, P . . . . . . . . . . . . . . . . . . . . . . . . . . . . . . . . . . . . . . . . . . . . . . . . . . . . . . . . . . . . . . . . . . . . 79Phillips, D . . . . . . . . . . . . . . . . . . . . . . . . . . . . . . . . . . . . . . . . . . . . . . . . . . . . . . . . . . . . . . . . 23, 69Reed,B . . . . . . . . . . . . . . . . . . . . . . . . . . . . . . . . . . . . . . . . . . . . . . . . . . . . . . . . . . . . . . . . . . . . . 57Rose-Green, E . . . . . . . . . . . . . . . . . . . . . . . . . . . . . . . . . . . . . . . . . . . . . . . . . . . . . . . . . . . . . . . . 29

page 104 Allied Academies International Conference
Las Vegas, 2005 Proceedings of the Academy of Accounting and Financial Studies, Volume 10, Number 2
Ryu, T . . . . . . . . . . . . . . . . . . . . . . . . . . . . . . . . . . . . . . . . . . . . . . . . . . . . . . . . . . . . . . . . . . . . . . 71Sale, M . . . . . . . . . . . . . . . . . . . . . . . . . . . . . . . . . . . . . . . . . . . . . . . . . . . . . . . . . . . . . . . . . . 73, 79Schieven, C . . . . . . . . . . . . . . . . . . . . . . . . . . . . . . . . . . . . . . . . . . . . . . . . . . . . . . . . . . . . . . . . . . 59Stowe, C . . . . . . . . . . . . . . . . . . . . . . . . . . . . . . . . . . . . . . . . . . . . . . . . . . . . . . . . . . . . . . . . . . . . 83Stunda, R . . . . . . . . . . . . . . . . . . . . . . . . . . . . . . . . . . . . . . . . . . . . . . . . . . . . . . . . . . . . . . . . . . . 85Tiras, S . . . . . . . . . . . . . . . . . . . . . . . . . . . . . . . . . . . . . . . . . . . . . . . . . . . . . . . . . . . . . . . . . . . . . 99Turner, J . . . . . . . . . . . . . . . . . . . . . . . . . . . . . . . . . . . . . . . . . . . . . . . . . . . . . . . . . . . . . . . . . . . . 99Valentine, R . . . . . . . . . . . . . . . . . . . . . . . . . . . . . . . . . . . . . . . . . . . . . . . . . . . . . . . . . . . . . . . . . 89Venkateswar, S . . . . . . . . . . . . . . . . . . . . . . . . . . . . . . . . . . . . . . . . . . . . . . . . . . . . . . . . . . . . . . . 91Ward, T . . . . . . . . . . . . . . . . . . . . . . . . . . . . . . . . . . . . . . . . . . . . . . . . . . . . . . . . . . . . . . . . . . . . . 93Weiss, J . . . . . . . . . . . . . . . . . . . . . . . . . . . . . . . . . . . . . . . . . . . . . . . . . . . . . . . . . . . . . . . . . . 95, 97Wheatley, C . . . . . . . . . . . . . . . . . . . . . . . . . . . . . . . . . . . . . . . . . . . . . . . . . . . . . . . . . . . . . . . . . 99Young, A . . . . . . . . . . . . . . . . . . . . . . . . . . . . . . . . . . . . . . . . . . . . . . . . . . . . . . . . . . . . 15, 17, 101