Emile Benveniste, de l'Alaska à Baudelaire: d'inconnu en ...
JOURNAL OF FINANCIAL AND QUANTITATIVE ANALYSIS Vol. 46, No. 5, Oct. 2011, pp. 1193–1225COPYRIGHT 2011, MICHAEL G. FOSTER SCHOOL OF BUSINESS, UNIVERSITY OF WASHINGTON, SEATTLE, WA 98195doi:10.1017/S0022109011000317
Purchasing IPOs with Commissions
Michael A. Goldstein, Paul Irvine, and Andy Puckett∗
Abstract
We find direct evidence that institutions increase round-trip stock trades, increase aver-age commissions per share, and pay unusually high commissions on some trades in orderto send abnormally high commissions to the lead underwriters of profitable initial pub-lic offerings (IPOs). These excess commission payments are a particularly effective wayfor transient investors to receive lucrative IPO allocations. Our results suggest that theunderwriter’s concern for their long-term client relationships limits the payment-for-IPOpractice. We estimate that abnormal commission payments are large for the most profitableissues, and that an additional $1 excess commission payment to the lead underwriter resultsin $2.21 in investor profits from allocated shares.
I. Introduction
Institutional investors are justifiably interested in receiving initial public of-fering (IPO) allocations given the historical profitability of these positions. The1,555 firms that went public from 1999 to 2005 left more than $82 billion onthe table.1 Since lead underwriters have significant discretion in allocating shareswhen bookbuilding is used, much of the lobbying by institutional investors islikely directed toward the lead underwriter.2 Existing academic theories seeking
∗Goldstein, [email protected], Finance Division, Babson College, 322 Tomasso Hall, BabsonPark, MA 02457; Irvine, [email protected], Terry College of Business, University of Georgia,444 Brooks Hall, Athens, GA 30602; and Puckett, [email protected], College of Business Adminis-tration, University of Tennessee, 437 Stokely Mgmt. Center, Knoxville, TN 37996. We thank AncernoLtd. (formerly the Abel/Noser Corporation), Allison Keane, and Judy Maiorca for providing the data.We also thank Dan Bradley, John Griffin, Charles Hadlock, Kathleen Hanley, Eugene Kandel, LaurieKrigman, Jim Linck, Marc Lipson, Alexander Ljungqvist, Tim Loughran (the referee), Paul Malatesta(the editor), Jonathan Reuter, Chester Spatt, Kent Womack, Donghang Zhang, and seminar partic-ipants at the 2007 American Finance Association (AFA) conference, the 2007 Financial Manage-ment Association meetings, the 2006 Harvard Entrepreneurship, Venture Capital, and Initial PublicOfferings (EVI) conference, Bentley College, Clemson University, the University of Missouri, theUniversity of Nebraska, Syracuse University, and the University of Virginia for their helpful com-ments. Goldstein acknowledges financial support provided by the Babson Faculty Research Facility.
1Money left on the table is defined as the difference between the 1st-day closing price andthe offer price times the number of shares offered as in Loughran and Ritter (2002). We ob-tain information for the total dollar value of money left on the table from Jay Ritter’s Web site:http://bear.cba.ufl.edu/ritter/Moneybyyear.pdf. We thank Jay Ritter for providing this data.
2Boehmer, Boehmer, and Fishe (2006) find that the lead underwriter is responsible for allocatingapproximately 75% of the total number of shares offered.
1193
1194 Journal of Financial and Quantitative Analysis
to explain the allocation decisions of underwriters suggest that underwriters re-ceive tangible or intangible benefits in return for allocating shares to certain in-vestors. For example, Benveniste and Spindt (1989) suggest that IPO allocationsencourage privately informed investors to reveal their information to the lead un-derwriter. While this intangible benefit might be a factor in allocation decisions,it is also possible that underwriters allocate IPO shares to investors who providethem with more tangible benefits. According to the agency view advocated byLoughran and Ritter (2002), (2004), investors will engage in rent-seeking behav-ior, such as sending trading commissions to the underwriter’s brokerage arm, toincrease their probability of being allocated profitable IPO shares.
Recent survey evidence by Jenkinson and Jones (2009) raises doubts con-cerning the extent of information production by institutional investors in the IPOprocess, and instead provides support for the agency view. Both large and smallinstitutions responding to their survey indicate that brokerage commissions paidto the underwriter are the most important determinant in receiving IPO alloca-tions. Similarly, documents from the National Association of Securities Dealers(NASD) report that Robertson Stephens used an index, ranking investors by com-missions paid over the previous 18 months, to decide who would receive profitableIPO allocations.3 This evidence is consistent with empirical findings by Goldstein,Irvine, Kandel, and Wiener (2009), who suggest that institutions concentrate theirtrading with particular brokerage firms and in return, receive preferential treat-ment with regard to brokerage services.
The purpose of this study is to investigate the relationship between tradingcommissions and IPO allocations directly. We are aware of only 2 other studiesthat attempt to investigate this relationship, albeit less directly. Using semiannualmutual fund reports, Reuter (2006) finds a positive correlation between the com-missions paid to an underwriter and a mutual fund family’s holdings of recentprofitable IPOs from that same underwriter. His findings suggest that lead under-writers allocate profitable IPOs to investors who provide a stable stream of com-mission revenue. Alternatively, Nimalendran, Ritter, and Zhang (NRZ) (2007)find some evidence that aggregate trading volume in the 50 most liquid stocks isrelated to subsequent money left on the table. They suggest that transient investorsare churning stocks in the period immediately preceding the IPO in order to sendcommissions to the lead underwriter.4 The stable and transient investor views ofIPO allocation contracting are paradoxical, since 2 distinct investor groups re-ceive preference in IPO allocations.5 In addition, both studies are constrained by
3According to the Securities and Exchange Commission (SEC), the allocation of IPO shares basedon past or expected future commission business is legal. However, lead underwriters are restrictedfrom sharing in any client profits that may result from underpricing. See Letter of Acceptance, Waiver,and Consent sent to the NASD (no. CAF030001).
4NRZ (2007) do not have information on trading commissions or the brokerage firm involved ineach trade; thus, inference concerning the behavior of transient investors is circumstantial.
5For clarity, we refer to stable and transient investor groups using different methods to pay forIPO allocation. In our paper, these investor groups refer to 2 distinct implicit contracts: a stable long-term commission payment and a transient spot payment at the time of IPO issuance. We find thatstable clients tend to use the long-term commission payment and transient clients tend to use thespot contract, but the contracts are not mutually exclusive, and both types of investors could use bothmethods of payment to a greater or lesser extent.
Goldstein, Irvine, and Puckett 1195
both IPO allocation and commission data limitations. In this paper, we reconcileReuter’s stable investor view with NRZ’s transient investor evidence, and providenew and more detailed evidence of commission payments for IPO allocations us-ing a proprietary database of institutional trades.
Our paper makes several distinct contributions to the existing literature. First,we describe a world where stable and transient investors coexist and makepayments to underwriters for IPO allocations. Second, we are the first to providedirect evidence of excess lead-underwriter commission revenues in the period im-mediately preceding the most profitable IPOs. Third, we expand on NRZ’s (2007)churning conjecture by examining the distinct trading strategies (e.g., abnormalround-trip trading or paying unusually high commissions on some trades) that in-stitutions might use to increase the commissions they pay to lead underwriters.Fourth, we find that inflated commission payments depend on lead-underwritercharacteristics, such as the concentration of its client base. Finally, we use ourunique data set to show that institutions are successful in using commissions tocapture IPO profits.
We begin our empirical investigation by dividing IPOs each year into quar-tiles based on the amount of money left on the table. Using an event study method-ology, we find significant increases in lead-underwriter commission revenue forthe 2 most profitable IPO quartiles. We find that these excess commissions areconcentrated in the 10-day period immediately preceding the IPO offer date.Postissue commission payments in return for IPO allocations appear to be con-centrated with one subsequently prosecuted brokerage firm rather than a generalphenomenon.6 Our results are consistent with strategic decisions by transient in-vestors to use commission dollars as a means of obtaining profitable IPOallocations. We confirm that these findings are robust to a variety of alternatespecifications and cannot be attributed to marketwide changes in trading volumeor the clustering of IPO issuance.
The economic significance of our finding is also important. When comparedto the nonevent benchmark level of commissions, the average lead underwriterexperiences an 8.49% increase in commission revenues during the 10-day periodimmediately preceding the most profitable IPOs. Overall, for the 2 most prof-itable IPO quartiles, this translates to $93.53 million in excess lead-underwritercommissions that are paid by our sample of institutions. Since our data representonly 7.97% of Center for Research in Security Prices (CRSP) daily share volume,our estimate clearly understates the magnitude of marketwide excess commis-sions received by lead underwriters.
We next investigate trading strategies that institutions might use to increasecommissions paid to lead underwriters. Institutions might simply reallocate“normal” trading volume to a lead underwriter with an upcoming IPO. Alter-natively, institutions might inflate the commission revenues that they pay to lead
6The SEC strictly prohibits ex post profit sharing, such as the ex post risk-sharing contract inBrennan and Chordia (1993). In 2002 the SEC charged Credit Suisse First Boston (CSFB) with re-ceiving kickbacks in the form of inflated commissions from clients who received profitable IPO allo-cations. The SEC claimed that several of CSFB’s institutional clients kicked back up to 65% of theIPO profits to the brokerage in the form of excessive commissions.
1196 Journal of Financial and Quantitative Analysis
underwriters by churning stocks, increasing the average commission per sharepaid, or paying unusually high commissions for some trades. These choices arenot mutually exclusive; in fact, we find that many of these strategies are used byinstitutions in our sample. We estimate that commissions from abnormal round-trip trades account for 11% of the total increase in commission revenue for themost profitable IPO quartile.
We also test whether transient investor commission payments are related tocharacteristics of the lead underwriter. Using a multivariate regression, we findthat transient investor excess commission payments are positively related to un-derwriter reputation, and decrease as the underwriter’s commission revenues be-come concentrated with particular stable clients. Our finding is consistent withthe conjecture that stable investors’ long-term relationships with lead underwrit-ers inhibit the underwriter’s willingness to accept transient investor payments.Thus, stable relationships keep excess commission activity small relative to thepotential IPO profits available.
Finally, our data allow us to examine whether institutions are successful inusing commissions to capture IPO profits. Specifically, we investigate whether ex-cess commissions sent to the lead underwriter result in larger allocations of prof-itable IPOs. Since IPO allocations are not available in our data, we proxy for theseallocations by examining net IPO selling by each institution in the 365 calendardays after the offer date. Notably, we find that transient institutions interact some-what differently with lead underwriters than do stable institutions. IPO alloca-tions to stable institutions are primarily determined by the long-term commissionrevenue streams that these institutions provide. Alternatively, excess commissionssent to the lead underwriter in the period immediately preceding the IPO are moreimportant for transient investor allocations. We estimate that $1 of abnormal com-mission revenue sent by transient institutions to the lead underwriter generates$2.21 in IPO profits from allocated shares. It is clear that transient institutions aresuccessful in using commissions to capture excess IPO profits.
In the next section, we discuss the interaction between underwriters and theirclients. Section III presents our data, and Section IV presents the main empiricalresults of our investigation. Section V examines trading strategies that institutionsmight employ to increase commission payments. Section VI examines the deter-minants of abnormal commissions, including client concentration, IPO profitabil-ity, and lead-underwriter reputation. Section VII examines the relation betweenabnormal commissions and IPO allocations more directly using data on post-IPOsales. Section VIII concludes.
II. Investors, Underwriters, and Commission PaymentsPrior to an IPO
Benveniste and Spindt (1989) and others develop models using informationasymmetry to explain the IPO bookbuilding process. While information revelationmight be a determinant in underwriters’ allocation decisions, it is also probablethat, as noted by Jenkinson and Jones (2009) and Loughran and Ritter (2002),(2004), quid pro quo commission arrangements are of principal importance in theallocation process.
Goldstein, Irvine, and Puckett 1197
Prior literature suggests that there are stable institutional clients who paya regular stream of commission dollars to the underwriter. As in Reuter (2006),Binay, Gatchev, and Pirinsky (2007), and Goldstein et al. (2009), these investorsenter into implicit long-term contracts where they agree to pay premium com-missions (relative to electronic communication network (ECN) execution) and,in return, expect to receive premium services, including allocations of desirableIPOs. Alternatively, there might also be transient investors who attempt to buytheir way into IPO allocations by directing abnormally high commissions to theunderwriter in the period immediately surrounding a desirable IPO, as suggestedby NRZ (2007).
Both stable and transient investor types use commission business to com-pete for the underwriter’s attention. Given a limited supply of shares to allocate,the underwriter faces a trade-off. The underwriter may allocate all shares to stableclients, or it may allocate some shares to transient investors and receive additionalcommission revenues. Any allocation to transient investors reduces the welfare ofstable investors, and if detected, stable investors might punish the underwriter bywithholding future commission business. Therefore, the underwriter will only al-locate shares to transient investors if the additional commissions it receives (whichare positively related to expected IPO profitability) are large enough to offset thepotential losses from being caught and punished by stable investors.
Our conjecture of how underwriters allocate IPO shares across stable andtransient clients provides a number of testable empirical hypotheses. Our 1sthypothesis follows:
Hypothesis 1. The lead underwriter receives increased commission revenues in theperiod immediately surrounding the IPO that are increasing in the IPO’s expectedprofitability.
When transient investors exist, we should observe elevated lead-underwritercommission revenues as investors compete for lucrative IPO allocations. As theexpected profitability of IPO allocations increases, we should observe an increasein this type of rent-seeking behavior.
We also suggest that the composition of the underwriter’s client base has im-plications for underwriter allocation decisions. Specifically, Hypothesis 2 states:
Hypothesis 2. The likelihood that an underwriter accepts increased commissionpayments in the period immediately surrounding an IPO is a decreasing functionof the concentration of the underwriter’s client base.
If stable clients discover the lead underwriter allocating lucrative IPO sharesto transient investors, they might punish the lead underwriter by withholding fu-ture commission business. Thus, underwriters with a more concentrated base ofstable investors will find it more costly if any one client decides to withholdfuture commission business.7 Empirically, we expect fewer excess commissionpayments to this type of underwriter.
7Since large clients comprise a significant fraction of bookbuilding demand, they might have betterinformation about total demand for the issue, and are therefore better able to detect allocations totransient institutions.
1198 Journal of Financial and Quantitative Analysis
The final hypotheses test our key assumptions about stable and transient in-vestor behavior in the IPO market.
Hypothesis 3. Increased commission payments in the period immediately sur-rounding the IPO affect allocations to transient investors more than those to stableinvestors.
Hypothesis 4. Stable investors receive the majority of an underwriter’s IPO allo-cations.
Hypotheses 2, 3, and 4 are unique to our paper; they are contained in neitherReuter (2006) nor NRZ (2007). In the next section, we describe the data used totest these hypotheses empirically.
III. Data and Methodology
A. Trading Data
We obtain institutional trading data from Ancerno Ltd. (formerly the Abel/Noser Corporation), a widely recognized consulting firm that works with insti-tutional investors to monitor their equity trading costs.8 Ancerno clients includepension plan sponsors such as the California Public Employees’ Retirement Sys-tem (CalPERS), the Commonwealth of Virginia, and the Young Men’s Chris-tian Association (YMCA) retirement fund, as well as money managers such asMassachusetts Financial Services (MFS), Putnam Investments, and Lazard As-set Management. The Ancerno sample contains trades from 840 institutions andcovers the 7-year period from January 1, 1999 until December 31, 2005.
Summary statistics for the more than 87 million institutional trade executionsin the Ancerno database are presented in Panel A of Table 1. For each execu-tion, Ancerno provides the institution identity code, identity of the broker/dealerhandling the execution, date, stock traded, number of shares executed, execu-tion price, whether the execution is a buy or sell, and commissions paid. Whilethe name of the institution is not provided, the unique identity codes allow usto distinguish between different institutions’ trades both in the cross section andthrough time.9 The average number of shares per execution varies from 6,669 in2005 to 11,159 in 2001, while commissions per execution range from $176 in2005 to $428 in 2002. Over the entire sample period, Ancerno clients trade morethan 755 billion shares worth $22.9 trillion and pay more than $24.6 billion incommissions. On average, institutions in the sample are responsible for
8Ancerno provides consulting services for equity trading costs in a manner similar to the PlexusGroup, whose data have been used extensively in academic studies. Other studies that have usedAncerno data include Chemmanur, He, and Hu (2009), Lipson and Puckett (2007), and Goldsteinet al. (2009). We thank Ancerno for providing the data, and we thank Eugene Noser and Judy Maiorcaof Ancerno for answering many detailed questions about the data.
9Ancerno receives trading data directly from the order delivery system (ODS) of all money man-ager clients, and therefore includes all trades executed by money managers. The method of data deliv-ery for pension plan sponsors also includes all executed trades.
Goldstein, Irvine, and Puckett 1199
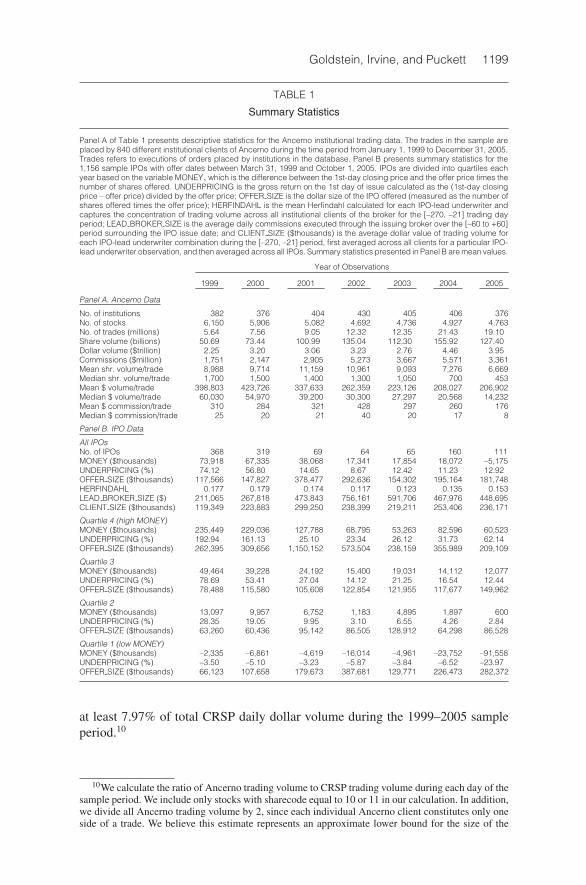
TABLE 1
Summary Statistics
Panel A of Table 1 presents descriptive statistics for the Ancerno institutional trading data. The trades in the sample areplaced by 840 different institutional clients of Ancerno during the time period from January 1, 1999 to December 31, 2005.Trades refers to executions of orders placed by institutions in the database. Panel B presents summary statistics for the1,156 sample IPOs with offer dates between March 31, 1999 and October 1, 2005. IPOs are divided into quartiles eachyear based on the variable MONEY, which is the difference between the 1st-day closing price and the offer price times thenumber of shares offered. UNDERPRICING is the gross return on the 1st day of issue calculated as the (1st-day closingprice – offer price) divided by the offer price; OFFER SIZE is the dollar size of the IPO offered (measured as the number ofshares offered times the offer price); HERFINDAHL is the mean Herfindahl calculated for each IPO-lead underwriter andcaptures the concentration of trading volume across all institutional clients of the broker for the [–270, –21] trading dayperiod; LEAD BROKER SIZE is the average daily commissions executed through the issuing broker over the [–60 to +60]period surrounding the IPO issue date; and CLIENT SIZE ($thousands) is the average dollar value of trading volume foreach IPO-lead underwriter combination during the [–270, –21] period, first averaged across all clients for a particular IPO-lead underwriter observation, and then averaged across all IPOs. Summary statistics presented in Panel B are mean values.
Year of Observations
1999 2000 2001 2002 2003 2004 2005
Panel A. Ancerno Data
No. of institutions 382 376 404 430 405 406 376No. of stocks 6,150 5,906 5,082 4,692 4,736 4,927 4,763No. of trades (millions) 5.64 7.56 9.05 12.32 12.35 21.43 19.10Share volume (billions) 50.69 73.44 100.99 135.04 112.30 155.92 127.40Dollar volume ($trillion) 2.25 3.20 3.06 3.23 2.76 4.46 3.95Commissions ($million) 1,751 2,147 2,905 5,273 3,667 5,571 3,361Mean shr. volume/trade 8,988 9,714 11,159 10,961 9,093 7,276 6,669Median shr. volume/trade 1,700 1,500 1,400 1,300 1,050 700 453Mean $ volume/trade 398,803 423,726 337,633 262,359 223,126 208,027 206,902Median $ volume/trade 60,030 54,970 39,200 30,300 27,297 20,568 14,232Mean $ commission/trade 310 284 321 428 297 260 176Median $ commission/trade 25 20 21 40 20 17 8
Panel B. IPO Data
All IPOsNo. of IPOs 368 319 69 64 65 160 111MONEY ($thousands) 73,918 67,335 38,068 17,341 17,854 18,072 –5,175UNDERPRICING (%) 74.12 56.80 14.65 8.67 12.42 11.23 12.92OFFER SIZE ($thousands) 117,566 147,827 378,477 292,636 154,302 195,164 181,748HERFINDAHL 0.177 0.179 0.174 0.117 0.123 0.135 0.153LEAD BROKER SIZE ($) 211,065 267,818 473,843 756,161 591,706 467,976 448,695CLIENT SIZE ($thousands) 119,349 223,883 299,250 238,399 219,211 253,406 236,171
Quartile 4 (high MONEY)MONEY ($thousands) 235,449 229,036 127,788 68,795 53,263 82,596 60,523UNDERPRICING (%) 192.94 161.13 25.10 23.34 26.12 31.73 62.14OFFER SIZE ($thousands) 262,395 309,656 1,150,152 573,504 238,159 355,989 209,109
Quartile 3MONEY ($thousands) 49,464 39,228 24,192 15,400 19,031 14,112 12,077UNDERPRICING (%) 78.69 53.41 27.04 14.12 21.25 16.54 12.44OFFER SIZE ($thousands) 78,488 115,580 105,608 122,854 121,955 117,677 149,962
Quartile 2MONEY ($thousands) 13,097 9,957 6,752 1,183 4,895 1,897 600UNDERPRICING (%) 28.35 19.05 9.95 3.10 6.55 4.26 2.84OFFER SIZE ($thousands) 63,260 60,436 95,142 86,505 128,912 64,298 86,528
Quartile 1 (low MONEY)MONEY ($thousands) –2,335 –6,861 –4,619 –16,014 –4,961 –23,752 –91,558UNDERPRICING (%) –3.50 –5.10 –3.23 –5.87 –3.84 –6.52 –23.97OFFER SIZE ($thousands) 66,123 107,658 179,673 387,681 129,771 226,473 282,372
at least 7.97% of total CRSP daily dollar volume during the 1999–2005 sampleperiod.10
10We calculate the ratio of Ancerno trading volume to CRSP trading volume during each day of thesample period. We include only stocks with sharecode equal to 10 or 11 in our calculation. In addition,we divide all Ancerno trading volume by 2, since each individual Ancerno client constitutes only oneside of a trade. We believe this estimate represents an approximate lower bound for the size of the
1200 Journal of Financial and Quantitative Analysis
In untabulated results, we aggregate trading by brokerage firm (or ECN)and investigate commission revenues. All 10 of the largest brokers (ranked byaverage commission revenues per day) also underwrite IPOs during our sampleperiod. Merrill Lynch is the largest broker, earning an average of $873,388 incommissions each trading day. The 10th largest broker is J.P. Morgan, which earnsan average of $362,881 per day in commission revenues.
B. IPO Data
We use the Securities Data Company’s (SDC) new issues database to identifyIPOs from March 31, 1999 to October 1, 2005, and the CRSP database to obtain1st-day closing prices for each IPO firm.11 We exclude all American DepositaryReceipts (ADRs), real estate investment trusts (REITs), unit investment trusts,closed-end funds, and IPOs with an offer price of less than $5. Our filters leaveus with a sample of 1,183 IPOs. Finally, we require that the lead underwriter is abroker in the Ancerno database, which eliminates 27 IPOs and leaves us with afinal sample of 1,156 IPOs involving 88 different lead underwriters.
Following Loughran and Ritter (2002), we calculate money left on the table(MONEY) for each IPO as the 1st-day closing price minus the offer price mul-tiplied by the number of shares offered. As such, MONEY represents the total1st-day IPO profits available to investors. From Hypothesis 1, we expect excesscommissions paid to the lead underwriter around the IPO offer date to be posi-tively related to MONEY. To examine this prediction, we rank IPOs in each yearby MONEY and separate the sample into quartiles.12
Summary statistics for each MONEY quartile in each year are presented inPanel B of Table 1. IPOs in the highest MONEY quartile (quartile = 4) presentinvestors with average potential 1st-day profits between $235 million (in 1999)and $53 million (in 2003). Money left on the table for the highest quartile is gen-erally 5 or 6 times the average 1st-day profits for quartile 3, which varies from$49 million in 1999 to $12 million in 2005. MONEY averages for quartile 2 aregenerally a few million dollars, while MONEY averages for the lowest quartile(quartile = 1) are uniformly negative. IPO profitability is, of course, highly cor-related with underpricing, which ranges from over 100% in the highest MONEYquartile during the Internet bubble period to a low of –24% in the lowest MONEYquartile in 2005. The extremely profitable IPOs in the 2 highest quartiles (quartiles3 and 4) appear large enough to entice some institutions to attempt to purchaseIPO allocations with excess commission payments. We next investigate whetherthe empirical evidence supports this hypothesis.
Ancerno database, as it functionally assumes that all trades in our sample had Ancerno clients on bothsides of each trade.
11Although our Ancerno trading data span from January 1, 1999 to December 31, 2005, we re-quire 60 days of institutional trading data before and after all IPO offer dates in order to calculateexpected levels of commission revenue for each broker. We also check Jay Ritter’s IPO Web site(http://bear.cba.ufl.edu/ritter/ipodata.htm) for possible SDC data errors and for the SDC data errorsmentioned in footnote 4 of Ljungqvist and Wilhelm (2003); see http://pages.stern.nyu.edu/∼aljungqv/.
12In unreported results, we pool IPOs across all years and then sort by MONEY quartile. Resultsusing this alternate sorting procedure are similar to those reported in the paper.
Goldstein, Irvine, and Puckett 1201
IV. Main Results
A. Event Study
We first use an event study to examine the existence and timing of excesslead-underwriter commission revenues. For each IPO, we collect all trades exe-cuted by the lead underwriter during the [–60, +60] trading day period surround-ing the IPO offer date and calculate total commission revenue earned each day.For each MONEY quartile, we compute the average commission revenue for eachday in this time series.13 As a basis for our statistical tests, we create a benchmarklevel of mean daily lead-underwriter commission revenue during the [–60, –21]and [+21, +60] nonevent period. We then compare the average daily event-periodcommission revenue to the benchmark level using the standard deviation of com-mission revenues in both the benchmark and event periods to construct our teststatistic.14
Since prior literature provides little guidance regarding the timing of ab-normal commission payments, the timing of abnormal commissions is itself anempirical question. Our initial investigation examines four 10-day event periodssurrounding the offer date: [–20, 11], [–10, –1], [1, 10], and [11, 20]. Our in-vestigation of excess commission payments in the preoffer period (event periods[–20, –11] and [–10, –1]) relies on the assumption that institutions have the abil-ity to forecast which IPOs will leave large amounts of money on the table. Wefind significant support for this assumption even though the IPO offer price is nottypically finalized until the day before the offer date. The “partial adjustment” lit-erature (see Hanley (1993)) and our discussions with institutional investors bothsubstantiate our assumption that information available in the preoffer period givesinstitutions the ability to forecast which IPOs will leave large amounts of moneyon the table.15 Because of the well-documented increase in trading activity thatoccurs on the offer date, the offer date itself is omitted in tests for abnormalcommissions.16
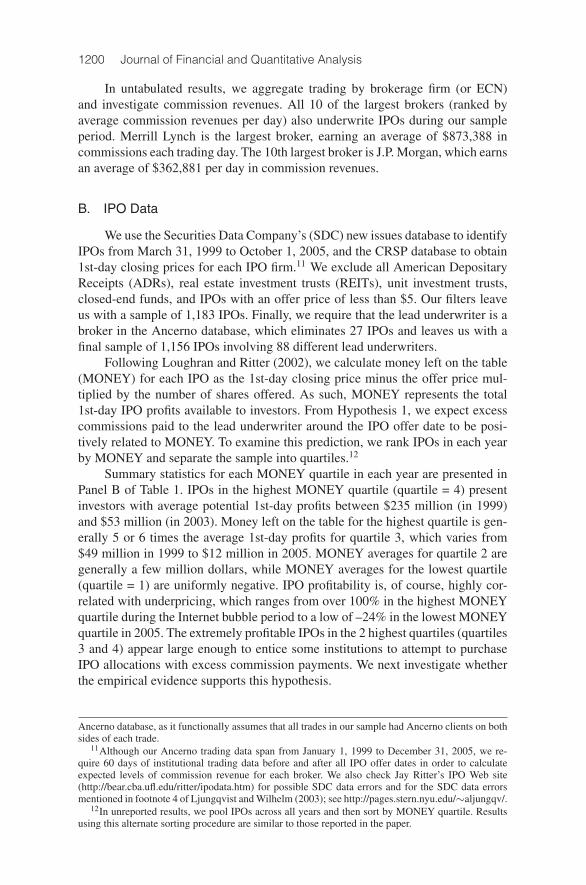
Table 2 presents our event study results for abnormal commissions. We re-iterate that our tests evaluate commissions paid to the lead underwriter only.Our findings suggest that some investors increase commissions sent to the leadunderwriter in the period immediately preceding the most profitable IPOs. Wealso find some evidence of decreases in lead-underwriter commission revenue
13In unreported tests, we separate the IPO sample into quartiles based on UNDERPRICING andrepeat the event study with similar results.
14The benchmarking methodology is identical to that used in Corwin, Harris, and Lipson (2004)and Irvine, Lipson, and Puckett (2007).
15NRZ (2007) analyze the prediction of 1st-day IPO returns by an industry newsletter (The IPOReporter) and conclude that institutions are able to predict which IPOs would leave large amounts ofmoney on the table.
16We examine separately whether commission revenue on the offer date (excluding IPO trading) issignificantly different than nonevent-period commission revenue. We find that abnormal commissionrevenues are positive and statistically significant for quartile 4 (high MONEY) and quartile 3, but areinsignificantly different from 0 for quartiles 1 and 2. As these results are similar to and supportive ofthose found in our main results, we do not include them in our tabulated results.
1202 Journal of Financial and Quantitative Analysis
TABLE 2
Lead-Underwriter Commission Revenue around IPO Issuance
Table 2 presents event study results for abnormal commissions received by lead underwriters around the IPO offer date.Our sample contains 1,156 IPOs with offer dates between March 31, 1999 and October 1, 2005. IPOs are divided intoquartiles each year based on the variable MONEY, which is the difference between the 1st-day closing price and theoffer price times the number of shares offered. We report the average daily commissions received by the lead underwriterduring the nonevent period, which is the period [–60, –21] and [+21, +60] surrounding the IPO offer date (event day 0). Wethen present the average abnormal daily commission revenue (event-period commissions per day minus nonevent-periodcommissions per day) for 4 event periods surrounding the IPO offer date: [–20, –11], [–10, –1], [+1, +10], and [+11, +20].We separate the sample of IPOs into the bubble period (1999 to 2001) and nonbubble period (2002–2005) and repeat ouranalysis of abnormal commissions for the event period [–10, –1]. t-statistics are presented in parentheses. ***, **, and *indicate significance at the 1%, 5%, and 10% levels, respectively. Bold indicates a statistically positive difference, anditalics indicate a statistically negative difference.
(low (highMONEY) MONEY)Quartile 1 Quartile 2 Quartile 3 Quartile 4
Panel A. All Periods (1999–2005)
No. of IPOs 290 290 289 287
Nonevent (commissions/day) 305,293 291,310 347,756 456,272
Abnormal (commissions/day)[–20, –11] 5,899 –13,268** 3,184 –427
(1.02) (–2.40) (0.56) (–0.07)
[–10, –1] 5,030 –7,228 10,167* 22,351***(0.82) (–1.30) (1.71) (4.14)
[+1, +10] –6,877 –18,235*** 266 –8,724(–0.96) (–3.01) (0.08) (–0.95)
[+11, +20] –8,261 –12,916* 9,233 5,937(–1.29) (–1.76) (1.63) (1.03)
Panel B. Bubble Period (1999–2001)
No. of IPOs 189 190 189 188
Nonevent (commissions/day) 207,136 231,250 261,831 332,360
Abnormal (commissions/day)[–10, –1] 1,325 –1,269 1,874 14,803***
(0.27) (–0.38) (0.35) (3.52)
Panel C. Nonbubble Period (2002–2005)
No. of IPOs 101 100 100 99
Nonevent (commissions/day) 481,576 403,213 501,891 697,818
Abnormal (commissions/day)[–10, –1] 11,682 –18,332* 25,044** 36,591**
(1.42) (–1.95) (2.12) (2.33)
around the least profitable IPOs.17 For the most profitable MONEY quartile,the average lead underwriter receives $456,272 in commissions per day duringthe nonevent benchmark period, and this amount increases by $22,351 per day(t-statistic = 4.14) during the [–10, –1] event period. This 5% increase per day cu-mulates to $223,510 over the [–10, –1] period, or about another half day’s worthof commissions. For quartile 3, the increase in lead-underwriter commissions dur-ing the [–10, –1] event period is $10,167 per day (t-statistic = 1.71). Our initial
17The most intriguing explanation of these results is that they represent institutions that punish leadunderwriters for underperforming IPOs. However, there are two arguments against this explanation.First, quartile 2 IPOs are still profitable on average (Panel B of Table 1), although ex ante uncertaintyconcerning future IPO profitability might have caused clients to focus on other opportunities. Second,and more notably, these results are not robust to the alternative difference-of-differences test designpresented in Table 4.
Goldstein, Irvine, and Puckett 1203
results support Hypothesis 1: Excess commission payments exist and are increas-ing in the expected profitability of the IPO.18
Our findings suggest that excess commission payments do not occur untiljust before the IPO—specifically, in the 2 weeks [–10, –1] prior to the IPO offerdate. Jenkinson and Jones (2009) suggest that both investors and the underwriterinteract at the roadshow and in private conversations prior to the IPO offer date,and that in doing so, investors can gauge the interest level of other investors.For example, experienced institutional clients who are privy to the broker’s pre-IPO roadshow can gather information about latent demand for the IPO simplyby observing the crowd at these presentations. At the same time, the process ofsending excess commissions must be commenced early enough to allow these ex-cess commissions to accumulate. Therefore, an institution wishing to send excesscommissions to an underwriter must trade off the amount of time it will take toamass notable excess commissions against the uncertainty that can be resolved,in part, by waiting. Our empirical findings indicate that institutions begin thisprocess about 2 weeks prior to the IPO.
NRZ (2007) present circumstantial evidence that these abnormal commis-sion payments are observable only during the bubble period. To investigate thispossibility, we divide our sample into bubble (1999–2001) and nonbubble (2002–2005) periods and repeat our analysis for both subperiods. For expositional con-venience, we report only abnormal commissions during the [–10, –1] event pe-riod for these subperiods in Table 2.19 Abnormal lead-underwriter commissionsare $14,803 per day (t-statistic = 3.52) for quartile 4 IPOs during the bubbleperiod and $36,591 (t-statistic = 2.33) in the nonbubble period. Controlling forthe increase in overall commissions paid over our sample period, we find thatin both bubble and nonbubble periods the abnormal lead-underwriter commis-sions are about 5% more than the benchmark level.20 For quartile 3 IPOs, thereare some differences between the time periods. Event-period commissions forquartile 3 are not significantly different than benchmark levels during the bub-ble period, but during the nonbubble period abnormal commissions are $25,044(t-statistic = 2.12) per day. Our results suggest that abnormal commission pay-ments exist in both the bubble and nonbubble periods, and that in each case insti-tutions pay approximately 5% more immediately prior to the offer date.
18We find no evidence of abnormal ex post commission payments for quartiles 3 and 4. In separatetests, we analyze CSFB alone, since CSFB is an active underwriter specifically cited in SEC docu-ments alleging ex post settling-up behavior. In the CSFB-only sample, we find evidence of significantabnormal commission payments in the [+1, +5] period after the IPO offer date for both quartiles 3and 4 during the bubble period. By extrapolating our volume data to CRSP total volume levels, weestimate that over $46.7 million in excess commissions were received by CSFB in this period. Ourestimates are consistent with the magnitude of SEC litigation release 17327 claiming $70 million inimproper gains that CSFB was ordered to disgorge.
19In robustness tests, we define the bubble period subsample as 1999 to 2000 and find results similarto those reported in Table 2.
20There are two primary reasons why average daily nonevent-period commissions increased sig-nificantly between the bubble and nonbubble periods. First, the aggregate level of trading activityis increasing over our sample period for both the overall market and for our sample of Ancerno in-stitutions. Second, and perhaps more importantly, trades on NASDAQ-listed stocks were generallynot charged explicit commissions prior to 2002, but as a result of decimalization, commissions werecharged on more than 90% of the trades for NASDAQ-listed stocks from 2002 onward.
1204 Journal of Financial and Quantitative Analysis
The economic value of these inflated commissions is significant. As notedpreviously, our estimates suggest that 10-day lead-underwriter excess commis-sion revenue per IPO is $223,510 for IPOs in quartile 4 and $101,670 for IPOs inquartile 3. Overall, for the 2 most profitable IPO quartiles, this translates to $93.58million in excess lead-underwriter commissions that are paid by our sample of in-stitutions. However, our data represent only 7.97% of CRSP daily share volumeand therefore clearly understate the magnitude of marketwide excess commis-sions received by lead underwriters. Assuming that institutions account for 70%of CRSP trading volume and that institutions outside of our sample act in a man-ner similar to the institutions in our sample, we estimate total marketwide ab-normal commissions of $1,963,065 ($892,957) per IPO for lead underwriters ofquartile 4 (quartile 3) IPOs.21 With 576 IPOs in quartiles 3 and 4, our estimateof aggregate marketwide abnormal commissions received by lead underwriters is$821 million.
The economic magnitude of this revenue is still small relative to the $58billion left on the table by these IPOs. It is puzzling why even higher abnormalcommissions are not observed given the large profits available. Chen and Ritter(2000) note that profit-maximizing underwriters would be better served by raisingthe offer price of the IPO and capturing 7% of any additional proceeds in the formof underwriting fees. However, this argument ignores externalities surroundingunderpricing and allocation decisions including extracting valuable informationfrom informed investors (Benveniste and Spindt (1989)), managing litigation risks(Tinic (1988), Lowry and Shu (2002)), and the long-term nature of broker-clientcontracts (Goldstein et al. (2009)).
It is notable that we do not observe positive abnormal commissions for quar-tile 2 IPOs, which are profitable ex post. The results suggest that expected prof-its must be large to engender transient investors to offer commission paymentsto obtain allocations, especially considering the uncertainty of IPO profitability.Only when IPO profits are expected to be extremely large can transient investorsjustify a large enough extra payment to induce lead underwriters to allocate sharesaway from their stable clients.
B. Robustness Tests
Event study results in Table 2 indicate that for the most profitable IPOs, leadunderwriters receive increased commission revenues during the 10-day periodimmediately preceding the offer date. However, prior research reports that IPOactivity is both clustered in calendar time and is related to aggregate marketactivity (Lowry (2003)). We investigate the potential effects of these facts in 2robustness tests.
1. Calendar-Time Regressions
If IPO events are clustered in calendar time, our event study might sufferfrom correlated errors and a tendency to overreject the null. Although many prior
21Our assumption that institutions account for 70% of CRSP trading volume is consistent withestimates by Schwartz and Shapiro (1992) and Jones and Lipson (2004).
Goldstein, Irvine, and Puckett 1205
studies document IPO clustering in hot markets (e.g., Ritter and Welch (2002)),we reiterate that our analysis investigates lead-underwriter commission revenuesonly, thus mitigating the clustering problem.
When pooling all IPOs in our sample across all lead underwriters, we findthat IPOs are extremely clustered. Of the 1,156 IPOs in our sample, 1,147 of themoccur within 10 days of another IPO, and only 9 do not. However, when we viewour sample IPOs separately for each lead underwriter, we find 467 IPOs for whichthe lead underwriter did not serve as the lead underwriter on any other IPO duringthe [–10, +10] period. Since we are examining IPOs based on lead-underwritercommissions only, which condition on the lead underwriter, the clustering in ouranalysis is substantially reduced.
Although our unit of analysis clearly reduces the clustering problem, it is noteliminated completely. To address this issue, we employ a calendar-time regres-sion approach. We proceed as follows: We aggregate commissions and money lefton the table separately for each underwriter on each day of the sample period. Wethen specify the underwriters’ daily commission revenue as a function of futuremoney left on the table (MONEY):
COMMISSIONSt, j = α + β1
(5,10∑n=1
MONEYt+n, j
)(1)
+4∑
n=1
γkCOMMISSIONSt−n, j + β2 |MKTRETt|
+84∑
m=2
δmMONTHm + εt.
The dependent variable in equation (1) is the commission revenue received onday t by lead underwriter j. The independent variable of interest, MONEY, is theaggregate amount of money left on the table by underwriter j, summed over dayst + 1 through t + 5 (or t + 1 through t + 10). We include 4 lags of theCOMMISSIONS variable to control for daily autocorrelation in the level of under-writer commissions (see NRZ (2007)) and the absolute value of the CRSP equal-weighted return (|MKTRETt|), since institutional volume is higher during largemarket movements (Dennis and Strickland (2002)). Finally, we include monthfixed effects (MONTH) to control for any time-series changes in the frequency oftrading in our data. We adjust all t-statistics using Newey-West (1987) standarderrors.
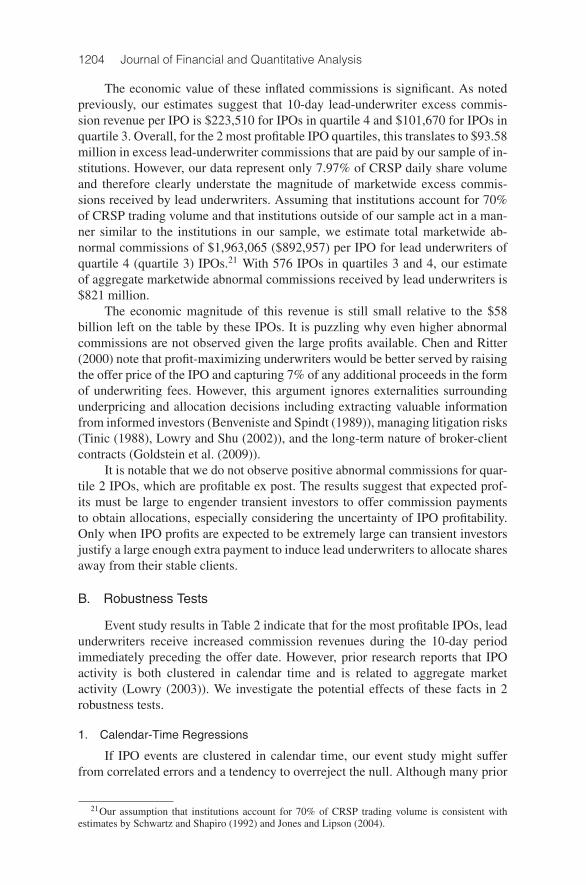
Table 3 presents the results of these regressions for the full sample as well asthe bubble and nonbubble subperiods. The key variables of interest are MONEY[1, 5] and MONEY[1, 10], which represent underwriter j’s IPO profitability overthe next 5 and 10 trading days, respectively. Results are consistent with our event-study findings: Commissions received today by lead underwriter j are positivelyrelated to future money left on the table by underwriter j. For the full sample, thecoefficient on MONEY[1, 5] is 0.004 (t-statistic = 2.59), and for MONEY[1, 10],the coefficient estimate is 0.003 (t-statistic = 2.45). Subsample regression resultsfor both bubble and nonbubble periods are all consistent with results reported in
1206 Journal of Financial and Quantitative Analysis
the full sample with one exception: the MONEY[1, 5] coefficient for the nonbub-ble subsample becomes insignificant (t-statistic = 1.43).
TABLE 3
Calendar-Time Regressions
Table 3 presents calendar-time regressions where brokerage commissions received by the lead underwriter(COMMISSIONSt) is the dependent variable. Lead underwriter brokerage commissions are regressed against the follow-ing independent variables: MONEY is the 1st-day closing price minus the offer price times the number of shares offered,and for each lead underwriter we aggregate MONEY over the [+1, +5] period or the [+1, +10] period; COMMISSIONS−1,COMMISSIONS−2, COMMISSIONS−3, and COMMISSIONS−4 are the 4 prior days of lead underwriter daily commis-sions; and |MKTRET0| is the absolute value of the equal-weighted CRSP market return on that day. All regressions includemonth fixed effects. Numbers in parentheses are Newey-West (1987) t-statistics. ***, **, and * indicate significance at the1%, 5%, and 10% levels, respectively.
Dependent Variable: COMMISSIONSt
All Periods Bubble Period Nonbubble PeriodIndependent Variable (1999–2005) (1999–2001) (2002–2005)
INTERCEPT 149.902 79.556 2,231.242* 2,216.043* 26,249.30*** 26,218.14***(0.15) (0.08) (1.95) (1.93) (4.42) (4.42)
MONEY[1, 5] 0.004*** 0.004*** 0.015(2.59) (2.71) (1.43)
MONEY[1, 10] 0.003** 0.003** 0.016**(2.45) (2.25) (2.37)
COMMISSIONS−1 0.411*** 0.412*** 0.378*** 0.378*** 0.417*** 0.417***(11.07) (11.06) (9.11) (9.12) (9.05) (9.03)
COMMISSIONS−2 0.185*** 0.184*** 0.199*** 0.199*** 0.182*** 0.180***(7.27) (7.23) (7.20) (7.20) (5.75) (5.71)
COMMISSIONS−3 0.165*** 0.165*** 0.137*** 0.137*** 0.173*** 0.173***(7.46) (7.44) (5.85) (5.85) (6.28) (6.26)
COMMISSIONS−4 0.181*** 0.181*** 0.213*** 0.212*** 0.172*** 0.172***(8.79) (8.76) (10.00) (10.00) (6.86) (6.83)
|MKTRET0| 929,611*** 935,022*** 749,451*** 751,742*** 1,177,383*** 1,185,910***(10.40) (10.44) (7.38) (7.39) (7.35) (7.38)
Month fixed effects Yes Yes Yes Yes Yes YesR2 % 79.59 79.56 74.38 74.37 79.87 79.85
Our results suggest that for every $1 left on the table, the lead underwriterreceives between 0.3¢ and 0.4¢ in abnormal commissions. In order to providesome inference with respect to the marketwide level of abnormal commissions,we again gross up our estimate based on the assumption that institutions are re-sponsible for 70% of CRSP volume. Given that our data represent 7.97% of CRSPvolume, we estimate marketwide abnormal commissions of between 2.66¢ and3.54¢ for every $1 left on the table.
2. Difference-of-Differences Test
Lowry and Schwert (2002) suggest that IPO activity is related to laggedmarket activity. If IPO issuance clusters during periods of high market volumes,then aggregate commission payments to all brokerage firms, and not just the leadunderwriter, would increase just prior to hot IPO offer dates. We address thisconcern using a difference-of-differences test to directly compare event-periodcommission revenues received by lead underwriters to the commissions receivedby other brokerage firms in the database.
Goldstein, Irvine, and Puckett 1207
For each IPO, we construct a comparative sample of nonlead underwritingbrokers by requiring that a broker cannot act as a lead underwriter for any IPOduring the [–10, +10] day period surrounding a sample IPO’s offer date. By com-paring the time series of commission revenues for lead underwriters to that ofnonlead brokers, we control for external market conditions affecting all brokers.
For each IPO, we calculate the average daily event-period commission rev-enue [–10, –1] minus the average daily nonevent commission revenue from [–60,–21] and [21, 60], and we divide this difference by the average daily nonevent-period commission revenue. As such, our measure is the percentage change incommission revenue a brokerage firm experiences in the 10-day period immedi-ately preceding the IPO offer date. This normalization controls for cross-sectionaldifferences across brokers in each group and is similar to the methodology em-ployed by Goldstein, Hotchkiss, and Sirri (2007). We construct this measure for 3groups: the lead underwriter, a matched-pair control sample where the lead under-writer is matched with 1 nonlead brokerage firm that is closest in average dailynonevent commission revenue, and a control portfolio of all nonlead brokeragefirms. For brevity we limit our tests to the [–10, –1] event period, since this iswhere we find a significant increase in lead-underwriter commission revenue.
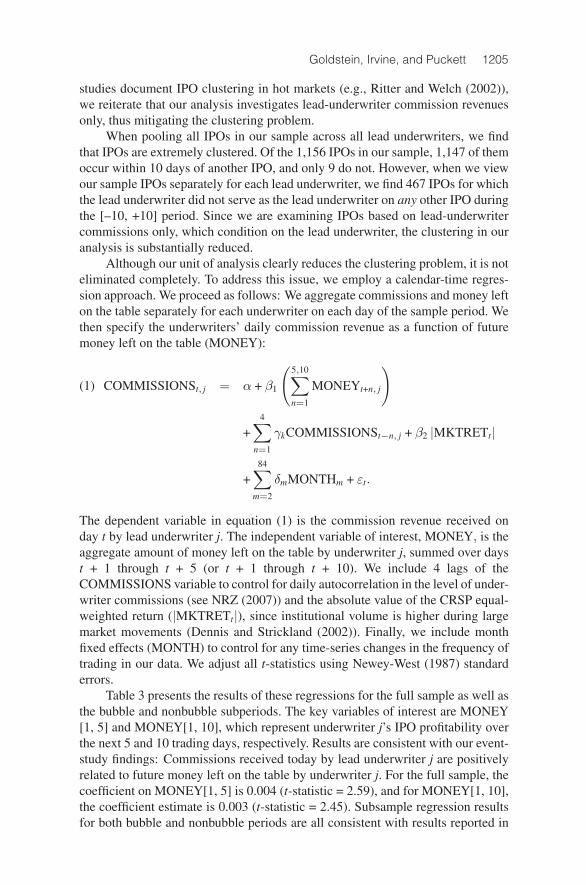
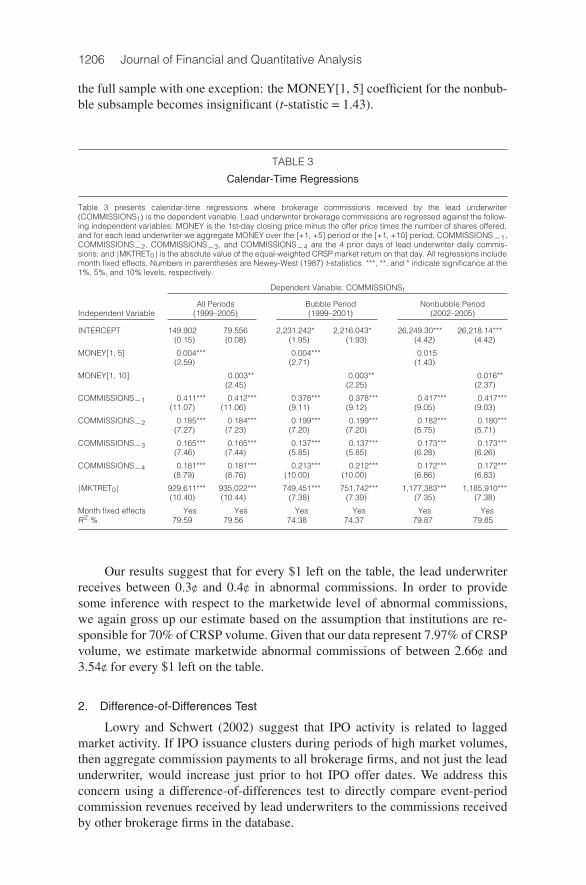
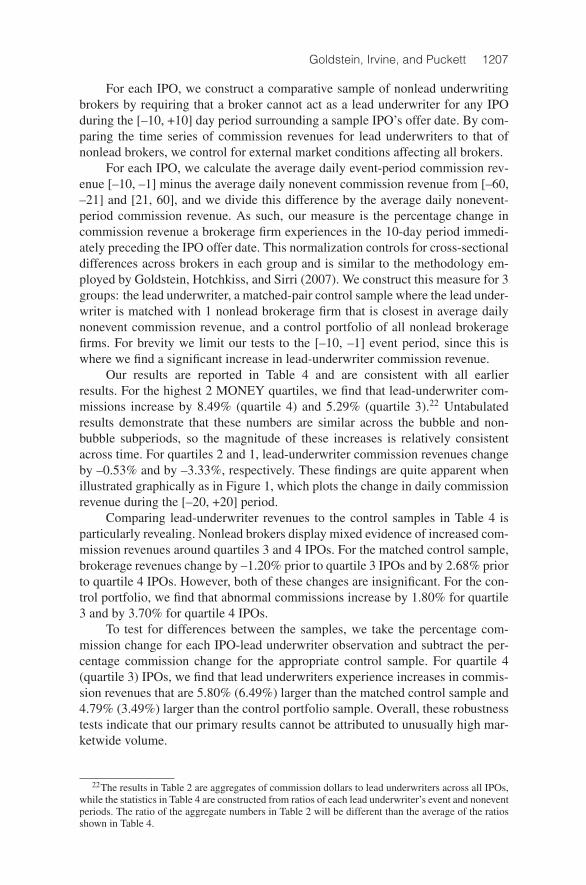
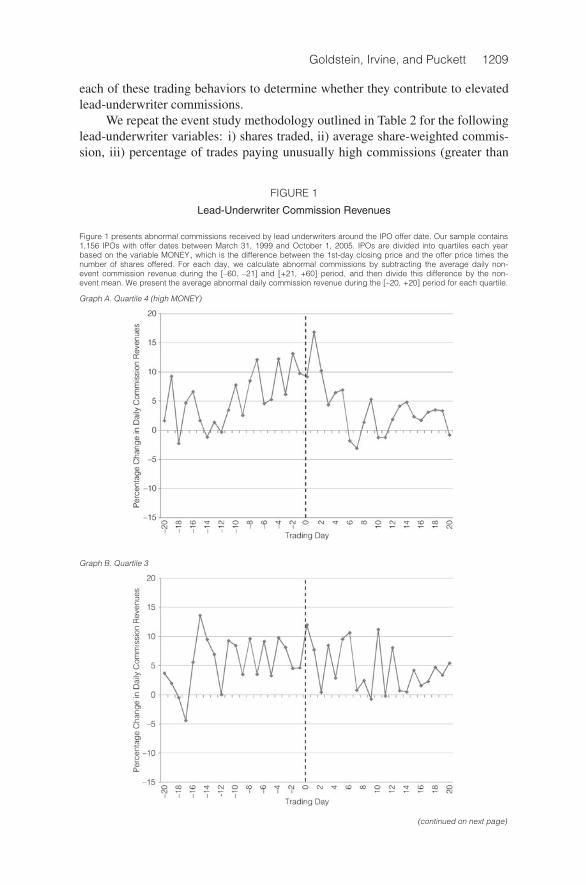
Our results are reported in Table 4 and are consistent with all earlierresults. For the highest 2 MONEY quartiles, we find that lead-underwriter com-missions increase by 8.49% (quartile 4) and 5.29% (quartile 3).22 Untabulatedresults demonstrate that these numbers are similar across the bubble and non-bubble subperiods, so the magnitude of these increases is relatively consistentacross time. For quartiles 2 and 1, lead-underwriter commission revenues changeby –0.53% and by –3.33%, respectively. These findings are quite apparent whenillustrated graphically as in Figure 1, which plots the change in daily commissionrevenue during the [–20, +20] period.
Comparing lead-underwriter revenues to the control samples in Table 4 isparticularly revealing. Nonlead brokers display mixed evidence of increased com-mission revenues around quartiles 3 and 4 IPOs. For the matched control sample,brokerage revenues change by –1.20% prior to quartile 3 IPOs and by 2.68% priorto quartile 4 IPOs. However, both of these changes are insignificant. For the con-trol portfolio, we find that abnormal commissions increase by 1.80% for quartile3 and by 3.70% for quartile 4 IPOs.
To test for differences between the samples, we take the percentage com-mission change for each IPO-lead underwriter observation and subtract the per-centage commission change for the appropriate control sample. For quartile 4(quartile 3) IPOs, we find that lead underwriters experience increases in commis-sion revenues that are 5.80% (6.49%) larger than the matched control sample and4.79% (3.49%) larger than the control portfolio sample. Overall, these robustnesstests indicate that our primary results cannot be attributed to unusually high mar-ketwide volume.
22The results in Table 2 are aggregates of commission dollars to lead underwriters across all IPOs,while the statistics in Table 4 are constructed from ratios of each lead underwriter’s event and noneventperiods. The ratio of the aggregate numbers in Table 2 will be different than the average of the ratiosshown in Table 4.
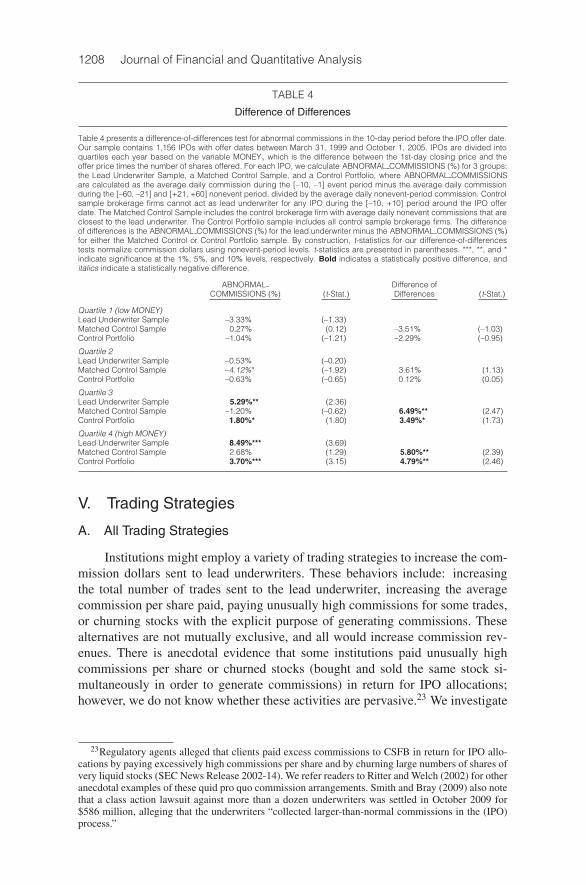
1208 Journal of Financial and Quantitative Analysis
TABLE 4
Difference of Differences
Table 4 presents a difference-of-differences test for abnormal commissions in the 10-day period before the IPO offer date.Our sample contains 1,156 IPOs with offer dates between March 31, 1999 and October 1, 2005. IPOs are divided intoquartiles each year based on the variable MONEY, which is the difference between the 1st-day closing price and theoffer price times the number of shares offered. For each IPO, we calculate ABNORMAL COMMISSIONS (%) for 3 groups:the Lead Underwriter Sample, a Matched Control Sample, and a Control Portfolio, where ABNORMAL COMMISSIONSare calculated as the average daily commission during the [–10, –1] event period minus the average daily commissionduring the [–60, –21] and [+21, +60] nonevent period, divided by the average daily nonevent-period commission. Controlsample brokerage firms cannot act as lead underwriter for any IPO during the [–10, +10] period around the IPO offerdate. The Matched Control Sample includes the control brokerage firm with average daily nonevent commissions that areclosest to the lead underwriter. The Control Portfolio sample includes all control sample brokerage firms. The differenceof differences is the ABNORMAL COMMISSIONS (%) for the lead underwriter minus the ABNORMAL COMMISSIONS (%)for either the Matched Control or Control Portfolio sample. By construction, t-statistics for our difference-of-differencestests normalize commission dollars using nonevent-period levels. t-statistics are presented in parentheses. ***, **, and *indicate significance at the 1%, 5%, and 10% levels, respectively. Bold indicates a statistically positive difference, anditalics indicate a statistically negative difference.
ABNORMAL Difference ofCOMMISSIONS (%) (t-Stat.) Differences (t-Stat.)
Quartile 1 (low MONEY)Lead Underwriter Sample –3.33% (–1.33)Matched Control Sample 0.27% (0.12) –3.51% (–1.03)Control Portfolio –1.04% (–1.21) –2.29% (–0.95)
Quartile 2Lead Underwriter Sample –0.53% (–0.20)Matched Control Sample –4.12%* (–1.92) 3.61% (1.13)Control Portfolio –0.63% (–0.65) 0.12% (0.05)
Quartile 3Lead Underwriter Sample 5.29%** (2.36)Matched Control Sample –1.20% (–0.62) 6.49%** (2.47)Control Portfolio 1.80%* (1.80) 3.49%* (1.73)
Quartile 4 (high MONEY)Lead Underwriter Sample 8.49%*** (3.69)Matched Control Sample 2.68% (1.29) 5.80%** (2.39)Control Portfolio 3.70%*** (3.15) 4.79%** (2.46)
V. Trading Strategies
A. All Trading Strategies
Institutions might employ a variety of trading strategies to increase the com-mission dollars sent to lead underwriters. These behaviors include: increasingthe total number of trades sent to the lead underwriter, increasing the averagecommission per share paid, paying unusually high commissions for some trades,or churning stocks with the explicit purpose of generating commissions. Thesealternatives are not mutually exclusive, and all would increase commission rev-enues. There is anecdotal evidence that some institutions paid unusually highcommissions per share or churned stocks (bought and sold the same stock si-multaneously in order to generate commissions) in return for IPO allocations;however, we do not know whether these activities are pervasive.23 We investigate
23Regulatory agents alleged that clients paid excess commissions to CSFB in return for IPO allo-cations by paying excessively high commissions per share and by churning large numbers of shares ofvery liquid stocks (SEC News Release 2002-14). We refer readers to Ritter and Welch (2002) for otheranecdotal examples of these quid pro quo commission arrangements. Smith and Bray (2009) also notethat a class action lawsuit against more than a dozen underwriters was settled in October 2009 for$586 million, alleging that the underwriters “collected larger-than-normal commissions in the (IPO)process.”
Goldstein, Irvine, and Puckett 1209
each of these trading behaviors to determine whether they contribute to elevatedlead-underwriter commissions.
We repeat the event study methodology outlined in Table 2 for the followinglead-underwriter variables: i) shares traded, ii) average share-weighted commis-sion, iii) percentage of trades paying unusually high commissions (greater than
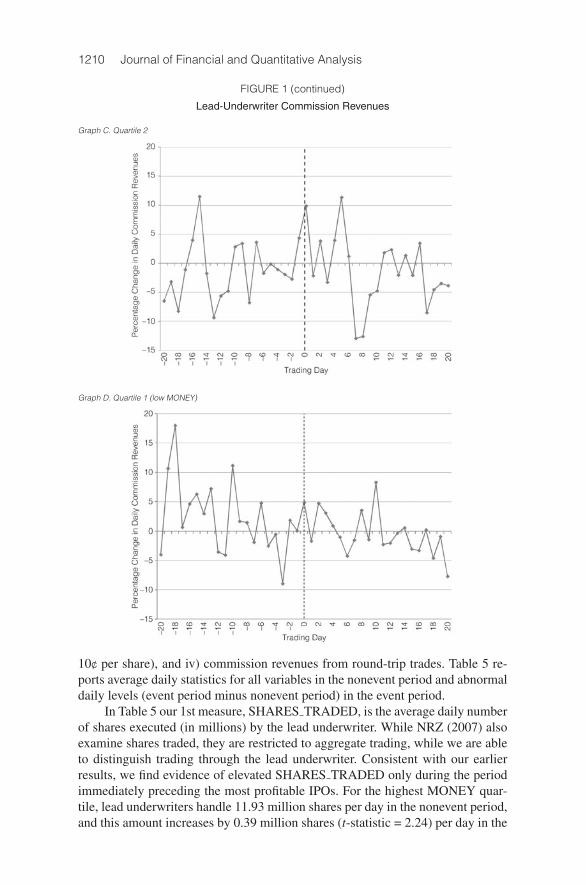
FIGURE 1
Lead-Underwriter Commission Revenues
Figure 1 presents abnormal commissions received by lead underwriters around the IPO offer date. Our sample contains1,156 IPOs with offer dates between March 31, 1999 and October 1, 2005. IPOs are divided into quartiles each yearbased on the variable MONEY, which is the difference between the 1st-day closing price and the offer price times thenumber of shares offered. For each day, we calculate abnormal commissions by subtracting the average daily non-event commission revenue during the [–60, –21] and [+21, +60] period, and then divide this difference by the non-event mean. We present the average abnormal daily commission revenue during the [–20, +20] period for each quartile.
Graph A. Quartile 4 (high MONEY)
Graph B. Quartile 3
(continued on next page)
1210 Journal of Financial and Quantitative Analysis
FIGURE 1 (continued)
Lead-Underwriter Commission Revenues
Graph C. Quartile 2
Graph D. Quartile 1 (low MONEY)
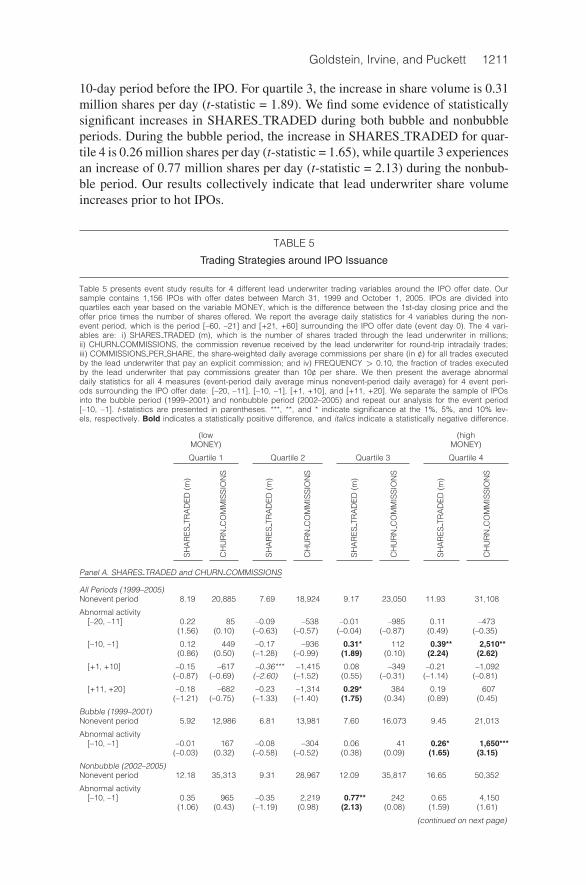
10¢ per share), and iv) commission revenues from round-trip trades. Table 5 re-ports average daily statistics for all variables in the nonevent period and abnormaldaily levels (event period minus nonevent period) in the event period.
In Table 5 our 1st measure, SHARES TRADED, is the average daily numberof shares executed (in millions) by the lead underwriter. While NRZ (2007) alsoexamine shares traded, they are restricted to aggregate trading, while we are ableto distinguish trading through the lead underwriter. Consistent with our earlierresults, we find evidence of elevated SHARES TRADED only during the periodimmediately preceding the most profitable IPOs. For the highest MONEY quar-tile, lead underwriters handle 11.93 million shares per day in the nonevent period,and this amount increases by 0.39 million shares (t-statistic = 2.24) per day in the
Goldstein, Irvine, and Puckett 1211
10-day period before the IPO. For quartile 3, the increase in share volume is 0.31million shares per day (t-statistic = 1.89). We find some evidence of statisticallysignificant increases in SHARES TRADED during both bubble and nonbubbleperiods. During the bubble period, the increase in SHARES TRADED for quar-tile 4 is 0.26 million shares per day (t-statistic = 1.65), while quartile 3 experiencesan increase of 0.77 million shares per day (t-statistic = 2.13) during the nonbub-ble period. Our results collectively indicate that lead underwriter share volumeincreases prior to hot IPOs.
TABLE 5
Trading Strategies around IPO Issuance
Table 5 presents event study results for 4 different lead underwriter trading variables around the IPO offer date. Oursample contains 1,156 IPOs with offer dates between March 31, 1999 and October 1, 2005. IPOs are divided intoquartiles each year based on the variable MONEY, which is the difference between the 1st-day closing price and theoffer price times the number of shares offered. We report the average daily statistics for 4 variables during the non-event period, which is the period [–60, –21] and [+21, +60] surrounding the IPO offer date (event day 0). The 4 vari-ables are: i) SHARES TRADED (m), which is the number of shares traded through the lead underwriter in millions;ii) CHURN COMMISSIONS, the commission revenue received by the lead underwriter for round-trip intradaily trades;iii) COMMISSIONS PER SHARE, the share-weighted daily average commissions per share (in ¢) for all trades executedby the lead underwriter that pay an explicit commission; and iv) FREQUENCY > 0.10, the fraction of trades executedby the lead underwriter that pay commissions greater than 10¢ per share. We then present the average abnormaldaily statistics for all 4 measures (event-period daily average minus nonevent-period daily average) for 4 event peri-ods surrounding the IPO offer date: [–20, –11], [–10, –1], [+1, +10], and [+11, +20]. We separate the sample of IPOsinto the bubble period (1999–2001) and nonbubble period (2002–2005) and repeat our analysis for the event period[–10, –1]. t-statistics are presented in parentheses. ***, **, and * indicate significance at the 1%, 5%, and 10% lev-els, respectively. Bold indicates a statistically positive difference, and italics indicate a statistically negative difference.
(low (highMONEY) MONEY)
Quartile 1 Quartile 2 Quartile 3 Quartile 4
SH
AR
ES
TRA
DE
D(m
)
CH
UR
NC
OM
MIS
SIO
NS
SH
AR
ES
TRA
DE
D(m
)
CH
UR
NC
OM
MIS
SIO
NS
SH
AR
ES
TRA
DE
D(m
)
CH
UR
NC
OM
MIS
SIO
NS
SH
AR
ES
TRA
DE
D(m
)
CH
UR
NC
OM
MIS
SIO
NS
Panel A. SHARES TRADED and CHURN COMMISSIONS
All Periods (1999–2005)Nonevent period 8.19 20,885 7.69 18,924 9.17 23,050 11.93 31,108
Abnormal activity[–20, –11] 0.22 85 –0.09 –538 –0.01 –985 0.11 –473
(1.56) (0.10) (–0.63) (–0.57) (–0.04) (–0.87) (0.49) (–0.35)
[–10, –1] 0.12 449 –0.17 –936 0.31* 112 0.39** 2,510**(0.86) (0.50) (–1.28) (–0.99) (1.89) (0.10) (2.24) (2.62)
[+1, +10] –0.15 –617 –0.36*** –1,415 0.08 –349 –0.21 –1,092(–0.87) (–0.69) (–2.60) (–1.52) (0.55) (–0.31) (–1.14) (–0.81)
[+11, +20] –0.18 –682 –0.23 –1,314 0.29* 384 0.19 607(–1.21) (–0.75) (–1.33) (–1.40) (1.75) (0.34) (0.89) (0.45)
Bubble (1999–2001)Nonevent period 5.92 12,986 6.81 13,981 7.60 16,073 9.45 21,013
Abnormal activity[–10, –1] –0.01 167 –0.08 –304 0.06 41 0.26* 1,650***
(–0.03) (0.32) (–0.58) (–0.52) (0.38) (0.09) (1.65) (3.15)
Nonbubble (2002–2005)Nonevent period 12.18 35,313 9.31 28,967 12.09 35,817 16.65 50,352
Abnormal activity[–10, –1] 0.35 965 –0.35 2,219 0.77** 242 0.65 4,150
(1.06) (0.43) (–1.19) (0.98) (2.13) (0.08) (1.59) (1.61)
(continued on next page)
1212 Journal of Financial and Quantitative Analysis
TABLE 5 (continued)
Trading Strategies around IPO Issuance
(low (highMONEY) MONEY)
Quartile 1 Quartile 2 Quartile 3 Quartile 4
CO
MM
ISS
ION
SP
ER
SH
AR
E
FRE
QU
EN
CY>
0.10
(%)
CO
MM
ISS
ION
SP
ER
SH
AR
E
FRE
QU
EN
CY>
0.10
(%)
CO
MM
ISS
ION
SP
ER
SH
AR
E
FRE
QU
EN
CY>
0.10
(%)
CO
MM
ISS
ION
SP
ER
SH
AR
E
FRE
QU
EN
CY>
0.10
(%)
Panel B. COMMISSIONS PER SHARE and FREQUENCY > 0.10 (%)
All Periods (1999–2005)Nonevent period 4.87 0.27 4.88 0.22 4.83 0.32 4.84 0.47
Abnormal activity[–20, –11] 0.02 0.06 –0.01 –0.02 –0.01 –0.10* 0.00 0.01
(1.02) (0.68) (0.71) (–0.49) (–0.64) (–1.84) (0.04) (0.13)
[–10, –1] 0.02 0.09 0.04** 0.04 0.03* 0.07 0.06*** 0.20***(1.04) (1.23) (2.12) (0.45) (1.89) (1.10) (3.11) (2.97)
[+1, +10] 0.01 0.09 0.02 –0.07 0.03 –0.01 0.03 0.17***(0.92) (1.34) (1.11) (–1.61) (1.41) (–0.16) (1.47) (2.55)
[+11, +20] –0.01 –0.02 0.00 0.03 0.02 0.01 –0.01 –0.05(–0.09) (–0.29) (0.20) (0.05) (1.21) (0.09) (–0.79) (–0.69)
Bubble (1999–2001)Nonevent period 5.15 0.30 5.09 0.28 5.08 0.42 5.10 0.61
Abnormal activity[–10, –1] 0.03 0.11 0.05** 0.05 0.03 0.07 0.06*** 0.30***
(1.25) (0.91) (2.23) (0.77) (1.64) (0.81) (2.80) (3.29)
Nonbubble (2002–2005)Nonevent period 4.40 0.22 4.46 0.13 4.37 0.16 4.36 0.18
Abnormal activity[–10, –1] –0.03 0.08 0.01 –0.01 0.02 0.07 0.04** 0.01
(–1.51) (0.83) (0.43) (–0.20) (1.14) (1.12) (1.99) (0.24)
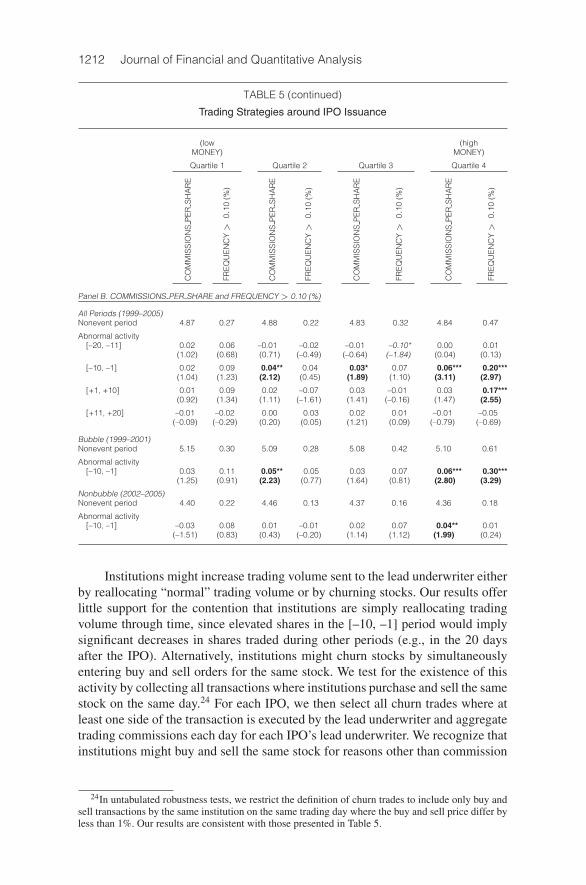
Institutions might increase trading volume sent to the lead underwriter eitherby reallocating “normal” trading volume or by churning stocks. Our results offerlittle support for the contention that institutions are simply reallocating tradingvolume through time, since elevated shares in the [–10, –1] period would implysignificant decreases in shares traded during other periods (e.g., in the 20 daysafter the IPO). Alternatively, institutions might churn stocks by simultaneouslyentering buy and sell orders for the same stock. We test for the existence of thisactivity by collecting all transactions where institutions purchase and sell the samestock on the same day.24 For each IPO, we then select all churn trades where atleast one side of the transaction is executed by the lead underwriter and aggregatetrading commissions each day for each IPO’s lead underwriter. We recognize thatinstitutions might buy and sell the same stock for reasons other than commission
24In untabulated robustness tests, we restrict the definition of churn trades to include only buy andsell transactions by the same institution on the same trading day where the buy and sell price differ byless than 1%. Our results are consistent with those presented in Table 5.
Goldstein, Irvine, and Puckett 1213
generation. For this reason, we control for the base level of round-trip trading bysubtracting nonevent-period levels, as we are only concerned with changes in thistype of activity routed through the lead underwriter.
Panel A of Table 5 shows that commissions from round-trip trades(CHURN COMMISSIONS) increase by $2,510 per day (t-statistic = 2.62) inthe [–10, –1] period for the highest MONEY quartile. By comparing these re-sults with overall changes in commission revenue reported in Table 2, we findthat churn commissions account for approximately 11% of the total increase incommission revenue. However, we find no evidence of significant increases inCHURN COMMISSIONS for any other quartile. We also examine the bubbleand nonbubble periods separately and find that significant abnormal churning isonly evident in the bubble period. Our results are consistent with circumstantialevidence presented by NRZ (2007) but also suggest that round-trip transactionsrepresent only a fraction of the pay-for-IPO picture.
Institutions can also increase the per-share commissions paid on trades. Weuse 2 variables in our tests: average per-share commission (COMMISSIONSPER SHARE, measured in ¢) received by the lead underwriter, and the frequencyof trades paying greater than 10¢ per share. A commission greater than 10¢ a shareis unusually large (Goldstein et al. (2009)), but paying a large commission is aneffective way to increase underwriter commission revenues.
For the COMMISSIONS PER SHARE measure, we calculate the share-weighted daily average commission for all commission-paying trades executedby the lead underwriter. In Panel B of Table 5 we find some evidence that aver-age COMMISSIONS PER SHARE increases in the [–10, –1] period for the top3 IPO quartiles. In the most profitable quartile, lead underwriters receive averagecommissions of 4.90¢ per share in the [–10, –1] period, compared to the noneventaverage of 4.84¢. For quartile 3, COMMISSIONS PER SHARE increase from4.83¢ in the nonevent period to 4.86¢ during the [–10, –1] period. Although ourtests indicate an increase in COMMISSIONS PER SHARE for quartile 2 IPOs,this increase is not large enough to significantly affect total abnormal commissionpayments received by these underwriters (see Tables 2 and 4).
The final variable in our analysis investigates the frequency of lead under-writer trades where commissions are greater than 10¢ per share. For quartile 4IPOs, the frequency of high commission trades increases by 42%, from the 0.47%nonevent mean to 0.67% during the [–10, –1] event period. Unlike other measures,this ratio remains elevated (0.64%) during the 10 days following the IPO, which isconsistent with ex post settling up after IPO allocations (see footnotes 6 and 18).However, the lack of confirming evidence in total commission revenue in Table 2cautions against concluding that widespread ex post settling up occurred. Our sub-period analyses indicate that increases in very high commission trades occurredonly during the excesses of the bubble period, but that both periods show statis-tically elevated COMMISSIONS PER SHARE for the most profitable quartile.
Collectively, our results indicate that institutions use a variety of tradingstrategies to increase lead-underwriter commissions. The total number of sharestraded, commissions from round-trip trades, average commission per share, andfrequency of trades paying greater than 10¢ per share are all significantly elevatedin the preoffer period for the most profitable IPOs.
1214 Journal of Financial and Quantitative Analysis
B. Churning and Stock Liquidity
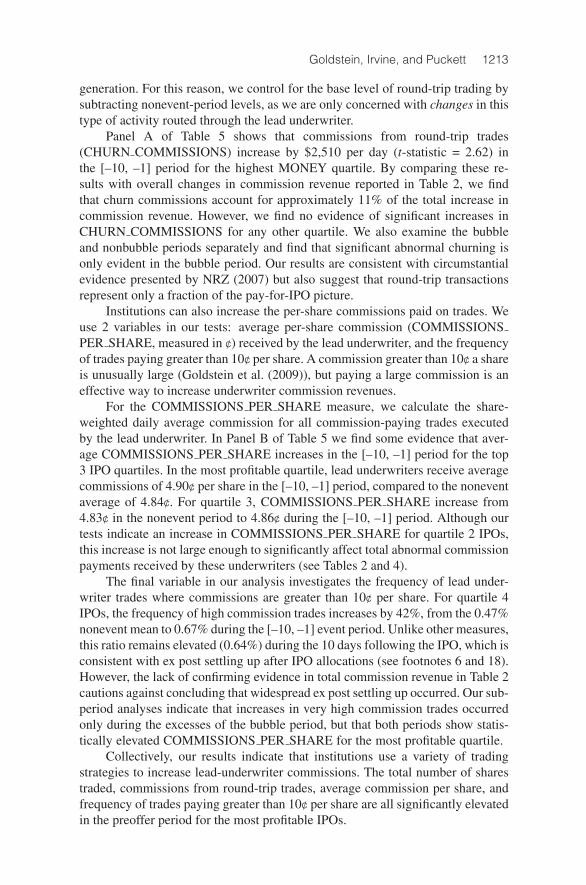
The practice of sending increased commission revenues to the lead under-writer by churning stocks has received attention in both the popular press andacademic literature. Specifically, NRZ (2007) propose that stock churning, if itexists, should be concentrated in only the most liquid shares. We investigate thepresence of CHURN COMMISSIONS in greater detail to determine whether thissupposition is borne out in our data.
For each sample month, we sort all CRSP stocks into liquidity deciles using2 measures of liquidity: Amihud’s (2002) illiquidity measure and dollar tradingvolume.25 The intuition behind Amihud’s illiquidity measure is as follows: Astock whose price moves more (relative to other stocks) in response to a givendollar amount of trading volume is more illiquid. This measure is particularlywell suited for our analysis, since it proxies for the cost of trading (e.g., priceimpact), which is of primary importance for institutions that churn stocks. Whilethe number of stocks in each liquidity decile varies from month to month, onaverage, each decile contains approximately 747 stocks.
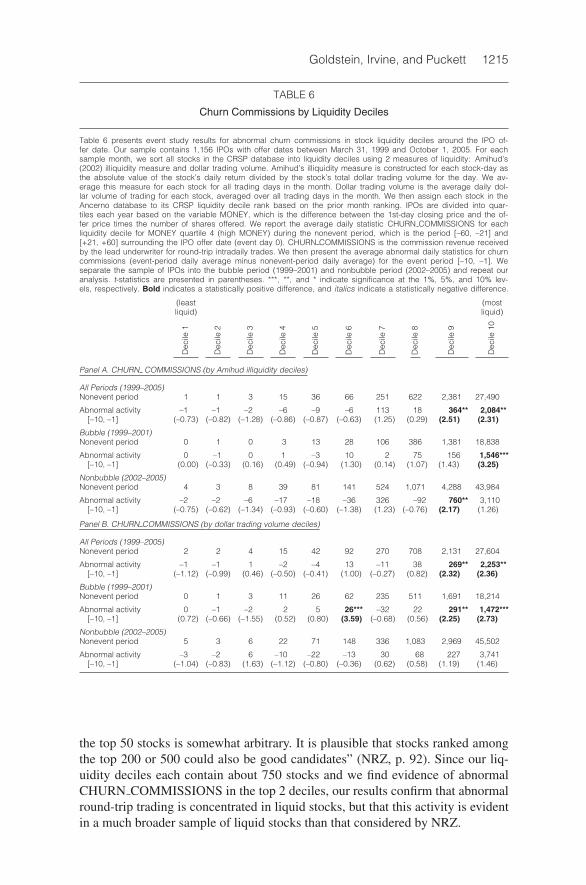
We assign each stock that is traded in the Ancerno database to its CRSPliquidity decile rank based on the prior month ranking. Our assignment of liquid-ity deciles based on prior month liquidity attributes is consistent with NRZ (2007)and avoids any potential look-ahead bias. We repeat the CHURNCOMMISSIONS analysis reported in Table 5 for each liquidity decile and re-port results for MONEY quartile 4 (high MONEY) in Table 6. Panel A of Table 6reports our results for deciles ranked by Amihud’s (2002) illiquidity measure. Ourresults show increases in CHURN COMMISSIONS in the 2 most liquid decilesof stocks. CHURN COMMISSIONS increase by $2,084 (t-statistic = 2.31) in themost liquid decile, and by $364 (t-statistic = 2.51) in the 2nd most liquid decile.Our subperiod analysis of bubble and nonbubble periods shows that abnormalCHURN COMMISSIONS are present in both periods.
Panel B of Table 6 reports our results for liquidity deciles based on an al-ternate liquidity measure: dollar trading volume. Again, we find evidence of in-creases in CHURN COMMISSIONS in the 2 most liquid stock deciles. CHURNCOMMISSIONS increase by $2,253 (t-statistic = 2.36) in the most liquid decile,and by $269 (t-statistic = 2.32) in the 2nd most liquid decile. However, unlike ourprevious results using Amihud’s (2002) illiquidity measure, we now find that ev-idence of abnormal CHURN COMMISSIONS is restricted to the bubble period.
Our results on stock liquidity and CHURN COMMISSIONS both confirmand expand results presented by NRZ (2007). Specifically, NRZ restrict theiranalysis to the 50 most liquid stocks but also state that “although IPO-relatedtrading is more likely to be associated with large liquid stocks, our choice of
25Amihud’s (2002) illiquidity measure is constructed for each stock-day as the absolute value ofthe stock’s daily return divided by the stock’s total dollar trading volume for the day. We average thismeasure for each stock for all trading days in the month. Since higher values of Amihud’s measureindicate stocks with greater illiquidity, our liquidity deciles are in the reverse order of the Amihudmeasure: The highest liquidity decile, decile 10, has the lowest Amihud scores. Dollar trading volumeis the average daily dollar volume of trading for each stock, averaged over all trading days in themonth.
Goldstein, Irvine, and Puckett 1215
TABLE 6
Churn Commissions by Liquidity Deciles
Table 6 presents event study results for abnormal churn commissions in stock liquidity deciles around the IPO of-fer date. Our sample contains 1,156 IPOs with offer dates between March 31, 1999 and October 1, 2005. For eachsample month, we sort all stocks in the CRSP database into liquidity deciles using 2 measures of liquidity: Amihud’s(2002) illiquidity measure and dollar trading volume. Amihud’s illiquidity measure is constructed for each stock-day asthe absolute value of the stock’s daily return divided by the stock’s total dollar trading volume for the day. We av-erage this measure for each stock for all trading days in the month. Dollar trading volume is the average daily dol-lar volume of trading for each stock, averaged over all trading days in the month. We then assign each stock in theAncerno database to its CRSP liquidity decile rank based on the prior month ranking. IPOs are divided into quar-tiles each year based on the variable MONEY, which is the difference between the 1st-day closing price and the of-fer price times the number of shares offered. We report the average daily statistic CHURN COMMISSIONS for eachliquidity decile for MONEY quartile 4 (high MONEY) during the nonevent period, which is the period [–60, –21] and[+21, +60] surrounding the IPO offer date (event day 0). CHURN COMMISSIONS is the commission revenue receivedby the lead underwriter for round-trip intradaily trades. We then present the average abnormal daily statistics for churncommissions (event-period daily average minus nonevent-period daily average) for the event period [–10, –1]. Weseparate the sample of IPOs into the bubble period (1999–2001) and nonbubble period (2002–2005) and repeat ouranalysis. t-statistics are presented in parentheses. ***, **, and * indicate significance at the 1%, 5%, and 10% lev-els, respectively. Bold indicates a statistically positive difference, and italics indicate a statistically negative difference.
(least (mostliquid) liquid)
Dec
ile1
Dec
ile2
Dec
ile3
Dec
ile4
Dec
ile5
Dec
ile6
Dec
ile7
Dec
ile8
Dec
ile9
Dec
ile10
Panel A. CHURN COMMISSIONS (by Amihud illiquidity deciles)
All Periods (1999–2005)Nonevent period 1 1 3 15 36 66 251 622 2,381 27,490
Abnormal activity –1 –1 –2 –6 –9 –6 113 18 364** 2,084**[–10, –1] (–0.73) (–0.82) (–1.28) (–0.86) (–0.87) (–0.63) (1.25) (0.29) (2.51) (2.31)
Bubble (1999–2001)Nonevent period 0 1 0 3 13 28 106 386 1,381 18,838
Abnormal activity 0 –1 0 1 –3 10 2 75 156 1,546***[–10, –1] (0.00) (–0.33) (0.16) (0.49) (–0.94) (1.30) (0.14) (1.07) (1.43) (3.25)
Nonbubble (2002–2005)Nonevent period 4 3 8 39 81 141 524 1,071 4,288 43,984
Abnormal activity –2 –2 –6 –17 –18 –36 326 –92 760** 3,110[–10, –1] (–0.75) (–0.62) (–1.34) (–0.93) (–0.60) (–1.38) (1.23) (–0.76) (2.17) (1.26)
Panel B. CHURN COMMISSIONS (by dollar trading volume deciles)
All Periods (1999–2005)Nonevent period 2 2 4 15 42 92 270 708 2,131 27,604
Abnormal activity –1 –1 1 –2 –4 13 –11 38 269** 2,253**[–10, –1] (–1.12) (–0.99) (0.46) (–0.50) (–0.41) (1.00) (–0.27) (0.82) (2.32) (2.36)
Bubble (1999–2001)Nonevent period 0 1 3 11 26 62 235 511 1,691 18,214
Abnormal activity 0 –1 –2 2 5 26*** –32 22 291** 1,472***[–10, –1] (0.72) (–0.66) (–1.55) (0.52) (0.80) (3.59) (–0.68) (0.56) (2.25) (2.73)
Nonbubble (2002–2005)Nonevent period 5 3 6 22 71 148 336 1,083 2,969 45,502
Abnormal activity –3 –2 6 –10 –22 –13 30 68 227 3,741[–10, –1] (–1.04) (–0.83) (1.63) (–1.12) (–0.80) (–0.36) (0.62) (0.58) (1.19) (1.46)
the top 50 stocks is somewhat arbitrary. It is plausible that stocks ranked amongthe top 200 or 500 could also be good candidates” (NRZ, p. 92). Since our liq-uidity deciles each contain about 750 stocks and we find evidence of abnormalCHURN COMMISSIONS in the top 2 deciles, our results confirm that abnormalround-trip trading is concentrated in liquid stocks, but that this activity is evidentin a much broader sample of liquid stocks than that considered by NRZ.
1216 Journal of Financial and Quantitative Analysis
VI. Determinants of Abnormal Commissions
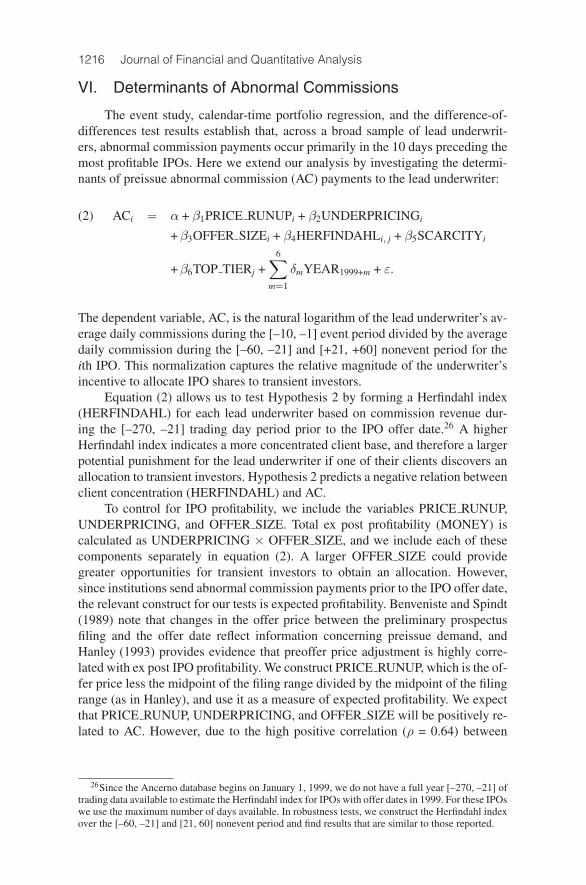
The event study, calendar-time portfolio regression, and the difference-of-differences test results establish that, across a broad sample of lead underwrit-ers, abnormal commission payments occur primarily in the 10 days preceding themost profitable IPOs. Here we extend our analysis by investigating the determi-nants of preissue abnormal commission (AC) payments to the lead underwriter:
ACi = α + β1PRICE RUNUPi + β2UNDERPRICINGi(2)
+β3OFFER SIZEi + β4HERFINDAHLi, j + β5SCARCITYi
+β6TOP TIERj +6∑
m=1
δmYEAR1999+m + ε.
The dependent variable, AC, is the natural logarithm of the lead underwriter’s av-erage daily commissions during the [–10, –1] event period divided by the averagedaily commission during the [–60, –21] and [+21, +60] nonevent period for theith IPO. This normalization captures the relative magnitude of the underwriter’sincentive to allocate IPO shares to transient investors.
Equation (2) allows us to test Hypothesis 2 by forming a Herfindahl index(HERFINDAHL) for each lead underwriter based on commission revenue dur-ing the [–270, –21] trading day period prior to the IPO offer date.26 A higherHerfindahl index indicates a more concentrated client base, and therefore a largerpotential punishment for the lead underwriter if one of their clients discovers anallocation to transient investors. Hypothesis 2 predicts a negative relation betweenclient concentration (HERFINDAHL) and AC.
To control for IPO profitability, we include the variables PRICE RUNUP,UNDERPRICING, and OFFER SIZE. Total ex post profitability (MONEY) iscalculated as UNDERPRICING × OFFER SIZE, and we include each of thesecomponents separately in equation (2). A larger OFFER SIZE could providegreater opportunities for transient investors to obtain an allocation. However,since institutions send abnormal commission payments prior to the IPO offer date,the relevant construct for our tests is expected profitability. Benveniste and Spindt(1989) note that changes in the offer price between the preliminary prospectusfiling and the offer date reflect information concerning preissue demand, andHanley (1993) provides evidence that preoffer price adjustment is highly corre-lated with ex post IPO profitability. We construct PRICE RUNUP, which is the of-fer price less the midpoint of the filing range divided by the midpoint of the filingrange (as in Hanley), and use it as a measure of expected profitability. We expectthat PRICE RUNUP, UNDERPRICING, and OFFER SIZE will be positively re-lated to AC. However, due to the high positive correlation (ρ = 0.64) between
26Since the Ancerno database begins on January 1, 1999, we do not have a full year [–270, –21] oftrading data available to estimate the Herfindahl index for IPOs with offer dates in 1999. For these IPOswe use the maximum number of days available. In robustness tests, we construct the Herfindahl indexover the [–60, –21] and [21, 60] nonevent period and find results that are similar to those reported.
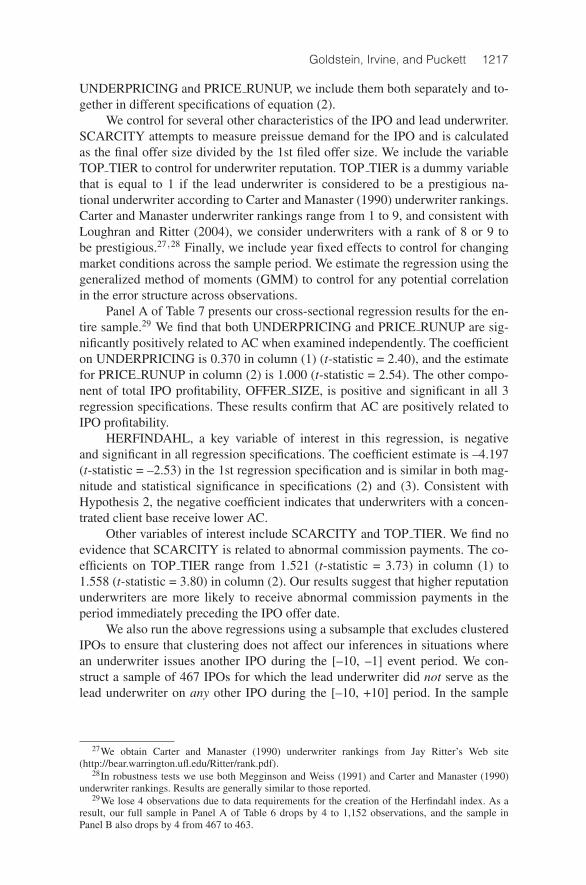
Goldstein, Irvine, and Puckett 1217
UNDERPRICING and PRICE RUNUP, we include them both separately and to-gether in different specifications of equation (2).
We control for several other characteristics of the IPO and lead underwriter.SCARCITY attempts to measure preissue demand for the IPO and is calculatedas the final offer size divided by the 1st filed offer size. We include the variableTOP TIER to control for underwriter reputation. TOP TIER is a dummy variablethat is equal to 1 if the lead underwriter is considered to be a prestigious na-tional underwriter according to Carter and Manaster (1990) underwriter rankings.Carter and Manaster underwriter rankings range from 1 to 9, and consistent withLoughran and Ritter (2004), we consider underwriters with a rank of 8 or 9 tobe prestigious.27,28 Finally, we include year fixed effects to control for changingmarket conditions across the sample period. We estimate the regression using thegeneralized method of moments (GMM) to control for any potential correlationin the error structure across observations.
Panel A of Table 7 presents our cross-sectional regression results for the en-tire sample.29 We find that both UNDERPRICING and PRICE RUNUP are sig-nificantly positively related to AC when examined independently. The coefficienton UNDERPRICING is 0.370 in column (1) (t-statistic = 2.40), and the estimatefor PRICE RUNUP in column (2) is 1.000 (t-statistic = 2.54). The other compo-nent of total IPO profitability, OFFER SIZE, is positive and significant in all 3regression specifications. These results confirm that AC are positively related toIPO profitability.
HERFINDAHL, a key variable of interest in this regression, is negativeand significant in all regression specifications. The coefficient estimate is –4.197(t-statistic = –2.53) in the 1st regression specification and is similar in both mag-nitude and statistical significance in specifications (2) and (3). Consistent withHypothesis 2, the negative coefficient indicates that underwriters with a concen-trated client base receive lower AC.
Other variables of interest include SCARCITY and TOP TIER. We find noevidence that SCARCITY is related to abnormal commission payments. The co-efficients on TOP TIER range from 1.521 (t-statistic = 3.73) in column (1) to1.558 (t-statistic = 3.80) in column (2). Our results suggest that higher reputationunderwriters are more likely to receive abnormal commission payments in theperiod immediately preceding the IPO offer date.
We also run the above regressions using a subsample that excludes clusteredIPOs to ensure that clustering does not affect our inferences in situations wherean underwriter issues another IPO during the [–10, –1] event period. We con-struct a sample of 467 IPOs for which the lead underwriter did not serve as thelead underwriter on any other IPO during the [–10, +10] period. In the sample
27We obtain Carter and Manaster (1990) underwriter rankings from Jay Ritter’s Web site(http://bear.warrington.ufl.edu/Ritter/rank.pdf).
28In robustness tests we use both Megginson and Weiss (1991) and Carter and Manaster (1990)underwriter rankings. Results are generally similar to those reported.
29We lose 4 observations due to data requirements for the creation of the Herfindahl index. As aresult, our full sample in Panel A of Table 6 drops by 4 to 1,152 observations, and the sample inPanel B also drops by 4 from 467 to 463.
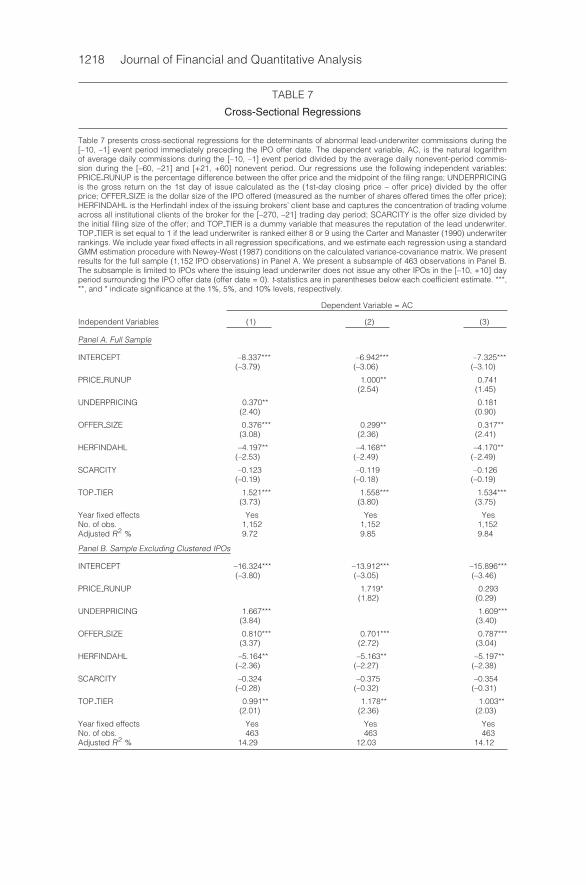
1218 Journal of Financial and Quantitative Analysis
TABLE 7
Cross-Sectional Regressions
Table 7 presents cross-sectional regressions for the determinants of abnormal lead-underwriter commissions during the[–10, –1] event period immediately preceding the IPO offer date. The dependent variable, AC, is the natural logarithmof average daily commissions during the [–10, –1] event period divided by the average daily nonevent-period commis-sion during the [–60, –21] and [+21, +60] nonevent period. Our regressions use the following independent variables:PRICE RUNUP is the percentage difference between the offer price and the midpoint of the filing range; UNDERPRICINGis the gross return on the 1st day of issue calculated as the (1st-day closing price – offer price) divided by the offerprice; OFFER SIZE is the dollar size of the IPO offered (measured as the number of shares offered times the offer price);HERFINDAHL is the Herfindahl index of the issuing brokers’ client base and captures the concentration of trading volumeacross all institutional clients of the broker for the [–270, –21] trading day period; SCARCITY is the offer size divided bythe initial filing size of the offer; and TOP TIER is a dummy variable that measures the reputation of the lead underwriter.TOP TIER is set equal to 1 if the lead underwriter is ranked either 8 or 9 using the Carter and Manaster (1990) underwriterrankings. We include year fixed effects in all regression specifications, and we estimate each regression using a standardGMM estimation procedure with Newey-West (1987) conditions on the calculated variance-covariance matrix. We presentresults for the full sample (1,152 IPO observations) in Panel A. We present a subsample of 463 observations in Panel B.The subsample is limited to IPOs where the issuing lead underwriter does not issue any other IPOs in the [–10, +10] dayperiod surrounding the IPO offer date (offer date = 0). t-statistics are in parentheses below each coefficient estimate. ***,**, and * indicate significance at the 1%, 5%, and 10% levels, respectively.
Dependent Variable = AC
Independent Variables (1) (2) (3)
Panel A. Full Sample
INTERCEPT –8.337*** –6.942*** –7.325***(–3.79) (–3.06) (–3.10)
PRICE RUNUP 1.000** 0.741(2.54) (1.45)
UNDERPRICING 0.370** 0.181(2.40) (0.90)
OFFER SIZE 0.376*** 0.299** 0.317**(3.08) (2.36) (2.41)
HERFINDAHL –4.197** –4.168** –4.170**(–2.53) (–2.49) (–2.49)
SCARCITY –0.123 –0.119 –0.126(–0.19) (–0.18) (–0.19)
TOP TIER 1.521*** 1.558*** 1.534***(3.73) (3.80) (3.75)
Year fixed effects Yes Yes YesNo. of obs. 1,152 1,152 1,152Adjusted R2 % 9.72 9.85 9.84
Panel B. Sample Excluding Clustered IPOs
INTERCEPT –16.324*** –13.912*** –15.896***(–3.80) (–3.05) (–3.46)
PRICE RUNUP 1.719* 0.293(1.82) (0.29)
UNDERPRICING 1.667*** 1.609***(3.84) (3.40)
OFFER SIZE 0.810*** 0.701*** 0.787***(3.37) (2.72) (3.04)
HERFINDAHL –5.164** –5.163** –5.197**(–2.36) (–2.27) (–2.38)
SCARCITY –0.324 –0.375 –0.354(–0.28) (–0.32) (–0.31)
TOP TIER 0.991** 1.178** 1.003**(2.01) (2.36) (2.03)
Year fixed effects Yes Yes YesNo. of obs. 463 463 463Adjusted R2 % 14.29 12.03 14.12
Goldstein, Irvine, and Puckett 1219
FIGURE 2
Distribution of IPOs through Time
Figure 2 presents the distribution of IPOs by year for our sample. Our sample contains 1,156 IPOs with offer dates betweenMarch 31, 1999 and October 1, 2005. In addition, the distribution of the 467 unclustered IPOs, for which there were noother IPOs issued by the same lead underwriter during the [–10, +10] period surrounding the IPO date, are also shown byyear.
excluding clustered IPOs, underwriters may issue another IPO in the [–60, –21]and [+21, +60] nonevent period, which will only elevate nonevent commissionsand bias our tests against rejection of the null hypothesis. Figure 2 shows thedistribution by year for the overall sample of 1,156 IPOs and the subsample of467 unclustered IPOs.30
Panel B of Table 7 presents regression results for the sample excluding clus-tered IPOs. Subsample results are similar to the results in the full sample. Specifi-cally, we find that all measures of IPO profitability—UNDERPRICING,PRICE RUNUP, and OFFER SIZE—are still positive and statistically significantwhen examined independently. However, for the regression specification in col-umn (2), the statistical significance of PRICE RUNUP drops to the 10% level.We continue to find strong support of Hypothesis 2, in that the coefficient onHERFINDAHL continues to be negative and significant in all regression specifi-cations. Also, coefficients on TOP TIER continue to be positive and significant.
Overall, we find that higher abnormal commissions are associated with themore profitable IPOs as predicted by Hypothesis 1. As suggested by Hypothesis 2,we find direct confirmation that this effect is mitigated by a more concentratedunderwriter client base. Both results are robust to a variety of regression specifi-cations and to a restricted sample of unclustered IPOs.
30We run empirical tests presented in Tables 2, 4, and 5 on the unclustered control sample, and allof the results continue to hold. Due to the construction of the calendar-time regressions, we did notrerun Table 3 on this subsample.
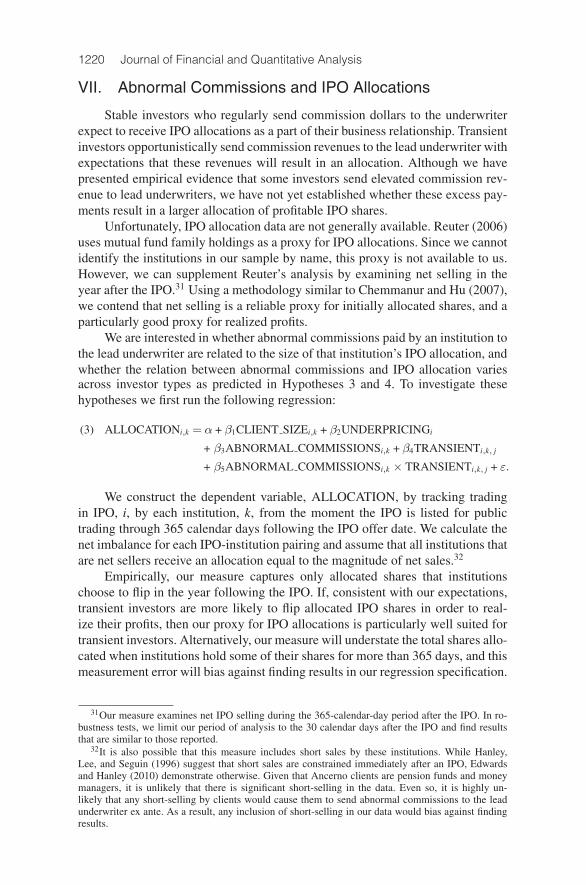
1220 Journal of Financial and Quantitative Analysis
VII. Abnormal Commissions and IPO Allocations
Stable investors who regularly send commission dollars to the underwriterexpect to receive IPO allocations as a part of their business relationship. Transientinvestors opportunistically send commission revenues to the lead underwriter withexpectations that these revenues will result in an allocation. Although we havepresented empirical evidence that some investors send elevated commission rev-enue to lead underwriters, we have not yet established whether these excess pay-ments result in a larger allocation of profitable IPO shares.
Unfortunately, IPO allocation data are not generally available. Reuter (2006)uses mutual fund family holdings as a proxy for IPO allocations. Since we cannotidentify the institutions in our sample by name, this proxy is not available to us.However, we can supplement Reuter’s analysis by examining net selling in theyear after the IPO.31 Using a methodology similar to Chemmanur and Hu (2007),we contend that net selling is a reliable proxy for initially allocated shares, and aparticularly good proxy for realized profits.
We are interested in whether abnormal commissions paid by an institution tothe lead underwriter are related to the size of that institution’s IPO allocation, andwhether the relation between abnormal commissions and IPO allocation variesacross investor types as predicted in Hypotheses 3 and 4. To investigate thesehypotheses we first run the following regression:
ALLOCATIONi,k = α + β1CLIENT SIZEi,k + β2UNDERPRICINGi(3)
+ β3ABNORMAL COMMISSIONSi,k + β4TRANSIENTi,k, j
+ β5ABNORMAL COMMISSIONSi,k × TRANSIENTi,k, j + ε.
We construct the dependent variable, ALLOCATION, by tracking tradingin IPO, i, by each institution, k, from the moment the IPO is listed for publictrading through 365 calendar days following the IPO offer date. We calculate thenet imbalance for each IPO-institution pairing and assume that all institutions thatare net sellers receive an allocation equal to the magnitude of net sales.32
Empirically, our measure captures only allocated shares that institutionschoose to flip in the year following the IPO. If, consistent with our expectations,transient investors are more likely to flip allocated IPO shares in order to real-ize their profits, then our proxy for IPO allocations is particularly well suited fortransient investors. Alternatively, our measure will understate the total shares allo-cated when institutions hold some of their shares for more than 365 days, and thismeasurement error will bias against finding results in our regression specification.
31Our measure examines net IPO selling during the 365-calendar-day period after the IPO. In ro-bustness tests, we limit our period of analysis to the 30 calendar days after the IPO and find resultsthat are similar to those reported.
32It is also possible that this measure includes short sales by these institutions. While Hanley,Lee, and Seguin (1996) suggest that short sales are constrained immediately after an IPO, Edwardsand Hanley (2010) demonstrate otherwise. Given that Ancerno clients are pension funds and moneymanagers, it is unlikely that there is significant short-selling in the data. Even so, it is highly un-likely that any short-selling by clients would cause them to send abnormal commissions to the leadunderwriter ex ante. As a result, any inclusion of short-selling in our data would bias against findingresults.
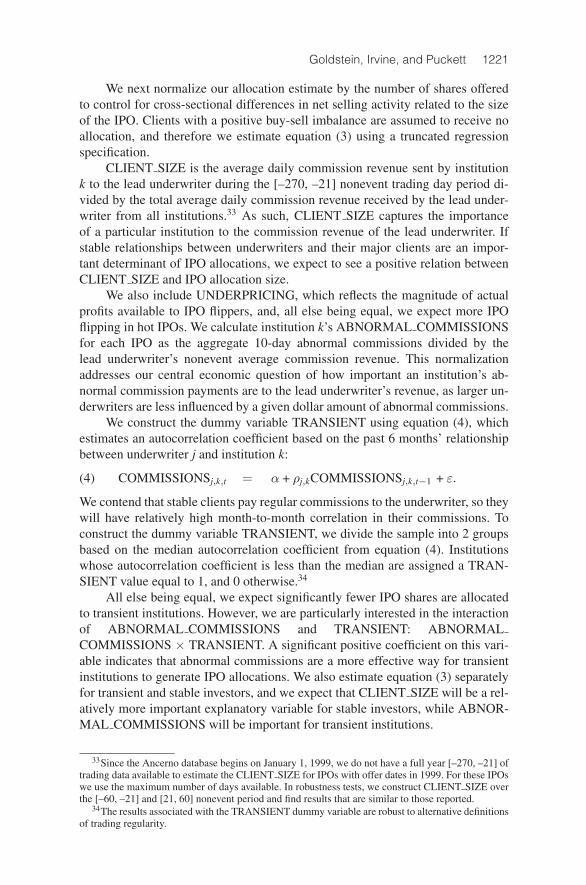
Goldstein, Irvine, and Puckett 1221
We next normalize our allocation estimate by the number of shares offeredto control for cross-sectional differences in net selling activity related to the sizeof the IPO. Clients with a positive buy-sell imbalance are assumed to receive noallocation, and therefore we estimate equation (3) using a truncated regressionspecification.
CLIENT SIZE is the average daily commission revenue sent by institutionk to the lead underwriter during the [–270, –21] nonevent trading day period di-vided by the total average daily commission revenue received by the lead under-writer from all institutions.33 As such, CLIENT SIZE captures the importanceof a particular institution to the commission revenue of the lead underwriter. Ifstable relationships between underwriters and their major clients are an impor-tant determinant of IPO allocations, we expect to see a positive relation betweenCLIENT SIZE and IPO allocation size.
We also include UNDERPRICING, which reflects the magnitude of actualprofits available to IPO flippers, and, all else being equal, we expect more IPOflipping in hot IPOs. We calculate institution k’s ABNORMAL COMMISSIONSfor each IPO as the aggregate 10-day abnormal commissions divided by thelead underwriter’s nonevent average commission revenue. This normalizationaddresses our central economic question of how important an institution’s ab-normal commission payments are to the lead underwriter’s revenue, as larger un-derwriters are less influenced by a given dollar amount of abnormal commissions.
We construct the dummy variable TRANSIENT using equation (4), whichestimates an autocorrelation coefficient based on the past 6 months’ relationshipbetween underwriter j and institution k:
COMMISSIONSj,k,t = α + ρj,kCOMMISSIONSj,k,t−1 + ε.(4)
We contend that stable clients pay regular commissions to the underwriter, so theywill have relatively high month-to-month correlation in their commissions. Toconstruct the dummy variable TRANSIENT, we divide the sample into 2 groupsbased on the median autocorrelation coefficient from equation (4). Institutionswhose autocorrelation coefficient is less than the median are assigned a TRAN-SIENT value equal to 1, and 0 otherwise.34
All else being equal, we expect significantly fewer IPO shares are allocatedto transient institutions. However, we are particularly interested in the interactionof ABNORMAL COMMISSIONS and TRANSIENT: ABNORMALCOMMISSIONS × TRANSIENT. A significant positive coefficient on this vari-able indicates that abnormal commissions are a more effective way for transientinstitutions to generate IPO allocations. We also estimate equation (3) separatelyfor transient and stable investors, and we expect that CLIENT SIZE will be a rel-atively more important explanatory variable for stable investors, while ABNOR-MAL COMMISSIONS will be important for transient institutions.
33Since the Ancerno database begins on January 1, 1999, we do not have a full year [–270, –21] oftrading data available to estimate the CLIENT SIZE for IPOs with offer dates in 1999. For these IPOswe use the maximum number of days available. In robustness tests, we construct CLIENT SIZE overthe [–60, –21] and [21, 60] nonevent period and find results that are similar to those reported.
34The results associated with the TRANSIENT dummy variable are robust to alternative definitionsof trading regularity.
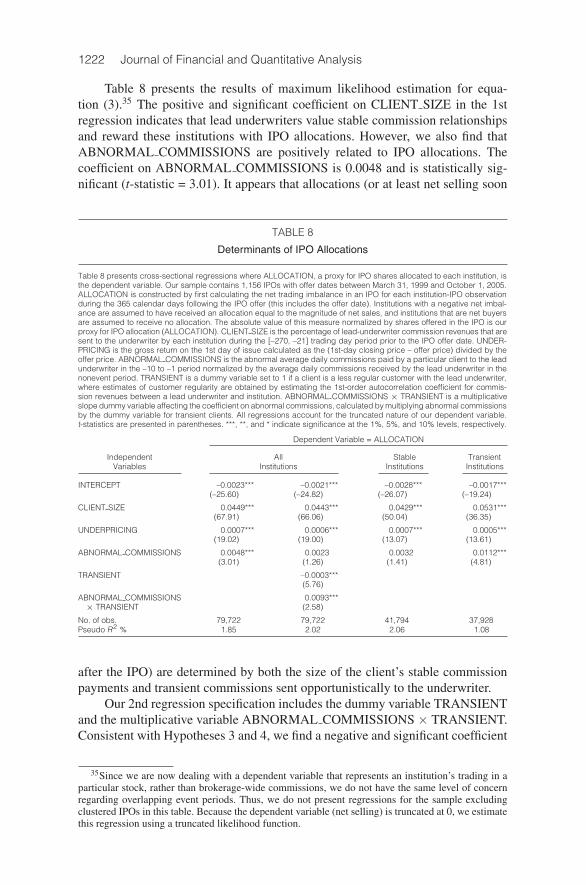
1222 Journal of Financial and Quantitative Analysis
Table 8 presents the results of maximum likelihood estimation for equa-tion (3).35 The positive and significant coefficient on CLIENT SIZE in the 1stregression indicates that lead underwriters value stable commission relationshipsand reward these institutions with IPO allocations. However, we also find thatABNORMAL COMMISSIONS are positively related to IPO allocations. Thecoefficient on ABNORMAL COMMISSIONS is 0.0048 and is statistically sig-nificant (t-statistic = 3.01). It appears that allocations (or at least net selling soon
TABLE 8
Determinants of IPO Allocations
Table 8 presents cross-sectional regressions where ALLOCATION, a proxy for IPO shares allocated to each institution, isthe dependent variable. Our sample contains 1,156 IPOs with offer dates between March 31, 1999 and October 1, 2005.ALLOCATION is constructed by first calculating the net trading imbalance in an IPO for each institution-IPO observationduring the 365 calendar days following the IPO offer (this includes the offer date). Institutions with a negative net imbal-ance are assumed to have received an allocation equal to the magnitude of net sales, and institutions that are net buyersare assumed to receive no allocation. The absolute value of this measure normalized by shares offered in the IPO is ourproxy for IPO allocation (ALLOCATION). CLIENT SIZE is the percentage of lead-underwriter commission revenues that aresent to the underwriter by each institution during the [–270, –21] trading day period prior to the IPO offer date. UNDER-PRICING is the gross return on the 1st day of issue calculated as the (1st-day closing price – offer price) divided by theoffer price. ABNORMAL COMMISSIONS is the abnormal average daily commissions paid by a particular client to the leadunderwriter in the –10 to –1 period normalized by the average daily commissions received by the lead underwriter in thenonevent period. TRANSIENT is a dummy variable set to 1 if a client is a less regular customer with the lead underwriter,where estimates of customer regularity are obtained by estimating the 1st-order autocorrelation coefficient for commis-sion revenues between a lead underwriter and institution. ABNORMAL COMMISSIONS × TRANSIENT is a multiplicativeslope dummy variable affecting the coefficient on abnormal commissions, calculated by multiplying abnormal commissionsby the dummy variable for transient clients. All regressions account for the truncated nature of our dependent variable.t-statistics are presented in parentheses. ***, **, and * indicate significance at the 1%, 5%, and 10% levels, respectively.
Dependent Variable = ALLOCATION
Independent All Stable TransientVariables Institutions Institutions Institutions
INTERCEPT –0.0023*** –0.0021*** –0.0028*** –0.0017***(–25.60) (–24.82) (–26.07) (–19.24)
CLIENT SIZE 0.0449*** 0.0443*** 0.0429*** 0.0531***(67.91) (66.06) (50.04) (36.35)
UNDERPRICING 0.0007*** 0.0006*** 0.0007*** 0.0005***(19.02) (19.00) (13.07) (13.61)
ABNORMAL COMMISSIONS 0.0048*** 0.0023 0.0032 0.0112***(3.01) (1.26) (1.41) (4.81)
TRANSIENT –0.0003***(5.76)
ABNORMAL COMMISSIONS 0.0093***× TRANSIENT (2.58)
No. of obs. 79,722 79,722 41,794 37,928Pseudo R2 % 1.85 2.02 2.06 1.08
after the IPO) are determined by both the size of the client’s stable commissionpayments and transient commissions sent opportunistically to the underwriter.
Our 2nd regression specification includes the dummy variable TRANSIENTand the multiplicative variable ABNORMAL COMMISSIONS × TRANSIENT.Consistent with Hypotheses 3 and 4, we find a negative and significant coefficient
35Since we are now dealing with a dependent variable that represents an institution’s trading in aparticular stock, rather than brokerage-wide commissions, we do not have the same level of concernregarding overlapping event periods. Thus, we do not present regressions for the sample excludingclustered IPOs in this table. Because the dependent variable (net selling) is truncated at 0, we estimatethis regression using a truncated likelihood function.
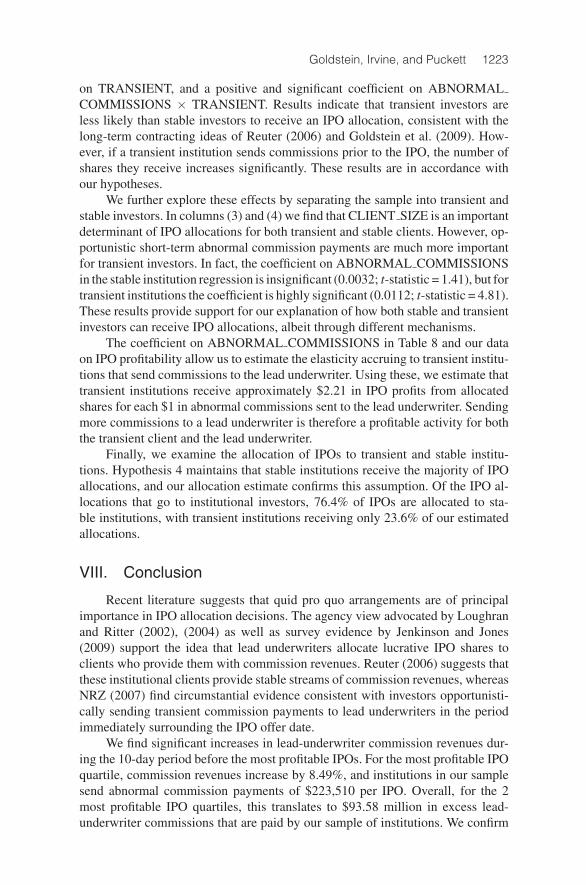
Goldstein, Irvine, and Puckett 1223
on TRANSIENT, and a positive and significant coefficient on ABNORMALCOMMISSIONS × TRANSIENT. Results indicate that transient investors areless likely than stable investors to receive an IPO allocation, consistent with thelong-term contracting ideas of Reuter (2006) and Goldstein et al. (2009). How-ever, if a transient institution sends commissions prior to the IPO, the number ofshares they receive increases significantly. These results are in accordance withour hypotheses.
We further explore these effects by separating the sample into transient andstable investors. In columns (3) and (4) we find that CLIENT SIZE is an importantdeterminant of IPO allocations for both transient and stable clients. However, op-portunistic short-term abnormal commission payments are much more importantfor transient investors. In fact, the coefficient on ABNORMAL COMMISSIONSin the stable institution regression is insignificant (0.0032; t-statistic = 1.41), but fortransient institutions the coefficient is highly significant (0.0112; t-statistic = 4.81).These results provide support for our explanation of how both stable and transientinvestors can receive IPO allocations, albeit through different mechanisms.
The coefficient on ABNORMAL COMMISSIONS in Table 8 and our dataon IPO profitability allow us to estimate the elasticity accruing to transient institu-tions that send commissions to the lead underwriter. Using these, we estimate thattransient institutions receive approximately $2.21 in IPO profits from allocatedshares for each $1 in abnormal commissions sent to the lead underwriter. Sendingmore commissions to a lead underwriter is therefore a profitable activity for boththe transient client and the lead underwriter.
Finally, we examine the allocation of IPOs to transient and stable institu-tions. Hypothesis 4 maintains that stable institutions receive the majority of IPOallocations, and our allocation estimate confirms this assumption. Of the IPO al-locations that go to institutional investors, 76.4% of IPOs are allocated to sta-ble institutions, with transient institutions receiving only 23.6% of our estimatedallocations.
VIII. Conclusion
Recent literature suggests that quid pro quo arrangements are of principalimportance in IPO allocation decisions. The agency view advocated by Loughranand Ritter (2002), (2004) as well as survey evidence by Jenkinson and Jones(2009) support the idea that lead underwriters allocate lucrative IPO shares toclients who provide them with commission revenues. Reuter (2006) suggests thatthese institutional clients provide stable streams of commission revenues, whereasNRZ (2007) find circumstantial evidence consistent with investors opportunisti-cally sending transient commission payments to lead underwriters in the periodimmediately surrounding the IPO offer date.
We find significant increases in lead-underwriter commission revenues dur-ing the 10-day period before the most profitable IPOs. For the most profitable IPOquartile, commission revenues increase by 8.49%, and institutions in our samplesend abnormal commission payments of $223,510 per IPO. Overall, for the 2most profitable IPO quartiles, this translates to $93.58 million in excess lead-underwriter commissions that are paid by our sample of institutions. We confirm
1224 Journal of Financial and Quantitative Analysis
that these findings are robust to a variety of alternate specifications and cannot beattributed to marketwide changes in trading volume or IPO clustering. Our resultsare consistent with strategic decisions by some institutions to use commissiondollars as a means of obtaining profitable IPO allocations.
Our findings suggest that the institutions in our sample strategically employa variety of trading strategies to increase lead-underwriter commissions, includ-ing increasing round-trip trades, increasing commissions per share, and payingunusually high commissions for some trades. We estimate that commissions fromabnormal round-trip trades account for 11% of the total increase in commissionrevenue for the most profitable IPO quartile. In addition, the average commissionpaid for all trades in this quartile increases from 4.84¢ per share to 4.90¢ per share,and the frequency of trades paying greater than 10¢ per share goes from 0.47% to0.67%.
Institutions with stable long-term relationships with underwriters expect toreceive IPO allocations as part of their normal business relationship. Alternatively,there exist transient investors who attempt to buy their way into IPO allocationsby directing abnormally high commissions to the underwriter in the period im-mediately surrounding a desirable IPO. Any allocation by the lead underwriterto transient investors reduces the welfare of stable investors, and if detected, sta-ble investors could discipline the underwriter by withholding future commissionbusiness. We find that stable institutions, on average, receive more than 75% ofthe IPO allocation, and that the amount of abnormal commissions paid by in-stitutions to the lead underwriter is inversely related to the concentration of theunderwriter’s client base. The latter finding is consistent with our assumption thatinstitutions have the ability to discipline underwriters, and this disciplinary mech-anism limits the practice of paying for allocations with abnormal commissions.
Finally, our data also allow us to examine whether particular institutionsare successful in using commissions to capture IPO profits. Specifically, we in-vestigate whether increased commissions sent to the lead underwriter result inlarger allocations of profitable IPOs. We find evidence that stable and transientinstitutions interact differently with lead underwriters. Our findings indicate thatprofitable IPO allocations to stable institutions are primarily determined by thelong-term commission revenue streams that such institutions provide. Alterna-tively, excess commissions sent to the lead underwriter in the period immediatelypreceding the IPO offer date are more important for transient institution allo-cations. We estimate that $1 of abnormal commission revenue sent by transientinstitutions to the lead underwriter generates approximately $2.21 in IPO profitsfrom allocated shares. It appears that transient institutions are successful in usingcommissions to capture excess IPO profits.
ReferencesAmihud, Y. “Illiquidity and Stock Returns: Cross-Section and Time-Series Effects.” Journal of Finan-
cial Markets, 5 (2002), 31–56.Benveniste, L. M., and P. A. Spindt. “How Investment Bankers Determine the Offer Price and Alloca-
tion of New Issues.” Journal of Financial Economics, 24 (1989), 343–361.Binay, M. M.; V. A. Gatchev; and C. A. Pirinsky. “The Role of Underwriter-Investor Relationships in
the IPO Process.” Journal of Financial and Quantitative Analysis, 42 (2007), 785–810.
Goldstein, Irvine, and Puckett 1225
Boehmer, B.; E. Boehmer; and R. P. H. Fishe. “Do Institutions Receive Favorable Allocations inIPOs with Better Long-Run Returns.” Journal of Financial and Quantitative Analysis, 41 (2006),809–828.
Brennan, M. J., and T. Chordia. “Brokerage Commission Schedules.” Journal of Finance, 48 (1993),1379–1402.
Carter, R., and S. Manaster. “Initial Public Offerings and Underwriter Reputation.” Journal of Finance,45 (1990), 1045–1067.
Chemmanur, T. J.; S. He; and G. Hu. “The Role of Institutional Investors in Seasoned Equity Offer-ings.” Journal of Financial Economics, 94 (2009), 384–411.
Chemmanur, T., and G. Hu. “Institutional Trading, Allocation Sales, and Private Information in IPOs.”Working Paper, Babson College (2007).
Chen, H.-C., and J. R. Ritter. “The Seven Percent Solution.” Journal of Finance, 55 (2000), 1105–1131.
Corwin, S. A.; J. H. Harris; and M. L. Lipson. “The Development of Secondary Market Liquidity forNYSE-Listed IPOs.” Journal of Finance, 59 (2004), 2339–2373.
Dennis, P. J., and D. Strickland. “Who Blinks in Volatile Markets, Individuals or Institutions?” Journalof Finance, 57 (2002), 1923–1949.
Edwards, A. K., and K. W. Hanley. “Short Selling in Initial Public Offerings.” Journal of FinancialEconomics, 98 (2010), 21–39.
Goldstein, M. A.; E. S. Hotchkiss; and E. R. Sirri. “Transparency and Liquidity: A Controlled Exper-iment on Corporate Bonds.” Review of Financial Studies, 20 (2007), 235–273.
Goldstein, M. A.; P. Irvine; E. Kandel; and Z. Wiener. “Brokerage Commissions and InstitutionalTrading Patterns.” Review of Financial Studies, 22 (2009), 5175–5212.
Hanley, K. W. “The Underpricing of Initial Public Offerings and the Partial Adjustment Phenomenon.”Journal of Financial Economics, 34 (1993), 231–250.
Hanley, K. W.; C. M. C. Lee; and P. J. Seguin. “The Marketing of Closed-End Fund IPOs: Evidencefrom Transactions Data.” Journal of Financial Intermediation, 5 (1996), 127–159.
Irvine, P.; M. Lipson; and A. Puckett. “Tipping.” Review of Financial Studies, 20 (2007), 741–768.Jenkinson, T., and H. Jones. “IPO Pricing and Allocation: A Survey of the Views of Institutional
Investors.” Review of Financial Studies, 22 (2009), 1477–1504.Jones, C., and M. Lipson. “Are Retail Orders Different?” Working Paper, Columbia University (2004).Lipson, M., and A. Puckett. “Volatile Markets and Institutional Trading.” Working Paper, University
of Virginia (2007).Ljungqvist, A., and W. J. Wilhelm Jr. “IPO Pricing in the Dot-Com Bubble.” Journal of Finance, 58
(2003), 723–752.Loughran, T., and J. R. Ritter. “Why Don’t Issuers Get Upset About Leaving Money on the Table in
IPOs?” Review of Financial Studies, 15 (2002), 413–443.Loughran, T., and J. Ritter. “Why Has IPO Underpricing Changed Over Time?” Financial Manage-
ment, 33 (2004), 5–37.Lowry, M. “Why Does IPO Volume Fluctuate So Much?” Journal of Financial Economics, 67 (2003),
3–40.Lowry, M., and G. W. Schwert. “IPO Market Cycles: Bubbles or Sequential Learning.” Journal of
Finance, 57 (2002), 1171–1200.Lowry, M., and S. Shu. “Litigation Risk and IPO Underpricing.” Journal of Financial Economics, 65
(2002), 309–335.Megginson, W. L., and K. W. Weiss. “Venture Capitalist Certification in Initial Public Offerings.”
Journal of Finance, 46 (1991), 879–903.Newey, W. K., and K. D. West. “A Simple, Positive Semi-Definite, Heteroskedasticity and Autocorre-
lation Consistent Covariance Matrix.” Econometrica, 55 (1987), 703–708.Nimalendran, M.; J. R. Ritter; and D. Zhang. “Do Today’s Trades Affect Tomorrow’s IPO Alloca-
tions?” Journal of Financial Economics, 84 (2007), 87–109.Reuter, J. “Are IPO Allocations for Sale? Evidence from Mutual Funds.” Journal of Finance, 61
(2006), 2289–2324.Ritter, J. R., and I. Welch. “A Review of IPO Activity, Pricing, and Allocations.” Journal of Finance,
57 (2002), 1795–1828.Schwartz, R., and J. Shapiro. “The Challenge of Institutionalization for the Equity Market.” In Recent
Developments in Finance, A. Saunders, ed. Chicago, IL: Irwin Professional Publishing (1992),31–45.
Smith, R., and C. Bray. “IPO-Abuses Lawsuit Is Settled: Dot-Com-Era Assault on Wall Street TacticsResults in $586 Million Deal.” The Wall Street Journal (Oct. 7, 2009), C1.
Tinic, S. M. “Anatomy of Initial Public Offerings of Common Stock.” Journal of Finance, 43 (1988),789–822.

Copyright of Journal of Financial & Quantitative Analysis is the property of Cambridge University Press and its
content may not be copied or emailed to multiple sites or posted to a listserv without the copyright holder's
express written permission. However, users may print, download, or email articles for individual use.