Abercrombie & Fitch Co. - Max M. Fisher College of Summer Abercrombi… · NYSE: ANF Abercrombie &...
23
NYSE: ANF Abercrombie & Fitch Co. 08 August 2007 Investment Thesis Abercrombie & Fitch is a leading specialty retailer for both teens and young adults with recognized brands such as Hollister and the original Abercrombie & Fitch. Traditionally strong growth potential coupled with high margins give ANF a significant advantage over other specialty retailers, but soft retail sales have resulted in a current price that underestimate the profitability of the firm. A new inventory management system will incite profits for the upcoming fiscal year ahead of consensus estimates. Summary Abercrombie & Fitch has an intrinsic value of $94 dollars resulting from the following drivers: • Improved sales, margins, and inventory turnover due to new inventory management system • Historically high margins • Continued sales growth in Hollister, abercrombie, and RUEHL brands • Ability to moderate corporate expenses during slow growth periods • Favorable employment figures and interest rates will negate generally slow economic growth • Encouraging international expansion Analyst: Adam Robertson Fund Bus Fin 824 Fund Mgr: Royce West Fisher College of Business The Ohio State University [email protected] Stock Recommendation: BUY Sector: Consumer Discretionary Industry: Specialty Retail Current Price: $72.22 Price Target: $94.00 Market Cap: $7,178m Outstanding Shares: 92.3m 52 Week High: $84.92 52 Week Low: $49.98 YTD Return: 27.6% Dividend Yield: . 96%
Transcript of Abercrombie & Fitch Co. - Max M. Fisher College of Summer Abercrombi… · NYSE: ANF Abercrombie &...

NYSE: ANF
Abercrombie & Fitch Co.
08 August 2007
Investment Thesis Abercrombie & Fitch is a leading specialty retailer for both teens and young adults with recognized brands such as Hollister and the original Abercrombie & Fitch. Traditionally strong growth potential coupled with high margins give ANF a significant advantage over other specialty retailers, but soft retail sales have resulted in a current price that underestimate the profitability of the firm. A new inventory management system will incite profits for the upcoming fiscal year ahead of consensus estimates. Summary Abercrombie & Fitch has an intrinsic value of $94 dollars resulting from the following drivers:
• Improved sales, margins, and inventory turnover due to new inventory management system
• Historically high margins • Continued sales growth in Hollister,
abercrombie, and RUEHL brands • Ability to moderate corporate expenses during
slow growth periods • Favorable employment figures and interest
rates will negate generally slow economic growth
• Encouraging international expansion
Analyst: Adam Robertson Fund Bus Fin 824 Fund Mgr: Royce West Fisher College of Business The Ohio State University [email protected]
Stock Recommendation: BUY
Sector: Consumer Discretionary
Industry: Specialty Retail
Current Price: $72.22 Price Target: $94.00 Market Cap: $7,178m Outstanding Shares: 92.3m 52 Week High: $84.92 52 Week Low: $49.98 YTD Return: 27.6% Dividend Yield: . 96%

Abercrombie & Fitch (ANF) 8 August 2007
2
Company Overview1
1 Adapted from 2006 Abercrombie & Fitch Co. 10-k
Abercrombie & Fitch Co. (“A&F”), incorporated in Delaware in 1996, is a specialty
retailer that operates stores selling casual apparel, such as knit shirts, graphic t-shirts, jeans, woven shirts and personal care and other accessories for men, women and kids under the Abercrombie & Fitch, abercrombie, Hollister and RUEHL brands. As of May 2007, the Ohio based company operated 964 stores in the United States, Canada, and England.
The Abercrombie & Fitch brand was established in 1892 and became well known as a supplier of rugged, high-quality outdoor gear. Famous for outfitting the safaris of Teddy Roosevelt and Ernest Hemingway and the expeditions of Admiral Byrd to the North and South Poles, Abercrombie & Fitch goods were renowned for their durability and dependability. In 1992, a new management team began repositioning Abercrombie & Fitch as a fashion-oriented casual apparel business directed at 18 to 22 year-old male and female college students with a product assortment reflecting a youthful lifestyle based upon an East Coast heritage and Ivy League traditions. In reestablishing the Abercrombie & Fitch brand, the Company’s goal was to combine its historical reputation for high quality with a new emphasis on casual American style and youthfulness. In 1998, the Company launched abercrombie, a brand directed at 7 to 14 year-old boys and girls, based on the traditions of Abercrombie & Fitch. The Company launched its next brand, Hollister, in 2000. Hollister is a West Coast oriented lifestyle brand targeted at 14 to 18 year-old high school aged guys and girls that embodies the laid-back California surf lifestyle. The RUEHL brand, targeted at 22 to 35 year-old men and women, was launched in 2004. RUEHL’s product assortment is a mix of casual sportswear and trendy fashion created to appeal to the modern-minded, post-college customer.
The Company’s strong brands are undeniably the driver behind its success. Abercrombie & Fitch Co. has solidified itself as a fashion leader within its target market, relying heavily on brand reputation for continued growth and profitability. Fashion is a highly cyclical market that changes market leaders frequently, but A&F has managed to maintain a position as an industry leader. It will be A&F’s ability to dictate style and fashion coupled with improved distribution and logistics that will dictate the Company’s success in years to come. The corporate headquarters, located in New Albany, Ohio, has a unique culture to say the least. The office more closely resembles the seasonally distributed A&F catalogs than a place of business. With a distinctly young, hip workforce, A&F undeniably exhibits the fashion and lifestyle it markets. Clearly, this corporate mentality has helped in the creation and development of their popular brands.

Abercrombie & Fitch (ANF) 8 August 2007
3
Industry Analysis Industry Characteristics
Specialty retail has matured in recent years to a stable industry with several large players leading most fashion trends. The changes in market leaders are typically due to the constantly changing fashion trends, and it is a firm’s ability to create and dictate popular fashion that will determine sustained success. Many of the top retailers find themselves constantly creating new brands and reinventing their image in order to drive top line growth in this highly competitive industry. Cyclicality
In terms of the business cycle, retail stocks perform well during times of recovery, and they continue to outperform as the economy booms. Conversely, retail does tend to underperform as the economy slows. As shown in the graph below, annual change in retail sales is quite indicative of the well-being of the entire economy, most notably in the 1999 prosperity followed by the recession in 2001.
Seasonality
In addition to the cyclicality of this sector, it is also seasonally impacted. In accordance with spending habits, most individuals will spend drastically more on retail goods during the winter holiday season, the back-to-school period, and when customers expect annual sales periods. This is clearly reflected in the sales and performance figures of the industry. Typically, many investors will become apprehensive regarding retail stocks during these important sales periods, specifically in December, frequently causing somewhat predictable investing patterns. It is not uncommon to see a large sell off of retail stocks with repurchases occurring in February and March when risk is significantly lower.

Abercrombie & Fitch (ANF) 8 August 2007
4
Economic Factors Interest Rates Historically, retail performance has been closely tied to interest rates, more specifically changes in The Federal Funds rate, which tend to dictate the overall trend in interest rates. In accordance with neoclassical economics, as interest rates fall, purchases today become relative less expense, and vice versa. Additionally, easing of the Federal Funds Rate is generally warranted in times of poor economic growth. This decrease in rates typically spurs the economy, which typically causes a quicker progression through the business cycle. Consequently, easing of the Federal Funds Rate generally indicates oncoming recovery and boom periods when retail tends to outperform. The opposite is true for times of increasing Federal Funds Rates. As demonstrated in the graph below, decreases in the Federal Funds Rate are typically followed by improved specialty retail stock performance, signifying a inverse correlation.
Currently, the Federal Funds Rate is at 5.25% where it has been for over a year. Despite urging from the market to decrease the Rate, Fed representatives unanimously voted to maintain the current rate due to inflationary pressure from energy and food pricing. The Fed did however change its stance on inflation, insinuating that future inflation was becoming less of an issue at the June meeting. This shift, coupled with increased demand for lower rates, could indicate Fed action to spur the economy on the forefront, although Chairman Bernanke has been steadfast in his stance that the Fed will not bail out the Sub-prime market. Given the unlikelihood of increased Fed Rates, investing in specialty retail is an increasingly attractive proposition in response to this facet, but it is difficult to gauge if and when the Fed may agree to decrease interest rates next.

Abercrombie & Fitch (ANF) 8 August 2007
5
Unemployment Specialty retail is closely related to the amount of disposable income available to customers, and therefore, unemployment figures have significant bearing on retail performance. Obviously, it is an inverse relationship between unemployment and stock performance since higher employment increases discretionary income. Periods with low unemployment ordinarily lead to increased average wages due to the scarcity of quality workers, which amplifies the increase in disposable income. The chart below express exhibits the inverse relationship between these variables.
The unemployment rate has been falling for over 4 years, and presently, in a market with mixed signals, it remains a strong bull market indicator at 4.5%. Additionally, over the past year, seasonally adjusted average hourly wage has increase by 3.9% to $17.383. These current conditions bode well for the retail segment, and outward forecasts seem to expect little change in these factors, largely due to strong production figures. Additional Economic Drivers In addition to interest rates and unemployment, there is a notable inverse relationship between specialty retail stock performance and gasoline prices. Higher gasoline prices serve as a tax on customers, specifically lower income consumers.
3 Derived from the Bureau of Labor Statistics Website (http://stats.bls.gov/cps/)

Abercrombie & Fitch (ANF) 8 August 2007
6
Finally, consumer confidence generally coincides with consumer retail spending. Consumer confidence has been low, but more recent figures not yet reflected in the graph have been encouraging (104 vs 112 from June to July).
Industry Multiples When looking at the industry compared to the S&P 500, it is rather obvious that specialty retail has gone out of favor with investors in recent months. Price to Sales, Book Value, EBITDA, and Cash Flow are all currently below their 5 year averages with strong downward trends. Price to Sales, Price to EBITDA, and Price to Cash Flow are all currently at 5 year lows. Price to Year Forward Earnings is only slightly below 5 year averages, but they numbers have fallen significantly since the beginning of the year when they approached 5 year highs. Overall, these figures indicate that specialty retail stocks are relatively undervalued and could be a purchased now at a significant discount, especially if one believes a bull market is on the forefront.

Abercrombie & Fitch (ANF) 8 August 2007
7
Current Industry Analysis
Although forecasting most industries is difficult, this particular segment is especially
unclear due to the mixed economic indicators. Neither the Federal Funds Rate nor unemployment is expected to significantly change in short-term, though current unemployment figures are strong. Consumer confidence is down; conversely, there is clear downward pressure on already high gasoline prices, which could give retail the boost it needs. The entire industry suffers in circumstances like the current where GDP growth has slowed and energy prices are squeezing margins. However, due to the cyclicality of the retail industry, it would be advantageous for investors to maintain sector weightings inline or even slightly overweight the group. It certainly appears that gasoline prices should fall during the third quarter, and this could definitely be the catalyst for retail and the economy as a whole. These stocks are clearly undervalued at the moment, and although the timeline on the upside is unclear, there appears to be few downward oriented indicators at the moment.

Abercrombie & Fitch (ANF) 8 August 2007
8
Drivers Inventory Improvements Abercrombie is in the process of implementing a Perpetual Inventory System. Due to the impact of catalogue and internet sales, many specialty retails have been forced to upgrade their inventory systems accordingly. Inventory management has been a major knock on Abercrombie in recent quarters. For fiscal 2006, A&F’s year end inventory was 12.9% of annual sales, much higher than 9.4% and 11.3% for competitors American Eagle and Gap Stores respectively. Both of these companies have previously implemented highly comparable Oracle inventory systems in order to control their inventory levels. The charts below show the immediate impact of this inventory system on inventory turnover on Nordstrom (JWN) and Gap Stores (GPS) respectively. The years of implementation are highlighted. Often, companies will experience improved inventory numbers during times of revenue growth (Nordstrom), but even while facing very poor sales growth, Gap experienced its best turnover rate in 10 years.
Derived from Baseline
Although the benefits in amount of inventory are immediately obvious, the overall impact on sales and operating expenses has frequently gone overlooked. Due primarily to less lead time, Gap and American Eagle both experienced notable margin improvements due to the improved inventory system. As companies can better asses what is selling, they can improve ordering, stocking, lead times, etc., which correlates into better sales and better margins. The tables below demonstrate the impact of the inventory separate from other influencing variables over a 10 year span. Specifically, the variable labeled “dummy” is a dummy variable given a value of 1 in the four quarters of implementation and a value of 0 in all other quarters. The dependant variable was the year to year change in Pre-Tax margin on a year to year basis. Previous quarter’s pre-tax margin is a significant variable and has a negative coefficient, implying that it is more difficult to improve on already high margins. Additionally, the year to year change in revenue was both statistically significant and positive as expected. All percents are given in basis points.

Abercrombie & Fitch (ANF) 8 August 2007
9
AEO Coefficients Standard Error t Stat
Intercept 56.11 42.5 1.32Previous Quarter’s Pre-Tax Margin -0.0663 0.03314 -2.00REVENUES YTY % CHANGE 0.03361 0.01077 3.11dummy 49.75 45.23 2.104
GPS Coefficients Standard Error t Stat
Intercept 69.7 38.71 1.80Previous Quarter’s Pre-Tax Margin -0.0909 0.02549 -3.56REVENUES YTY % CHANGE 0.03941 0.009234 4.26Dummy 52.24 38.06 2.37
Derived from StockVal Data The key point to take away from this regression analyses is that in both cases, the
installation of this inventory system improved pre-tax margin by approximately 50 basis points. Although Gap’s margins were no where near that of ANF, American Eagle is highly comparable since it has similar revenue growth and margins. For the purposes of this paper, the 50 basis point improvement shown by the regressions will be used. It would also be acceptable to use the regression analyses to create a function and apply Abercrombie’s current financial situation; nevertheless the resulting expect change in operating margin is about 40 basis points, only 10 basis points less than previously expected.
In August, ANF upped second quarter earnings guidance from 83 cents to 88 cents. Though 2 to 3 cents were attributed to lower tax rates, the additional improvement were not specified. Recent sales have not been above expectations, implying that growing margins are the likely cause. This could certainly be a sign of the impact of this inventory system. Strategic Positioning As previously mentioned, Abercrombie & Fitch originally focused on the teen segment, and although it has expanded its range to try and maintain customer relationships (RUEHL), it’s still overwhelmingly driven by its teen apparel lines. In a recent MarketWatch article, Jennifer Waters noted:
According to results compiled by Thomson Financial, teen-oriented retailers as a group ranked as the strongest in terms of same-store sales performance for June, cumulatively tallying growth in sales at stores open longer than a year of 2.7%. That easily exceeded analysts' average expectation calling for an anemic monthly gain of 0.7%.4
4 Waters, Jennifer. “Those teens and their money”. Marketwatch.com. Jul 12, 2007

Abercrombie & Fitch (ANF) 8 August 2007
10
It appears that teenagers are less cyclical in comparison to the entire industry, and more specifically, these teenage shoppers are not strongly impacted by the poor housing market and high food and energy costs. The strong unemployment and continually increasing average wage figures, largely due to an increase in minimum wage, appear to have bolstered this segment’s performance. The same Waters’ article noted that A&F’s same store comparable growth was approximately 2% company wide, a stark improvement from the 2.8% decrease expected by the market, indicating that A&F is still a fashion leader as well. At the current time, there is no reason to expect that teen retailers will not continue to outperform within specialty retail, due largely to the previously mentioned strong unemployment and increasing minimum wage. Strong Revenue Growth Opportunities Abercrombie & Fitch has several sources of revenue growth for the upcoming years. Although the original A&F brand still has a strong revenue stream, the firm finds most of its growth prospects in its newly developed lines. First, Hollister has been the primary driver in ANF’s success of the past few years. In 2006, the brand’s revenue grew over 36% in 2006, with 5% coming from comparable store growth. Hollister’s comparable store sales became flat during early 2007, but July’s figures are a positive 2%, rebounding with improved economic strength to outperform expectations. At the end of the first quarter, there were 399 Hollister stores with 66 more expected to be completed by the end of the year. The company estimates around 60 more each other next two years, though these figures will be highly sensitive to comparable store results in the months to come.
A&F has been pushing RUEHL, a line designed for college graduates in an attempt to keep current customers as they become older. Comparable growth has averaged over 11% per quarter, but it has been around 0 in recent months due to the economic slowdown. Although RUEHL’s potential is nowhere near that of Hollister or Abercrombie, it should provide revenue growth and reasonable profits in the upcoming quarters. A&F’s brand aimed at 14-18 year olds, abercrombie, had about 18% growth in 2006, with a surprising 11% comparable store increase. With its recent success, ANF has planned 29 more locations for the 2007 year, and more could be in the pipeline due to 6% comparable growth number so far this summer. . Abercrombie & Fitch recently has started looking for international growth options. It currently has 3 stores in Canada, which have performed similarly to traditional American stores, but it is the recently added project store in London that has beaten expectations. Although A&F has not provided figures, the Company has indicated it is highly encouraged by initial figures to explore similar options in this region and other major cities within Japan, Italy, France, Germany, Spain, Denmark and Sweden. Pricing
In order to alleviate some seasonal volatility, Abercrombie & Fitch has eliminated as
much discounting as possible to maintain price premiums and avoid drastic swings in sales. This pricing strategy coincides with its positioning as a “Casual Luxury” retailer. Frequently, specialty retailers will conduct annual sales to reduce inventory and push sales, and customers tend to expect and modify purchasing habits to coincide with these sales. It is these trends that

Abercrombie & Fitch (ANF) 8 August 2007
11
A&F’s discounting policy should moderate. A&F has managed to maintain strong revenue growth, while not succumbing to discounting trends. Corporate Management
Abercrombie & Fitch has a strong management team led by Michael Jefferies. He was
introduced as the CEO in 1992 when the company repositioned itself to focus on young adults, and he has also severed as Chairman of the company since 1998. He has a strong reputation throughout the industry for his ability to develop new brands. Additionally, former Apple Computers executive Michael Kramer has served as Chief Financial Officer since 2005. Earnings
Abercrombie should beat earnings expectations for 2007. Although market analysts have
lowered retail sales expectations across the board, the company has managed to maintain reasonable growth during this period of slow retail growth. However, it will be the previously explained improvement to margins that will provide stronger than expected earnings ($5.35 versus $5.21 consensus estimate for 2007 diluted EPS) as demonstrated by the DCF model in Appendix A. As previously mentioned, second quarter EPS guidance was raised, which will subsequently lead to higher year-end estimates holding all else constant.
Risks Fashion Trends One of the primary concerns within specialty retail is the constantly changing fashion trends. Though Abercrombie has strong brand reputation and several new and growing brands, there is always the risk that ANF brands will fall out of favor with fashion conscience consumers. Comparable same store sales generally are the best gauge for popularity, and A&F has managed to maintain consistently positive same store sales, even during the currently soft retail market. Traditionally, following a period of extremely strong comparable store sales growth, a firm will be unable to maintain high growth numbers. Nevertheless, A&F has managed to keep relatively strong growth figures, especially when compared to its direct competitors. Moreover, ANF has several up and coming brands, where as AEO has all of its growth and success tied into one brand. CEO Michael Jefferies has a reputation throughout the industry for his ability to create new, popular brands, and so these joined factors tend to mitigate the chance of ANF falling out of popular trends.

Abercrombie & Fitch (ANF) 8 August 2007
12
Increase in Comparable Store Sales 2006 2005 Abercrombie & Fitch (brand) -4% 18% abercrombie 10% 54% Hollister 5% 29% RUEHL 14% n/a GAP -7% -5% AEO 12% 16%
Economic Downturn Generally, specialty retailers will be more strongly impacted by poor economic conditions. As previously discussed, this industry is reliant on discretionary spending, which is curtailed during times of poor conditions. Currently, the economy is a period of strong uncertainty due largely to a weak housing market and the current lending hardship. However, generally it is unemployment and interest rates that are the most indicative of specialty retail performance. Currently, unemployment figures remain strong, and there is growing pressure for the FED to lower the federal funds rate to improve the housing market. Although slowed GDP growth tend to discourage retail spending, ANF’s current position leaves it less susceptible to economic cycles when compared to the rest of the sector. Brand Development Michael Jefferies, CEO and Chairman of ANF, has become well known throughout the industry for his ability to create strong, profitable brands. Nevertheless, there is obvious risk that his latest brand, RUEHL will not progress as planned despite encouraging preliminary figures (most notably comparable store sales). Few expect RUEHL to approach the success of A&F and Hollister, but future growth is dependant on some discernable growth from this brand. Additionally, Concept 5 has yet to be unveiled, and so there is obvious risk involved with the long-term potential of this brand. Similarly, ANF is trying to expand internationally after the early success of a pilot store in London. Different cultures obviously have different tastes, and so it is essential that ANF modify not just the fashion but the physical stores to appeal to the regional preferences. Inventory Improvement As previously mentioned, the inventory improvements in progress should have a noticeable effect on the firm. There is however a chance that the results at ANF will not mirror that of Gap, American Eagle, and Nordstrom’s for better or worse. Inventory management is currently a weakness through the company, and if this new perpetual inventory system does not produce results, the inventory situation will continue to hinder the entire company. The similarities between not just the inventory systems but the companies themselves lead one to expect similar results, but it is unclear from this external vantage point if this will be the subsequent result.
Abercrombie & Fitch (ANF) 8 August 2007
13
Over Expansion When investing in new stores, there is always the potential to over invest. Due to the lead time in building new stores, there is always a possibility to invest in a brand that has decreasing sales and popularity. Additionally, firms may stretch to find new locations, which might not be as profitable. In order to guard against these tendencies, ANF has created an objective valuation of possible locations (generally malls), and has only invested in locations with what they consider an A rating. Moreover, there is a clear and discernable pattern between falling comparable store sales and curtailing of new stores for ANF. All the same, there will always be a definite risk of overinvestment since there is no way to seamlessly match downward trending stores with decreasing investment and capital expenditure.
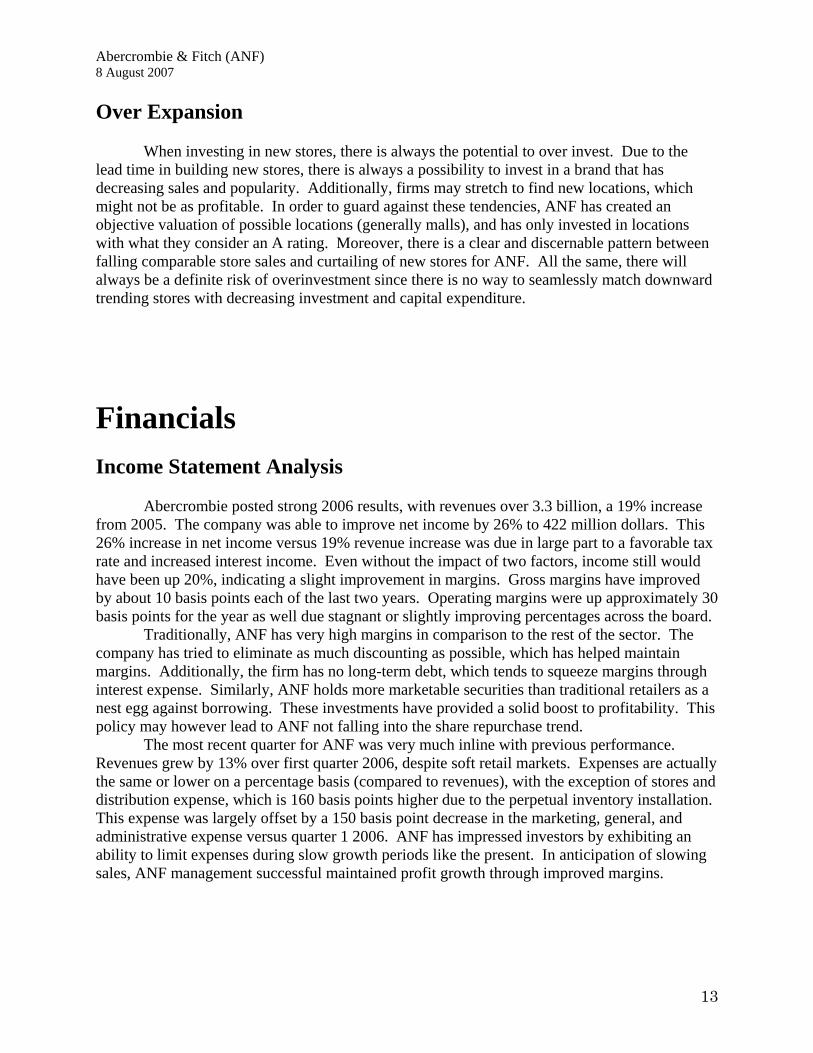
Financials Income Statement Analysis Abercrombie posted strong 2006 results, with revenues over 3.3 billion, a 19% increase from 2005. The company was able to improve net income by 26% to 422 million dollars. This 26% increase in net income versus 19% revenue increase was due in large part to a favorable tax rate and increased interest income. Even without the impact of two factors, income still would have been up 20%, indicating a slight improvement in margins. Gross margins have improved by about 10 basis points each of the last two years. Operating margins were up approximately 30 basis points for the year as well due stagnant or slightly improving percentages across the board. Traditionally, ANF has very high margins in comparison to the rest of the sector. The company has tried to eliminate as much discounting as possible, which has helped maintain margins. Additionally, the firm has no long-term debt, which tends to squeeze margins through interest expense. Similarly, ANF holds more marketable securities than traditional retailers as a nest egg against borrowing. These investments have provided a solid boost to profitability. This policy may however lead to ANF not falling into the share repurchase trend. The most recent quarter for ANF was very much inline with previous performance. Revenues grew by 13% over first quarter 2006, despite soft retail markets. Expenses are actually the same or lower on a percentage basis (compared to revenues), with the exception of stores and distribution expense, which is 160 basis points higher due to the perpetual inventory installation. This expense was largely offset by a 150 basis point decrease in the marketing, general, and administrative expense versus quarter 1 2006. ANF has impressed investors by exhibiting an ability to limit expenses during slow growth periods like the present. In anticipation of slowing sales, ANF management successful maintained profit growth through improved margins.

Abercrombie & Fitch (ANF) 8 August 2007
14
Balance Sheet Analysis Abercrombie’s balance sheet is highly favorable to investors, most notably in the absence of long-term debt. During 2006, ANF managed to grow Cash and Equivalents from 50 to nearly 82 million. The company has an impressive 448 million in marketable securities, a 9% annual increase. The only cause for concern was an 18% increase in inventories. Nevertheless, the company was able to grow current assets much more quickly than current liabilities, resulting in an impressive current ratio of 2.14. Current liabilities were inline with previous figures, with no strong outliers. Finally, ANF was actually able to increase shareholders’ equity by over 40% with 28% of which being attributed to retained earnings growth. Traditionally, ANF’s balance sheet has been a source of investor confidence, and the firm has and will continue that trend. Cash Flow Statement Analysis ANF has customarily relied on its operations as its primary source of cash, generally through income. During times of low investment, the firm tends to hold excess cash in marketable securities, which are sold when income is not sufficient. These figures tend to be the largest and most volatile in the statement, which has been rather stable. In 2004 and 2005, ANF had sizeable stock repurchases, but no stock was repurchased in 2006. Currently, this treasury stock is being used as a form of share-based compensation. DuPont Analysis The DuPont analysis provides a useful model to examine not just operating profits but also the asset and capital structure of the company. For this analysis, marketable securities and their subsequent profits were removed from the data. The rationale behind this was the view that ANF only holds these securities as a short-term alternative to holding cash. These securities are sold whenever funds are needed, and the amount has become slightly exaggerated in recent years in an attempt to avoid any long-term debt. Specifically, in 2004 all of these securities (approximately 464 million) were sold to finance store growth and share repurchases. This 1 year of drastically lower assets skewed the results, and so this analysis is an analysis of the core retail business.
DuPont Analysis 2004 2005 2006Profit Margin (Net Income / Revenues) 10.5% 11.8% 12.5%Total Asset Turnover (Rev. / Avg Total Assets) 1.47 1.46 1.75Return on Investment(PM * TAT) 15.5% 17.3% 21.8% Equity Multiplier (Avg Total Assets / Avg Total Equity) 1.522 1.661 1.324 Return on Equity 23.6% 28.8% 28.9%
The analysis reveals that profit margins, asset turnover, return on investment, and most importantly return on equity is increasing on an annual basis. The 2006 increase in return on

Abercrombie & Fitch (ANF) 8 August 2007
15
investment is especially impressive due to the lower equity multiplier that was the consequence of the previously mentioned strong retained earnings growth of 2006. The chart below contains the return on equity for not just ANF but its closest competitors. In this case, marketable securities were included in order to ensure a like comparison between the firms. The only stock with better return on equity is Aeropostale, which is a relatively new competitor, with considerably lower earnings, but a faster growth rate. In either case, both ROEs are well above the average for specialty retail. ANF GPS AEO ARO Industry Average Return on Equity 33.2% 14.2% 29.5% 38.7% 14.3%
Ratio Analysis When comparing ratios to competitors, ANF is very much inline with their direct competitors but ahead of industry averages in all categories except for margins, where is significantly outperforms averages.. American Eagle, Aeropostale, and Abercrombie all do not rely on long-term debt, though the average specialty retailer has a LT-Debt/Equity of about 14%. The only cause for concern is the poor inventory turnover previously addressed. However, it is reassuring that Gap and American Eagle both have strong inventory turnover, since ANF is after all installing an inventory system that mirrors both GPS and AEO. ARO is not as comparable in this case since it has not progressed as quickly into online and catalogue sales like the other 3 firms, which traditionally makes inventory management drastically more difficult. The high margins at ANF are due to a variety of strategic factors, most notably no price discounting and commitment to being a “casual luxury” clothing provider.
ANF GPS AEO ARO Industry Average Days to Collect 4.8 5.5 3.4 5.6 6.6 Inventory Turnover 2.8 5.3 6.4 8.7 n/a LT-Debt/ Equity 0 3.60% 0 0 14% Pretax Margin 20% 7% 23% 13% 7% Net Profit Margin 13% 5% 14% 7% 4%
Earnings Estimates ANF should beat market earnings estimates for the 2007 year. Although retail sales are down, the market has long since priced in these expectations. 2007 and 2008 sales should be inline with market estimates; it won’t be until international sales expand that estimates may be revisited. The increase in earnings will be due to margin improvement. ANF has been criticized for increasing distribution costs, but this is directly due to the inventory system installation. This increase in expense will only be a short-term effect, and the subsequent quarters should show improvement once the system is fully operational. The market expects an EPS of $5.21 for 2007, but with improving margins and consistent sales, $5.35 EPS seems more likely. For the same reasons, 2008 EPS should exceed estimates by about 19 cents ($6.00 versus $6.21).
Abercrombie & Fitch (ANF) 8 August 2007
16
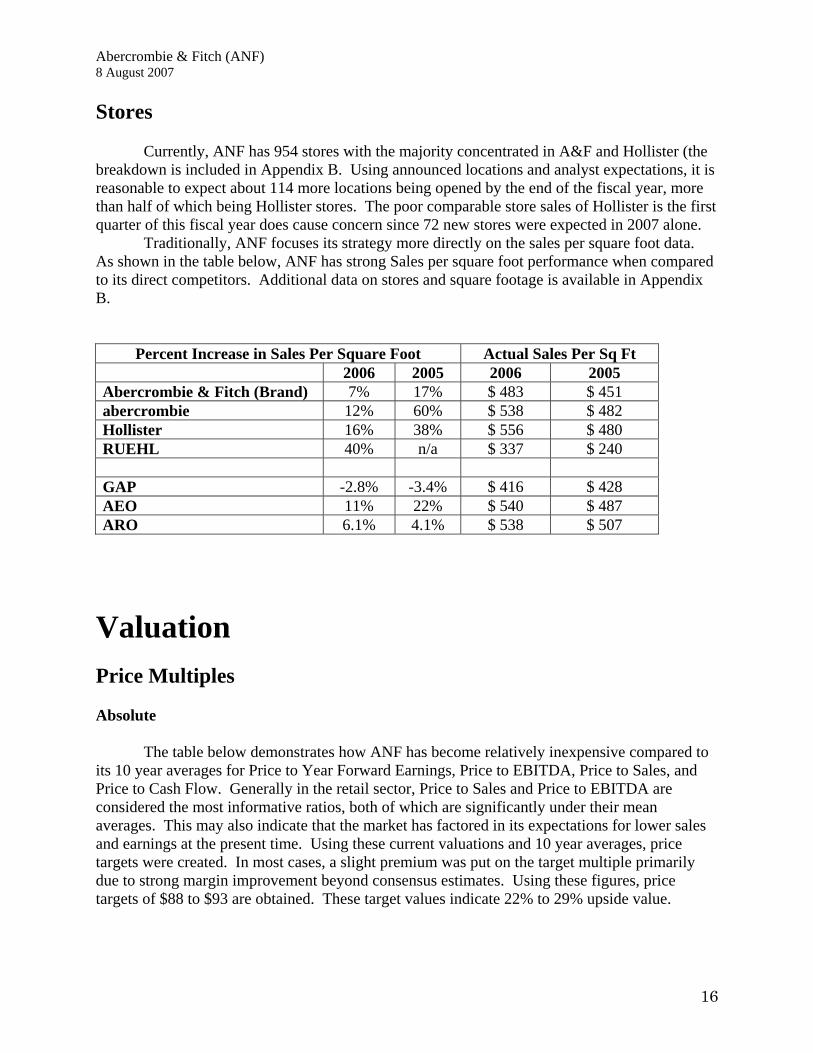
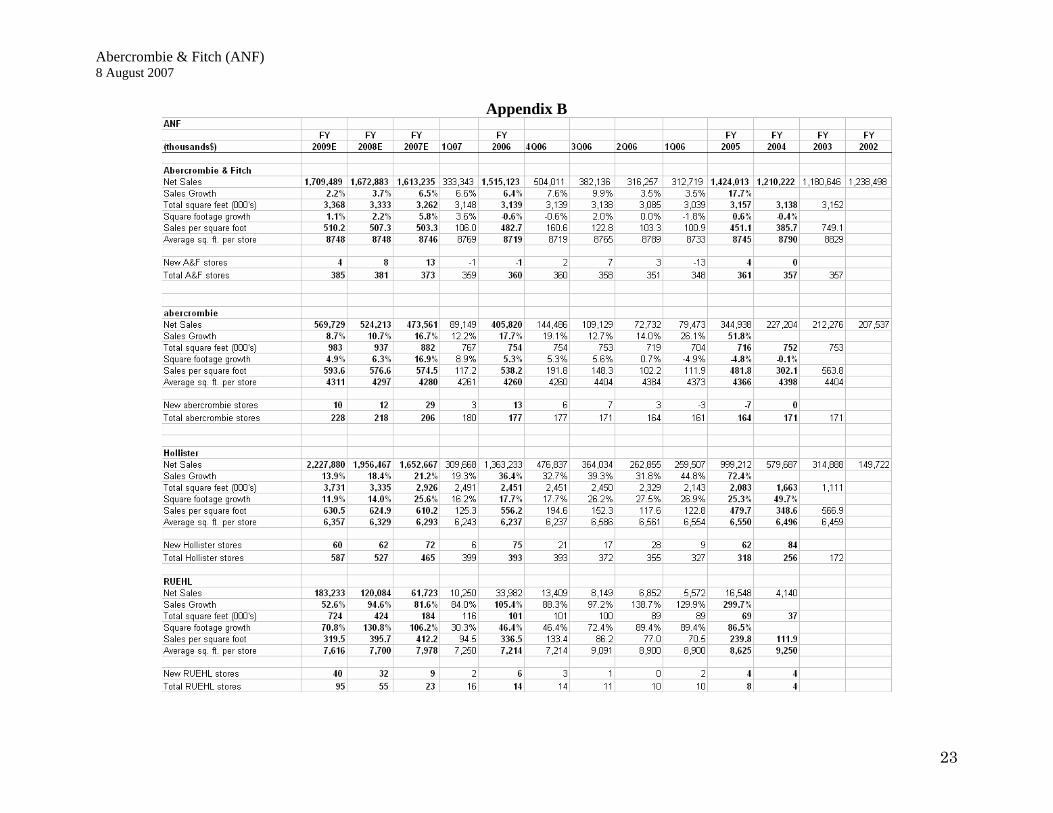
Stores Currently, ANF has 954 stores with the majority concentrated in A&F and Hollister (the breakdown is included in Appendix B. Using announced locations and analyst expectations, it is reasonable to expect about 114 more locations being opened by the end of the fiscal year, more than half of which being Hollister stores. The poor comparable store sales of Hollister is the first quarter of this fiscal year does cause concern since 72 new stores were expected in 2007 alone. Traditionally, ANF focuses its strategy more directly on the sales per square foot data. As shown in the table below, ANF has strong Sales per square foot performance when compared to its direct competitors. Additional data on stores and square footage is available in Appendix B.
Percent Increase in Sales Per Square Foot Actual Sales Per Sq Ft 2006 2005 2006 2005 Abercrombie & Fitch (Brand) 7% 17% $ 483 $ 451 abercrombie 12% 60% $ 538 $ 482 Hollister 16% 38% $ 556 $ 480 RUEHL 40% n/a $ 337 $ 240 GAP -2.8% -3.4% $ 416 $ 428 AEO 11% 22% $ 540 $ 487 ARO 6.1% 4.1% $ 538 $ 507
Valuation Price Multiples Absolute The table below demonstrates how ANF has become relatively inexpensive compared to its 10 year averages for Price to Year Forward Earnings, Price to EBITDA, Price to Sales, and Price to Cash Flow. Generally in the retail sector, Price to Sales and Price to EBITDA are considered the most informative ratios, both of which are significantly under their mean averages. This may also indicate that the market has factored in its expectations for lower sales and earnings at the present time. Using these current valuations and 10 year averages, price targets were created. In most cases, a slight premium was put on the target multiple primarily due to strong margin improvement beyond consensus estimates. Using these figures, price targets of $88 to $93 are obtained. These target values indicate 22% to 29% upside value.

Abercrombie & Fitch (ANF) 8 August 2007
17
Absolute Valuation
High Low Mean Current Target Multiple
Per Share Target
Target Price
P/Forward E 34.5 5.4 14.6 13.3 16.5 5.35 $88.28 P/EBITDA 36 3.2 8.9 8.2 9.2 9.75 $89.70 P/S 6.19 0.85 2.17 1.95 2.25 41.2 $92.70 P/CF 44.4 5.1 13.2 11.9 13.5 6.5 $87.75 Retail & S&P500 Comparison The two tables below exhibit the current valuations relative to the retail sector and S&P 500 on a 10 year basis. Once again, ANF is inexpensive when compared to its peers. ANF’s low Price to Sales ratio is especially surprising considering their historically high margins. As shown below, only American Eagle has comparable margins, which is actually in part a positive since AEO has already experience the margin expansion due to the perpetual inventory system. In either case, it is clear by these measures that ANF is currently inexpensive. Relative to Retail High Low Mean Current P/Forward E 2.04 0.42 .82 .90 P/EBITDA 4.86 .57 1.14 1.04 P/S 10.38 1.83 2.89 2.36 P/CF 3.62 .67 1.19 1.05 Relative to SP500 High Low Mean Current P/Forward E 1.39 .22 .85 .89 P/EBITDA 3.96 .32 1.08 1.05 P/S 2.62 .37 1.34 1.26 P/CF 2.76 .31 1.09 .99
ANF GPS AEO ARO Industry AveragePretax Margin 20% 7% 23% 13% 7% Net Profit Margin 13% 5% 14% 7% 4% DCF Model The best valuation method for Abercrombie & Fitch is the discounted cash flow (DCF) model. The model used is relatively consistent in structure with standard models, and it is included in Appendix A. Using historical performance, segmented and full income sheet performance was projected in detail for 2007 through 2009, and more vaguely through 2017. Though it was done separate of outside sources, consensus sales estimates are very close to these projections. The real discrepancies appear in the assumed effects of the perpetual inventory system. This DCF model reflects improving inventory in terms of a percent of revenue, which is generally not expected. Moreover, this new system will improve margins as previously discussed. Quarter 1 saw an stark increase in the cost of distribution, which most analysts took as a contraction of margins. This was however due largely to the installation of the new

Abercrombie & Fitch (ANF) 8 August 2007
18
inventory system that will in time actually significantly lower distribution costs. Even if the new system does not effect long term margins as expected, this is still a one time installation cost, and the expense should at worst revert to its average. Additionally, ANF gave guidance for CapEx of 395 to 405 million, which was used in the model. Also, ANF suggested a tax rate of 39%, which appears to be slightly high by historical standards and forward looking due to international expansion; however, the value was used since ANF’s guidance is usually quite accurate. Using these assumptions, ANF’s intrinsic value is actually about $96, a 33% improvement from the current $72.22 price (as of August 7, 2007). Even without any improvements due to the inventory system and EPS estimates inline with consensus estimates, ANF still warrants around $88, which is 23% above the current value. Though there is no reason not to expect benefits from the new inventory system, if one chooses to ignore its impact, it is still an undervalued stock with an attractive option (inventory effects) included for free.
Summary
Using the DCF target price of $96 and price multiples target price range of $88 to $93, an overall price target of $94 is established. Given the current price of $72.22, Abercrombie & Fitch is an immediate BUY. A shift in fundamentals, a drastic change in management, exceedingly poor economic conditions beyond current expectations, or a price under $55 for an extended period would justify a reassessment of this price recommendation. Strengths
• New inventory system should improve sales, margins, and inventory turnover • High margins relative to competitors • Solid growth potential between international stores and growing brands • Well positioned as a teen retailer within the specialty retail to withstand economic
downturns • Currently, strong employment figures and low interest rates bode well for upcoming
performance • Outperforms competitors on a pre-tax margin and sales per square foot basis among other
measures • Exhibited ability to lower corporate costs during slow sales periods in order to meet
earnings expectations
Weaknesses • Soft retail sales outlook for upcoming fiscal year • Closely correlated to GDP, which is currently showing slow growth • Financial success is directly related to its ability to be a fashion leader • Poor inventory performance and subsequent reliance on new inventory system to improve
turnover

Appendix A DCF Model with effects of new inventory management system

Abercrombie & Fitch (ANF) 8 August 2007
20
Revenue breakdown by brand

Abercrombie & Fitch (ANF) 8 August 2007
21
Income Statement (with inventory effects)
DCF Model without any effects from new inventory system

Abercrombie & Fitch (ANF) 8 August 2007
22
Abercrombie & Fitch (ANF) 8 August 2007
23
Appendix B