Abercrombie & Fitch Co. FORM 8-K
69
UNITED STATES SECURITIES AND EXCHANGE COMMISSION Washington, D.C. 20549 FORM 8-K CURRENT REPORT Pursuant to Section 13 or 15(d) of the Securities Exchange Act of 1934 Date of Report (Date of earliest event reported): August 26, 2021 Abercrombie & Fitch Co. (Exact name of registrant as specified in its charter) Delaware 1-12107 31-1469076 (State or other jurisdiction of incorporation or organization) (Commission File Number) (I.R.S. Employer Identification No.) 6301 Fitch Path New Albany Ohio 43054 (Address of principal executive offices) (Zip Code) Registrant’s telephone number, including area code: (614) 283-6500 Not Applicable (Former name or former address, if changed since last report) Check the appropriate box below if the Form 8-K filing is intended to simultaneously satisfy the filing obligation of the registrant under any of the following provisions: ☐ Written communications pursuant to Rule 425 under the Securities Act (17 CFR 230.425) ☐ Soliciting material pursuant to Rule 14a-12 under the Exchange Act (17 CFR 240.14a-12) ☐ Pre-commencement communications pursuant to Rule 14d-2(b) under the Exchange Act (17 CFR 240.14d-2(b)) ☐ Pre-commencement communications pursuant to Rule 13e-4(c) under the Exchange Act (17 CFR 240.13e-4(c)) Securities registered pursuant to Section 12(b) of the Act: Title of each class Trading symbol(s) Name of each exchange on which registered Class A Common Stock, $0.01 Par Value ANF New York Stock Exchange Indicate by check mark whether the registrant is an emerging growth company as defined in Rule 405 of the Securities Act of 1933 (§230.405 of this chapter) or Rule 12b-2 of the Securities Exchange Act of 1934 (§240.12b-2 of this chapter). Emerging growth company ☐ If an emerging growth company, indicate by check mark if the registrant has elected not to use the extended transition period for complying with any new or revised financial accounting standards provided pursuant to Section 13(a) of the Exchange Act. ☐
Transcript of Abercrombie & Fitch Co. FORM 8-K

UNITED STATESSECURITIES AND EXCHANGE COMMISSION
Washington, D.C. 20549
FORM 8-KCURRENT REPORT
Pursuant to Section 13 or 15(d) of the Securities Exchange Act of 1934
Date of Report (Date of earliest event reported): August 26, 2021
Abercrombie & Fitch Co.(Exact name of registrant as specified in its charter)
Delaware 1-12107 31-1469076(State or other jurisdiction of incorporation or organization) (Commission File Number) (I.R.S. Employer Identification No.)
6301 Fitch Path New Albany Ohio 43054(Address of principal executive offices) (Zip Code)
Registrant’s telephone number, including area code: (614) 283-6500
Not Applicable
(Former name or former address, if changed since last report)
Check the appropriate box below if the Form 8-K filing is intended to simultaneously satisfy the filing obligation of the registrant under any of the following provisions:
☐ Written communications pursuant to Rule 425 under the Securities Act (17 CFR 230.425) ☐ Soliciting material pursuant to Rule 14a-12 under the Exchange Act (17 CFR 240.14a-12) ☐ Pre-commencement communications pursuant to Rule 14d-2(b) under the Exchange Act (17 CFR 240.14d-2(b)) ☐ Pre-commencement communications pursuant to Rule 13e-4(c) under the Exchange Act (17 CFR 240.13e-4(c))
Securities registered pursuant to Section 12(b) of the Act:
Title of each class Trading symbol(s) Name of each exchange on which registeredClass A Common Stock, $0.01 Par Value ANF New York Stock Exchange
Indicate by check mark whether the registrant is an emerging growth company as defined in Rule 405 of the Securities Act of 1933 (§230.405 of this chapter) or Rule 12b-2 of the Securities Exchange Act of 1934 (§240.12b-2 of this chapter).
Emerging growth company ☐
If an emerging growth company, indicate by check mark if the registrant has elected not to use the extended transition period for complying with any new or revised financial accounting standards provided pursuant to Section 13(a) of the Exchange Act. ☐

Item 2.02. Results of Operations and Financial Condition.
On August 26, 2021, Abercrombie & Fitch Co. (the “Company”) issued a news release (the “Release”) reporting the Company's unaudited financial results for the second quarter ended July 31, 2021. A copy of the Release is includedas Exhibit 99.1 to this Current Report on Form 8-K and is incorporated herein by reference.
In conjunction with the Release, the Company also made available additional unaudited quarterly financial information for the first quarter ended May 1, 2021, the second quarter ended July 31, 2021, and for each of the quarters in thefiscal year ended January 30, 2021. The Company also made available additional unaudited financial information for the fiscal years ended January 30, 2021, February 1, 2020, February 2, 2019 and February 3, 2018. The additionalfinancial information is included as Exhibit 99.2 to this Current Report on Form 8-K and is incorporated herein by reference.
In conjunction with the Release, the Company also made available an investor presentation of results for the second quarter ended July 31, 2021. The presentation, which is available under the “Investors” section of the Company'swebsite, located at corporate.abercrombie.com, is included as Exhibit 99.3 to this Current Report on Form 8-K and is incorporated herein by reference.
The Company's management conducted a conference call on August 26, 2021 to review the Company's financial results for the second quarter ended July 31, 2021. A copy of the transcript of the conference call is included as Exhibit99.4 to this Current Report on Form 8-K and is incorporated herein by reference.
Item 9.01. Financial Statements and Exhibits.
(a) through (c) Not applicable
(d) Exhibits:
The following exhibits are included with this Current Report on Form 8-K:
Exhibit No. Description99.1 News release issued by Abercrombie & Fitch Co. on August 26, 202199.2 Additional unaudited financial information made available by Abercrombie & Fitch Co. on August 26, 202199.3 Investor presentation of results for the first quarter ended July 31, 2021 made available by Abercrombie & Fitch Co. on August 26, 202199.4 Transcript of conference call held by management of Abercrombie & Fitch Co. on August 26, 2021104 Cover Page Interactive Data File (embedded within the Inline XBRL document)

SIGNATURE
Pursuant to the requirements of the Securities Exchange Act of 1934, the registrant has duly caused this report to be signed on its behalf by the undersigned hereunto duly authorized.
Abercrombie & Fitch Co.
Dated: August 27, 2021 By: /s/ Scott LipeskyScott LipeskyExecutive Vice President and Chief Financial Officer

ABERCROMBIE & FITCH CO. REPORTS SECOND QUARTER RESULTS
Reports best second quarter operating income and operating margin since 2008, benefiting from omni-channel sales strength, gross profit rate expansion and expense controls
New Albany, Ohio, August 26, 2021: Abercrombie & Fitch Co. (NYSE: ANF) today announced results for the second quarter ended July 31, 2021. These compare to results for the second quarter ended August 1, 2020. Descriptions ofthe use of non-GAAP financial measures and reconciliations of GAAP and non-GAAP financial measures accompany this release.
Fran Horowitz, Chief Executive Officer, said, “As our customers’ mindset shifted to summer, we continued to deliver on product, voice and experience. Total net sales grew 24% year-over-year, or 3% from 2019. Our largest market, theU.S., had healthy net sales growth of 31% on a one-year and 11% on a two-year basis. As customers returned to stores, digital net sales held steady to last year, and remained highly penetrated, representing 44% of total second quartersales. Our gross profit rate expanded dramatically, rising 450 basis points from last year and 590 basis points from the second quarter of 2019, benefiting from double-digit AUR improvement. Combined with ongoing expensemanagement, we expanded our operating margin by 1130 basis points year-over-year and 1800 basis points on a two-year basis.”
“Momentum has continued quarter-to-date. We have had a strong start to the U.S. back-to-school season. Reception to the Gilly Hicks brand relaunch, associated product, and updated store experiences has been very positive. At ournewest brand, Social Tourist, we are excited about our learnings and results since its launch just three months ago. Looking ahead, we will remain on offense and are confident that the proactive steps we have taken to evolve ouroperating model and cost structure, combined with evolved brand positioning, should continue to yield near and long-term benefits.”
Details related to net income per diluted share for the second quarter are as follows:
2021 2020GAAP $ 1.69 $ 0.09 Excluded items, net of tax effect (0.01) (0.15)Adjusted non-GAAP $ 1.70 $ 0.23 Impact from changes in foreign currency exchange rates — 0.04 Adjusted non-GAAP constant currency $ 1.70 $ 0.27
Excluded items consist of pre-tax store asset impairment charges and the tax effect of pre-tax excluded items.
The estimated impact from foreign currency is calculated by applying current period exchange rates to prior year results using a 26% tax rate.
A summary of results for the second quarter ended July 31, 2021 as compared to the second quarter ended August 1, 2020:• Net sales of $865 million, up 24% as compared to last year and up 3% as compared to pre-COVID 2019 second quarter net sales.• Digital net sales of $376 million decreased 3% as compared to last year and increased 52% as compared to pre-COVID 2019 second quarter digital net sales.• Gross profit rate improved 450 basis points as compared to last year and 590 basis points as compared to 2019 to 65.2% driven by higher average unit retail on lower promotions.• Operating expense, excluding other operating income, net, was up 9% and up 11% as compared to last year on a reported and adjusted non-GAAP basis, respectively, reflecting an increase in payroll and customer-facing expenses
and a decrease in store occupancy. Operating expense as a percentage of sales decreased to 52.1% and 52.0% from 59.0% and 57.8% on a reported and adjusted non-GAAP basis, respectively.• Operating income of $115 million and $116 million on a reported and adjusted non-GAAP basis, respectively, as compared to operating income of $14 million and $22 million last year, on a reported and adjusted non-GAAP basis,
respectively.• Net income per diluted share of $1.69 and $1.70 on a reported and adjusted non-GAAP basis, respectively, which both reflect benefits of $0.53 related to the release of income tax valuation allowances and the impact of a statutory
rate change on the valuation of deferred tax assets, as compared to net income per diluted share last year of $0.09 and $0.23 on a reported and adjusted non-GAAP basis, respectively.
(1)
(2)
(1)
(2)
1

Net Sales
Net sales by brand and region for the second quarter are as follows:
(in thousands) 2021 2020 % ChangeNet sales by brand:Hollister $ 514,483 $ 429,248 20%Abercrombie 350,367 269,080 30%
Total company $ 864,850 $ 698,328 24%
Net sales by region: 2021 2020 % ChangeUnited States $ 601,767 $ 458,671 31%
EMEA 190,840 171,297 11%APAC 41,228 41,814 (1)%Other 31,015 26,546 17%
International $ 263,083 $ 239,657 10%
Total company $ 864,850 $ 698,328 24%
Hollister includes the Hollister, Gilly Hicks and Social Tourist brands.
Abercrombie includes the Abercrombie & Fitch and abercrombie kids brands.
Financial Position and Liquidity
As of July 31, 2021 the company had:• Cash and equivalents of $0.9 billion. This compares to cash and equivalents of $1.1 billion and $0.8 billion as of January 30, 2021 and August 1, 2020, respectively.• Inventories of $416 million, down 8% as compared to August 1, 2020.• Long-term gross borrowings under the company’s senior secured notes of $308 million (the “Senior Secured Notes”) which mature in July 2025 and bear interest at a rate of 8.75% per annum.• Borrowing available under the senior-secured asset-based revolving credit facility (the “ABL Facility”) of $249 million.• Liquidity, comprised of cash and equivalents and borrowing available under the ABL Facility, of approximately $1.2 billion. This compares to liquidity of $1.3 billion and $1.1 billion as of January 30, 2021 and August 1, 2020,
respectively.
Cash Flow and Capital Allocation
Details related to the company’s cash flows for the year-to-date period ended July 31, 2021 are as follows:• Net cash provided by operating activities of $50 million.• Net cash used for investing activities of $35 million. The company expects capital expenditures for fiscal 2021 to be approximately $100 million as compared to $102 million of capital expenditures in fiscal 2020.• Net cash used for financing activities of $200 million.
The company repurchased approximately 2.4 million shares during the second quarter and, at the end of the second quarter, had the authority to repurchase approximately 6.5 million shares as a part of the A&F Board of Directors’previously approved February 2021 share repurchase authorization. The company has returned $135 million to shareholders during the year-to-date period ended July 31, 2021 through share repurchases. The timing and amount ofrepurchases will depend on various factors, including market and business conditions. In addition, during the second quarter, the company spent $47 million to purchase $42.3 million at par value of its senior secured notes at a premiumof $4.7 million.
During the first quarter of fiscal 2021, the company finalized an agreement with and paid its landlord partner to settle all remaining obligations related to the SoHo Hollister flagship store in New York City, which closed during the secondquarter of fiscal 2019. Prior to this new agreement, the company was required to make payments in aggregate of $80 million pursuant to the lease agreements through fiscal 2028. The new agreement resulted in an acceleration ofpayments and provided for a discount resulting in a cash outflow of $64 million during the first quarter to settle all remaining obligations. This strategic use of excess cash reduced the company’s operating lease liabilities by $65 millionand eliminated future interest expense related to this obligation.
Depreciation and amortization was $72 million for the year-to-date period ended July 31, 2021.
(1)
(2)
(1)
(2)
2
Conference Call
Today at 8:30 AM, ET, the company will conduct a conference call. To listen to the conference call, dial (800) 458-4121 or go to corporate.abercrombie.com. The international call-in number is (323) 794-2093. This call will be recorded andmade available by dialing the replay number (888) 203-1112 or the international number (719) 457-0820 followed by the conference ID number 3919672 or through corporate.abercrombie.com. A presentation of second quarter results willbe available in the “Investors” section at corporate.abercrombie.com at approximately 7:30 AM, ET, today.
Safe Harbor Statement Under the Private Securities Litigation Reform Act of 1995
A&F cautions that any forward-looking statements (as such term is defined in the Private Securities Litigation Reform Act of 1995) contained in this Press Release or made by management or spokespeople of A&F involve risks anduncertainties and are subject to change based on various important factors, many of which may be beyond the company’s control. Words such as “estimate,” “project,” “plan,” “believe,” “expect,” “anticipate,” “intend,” “should,” “areconfident,” and similar expressions may identify forward-looking statements. Except as may be required by applicable law, we undertake no obligation to publicly update or revise any forward-looking statements. The following factors, inaddition to those disclosed in “ITEM 1A. RISK FACTORS” of A&F’s Annual Report on Form 10-K for the fiscal year ended January 30, 2021, in some cases have affected, and in the future could affect, A&F’s financial performance andcould cause actual results for fiscal 2021 and beyond to differ materially from those expressed or implied in any of the forward-looking statements included in this Press Release or otherwise made by management: COVID‐19 has andmay continue to materially adversely impact and cause disruption to our business; changes in global economic and financial conditions, and the resulting impact on consumer confidence and consumer spending, as well as other changesin consumer discretionary spending habits could have a material adverse impact on our business; failure to engage our customers, anticipate customer demand and changing fashion trends, and manage our inventory commensuratelycould have a material adverse impact on our business; our failure to operate effectively in a highly competitive and constantly evolving industry could have a material adverse impact on our business; fluctuations in foreign currencyexchange rates could have a material adverse impact on our business; our ability to attract customers to our stores depends, in part, on the success of the shopping malls or area attractions that our stores are located in or around; theimpact of war, acts of terrorism, mass casualty events, social unrest, civil disturbance or disobedience could have a material adverse impact on our business; the impact of extreme weather, infectious disease outbreaks, including COVID-19, and other unexpected events could result in an interruption to our business, as well as to the operations of our third-party partners, and have a material adverse impact on our business; failure to successfully develop an omnichannelshopping experience, a significant component of our growth strategy, or failure to successfully invest in customer, digital and omnichannel initiatives could have a material adverse impact on our business; our failure to optimize our globalstore network could have a material adverse impact on our business; our failure to execute our international growth strategy successfully and inability to conduct business in international markets as a result of legal, tax, regulatory,political and economic risks could have a material adverse impact on our business; our failure to appropriately address emerging environmental, social and governance matters could have a material adverse impact on our reputation and,as a result, our business; failure to protect our reputation could have a material adverse impact on our business; if our information technology systems are disrupted or cease to operate effectively, it could have a material adverse impacton our business; we may be exposed to risks and costs associated with cyber-attacks, data protection, credit card fraud and identity theft that could have a material adverse impact on our business; our reliance on our distribution centersmakes us susceptible to disruptions or adverse conditions affecting our supply chain; changes in the cost, availability and quality of raw materials, labor, transportation, and trade relations could have a material adverse impact on ourbusiness; we depend upon independent third parties for the manufacture and delivery of all our merchandise, and a disruption of the manufacture or delivery of our merchandise could have a material adverse impact on our business; werely on the experience and skills of our executive officers and associates, and the failure to attract or retain this talent, effectively manage succession, and establish a diverse workforce could have a material adverse impact on ourbusiness; we identified a material weakness in our internal control over financial reporting and may identify additional material weaknesses in the future. If we fail to remediate our material weaknesses, or if we fail to establish andmaintain effective internal control over financial reporting, our ability to accurately and timely report our financial results could be adversely affected; fluctuations in our tax obligations and effective tax rate may result in volatility in ourresults of operations could have a material adverse impact on our business; our litigation exposure, or any securities litigation and shareholder activism, could have a material adverse impact on our business; failure to adequately protectour trademarks could have a negative impact on our brand image and limit our ability to penetrate new markets which could have a material adverse impact on our business; changes in the regulatory or compliance landscape could havea material adverse impact on our business; and the agreements related to our senior secured asset-based revolving credit facility and our senior secured notes include restrictive covenants that limit our flexibility in operating our businessand our inability to obtain credit on reasonable terms in the future could have an adverse impact on our business.
About Abercrombie & Fitch Co.
Abercrombie & Fitch Co. (NYSE: ANF) is a leading, global specialty retailer of apparel and accessories for men, women and kids through five renowned brands. The iconic Abercrombie & Fitch brand was born in 1892 and aims to makeevery day feel as exceptional as the start of a long weekend. abercrombie kids sees the world through kids’ eyes, where play is life and every day is an opportunity to be anything and better anything. The Hollister brand believes inliberating the spirit of an endless summer
3

inside everyone and making teens feel celebrated and comfortable in their own skin. Gilly Hicks, offering intimates, loungewear and sleepwear, is designed to give all Gen Z customers their daily dose of happy. Social Tourist, the creativevision of Hollister and social media personalities, Dixie and Charli D’Amelio, offers trend forward apparel that allows teens to experiment with their style, while exploring the duality of who they are both on social media and in real life.
The brands share a commitment to offering products of enduring quality and exceptional comfort that allow consumers around the world to express their own individuality and style. The company operates over 730 stores under thesebrands across North America, Europe, Asia and the Middle East, as well as the e-commerce sites www.abercrombie.com, abercrombiekids.com, www.hollisterco.com, www.gillyhicks.com, and www.socialtourist.com.
Investor Contact: Media Contact:
Pamela Quintiliano Mackenzie GusweilerAbercrombie & Fitch Co. Abercrombie & Fitch Co.(614) 283-6751 (614) [email protected] [email protected]
4

Abercrombie & Fitch Co.Condensed Consolidated Statements of Operations
(in thousands, except per share data)(Unaudited)
Thirteen Weeks Ended Thirteen Weeks Ended
July 31, 2021% of
Net Sales August 1, 2020% of
Net SalesNet sales $ 864,850 100.0 % $ 698,328 100.0 %Cost of sales, exclusive of depreciation and amortization 301,365 34.8 % 274,720 39.3 %Gross profit 563,485 65.2 % 423,608 60.7 %Stores and distribution expense 325,935 37.7 % 310,370 44.4 %Marketing, general and administrative expense 123,913 14.3 % 97,252 13.9 %Flagship store exit benefits (88) 0.0 % (3,884) (0.6)%Asset impairment, exclusive of flagship store exit charges 786 0.1 % 8,083 1.2 %Other operating income, net (1,848) (0.2)% (2,356) (0.3)%Operating income 114,787 13.3 % 14,143 2.0 %Interest expense, net 11,275 1.3 % 7,098 1.0 %Income before income taxes 103,512 12.0 % 7,045 1.0 %Income tax (benefit) expense (6,944) (0.8)% 1,253 0.2 %Net income 110,456 12.8 % 5,792 0.8 %Less: Net income attributable to noncontrolling interests 1,956 0.2 % 328 0.0 %
Net income attributable to Abercrombie & Fitch Co. $ 108,500 12.5 % $ 5,464 0.8 %
Net income per share attributable to Abercrombie & Fitch Co.:Basic $ 1.77 $ 0.09 Diluted $ 1.69 $ 0.09
Weighted-average shares outstanding:Basic 61,428 62,527 Diluted 64,136 63,286
5

Abercrombie & Fitch Co.Condensed Consolidated Statements of Operations
(in thousands, except per share data)(Unaudited)
Twenty-six Weeks Ended Twenty-six Weeks Ended
July 31, 2021% of
Net Sales August 1, 2020% of
Net SalesNet sales $ 1,646,255 100.0 % $ 1,183,687 100.0 %Cost of sales, exclusive of depreciation and amortization 587,636 35.7 % 495,934 41.9 %Gross profit 1,058,619 64.3 % 687,753 58.1 %Stores and distribution expense 642,543 39.0 % 632,494 53.4 %Marketing, general and administrative expense 244,860 14.9 % 205,509 17.4 %Flagship store exit benefits (1,188) (0.1)% (4,427) (0.4)%Asset impairment, exclusive of flagship store exit charges 3,450 0.2 % 51,011 4.3 %Other operating income, net (3,266) (0.2)% (1,850) (0.2)%Operating income (loss) 172,220 10.5 % (194,984) (16.5)%Interest expense, net 19,881 1.2 % 10,469 0.9 %Income (loss) before income taxes 152,339 9.3 % (205,453) (17.4)%Income tax (benefit) expense (823) 0.0 % 32,786 2.8 %Net income (loss) 153,162 9.3 % (238,239) (20.1)%Less: Net income attributable to noncontrolling interests 2,894 0.2 % 445 0.0 %
Net income (loss) attributable to Abercrombie & Fitch Co. $ 150,268 9.1 % $ (238,684) (20.2)%
Net income (loss) per share attributable to Abercrombie & Fitch Co.:Basic $ 2.43 $ (3.82)Diluted $ 2.32 $ (3.82)
Weighted-average shares outstanding:Basic 61,914 62,543 Diluted 64,803 62,543
6

Reporting and Use of GAAP and Non-GAAP MeasuresThe company believes that each of the non-GAAP financial measures presented are useful to investors as they provide a measure of the company’s operating performance excluding the effect of certain items which the company believesdo not reflect its future operating outlook, such as asset impairment charges primarily attributable to the COVID-19 pandemic or related to the company’s flagship stores, therefore supplementing investors’ understanding of comparabilityof operations across periods. Management used these non-GAAP financial measures during the periods presented to assess the company’s performance and to develop expectations for future operating performance. Non-GAAPfinancial measures should be used supplemental to, and not as an alternative to, the company’s GAAP financial results, and may not be calculated in the same manner as similar measures presented by other companies.
In addition, at times the company provides comparable sales, defined as the percentage year-over-year change in the aggregate of: (1) sales for stores that have been open as the same brand at least one year and whose square footagehas not been expanded or reduced by more than 20% within the past year, with prior year’s net sales converted at the current year’s foreign currency exchange rate to remove the impact of foreign currency rate fluctuation, and (2) digitalnet sales with prior year’s net sales converted at the current year’s foreign currency exchange rate to remove the impact of foreign currency rate fluctuation. In light of store closures related to COVID-19, the Company has not disclosedcomparable sales for Fiscal 2021.
The company also provides certain financial information on a constant currency basis to enhance investors’ understanding of underlying business trends and operating performance, by removing the impact of foreign currency exchangerate fluctuations. The effect from foreign currency, calculated on a constant currency basis, is determined by applying current year average exchange rates to prior year results and is net of the year-over-year impact from hedging. The perdiluted share effect from foreign currency is calculated using a 26% tax rate.
Abercrombie & Fitch Co.Schedule of Non-GAAP Financial Measures
Thirteen Weeks Ended July 31, 2021(in thousands, except per share data)
(Unaudited)
GAAP Excluded itemsAdjusted
non-GAAPAsset impairment, exclusive of flagship store exit charges $ 786 $ 786 $ — Operating income 114,787 (786) 115,573 Income before income taxes 103,512 (786) 104,298 Income tax benefit (6,944) (224) (6,720)Net income attributable to Abercrombie & Fitch Co. $ 108,500 $ (562) $ 109,062
Net income per diluted share attributable to Abercrombie & Fitch Co. $ 1.69 $ (0.01) $ 1.70 Diluted weighted-average shares outstanding: 64,136 64,136
“GAAP” refers to accounting principles generally accepted in the United States of America.
Excluded items consist of pre-tax store asset impairment charges of $0.8 million.
The tax effect of excluded items is the difference between the tax provision calculated on a GAAP basis and an adjusted non-GAAP basis.
(1)
(2)
(3)
(1)
(2)
(3)
7

Abercrombie & Fitch Co.Schedule of Non-GAAP Financial Measures
Thirteen Weeks Ended August 1, 2020(in thousands, except per share data)
(Unaudited)
GAAP Excluded itemsAdjusted
non-GAAPset impairment, exclusive of flagship store exit charges $ 8,083 $ 8,083 $ — erating income 14,143 (8,083) 22,226 ome before income taxes 7,045 (8,083) 15,128 ome tax expense 1,253 1,166 87 t income attributable to Abercrombie & Fitch Co. $ 5,464 $ (9,249)$ 14,713
t income per diluted share attributable to Abercrombie & Fitch Co. $ 0.09 $ (0.15)$ 0.23 uted weighted-average shares outstanding: 63,286 63,286
“GAAP” refers to accounting principles generally accepted in the United States of America.Excluded items consist of pre-tax store asset impairment charges of $8.1 million, which are principally the result of the impact of COVID-19 on store cash flows.The tax effect of excluded items is the difference between the tax provision calculated on a GAAP basis and an adjusted non-GAAP basis.
(1)
(2)
(3)
(1)
(2)
(3)
8

Abercrombie & Fitch Co.Schedule of Non-GAAP Financial Measures
Twenty-six Weeks Ended July 31, 2021(in thousands, except per share data)
(Unaudited)
GAAP Excluded itemsAdjusted
non-GAAPAsset impairment, exclusive of flagship store exit charges $ 3,450 $ 3,450 $ — Operating income 172,220 (3,450) 175,670 Income before income taxes 152,339 (3,450) 155,789 Income tax benefit (823) (673) (150)Net income attributable to Abercrombie & Fitch Co. $ 150,268 $ (2,777) $ 153,045
Net income per diluted share attributable to Abercrombie & Fitch Co. $ 2.32 $ (0.04) $ 2.36 Diluted weighted-average shares outstanding: 64,803 64,803
“GAAP” refers to accounting principles generally accepted in the United States of America.
Excluded items consist of pre-tax store asset impairment charges of $3.5 million.
The tax effect of excluded items is the difference between the tax provision calculated on a GAAP basis and an adjusted non-GAAP basis.
(1)
(2)
(3)
(1)
(2)
(3)
9

Abercrombie & Fitch Co.Schedule of Non-GAAP Financial Measures
Twenty-six Weeks Ended August 1, 2020(in thousands, except per share data)
(Unaudited)
GAAP Excluded itemsAdjusted
non-GAAPset impairment, exclusive of flagship store exit charges $ 51,011 $ 51,011 $ — erating loss (194,984) (51,011) (143,973)ss before income taxes (205,453) (51,011) (154,442)ome tax expense 32,786 (3,266) 36,052 t loss attributable to Abercrombie & Fitch Co. $ (238,684)$ (47,745)$ (190,939)
t loss per diluted share attributable to Abercrombie & Fitch Co. $ (3.82)$ (0.76)$ (3.05)uted weighted-average shares outstanding: 62,543 62,543
“GAAP” refers to accounting principles generally accepted in the United States of America.Excluded items consist of pre-tax store asset impairment charges of $51.0 million, which are principally the result of the impact of COVID-19 on store cash flows.The tax effect of excluded items is the difference between the tax provision calculated on a GAAP basis and an adjusted non-GAAP basis.
(1)
(2)
(3)
(1)
(2)
(3)
10

Abercrombie & Fitch Co.Reconciliation of Constant Currency Financial Measures
Thirteen Weeks Ended July 31, 2021(in thousands, except percentage and basis point changes and per share data)
(Unaudited)
2021 2020 % ChangeNet sales
GAAP $ 864,850 $ 698,328 24%Impact from changes in foreign currency exchange rates — 16,706 (2)%Net sales on a constant currency basis $ 864,850 $ 715,034 21%
Gross profit 2021 2020 BPS Change GAAP $ 563,485 $ 423,608 450Impact from changes in foreign currency exchange rates — 12,178 (20)Gross profit on a constant currency basis $ 563,485 $ 435,786 430
Operating income 2021 2020 BPS Change GAAP $ 114,787 $ 14,143 1,130Excluded items (786) (8,083) 110Adjusted non-GAAP $ 115,573 $ 22,226 1,020Impact from changes in foreign currency exchange rates — 3,418 (40)Adjusted non-GAAP constant currency basis $ 115,573 $ 25,644 980
Net income per diluted share attributable to Abercrombie & Fitch Co. 2021 2020 $ ChangeGAAP $ 1.69 $ 0.09 $1.60Excluded items, net of tax (0.01) (0.15) 0.14Adjusted non-GAAP $ 1.70 $ 0.23 $1.47Impact from changes in foreign currency exchange rates — 0.04 (0.04)Adjusted non-GAAP constant currency basis $ 1.70 $ 0.27 $1.43
“GAAP” refers to accounting principles generally accepted in the United States of America.
The estimated impact from foreign currency is determined by applying current period exchange rates to prior year results and is net of the year-over-year impact from hedging. The per diluted share estimated impact from foreign currency is calculated using a 26% tax rate.
The estimated basis point change has been rounded based on the percentage change.
Excluded items consist of pre-tax store asset impairment charges of $0.8 million and $8.1 million for the current year and prior year, respectively.
(1)
(2)
(3)
(1)
(2)
(3)
(1)
(4)
(2)
(1)
(4)
(2)
(1)
(2)
(3)
(4)
11

Abercrombie & Fitch Co.Condensed Consolidated Balance Sheets
(in thousands)(Unaudited)
July 31, 2021 January 30, 2021 August 1, 2020AssetsCurrent assets:
Cash and equivalents $ 921,504 $ 1,104,862 $ 766,721 Receivables 87,151 83,857 88,323 Inventories 415,604 404,053 453,239 Other current assets 77,392 68,857 75,160
Total current assets 1,501,651 1,661,629 1,383,443 Property and equipment, net 532,795 550,587 635,703 Operating lease right-of-use assets 791,036 893,989 1,073,464 Other assets 229,911 208,697 216,204
Total assets $ 3,055,393 $ 3,314,902 $ 3,308,814
Liabilities and stockholders’ equityCurrent liabilities:
Accounts payable $ 289,475 $ 289,396 $ 284,221 Accrued expenses 351,991 396,365 351,849 Short-term portion of operating lease liabilities 219,453 248,846 278,495 Income taxes payable 26,260 24,792 6,425
Total current liabilities 887,179 959,399 920,990 Long-term liabilities:
Long-term portion of operating lease liabilities $ 791,793 $ 957,588 $ 1,122,853 Long-term borrowings, net 303,015 343,910 343,250 Other liabilities 106,473 104,693 108,111
Total long-term liabilities 1,201,281 1,406,191 1,574,214 Total Abercrombie & Fitch Co. stockholders’ equity 956,566 936,628 805,681
Noncontrolling interests 10,367 12,684 7,929 Total stockholders’ equity 966,933 949,312 813,610
Total liabilities and stockholders’ equity $ 3,055,393 $ 3,314,902 $ 3,308,814
12

Abercrombie & Fitch Co.Condensed Consolidated Statements of Cash Flows
(in thousands, except per share data)(Unaudited)
Twenty-six Weeks Ended July 31, 2021 August 1, 2020Operating activitiesNet cash provided by operating activities $ 49,945 $ 46,233
Investing activitiesPurchases of property and equipment $ (35,269) $ (75,621)Withdrawal of funds from Rabbi Trust assets — 50,000
Net cash used for investing activities $ (35,269) $ (25,621)
Financing activitiesProceeds from issuance of senior secured notes — 350,000 Proceeds from borrowings under the asset-based senior secured credit facility — 210,000 Repayment of term loan facility borrowings — (233,250)Repayment of borrowings under the asset-based senior secured credit facility — (210,000)Purchase of senior secured notes (46,969) — Payment of debt issuance or modification costs and fees (1,837) (6,558)Purchases of common stock (135,249) (15,172)Dividends paid — (12,556)Other financing activities (16,192) (11,135)
Net cash (used for) provided by financing activities $ (200,247) $ 71,329
Effect of foreign currency exchange rates on cash $ (2,547) $ 1,785 Net (decrease) increase in cash and equivalents, and restricted cash and equivalents $ (188,118) $ 93,726 Cash and equivalents, and restricted cash and equivalents, beginning of period $ 1,124,157 $ 692,264
Cash and equivalents, and restricted cash and equivalents, end of period $ 936,039 $ 785,990
As disclosed in the Form 10-K for the year ended January 30, 2021, during the fourth quarter ended January 30, 2021, an error relating to the cash flow presentation of the $50 million withdrawal of the excess funds from the company’s Rabbi Trust assets was identified. The cashflows presented for the year-to-date periods ended May 2, 2020, August 1, 2020, and October 31, 2020 incorrectly classified such withdrawal as a cash inflow from operating activities, rather than a cash inflow from investing activities. This cash flow statement reflects the correctclassification.
(1)
(1)
13

Abercrombie & Fitch Co.Store Count
Thirteen Weeks Ended July 31, 2021Hollister Abercrombie Total Company
United States International United States International United States International TotalMay 1, 2021 349 150 184 48 533 198 731New 6 3 4 1 10 4 14Permanently closed — (3) (9) — (9) (3) (12)
July 31, 2021 355 150 179 49 534 199 733
Twenty-Six Weeks Ended July 31, 2021Hollister Abercrombie Total Company
United States International United States International United States International TotalJanuary 30, 2021 347 150 190 48 537 198 735New 8 4 4 2 12 6 18Permanently closed — (4) (15) (1) (15) (5) (20)
July 31, 2021 355 150 179 49 534 199 733
Hollister includes the company’s Hollister and Gilly Hicks brands. Locations with Gilly Hicks carveouts within Hollister stores are represented as a single store count. Excludes 10 international franchise stores as of each of July 31, 2021 and May 1, 2021, and 9 internationalfranchise stores as of January 30, 2021. Excludes 14 Company-operated temporary stores as of July 31, 2021 and 12 Company-operated temporary stores as of each of May 1, 2021, and January 30, 2021.
Abercrombie includes the company's Abercrombie & Fitch and abercrombie kids brands. Locations with abercrombie kids carveouts within Abercrombie & Fitch stores are represented as a single store count. Excludes 12 international franchise stores as of each of July 31, 2021and May 1, 2021, and 10 international franchise stores as of January 30, 2021. Excludes four Company-operated temporary stores as of each of July 31, 2021 and May 1, 2021, and two Company-operated temporary stores as of January 30, 2021.
This store count excludes one international third-party operated multi-brand outlet store as of each of July 31, 2021, May 1, 2021, and January 30, 2021.
(1) (2) (3)
(1) (2) (3)
(1)
(2)
(3)
14

Abercrombie & Fitch Co.Financial Information
(Unaudited)(in thousands, except per share data, store data, and comparable sales data)
Fiscal 2020 Fiscal 20212017 2018 2019 Q1 Q2 Q3 Q4 2020 Q1 Q2 2021
Net sales $ 3,492,690 $ 3,590,109 $ 3,623,073 $ 485,359 $ 698,328 $ 819,653 $ 1,122,044 $ 3,125,384 $ 781,405 $ 864,850 $ 1,646,255
Cost of sales, exclusive of depreciation and amortization 1,408,848 1,430,193 1,472,155 221,214 274,720 295,220 443,025 1,234,179 286,271 301,365 587,636
Gross profit 2,083,842 2,159,916 2,150,918 264,145 423,608 524,433 679,019 1,891,205 495,134 563,485 1,058,619
Stores and distribution expense 1,540,032 1,536,216 1,551,243 322,124 310,370 346,263 412,827 1,391,584 316,608 325,935 642,543
Marketing, general and administrative expense 471,914 484,863 464,615 108,257 97,252 121,000 137,334 463,843 120,947 123,913 244,860
Flagship store exit charges (benefits) 2,393 5,806 47,257 (543) (3,884) (8,063) 854 (11,636) (1,100) (88) (1,188)
Asset impairment, exclusive of flagship store exit charges 14,391 11,580 19,135 42,928 8,083 6,329 15,597 72,937 2,664 786 3,450
Other operating (income) loss, net (16,938) (5,915) (1,400) 506 (2,356) 288 (3,492) (5,054) (1,418) (1,848) (3,266)
Operating income (loss) 72,050 127,366 70,068 (209,127) 14,143 58,616 115,899 (20,469) 57,433 114,787 172,220
Interest expense, net 16,889 10,999 7,737 3,371 7,098 8,808 8,997 28,274 8,606 11,275 19,881
Income (loss) before income taxes 55,161 116,367 62,331 (212,498) 7,045 49,808 106,902 (48,743) 48,827 103,512 152,339
Income tax expense (benefit) 44,636 37,559 17,371 31,533 1,253 5,779 21,646 60,211 6,121 (6,944) (823)
Net income (loss) 10,525 78,808 44,960 (244,031) 5,792 44,029 85,256 (108,954) 42,706 110,456 153,162
Less: Net income attributable to noncontrolling interests 3,431 4,267 5,602 117 328 1,758 2,864 5,067 938 1,956 2,894
Net income (loss) attributable to Abercrombie & Fitch Co. $ 7,094 $ 74,541 $ 39,358 $ (244,148) $ 5,464 $ 42,271 $ 82,392 $ (114,021) $ 41,768 $ 108,500 $ 150,268
Fiscal 2020 Fiscal 20212017 2018 2019 Q1 Q2 Q3 Q4 2020 Q1 Q2 2021
Net income (loss) per share attributable to Abercrombie & FitchCo.: Basic $ 0.10 $ 1.11 $ 0.61 $ (3.90) $ 0.09 $ 0.68 $ 1.32 $ (1.82) $ 0.67 $ 1.77 $ 2.43 Diluted $ 0.10 $ 1.08 $ 0.60 $ (3.90) $ 0.09 $ 0.66 $ 1.27 $ (1.82) $ 0.64 $ 1.69 $ 2.32
Weighted-average shares outstanding: Basic 68,391 67,350 64,428 62,541 62,527 62,558 62,581 62,551 62,380 61,428 61,914 Diluted 69,403 69,137 65,778 62,541 63,286 63,877 64,788 62,551 65,305 64,136 64,803
Hollister comparable sales 8 % 5 % (1)% Not provided Not provided Not provided Not provided Not provided Not provided Not provided Not provided
Abercrombie comparable sales (2)% 1 % 3 % Not provided Not provided Not provided Not provided Not provided Not provided Not provided Not provided
Comparable sales 3 % 3 % 1 % Not provided Not provided Not provided Not provided Not provided Not provided Not provided Not provided
Shares outstanding 68,195 66,227 62,786 62,284 62,365 62,384 62,399 62,399 61,935 59,692 59,692
Number of stores - end of period 868 861 857 853 854 853 735 735 731 733 733
Gross square feet - end of period 6,710 6,566 6,314 6,285 6,296 6,235 5,232 5,232 5,189 5,150 5,150
Fiscal 2017 was a fifty-three week year.Comparable sales are calculated on a constant currency basis and exclude revenue other than store and online sales. The Company did not provide comparable sales results for fiscal 2020 or the first quarter of 2021 due to widespread temporary store closures as a result of COVID-19.Hollister includes the Company's Hollister, Gilly Hicks, and Social Tourist brands.Abercrombie includes the Company's Abercrombie & Fitch and abercrombie kids brands.
(1)
(1)
(2) (3)
(2) (4)
(2)
(1)
(2)
(3)
(4)
1

INVESTOR PRESENTATION: SECOND QUARTER 2021

2 SAFE HARBOR STATEMENT UNDER THE PRIVATE SECURITIES LITIGATION REFORM ACT OF 1995 A&F cautions that any forward-looking statements (as such term is defined in the Private Securities Litigation Reform Act of 1995) contained in this presentation or made by management or spokespeople of A&F involve risks and uncertainties and are subject to change based on various important factors, many of which may be beyond the company's control. Words such as "estimate," "project," "plan," "believe," "expect," "anticipate," "intend," "should," "are confident," and similar expressions may identify forward-looking statements. Except as may be required by applicable law, we assume no obligation to publicly update or revise our forward-looking statements. Risks and uncertainties related to the duration and impact of the COVID-19 pandemic on the Company and the factors disclosed in "ITEM 1A. RISK FACTORS" of A&F's Annual Report on Form 10-K for the fiscal year ended January 30, 2021, in some cases have affected, and in the future could affect, the company's financial performance and could cause actual results for the 2021 fiscal year and beyond to differ materially from those expressed or implied in any of the forward-looking statements included in this presentation or otherwise made by management. OTHER INFORMATION The following presentation includes certain adjusted non-GAAP financial measures. Additional details about non-GAAP financial measures and a reconciliation of GAAP financial measures to non-GAAP financial measures is included in the news release issued by the company on August 26, 2021 which is available in the "Investors" section of the company's website, located at corporate.abercrombie.com. As used in the presentation, "GAAP" refers to accounting principles generally accepted in the United States of America. As used in the presentation, "Hollister" refers to the company's Hollister, Gilly Hicks, and Social Tourist brands and "Abercrombie" refers to the company's Abercrombie & Fitch and abercrombie kids brands. Sub-totals and totals may not foot due to rounding. Net income (loss) and net income (loss) per share financial measures inc
3 TABLE OF CONTENTS Safe Harbor and Other Information 2 Company Overview 4 Focus Areas 7 Digital Evolution 13 Global Store Network Optimization 15 Q2 2021 Results 18 Financial Position, Liquidity & Capital Allocation 24 Appendix 30

4 COMPANY OVERVIEW

5 GILLY HICKS Hollister also carries an intimates brand, Gilly Hicks. At Gilly Hicks, we know everyone has their own unique happy place. We exist to help you find yours. Gilly Hicks is an underwear, activewear and loungewear brand designed to give all Gen Z customers their daily dose of happy. SOCIAL TOURIST Social Tourist is the creative vision of Hollister, the teen brand liberating the spirit of an endless summer, and social media personalities Dixie and Charli D’Amelio. The lifestyle brand creates trend forward apparel that allows teens to experiment with their style, while exploring the duality of who they are both on social media and in real life. HOLLISTER The quintessential apparel brand of the global teen consumer, Hollister Co. believes in liberating the spirit of an endless summer inside everyone. At Hollister, summer isn’t just a season, it’s a state of mind. Hollister creates carefree style designed to make all teens feel celebrated and comfortable in their own skin, so they can live in a summer mindset all year long, whatever the season. ABERCROMBIE & FITCH Abercrombie & Fitch believes that every day should feel as exceptional as the start of the long weekend. Since 1892, the brand has been a specialty retailer of quality apparel, outerwear and fragrance - designed to inspire our global customers to feel confident, be comfortable and face their Fierce. ABERCROMBIE KIDS A global specialty retailer of quality, comfortable, made-to-play favorites, abercrombie kids sees the world through kids’ eyes, where play is life and every day is an opportunity to be anything and better everything. COMPANY OVERVIEW OUR FIVE GLOBAL BRANDS

6 COMPANY-OPERATED RETAIL STORES COMPANY OVERVIEW GLOBAL, DIGITALLY-LED OMNICHANNEL RETAILER THE COMPANY'S PRODUCTS ARE SOLD GLOBALLY, PRIMARILY THROUGH ITS COMPANY-OWNED DIGITAL AND STORE CHANNELS, AS WELL AS THROUGH VARIOUS THIRD-PARTY ARRANGEMENTS 23 CAPABILITY TO SHIP TO OVER 110 COUNTRIES INTERNATIONAL THIRD-PARTY OPERATED STORES GLOBAL BRANDS WHOLESALE PARTNERSHIPS, PRIMARILY INTERNATIONAL COUNTRIES WITH SHIP- FROM-STORE & 10 WITH PURCHASE-ONLINE-PICK- UP-IN-STORE CAPABILITIES OF FISCAL 2020 NET SALES WERE DERIVED INTERNATIONALLY 12 8 110 OF FISCAL 2020 NET SALES WERE DERIVED DIGITALLY Information provided on this slide is as of July 31, 2021 unless otherwise specified. 733 54% 32% 5

7 FOCUS AREAS

8 OPTIMIZING OUR GLOBAL STORE NETWORK • Rightsizing store fleet and adapting to the evolving role of the store as customers' shopping preferences shift ENHANCING DIGITAL AND OMNICHANNEL CAPABILITIES • Creating best-in-class customer experiences while growing profitably across channels INCREASING THE SPEED AND EFFICIENCY OF OUR CONCEPT-TO-CUSTOMER PRODUCT LIFE CYCLE • Investing in capabilities to position supply chain for greater speed, agility and flexibility • Utilizing data and analytics to offer the right product at the right time and the right price IMPROVING OUR CUSTOMER ENGAGEMENT THROUGH OUR LOYALTY PROGRAMS AND MARKETING OPTIMIZATION • Leveraging data, including our loyalty programs, to engage with customers across channels • Driving more efficient and effective marketing spend THE FOLLOWING TRANSFORMATION INITIATIVES HAVE CREATED THE FOUNDATION TO ALLOW US TO QUICKLY RESPOND TO COVID-19 AND FOCUS ON LONG-TERM SUSTAINABLE GROWTH: 1 2 3 4 FOCUS AREAS OUR PREVIOUSLY-STATED TRANSFORMATION INITIATIVES
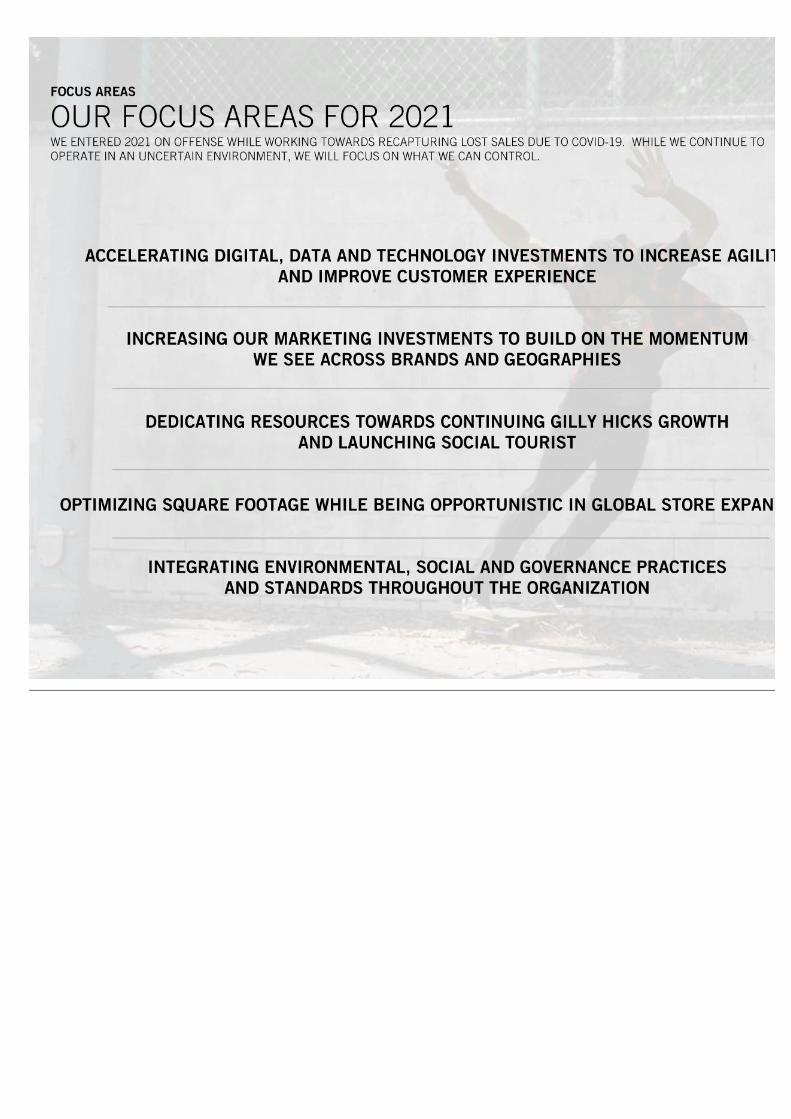
9 ACCELERATING DIGITAL, DATA AND TECHNOLOGY INVESTMENTS TO INCREASE AGILITY AND IMPROVE CUSTOMER EXPERIENCE INCREASING OUR MARKETING INVESTMENTS TO BUILD ON THE MOMENTUM WE SEE ACROSS BRANDS AND GEOGRAPHIES DEDICATING RESOURCES TOWARDS CONTINUING GILLY HICKS GROWTH AND LAUNCHING SOCIAL TOURIST OPTIMIZING SQUARE FOOTAGE WHILE BEING OPPORTUNISTIC IN GLOBAL STORE EXPANSION INTEGRATING ENVIRONMENTAL, SOCIAL AND GOVERNANCE PRACTICES AND STANDARDS THROUGHOUT THE ORGANIZATION FOCUS AREAS OUR FOCUS AREAS FOR 2021 WE ENTERED 2021 ON OFFENSE WHILE WORKING TOWARDS RECAPTURING LOST SALES DUE TO COVID-19. WHILE WE CONTINUE TO OPERATE IN AN UNCERTAIN ENVIRONMENT, WE WILL FOCUS ON WHAT WE CAN CONTROL.

10 FOCUS AREAS GILLY HICKS BRAND EVOLUTION THE COMPANY RECENTLY ANNOUNCED STEPS IN ITS GROWTH STRATEGY INCLUDING A NEW MORE GENDER-INCLUSIVE ASSORTMENT EXPANDED PRODUCT ASSORTMENT, A NEW STORE PROTOTYPE AND DIGITAL EXPERIENCE, AND A REIMAGINED BRAND PURPOSE ANNOUNCED: July 15, 2021 BRAND PURPOSE: Giving Gen Z their daily dose of happy NEW MORE GENDER-INCLUSIVE PRODUCT ASSORTMENT: Underwear, loungewear and activewear in patterns and colors that match everyone's styles, regardless of gender identity STAND ALONE STORE CONCEPT: Gilly Hicks store opened at Easton Town Center in Columbus, Ohio AVAILABLE AT: Hollister stores globally and online at www.gillyhicks.com

11 FOCUS AREAS CUSTOMER REACTION TO GILLY HICKS RELAUNCH HAS BEEN POSITIVE During Q2 2021, the company opened the first Gilly Hicks standalone store concept at Easton Town Center in Columbus, OH and introduced updated side-by-side with Hollister store experiences, including 20 refreshes to existing side-by-side formats and 3 new locations, all of which incorporate elements from the standalone stores. STANDALONE STORE, EASTON TOWN CENTER UPDATED STORE EXPERIENCES: RHEIN CENTER, DE; SHOPPING CITY SUD, AT; PROMENADE, CA

12 FOCUS AREAS HOW WE ARE NAVIGATING COVID-19 FOCUSING ON THE WELL-BEING OF ASSOCIATES AND CUSTOMERS Implemented a range of health and safety measures with the well-being of the Company’s customers, associates and business partners in mind, including but not limited to ensuring all stores follow local mandates relating to face coverings, social distancing, cleaning measures, reduced operating hours and/or temporary closures OPTIMIZING DIGITAL OPERATIONS • Following recommended cleaning and distancing measures in the company's distribution centers to continue digital operations and mitigate shipping delays • Focusing on a seamless digital checkout experience for customers • Continuing to offer Purchase-Online-Pickup-in-Store, including curbside pickup at a majority of U.S. locations. • Working cross-functionally and utilizing Ship-from-Store capabilities to best leverage in-store inventory • Offered flexible return dates as stores reopened and extended our return policy to cover the period of store closures CONSERVATIVELY MANAGING CASH FLOWS IN THE NEAR-TERM GIVEN CONTINUED GLOBAL UNCERTAINTY AND TEMPORARY STORE CLOSURES • Partnering with merchandise and non-merchandise vendors in regards to payment terms • Reevaluating budgeted expenses to better align operating costs with expected sales • Tightly managing inventories • Continuing suspension of the company's dividend program • Assessing government policy and economic stimulus responses to COVID-19

13 DIGITAL EVOLUTION

14 DIGITAL EVOLUTION INVESTMENTS TO SUPPORT TRANSFORMATION TO A DIGITALLY-LED GLOBAL OMNI-CHANNEL RETAILER * In fiscal 2020, the company was impacted by the COVID-19 pandemic and experienced widespread temporary store closures, while the company’s digital operations continued to serve the customers during this unprecedented period. INVESTMENTS IN DIGITAL AND OMNICHANNEL CAPABILITIES OF $150M+ FISCAL 2017 - FISCAL 2020 FISCAL 2017 Digital sales penetration of 28%, <$1.0B FISCAL 2020* Digital sales penetration of 54%, $1.7B+ EXPECTED DIGITAL AND OMNICHANNEL INVESTMENTS FOR THE YEAR OF $50M+ FISCAL 2021

15 GLOBAL STORE NETWORK OPTIMIZATION
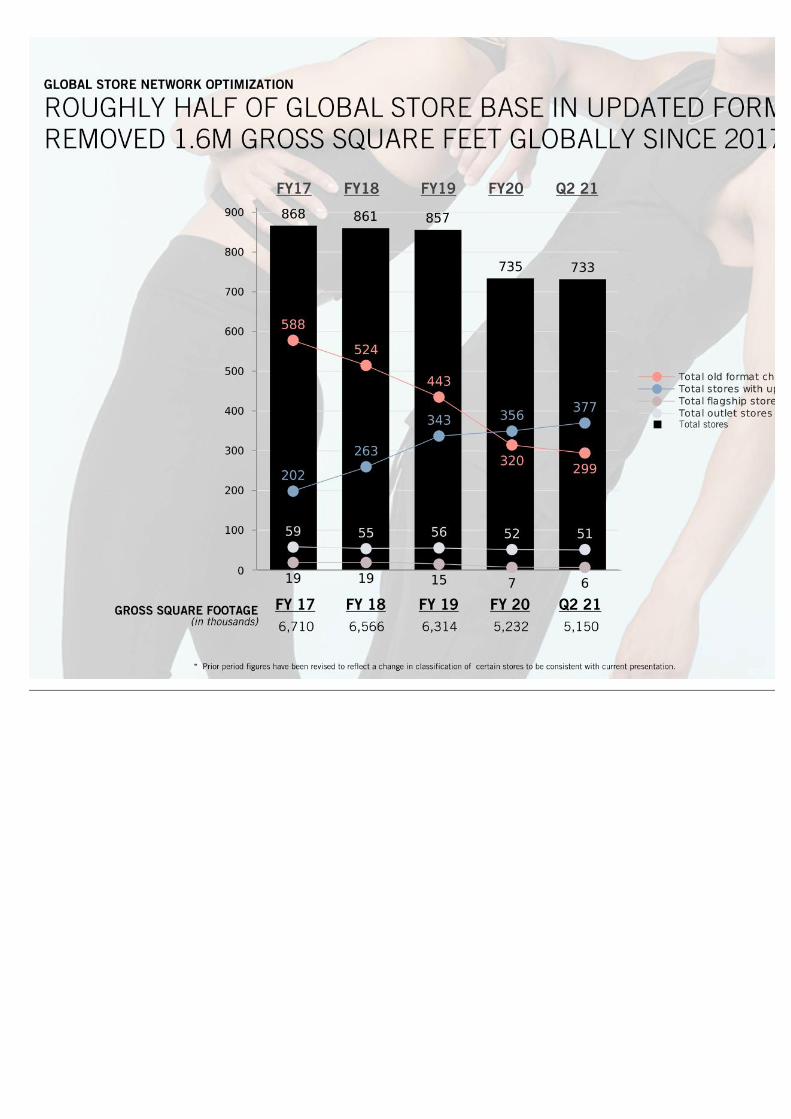
16 Total stores FY17 FY18 FY19 FY20 Q2 21 * Prior period figures have been revised to reflect a change in classification of certain stores to be consistent with current presentation. GROSS SQUARE FOOTAGE (in thousands) FY 17 FY 18 FY 19 FY 20 Q2 21 6,710 6,566 6,314 5,232 5,150 GLOBAL STORE NETWORK OPTIMIZATION ROUGHLY HALF OF GLOBAL STORE BASE IN UPDATED FORMATS; REMOVED 1.6M GROSS SQUARE FEET GLOBALLY SINCE 2017

17* Mall rating based on Green Street Advisors as of March 2021. YTD STORE OPTIMIZATION ACTIVITY Q2 2021 STORE FLEET DETAIL HOLLISTER ABERCROMBIE TOTAL COMPANY # OF STORES % OF FLEET # OF STORES % OF FLEET # OF STORES % OF FLEET LEGACY STORES 193 38% 106 46% 299 41% UPDATED FORMATS 299 59% 78 34% 377 51% OUTLETS 12 2% 39 17% 51 7% FLAGSHIPS 1 —% 5 2% 6 1% TOTAL 505 100% 228 100% 733 100% HOLLISTER ABERCROMBIE TOTAL NEW STORES 12 6 18 REMODELS 1 — 1 RIGHT-SIZES 2 3 5 NEW EXPERIENCES 15 9 24 PERMANENT CLOSURES (4) (16) (20) GLOBAL STORE NETWORK OPTIMIZATION 90% OF U.S. STORES LOCATED IN A/B MALLS; CONTINUE TO REPOSITION GLOBAL FLEET FLAGSHIP STORE CLOSURES/ LEASE EXPIRATIONS (1) (1) Includes the A&F Singapore location, which closed in the first quarter of 2021, as well as the A&F 5th Avenue, New York City and A&F Hamburg, Germany locations. (2) Includes the A&F Amsterdam, Netherlands and the A&F Shanghai, China locations. (3) Includes the Hollister 5th Avenue, New York City and the A&F Ginza, Japan locations. (2) Q2 2021 U.S. STORE FLEET * A MALL B MALL C MALL FLAGSHIPS TOTAL # OF STORES 237 246 49 2 534 % OF U.S. FLEET 44% 46% 9% —% 100% (3)

18 Q2 2021 RESULTS

19 “As our customers’ mindset shifted to summer, we continued to deliver on product, voice and experience. Total net sales grew 24% year-over-year, or 3% from 2019. Our largest market, the U.S., had healthy net sales growth of 31% on a one-year and 11% on a two-year basis. As customers returned to stores, digital net sales held steady to last year, and remained highly penetrated, representing 44% of total second quarter sales. Our gross profit rate expanded dramatically, rising 450 basis points from last year and 590 basis points from the second quarter of 2019, benefiting from double-digit AUR improvement. Combined with ongoing expense management, we expanded our operating margin by 1130 basis points year-over-year and 1800 basis points on a two-year basis.” “Momentum has continued quarter-to-date. We have had a strong start to the U.S. back-to-school season. Reception to the Gilly Hicks brand relaunch, associated product, and updated store experiences has been very positive. At our newest brand, Social Tourist, we are excited about our learnings and results since its launch just three months ago. Looking ahead, we will remain on offense and are confident that the proactive steps we have taken to evolve our operating model and cost structure, combined with evolved brand positioning, should continue to yield near and long-term benefits.” FRAN HOROWITZ, CHIEF EXECUTIVE OFFICER Q2 2021 RESULTS CEO COMMENTARY
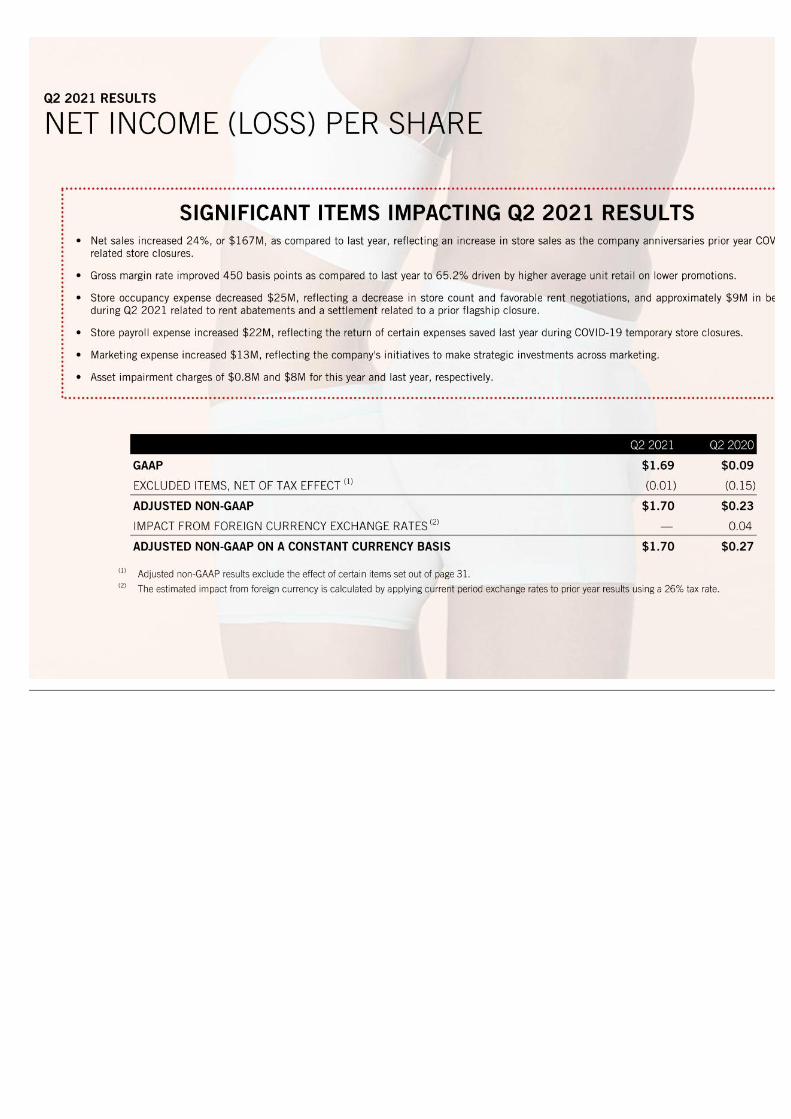
20 SIGNIFICANT ITEMS IMPACTING Q2 2021 RESULTS • Net sales increased 24%, or $167M, as compared to last year, reflecting an increase in store sales as the company anniversaries prior year COVID-19 related store closures. • Gross margin rate improved 450 basis points as compared to last year to 65.2% driven by higher average unit retail on lower promotions. • Store occupancy expense decreased $25M, reflecting a decrease in store count and favorable rent negotiations, and approximately $9M in benefits during Q2 2021 related to rent abatements and a settlement related to a prior flagship closure. • Store payroll expense increased $22M, reflecting the return of certain expenses saved last year during COVID-19 temporary store closures. • Marketing expense increased $13M, reflecting the company's initiatives to make strategic investments across marketing. • Asset impairment charges of $0.8M and $8M for this year and last year, respectively. (1) Adjusted non-GAAP results exclude the effect of certain items set out of page 31. (2) The estimated impact from foreign currency is calculated by applying current period exchange rates to prior year results using a 26% tax rate. Q2 2021 Q2 2020 GAAP $1.69 $0.09 EXCLUDED ITEMS, NET OF TAX EFFECT (1) (0.01) (0.15) ADJUSTED NON-GAAP $1.70 $0.23 IMPACT FROM FOREIGN CURRENCY EXCHANGE RATES (2) — 0.04 ADJUSTED NON-GAAP ON A CONSTANT CURRENCY BASIS $1.70 $0.27 Q2 2021 RESULTS NET INCOME (LOSS) PER SHARE

21 TOTAL COMPANY NET SALES UP 24% AND 3% COMPARED TO Q2 2020 AND Q2 2019, RESPECTIVELY, TO $865M DIGITAL SALES DOWN 3% AND UP 52% TO LAST YEAR AND 2019, RESPECTIVELY, RESULTING IN Q2 2021 DIGITAL SALES OF $376M, OR 44% OF TOTAL NET SALES ABERCROMBIE $350M UP 30% TO LAST YEAR 40.5% OF TOTAL NET SALES HOLLISTER $514M UP 20% TO LAST YEAR 59.5% OF TOTAL NET SALES EMEA $191M UP 11% TO LAST YEAR 22.1% OF TOTAL NET SALES UNITED STATES $602M UP 31% TO LAST YEAR 69.6% OF TOTAL NET SALES APAC $41M DOWN 1% TO LAST YEAR 4.8% OF TOTAL NET SALES OTHER $31M UP 17% TO LAST YEAR 3.6% OF TOTAL NET SALES Q2 2021 RESULTS NET SALES
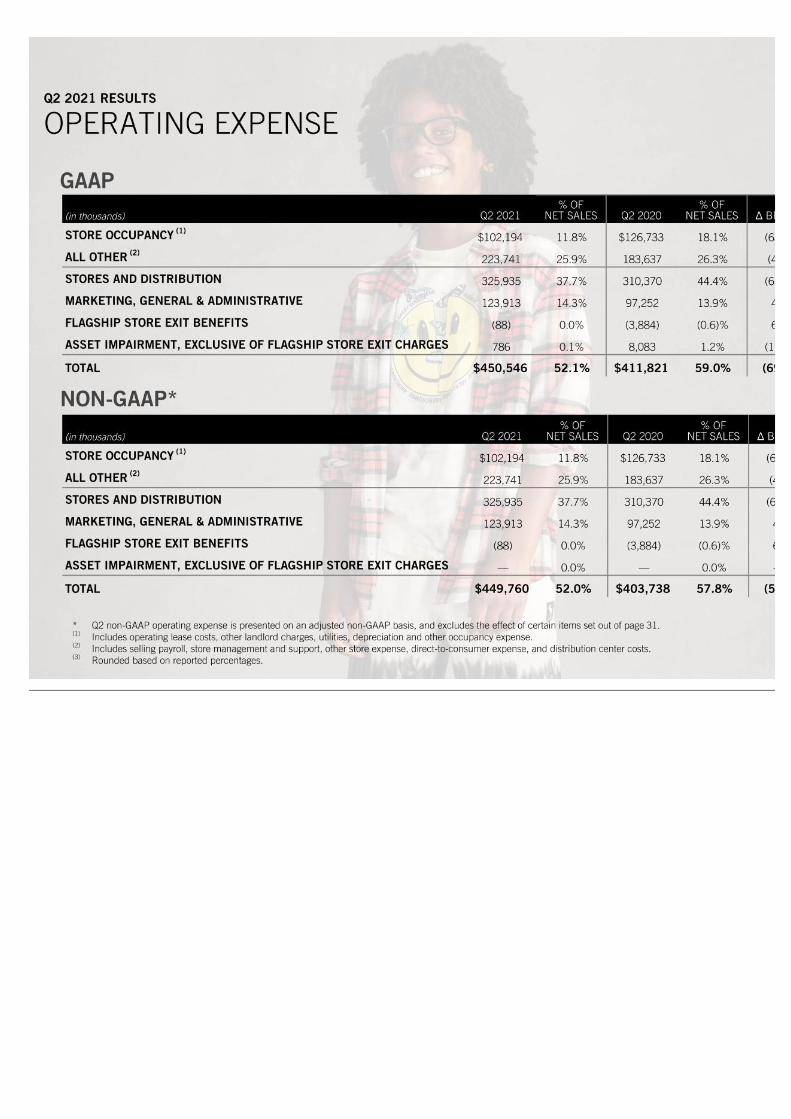
22 GAAP NON-GAAP* * Q2 non-GAAP operating expense is presented on an adjusted non-GAAP basis, and excludes the effect of certain items set out of page 31. (1) Includes operating lease costs, other landlord charges, utilities, depreciation and other occupancy expense. (2) Includes selling payroll, store management and support, other store expense, direct-to-consumer expense, and distribution center costs. (3) Rounded based on reported percentages. (in thousands) Q2 2021 % OF NET SALES Q2 2020 % OF NET SALES Δ BPS (3) STORE OCCUPANCY (1) $102,194 11.8% $126,733 18.1% (630) ALL OTHER (2) 223,741 25.9% 183,637 26.3% (40) STORES AND DISTRIBUTION 325,935 37.7% 310,370 44.4% (670) MARKETING, GENERAL & ADMINISTRATIVE 123,913 14.3% 97,252 13.9% 40 FLAGSHIP STORE EXIT BENEFITS (88) 0.0% (3,884) (0.6)% 60 ASSET IMPAIRMENT, EXCLUSIVE OF FLAGSHIP STORE EXIT CHARGES 786 0.1% 8,083 1.2% (110) TOTAL $450,546 52.1% $411,821 59.0% (690) (in thousands) Q2 2021 % OF NET SALES Q2 2020 % OF NET SALES Δ BPS (3) STORE OCCUPANCY (1) $102,194 11.8% $126,733 18.1% (630) ALL OTHER (2) 223,741 25.9% 183,637 26.3% (40) STORES AND DISTRIBUTION 325,935 37.7% 310,370 44.4% (670) MARKETING, GENERAL & ADMINISTRATIVE 123,913 14.3% 97,252 13.9% 40 FLAGSHIP STORE EXIT BENEFITS (88) 0.0% (3,884) (0.6)% 60 ASSET IMPAIRMENT, EXCLUSIVE OF FLAGSHIP STORE EXIT CHARGES — 0.0% — 0.0% — TOTAL $449,760 52.0% $403,738 57.8% (580) Q2 2021 RESULTS OPERATING EXPENSE

23 (1) Gross profit is derived from cost of sales, exclusive of depreciation and amortization. GAAP (in thousands) Q2 2021 % OF NET SALES Q2 2020 % OF NET SALES Q2 2019 % OF NET SALES NET SALES $864,850 100.0% $698,328 100.0% $841,078 100.0% GROSS PROFIT (1) 563,485 65.2% 423,608 60.7% 498,633 59.3% OPERATING EXPENSE 450,546 52.1% 411,821 59.0% 537,750 63.9% OTHER OPERATING (INCOME) LOSS, NET (1,848) (0.2)% (2,356) (0.3)% 367 0.0% OPERATING INCOME (LOSS) 114,787 13.3% 14,143 2.0% (39,484) (4.7)% INTEREST EXPENSE, NET 11,275 1.3% 7,098 1.0% 1,370 0.2% INCOME (LOSS) BEFORE INCOME TAXES 103,512 12.0% 7,045 1.0% (40,854) (4.9)% INCOME TAX (BENEFIT) EXPENSE (6,944) (0.8)% 1,253 0.2% (11,330) (1.3)% NET INCOME (LOSS) $108,500 12.5% $5,464 0.8% $(31,142) (3.7)% NET INCOME (LOSS) PER SHARE BASIC $1.77 $0.09 $(0.48) DILUTED $1.69 $0.09 $(0.48) WEIGHTED-AVERAGE SHARES BASIC 61,428 62,527 65,156 DILUTED 64,136 63,286 65,156 Q2 2021 RESULTS INCOME STATEMENT

24 FINANCIAL POSITION, LIQUIDITY & CAPITAL ALLOCATION

25 CASH & EQUIVALENTS $922M AS COMPARED TO $767M LAST YEAR SHORT-TERM BORROWINGS NO BORROWINGS OUTSTANDING UNDER ABL FACILITY $249M OF BORROWING AVAILABLE UNDER ABL FACILITY AS OF JULY 31, 2021 GROSS LONG-TERM BORROWINGS $308M OUTSTANDING AS COMPARED TO $350M LAST YEAR INVENTORIES $416M DOWN 8% FROM LAST YEAR * Liquidity is comprised of cash and equivalents and borrowing available under the ABL Facility. FINANCIAL POSITION, LIQUIDITY & CAPITAL ALLOCATION FINANCIAL POSITION AND LIQUIDITY SUMMARY

26 (in thousands) NET CASH PROVIDED BY OPERATING ACTIVITIES CAPITAL EXPENDITURES FREE CASH FLOW (1) FY 2016 $185,169 $140,844 $44,325 FY 2017 $287,658 $107,001 $180,657 FY 2018 $352,933 $152,393 $200,540 FY 2019 $300,685 $202,784 $97,901 FY 2020 $404,918 $101,910 $303,008 (1) Free cash flow is a non-GAAP measure and is computed by subtracting capital expenditures from net cash provided by operating activities, both of which are disclosed in the table above, preceding the measure of free cash flow. YEAR TO DATE PERIOD ENDED (in thousands) JULY 31, 2021 AUGUST 1, 2020 NET CASH PROVIDED BY OPERATING ACTIVITIES $49,945 $46,233 NET CASH USED FOR INVESTING ACTIVITIES $(35,269) $(25,621) NET CASH (USED FOR) PROVIDED BY FINANCING ACTIVITIES $(200,247) $71,329 FINANCIAL POSITION, LIQUIDITY & CAPITAL ALLOCATION CASH FLOW SUMMARY

27 SHARE REPURCHASES (in thousands, except for average cost) NUMBER OF SHARES COST AVERAGE COST DIVIDENDS TOTAL FY 2016 — $— $— $54,066 $54,066 FY 2017 — $— $— $54,392 $54,392 FY 2018 2,932 $68,670 $23.42 $53,714 $122,384 FY 2019 3,957 $63,542 $16.06 $51,510 $115,052 FY 2020 1,397 $15,172 $10.86 $12,556 $27,728 YTD 2021 3,451 $135,249 $39.19 $— $135,249 In order to preserve liquidity and increase financial flexibility in light of COVID-19, during fiscal 2020 the company suspended its share repurchase and dividend programs. The Company has since resumed share repurchase activity. At the end of Q2 2021, the Company had approximately 6.5 million shares remaining available for purchase under its publicly announced February 2021 stock repurchase authorization. (in thousands) FY 2016 FY 2017 FY 2018 FY 2019 FY 2020 Q2 2021 ENDING SHARES OUTSTANDING 67,758 68,195 66,227 62,786 62,399 59,692 FINANCIAL POSITION, LIQUIDITY & CAPITAL ALLOCATION SHARE REPURCHASES AND DIVIDENDS

28 (in thousands) JULY 31, 2021 JANUARY 30, 2021 AUGUST 1, 2020 CASH AND EQUIVALENTS $921,504 $1,104,862 $766,721 RECEIVABLES 87,151 83,857 88,323 INVENTORIES 415,604 404,053 453,239 OTHER CURRENT ASSETS 77,392 68,857 75,160 TOTAL CURRENT ASSETS $1,501,651 $1,661,629 $1,383,443 PROPERTY AND EQUIPMENT, NET 532,795 550,587 635,703 OPERATING LEASE RIGHT-OF-USE ASSETS 791,036 893,989 1,073,464 OTHER ASSETS 229,911 208,697 216,204 TOTAL ASSETS $3,055,393 $3,314,902 $3,308,814 ACCOUNTS PAYABLE $289,475 $289,396 $284,221 ACCRUED EXPENSES 351,991 396,365 351,849 SHORT-TERM PORTION OF OPERATING LEASE LIABILITIES 219,453 248,846 278,495 INCOME TAXES PAYABLE 26,260 24,792 6,425 TOTAL CURRENT LIABILITIES $887,179 $959,399 $920,990 LONG-TERM PORTION OF OPERATING LEASE LIABILITIES 791,793 957,588 1,122,853 LONG-TERM BORROWINGS, NET 303,015 343,910 343,250 OTHER LIABILITIES 106,473 104,693 108,111 TOTAL LONG-TERM LIABILITIES $1,201,281 $1,406,191 $1,574,214 TOTAL ABERCROMBIE & FITCH CO. STOCKHOLDERS EQUITY 956,566 936,628 805,681 NONCONTROLLING INTEREST 10,367 12,684 7,929 TOTAL STOCKHOLDERS' EQUITY $966,933 $949,312 $813,610 TOTAL LIABILITIES AND STOCKHOLDERS' EQUITY $3,055,393 $3,314,902 $3,308,814 FINANCIAL POSITION, LIQUIDITY & CAPITAL ALLOCATION BALANCE SHEET

29 YEAR TO DATE PERIOD ENDED (in thousands) JULY 31, 2021 AUGUST 1, 2020 NET CASH PROVIDED BY OPERATING ACTIVITIES $49,945 $46,233 PURCHASES OF PROPERTY AND EQUIPMENT (35,269) (75,621) WITHDRAWAL OF FUNDS FROM RABBI TRUST ASSETS — 50,000 NET CASH USED FOR INVESTING ACTIVITIES $(35,269) $(25,621) PROCEEDS FROM ISSUANCE OF SENIOR SECURED NOTES — 350,000 PURCHASE OF SENIOR SECURED NOTES (46,969) — PROCEEDS FROM BORROWINGS UNDER THE ABL FACILITY — 210,000 REPAYMENT OF TERM LOAN FACILITY BORROWINGS — (233,250) REPAYMENT OF ABL FACILITY BORROWINGS — (210,000) PAYMENT OF DEBT ISSUANCE OR MODIFICATION COSTS AND FEES (1,837) (6,558) PURCHASES OF COMMON STOCK (135,249) (15,172) DIVIDENDS PAID — (12,556) OTHER FINANCING ACTIVITIES (16,192) (11,135) NET CASH (USED FOR) PROVIDED BY FINANCING ACTIVITIES $(200,247) $71,329 EFFECT OF FOREIGN CURRENCY EXCHANGE RATES ON CASH (2,547) 1,785 NET (DECREASE) INCREASE IN CASH AND EQUIVALENTS, AND RESTRICTED CASH AND EQUIVALENTS $(188,118) $93,726 CASH AND EQUIVALENTS, AND RESTRICTED CASH AND EQUIVALENTS, BEGINNING OF PERIOD $1,124,157 $692,264 CASH AND EQUIVALENTS, AND RESTRICTED CASH AND EQUIVALENTS, END OF PERIOD $936,039 $785,990 FINANCIAL POSITION, LIQUIDITY & CAPITAL ALLOCATION STATEMENT OF CASH FLOWS

30 APPENDIX

31 NET SALES Q2 2021 Q2 2020 Δ % GAAP $864,850 $698,328 24% IMPACT FROM CHANGES IN FOREIGN CURRENCY EXCHANGE RATES (1) — 16,706 (2)% NON-GAAP CONSTANT CURRENCY BASIS $864,850 $715,034 21% GROSS PROFIT Q2 2021 Q2 2020 Δ BPS (2) GAAP $563,485 $423,608 450 IMPACT FROM CHANGES IN FOREIGN CURRENCY EXCHANGE RATES (1) — 12,178 (20) NON-GAAP CONSTANT CURRENCY BASIS $563,485 $435,786 430 OPERATING INCOME (LOSS) Q2 2021 Q2 2020 Δ BPS (2) GAAP $114,787 $14,143 1,130 EXCLUDED ITEMS (3) (786) (8,083) 110 ADJUSTED NON-GAAP $115,573 $22,226 1,020 IMPACT FROM CHANGES IN FOREIGN CURRENCY EXCHANGE RATES (1) — 3,418 (40) ADJUSTED NON-GAAP CONSTANT CURRENCY BASIS $115,573 $25,644 980 NET INCOME (LOSS) PER DILUTED SHARE Q2 2021 Q2 2020 Δ $ GAAP $1.69 $0.09 $1.60 EXCLUDED ITEMS, NET OF TAX (3) (0.01) (0.15) 0.14 ADJUSTED NON-GAAP $1.70 $0.23 $1.47 IMPACT FROM CHANGES IN FOREIGN CURRENCY EXCHANGE RATES (1) — 0.04 (0.04) ADJUSTED NON-GAAP CONSTANT CURRENCY BASIS $1.70 $0.27 $1.43 (1) The impact from foreign currency is determined by applying current period exchange rates to prior year results and is net of the year-over-year impact from hedging. The per diluted share impact from foreign currency is calculated using a 26% tax rate. (2) The estimated basis point impact has been rounded based on the percentage change. (3) Excludes pre-tax store asset impairment charges. APPENDIX RECONCILIATION OF GAAP TO NON-GAAP RESULTS

32 (1) The tax effect of excluded items, calculated as the difference between the tax provision on a GAAP basis and an adjusted non-GAAP basis. (in thousands) Q2 2021 GAAP EXCLUDED ITEMS Q2 2021 NON-GAAP ASSET IMPAIRMENT, EXCLUSIVE OF FLAGSHIP STORE EXIT CHARGES $786 $786 $— OPERATING INCOME 114,787 (786) 115,573 INCOME BEFORE INCOME TAXES 103,512 (786) 104,298 INCOME TAX EXPENSE (1) (6,944) (224) (6,720) NET INCOME $108,500 $(562) $109,062 NET INCOME PER DILUTED SHARE $1.69 $(0.01) $1.70 DILUTED WEIGHTED-AVERAGE SHARES OUTSTANDING 64,136 64,136 (in thousands) Q2 2020 GAAP EXCLUDED ITEMS Q2 2020 NON-GAAP ASSET IMPAIRMENT, EXCLUSIVE OF FLAGSHIP STORE EXIT CHARGES $8,083 $8,083 $— OPERATING LOSS 14,143 (8,083) 22,226 LOSS BEFORE INCOME TAXES 7,045 (8,083) 15,128 INCOME TAX EXPENSE (1) 1,253 1,166 87 NET LOSS $5,464 $(9,249) $14,713 NET LOSS PER DILUTED SHARE $0.09 $(0.15) $0.23 DILUTED WEIGHTED-AVERAGE SHARES OUTSTANDING 63,286 63,286 APPENDIX RECONCILIATION OF GAAP TO NON-GAAP RESULTS


REFINITIV STREETEVENTS EDITED TRANSCRIPT ANF.N - Q2 2021 Abercrombie & Fitch Co Earnings Call EVENT DATE/TIME: AUGUST 26, 2021 / 12:30PM GMT REFINITIV STREETEVENTS | www.refinitiv.com | Contact Us ©2021 Refinitiv. All rights reserved. Republication or redistribution of Refinitiv content, including by framing or similar means, is prohibited without the prior written consent of Refinitiv. 'Refinitiv' and the Refinitiv logo are registered trademarks of Refinitiv and its affiliated companies.

C O R P O R A T E P A R T I C I P A N T S Fran Horowitz Abercrombie & Fitch Co. - CEO & Director Pamela Nagler Quintiliano Abercrombie & Fitch Co. - VP of IR Scott D. Lipesky Abercrombie & Fitch Co. - Executive VP & CFO C O N F E R E N C E C A L L P A R T I C I P A N T S Janet Joseph Kloppenburg JJK Research Associates, Inc. - President Janine M. Stichter Jefferies LLC, Research Division - Equity Analyst Jay Daniel Sole UBS Investment Bank, Research Division - Executive Director and Equity Research Analyst of Softlines & Luxury Matthew Robert Boss JPMorgan Chase & Co, Research Division - MD and Senior Analyst Paul Lawrence Lejuez Citigroup Inc., Research Division - MD and Senior Analyst Sarah L. Goldberg Robert W. Baird & Co. Incorporated, Research Division - Research Analyst Susan Kay Anderson B. Riley Securities, Inc., Research Division - Analyst P R E S E N T A T I O N Operator Good day, and welcome to the Abercrombie & Fitch Second Quarter Fiscal Year 2021 Earnings Call. Today's conference is being recorded. (Operator Instructions) And at this time, I would like to turn the conference over to Pam Quintiliano. Please go ahead, ma'am. Pamela Nagler Quintiliano - Abercrombie & Fitch Co. - VP of IR Thank you. Good morning, and welcome to our second quarter 2021 earnings call. Joining me today on the call are Fran Horowitz, Chief Executive Officer; and Scott Lipesky, Chief Financial Officer. Earlier this morning, we issued our second quarter earnings release, which is available on our website at corporate.abercrombie.com under the Investors section. Also available on our website is an investor presentation. Please keep in mind that any forward-looking statements made on the call are subject to the safe harbor provisions of the Private Securities Litigation Reform Act of 1995. These forward-looking statements are subject to risks and uncertainties that could cause actual results to differmaterially from the expectations and assumptions we mention today. A detailed discussion of these factors and uncertainties is contained in the company's filings with the Securities and Exchange Commission. In addition, we will be referring to certain non-GAAP financial measures. Additional details and a reconciliation of GAAP to adjusted non-GAAP financial measures are included in the release issued earlier this morning. With that, I will turn the call over to Fran. 2 REFINITIV STREETEVENTS | www.refinitiv.com | Contact Us ©2021 Refinitiv. All rights reserved. Republication or redistribution of Refinitiv content, including by framing or similar means, is prohibited without the prior written consent of Refinitiv. 'Refinitiv' and the Refinitiv logo are registered trademarks of Refinitiv and its affiliated companies. AUGUST 26, 2021 / 12:30PM, ANF.N - Q2 2021 Abercrombie & Fitch Co Earnings Call

Fran Horowitz - Abercrombie & Fitch Co. - CEO & Director Good morning. I am excited to be here today to share our recent results and provide insights into the start of our back-to-school season. We entered Q2 well positioned to realize ongoing benefits from the work that we had done heading into and during the pandemic. This included growing our digital channel, which carries a higher 4-wall operating margin than stores; rightsizing our store fleet; expanding our digital and technology teams; adding to our vendor and regional carrier networks; and investing in marketing with an emphasis on digital and social. Throughout the late spring and summer, our customers took advantage of the warm weather and an increase in social activities. We were there for all their outfitting needs. Product acceptance was strong across brands, continuing momentum from the past several quarters. Once again, we reduced markdowns and promotions, tightly managed inventories and made strategic investments across marketing, technology and fulfillment to support near- and long-term growth. Our proven playbook worked, and we achieved our best second quarter operating income and operating margin since 2008. Before I turn to results, just a quick PSA. As we continue to lap significant impacts from COVID, we'll be providing comparisons to both second quarter 2020 and 2019 where applicable. And due to temporary COVID-driven store closures last year, we do not plan to disclose comparable sales. Second quarter total sales rose 24% to last year, and we were up 3% compared to Q2 2019. Our largest market, the U.S., led with sales up 31% on a 1-year and 11% on a 2-year basis. Results speak to customer retention and spend and to new customers discovering our brands. By channel, total global store sales rose 55% from last year and were down 20% from 2019. I'm very proud of our stores' performance, which was achieved despite permanent closures as well asongoing restrictions in EMEA. As a reminder, during fiscal 2020, we proactively closed 137 locations, removing 1.1 million underproductive gross square feet from our store base. We continue to execute against our #1 transformation initiative, global store network optimization to further align with our customers' shifting shopping behaviors. Even with aggressive store sales growth, digital did not skip a beat and remained solid as stores reopened. Digital sales held steady to 2020 levels and grew 52% from 2019. Results are further proof of our ongoing evolution into a digital-first global omnichannel retailer and should yield sustainable operating margin benefits. Our total sales growth has been healthy, as evidenced by our significant gross margin expansion. For the quarter, we achieved our best Q2 gross margin rate since 2009. Our total company gross margin rate increased 450 basis points on a 1-year and 590 basis points on a 2-year basis. We reduced the depth and breadth of promotions compared to last quarter and last year. While customer reaction to product has continued to be strong, we have not and will not step away from our inventory discipline. This is one of the key COVID learnings we will continue to apply going forward. Reflecting our strong top line and gross margin performance, combined with ongoing tight expense controls, our operating margin rate rose over 1,100 basis points compared to last year and 1,800 basis points compared to Q2 2019. While we benefited from a good consumer environment, especially in the U.S., our results also reflect the body of work done by our global teams to dramatically improve our product, voice and experience. Since I became CEO in 2017, our brands have evolved with our customers, and we are focused on being there and supporting them for all their lifestyle needs. Speaking of those lifestyle needs, let's take a moment to talk about some major fashion wins that applied company-wide. Many have
asked me about the current denim cycle. There is a ton of newness and interest in jeans that has been great for our brands, especially as it is 1 of our top 3 categories on an annual basis and even more important in the back half of the year. Our teams have done an absolutely amazing job staying on top of current denim trends. We are viewed as a premier denim destination, with newer styles representing over 40% of our jeans volume, up from 25% last year, and our customer is not waiting for sale to get what they want. In the second quarter, we reduced promotions within this category, well below 2020 and 2019 levels. 3 REFINITIV STREETEVENTS | www.refinitiv.com | Contact Us ©2021 Refinitiv. All rights reserved. Republication or redistribution of Refinitiv content, including by framing or similar means, is prohibited without the prior written consent of Refinitiv. 'Refinitiv' and the Refinitiv logo are registered trademarks of Refinitiv and its affiliated companies. AUGUST 26, 2021 / 12:30PM, ANF.N - Q2 2021 Abercrombie & Fitch Co Earnings Call

So what's working? We have high-rise, wider legs, including mom, dad, straight and flare. Skinny is still there, although becoming a smaller part of the total. And there are new up and coming trends, like '90s-inspired low-rise, something for everyone. And lengths are changing too. Following years of ankle, we are starting to see interest in full. We're encouraged that these changes are not limited to one gender. Customers are also responding to the wider leg openings in men's, which represents another significant opportunity, as it has been a long time since he has updated his silhouette. Of course, our customer needs tops to go with their new jeans. In women's, we continue to see customers gravitate to slim and crop tops and oversize and bodysuits, which further reinforces the proportion play in bottoms. Dresses, skirts, shorts and swim were also popular. As product acceptance has built, our teams have been meeting our customers where they are in the digital landscape. We are firmly committed to our test and learn strategy and to new and emerging technology trends and engagement opportunities. It was certainly a busy and exciting quarter for both technology and engagement, and I want to take a moment to discuss some of the highlights. We introduced an evolved Gilly Hicks brand purpose and positioning. We launched our newest brand, Social Tourist. We accelerated investments in testing across influencer, paid media and digital, reaching both core and new audiences. And we hired a Chief Digital and Technology Officer to further evolve and accelerate our first -- our digital-first model. Starting with Gilly Hicks. On July 15, we took a huge leap forward in our growth strategy by relaunching the brand globally with an evolved purpose and position to bring our customer to their happy place. Given our Gen Z customer is the most stressed generation, the updated purpose is very important. As part of the relaunch, we introduced gender-inclusive productand new size inclusive materials, so that everyone can feel welcome and comfortable, regardless of size or gender identity. In addition, we opened our first standalone store at Easton Town Center in Columbus, Ohio and introduced updated side-by-side within Hollister store experiences. This included 20 refreshes to existing side-by-side formats and in 3 new locations, all of which incorporate elements from the standalone store. Wow, what can I say? What an absolutely phenomenal moment for the Gilly team. We are truly feeling the love. Customer feedback has been overwhelmingly positive, and the brand is resonating with our Gen Z customer and their mindset. Early results from the brand relaunch and the new store concept have been very encouraging. Taking a step back, our customer is already responding well to the product and the brand, which gave us confidence to make the necessary investments to accelerate this exciting growth vehicle. In the second quarter, sales rose approximately 30% year-over-year, with growth across digital and store channels. This was the fifth consecutive quarter of double-digit total sales gains. Loungelette matchbacks, sleep, underwear and our active collection, Gilly Go, continued to resonate with our customer. Post launch, our guys product and matching collections also have been well received. Turning to Social Tourist. It's hard to believe it's only been 3 months since we've taken Hollister's successful partnership with TikTok superstars Dixie and Charli D'Amelio, who, combined, have over 270 million followers across social platforms to the next level with the launch of our fifth brand. Social Tourist is a great example of how we are approaching our business differently, meeting our customer where they are and pushing boundaries of social commerce in new and exciting ways. Since the launch, the brand has had over 700 million impressions and views, and we continue to build awareness. For the first collection, we
had several Instagram exclusive pieces. And for the second, we hosted a live TikTok fashion show featuring the D'Amelios and other social stars, which beat TikTok benchmarks. 4 REFINITIV STREETEVENTS | www.refinitiv.com | Contact Us ©2021 Refinitiv. All rights reserved. Republication or redistribution of Refinitiv content, including by framing or similar means, is prohibited without the prior written consent of Refinitiv. 'Refinitiv' and the Refinitiv logo are registered trademarks of Refinitiv and its affiliated companies. AUGUST 26, 2021 / 12:30PM, ANF.N - Q2 2021 Abercrombie & Fitch Co Earnings Call

With Social Tourist, we have learned so much in a short period of time about up-and-coming fashion trends, social commerce and the growth of the TikTok platform. We are optimistic about Social Tourist and its future and have several more exciting events happening throughout the remainder of the year. Now on to our remaining brands. Starting with our largest brand, Hollister, which includes Gilly Hicks and Social Tourist, sales rose 20% in the quarter, and we achieved our highest Q2 sales in company history. Congrats to the entire Hollister team. Our focus on voice and experience clearly complemented our product, helping to drive higher average transaction values on strong average unit retail growth. From a marketing perspective, we launched the Hollister Creator Collective, a year-long influencer program. In July, we sponsored the Lago Vista Snapchat series featuring 21 nonskippable Hollister commercials. We rounded out our efforts with a new monthly Instagram live shopping series with influencers. Hollister's site and app also got a refresh during the quarter, further improving the customer experience. Gilly Hicks and Social Tourist now have dedicated tabs, allowing users to shop between all 3 brands with a shared checkout. In addition, Gilly Hicks and Social Tourist launched their own unique apps, and we also updated our membership loyalty program, so that customers can earn points and redeem rewards across all 3 brands. As we look to the remainder of the back-to-school season, we are focused on continuing to win in jeans. We have styling pop-ups in key markets where we have been engaging with local teens and seeding product, and thus far it has been highly successful. We will also have influencers and affiliates in the U.S. and EMEA amplify denim across Instagram and TikTok. At Abercrombie adults, our influencer affiliate and editorial programs remain one of our top priorities. In the second quarter, we grew associated sales by over70% year-over-year and increased our already sizable network of digital brand advocates. We also launched a capsule series with top affiliate creators and took part in Facebook's live shopping alpha test, which had fantastic engagement and insights. During the quarter, we continued to leverage TikTok content. On a year-over-year basis, we doubled our new-to-file visits, grew new-to-file orders and sales by over 80% and continued to break TikTok benchmarks for paid media. I can't wait to see what the future holds on this important platform. After all, according to PopSugar, Abercrombie is TikTok's favorite fashion brand, and we are proud to hold that title. All the hard work connecting to our customer has certainly paid off. On our last earnings call, I said that Abercrombie women's had a breakout moment. During the second quarter, that momentum built, with women's achieving its best Q2 sales since 2012. In total, Abercrombie, which includes kids, grew sales 30% in the quarter. Similar to Hollister, Abercrombie registered higher average transaction values on strong average unit retail growth. Heading into fall, our team is energized. We recently launched our Denim Your Way campaign, which features Abercrombie customers from our Instagram casting call. We also collaborated with wedding and events experts, The Knot, on a best dressed guest collection. In addition, we teamed up with Zappos as our exclusive domestic third-party e-commerce provider for a limited selection of jeans and tops and a footwear collaboration. At Abercrombie kids, if report cards were given out during summer, I would say they received an A. We were highly focused on driving customer acquisition through expansion into a new platforms and releasing new product and content franchises. The Ultimate Summer Outfit campaign contributed to sales growth in shorts and swim, which are 2 important seasonal categories, while the release of the Cool Stuff collection and a
launch of our active assortment both had over 70% new-to-file shopper rates and average order values that were over 70% above our goals. A common theme across the company has been our focus on digital, which is critical for future growth. As we continue our transformation into a digitally led operating model, we have made investments in technology and talent. Over the past year, we've expanded our data and analytics, user experience and technology teams, and we recently welcomed Samir Desai to the ANF family in the newly created role of Chief Digital and Technology Officer. 5 REFINITIV STREETEVENTS | www.refinitiv.com | Contact Us ©2021 Refinitiv. All rights reserved. Republication or redistribution of Refinitiv content, including by framing or similar means, is prohibited without the prior written consent of Refinitiv. 'Refinitiv' and the Refinitiv logo are registered trademarks of Refinitiv and its affiliated companies. AUGUST 26, 2021 / 12:30PM, ANF.N - Q2 2021 Abercrombie & Fitch Co Earnings Call

Before I turn it over to Scott, I want to take a moment to discuss our thoughts on the health of the consumer and how we are approaching the fall season. In the second quarter, the U.S. benefited from government stimulus and a reopening, as customers resumed many of their activities. Internationally, the reopening in many countries, including our largest market, the U.K., lagged the U.S., reflecting ongoing COVID-related restrictions. As we think about Q3, while global uncertainties remain, we are cautiously optimistic. We've been pleased with the U.S. back-to-school season to date and believe our customer is highly engaged and actively looking to refresh their wardrobe. We are expecting to see an elongated season, as many of our larger markets have yet to return. In EMEA, the environment is improving, and we have yet to start the back-to-school season. Looking ahead, we will continue to execute our proven playbooks. We will focus on controlling what we can control and will remain on offense. We are proactively managing through industry-wide issues around inflation, production and transportation delays. With our solid foundation and strong balance sheet, as well as our longstanding relations with our global vendor and supply chain partners, we are well positioned to be winners in the back half and expect to surpass our previously stated 5.8% operating margin goal this year. And with that, I will turn it over to Scott. Scott D. Lipesky - Abercrombie & Fitch Co. - Executive VP & CFO Thanks, Fran, and good morning, everyone. As Fran mentioned, we will be providing comparisons to both second quarter 2020 and 2019, where applicable, and will not be disclosing comparable sales. Turning to our results. In the second quarter, we delivered total net sales of $865 million, up 24% to last year. On a 2-year basis, sales were up 3%. We ended the quarter with all of our 733 stores open. This compares to 92% of our base open at the end of the first quarter.As of yesterday, all stores remain open. Store sales rose 55% on a 1-year basis and were down 20% on a 2-year basis. We recouped a significant [portion of lost store sales due to COVID-driven] (corrected by company after the call) closures last year. At the same time, total digital sales dollars remained steady compared to last year and grew 52% from Q2 2019, representing 44% of total sales this quarter. By brand, net sales increased 20% for Hollister, which includes Gilly Hicks and Social Tourist, and 30% for Abercrombie, which includes kids. As compared to Q2 2019, net sales increased 2% for Hollister and 4% for Abercrombie. By region, net sales in the U.S. were up 31% and 11% on a 1- and 2-year basis, respectively, despite having roughly 129 fewer stores and over 22% less square footage in our U.S. store base as compared to Q2 2019. In EMEA, sales rose 11% on a 1-year basis, but were down 5% on a 2-year basis. Customers responded well to localized product, voice and experience, which allowed us to reduce promotions in region. We were pleased with results in light of permanent store closures and ongoing COVID-related restrictions. Since Q2 2019, we have closed 17 stores, including 8 flagships, as we continue to reposition to a smaller and wider store network focused on local customers. During the quarter, the region as a whole remained in flux as we experienced intermittent temporary closures and reduced operating hours. As a reminder, in region, our penetration is highest in the U.K., while Germany and France are also meaningful. In APAC, sales were down 1% to last year and down 39% to Q2 2019. We experienced continued traffic challenges in the region. In our largest market, China, we are encouraged by customer response to new product, including APAC exclusive collections. On Tmall, we saw a stabilized sales trend and improved profitability, as we continue to reduce promotional activity. 6 REFINITIV STREETEVENTS |
www.refinitiv.com | Contact Us ©2021 Refinitiv. All rights reserved. Republication or redistribution of Refinitiv content, including by framing or similar means, is prohibited without the prior written consent of Refinitiv. 'Refinitiv' and the Refinitiv logo are registered trademarks of Refinitiv and its affiliated companies. AUGUST 26, 2021 / 12:30PM, ANF.N - Q2 2021 Abercrombie & Fitch Co Earnings Call

Globally, we continued to see lower store traffic levels relative to Q2 2019, with sequential improvements off Q1. From an omnichannel perspective, we were pleased with year-over-year improvements in conversion and average transaction values. Moving on to gross profit. Our rate of 65.2% was up 450 basis points to last year and 590 basis points to Q2 2019 driven by higher AUR across brands on reduced promotions and markdowns, partially offset by higher AUC, reflecting increased transportation costs. Inventory is controlled and current, ending the quarter down 8% to last year. Reflecting well-documented industry-related challenges, we did see delivery delays increase over the quarter, as global shipping congestion continued, and there were renewed COVID restrictions across several of our production countries. We are managing through delays of 1 to 3 weeks on average by pulling forward deliveries, employing fabric platforming and leveraging air deliveries as necessary. Also we are working through an extended closure of factories in Southern Vietnam, which have been further delayed and are now expected to open the first week of September at the earliest. We have and will continue to leverage our strong vendor partnerships and a similar playbook already used in other countries to ensure we get product as quickly as possible upon reopening. I'll cover the rest of our Q2 results on an adjusted non-GAAP basis. Excluded from our non-GAAP results are approximately $800,000 and $8 million of pretax asset impairment charges for this year and last year, respectively. Operating expense, excluding other operating income, was up 11% compared to last year, while operating expense as a percentage of sales decreased to 52% from 57.8%. In Q2, we saw an increase in stores and distribution expense of 5% compared to 2020 and a reduction of 13% compared to 2019. Compared to 2019, store occupancy was down approximately $50 million related tosquare footage reductions and renegotiated leases, and included approximately $9 million of benefits associated with rent abatements and a flagship lease-related item. These savings were partially offset by increased shipping and fulfillment expenses. Marketing, general and administrative expenses rose 27% from last year and 7% compared to 2019, primarily driven by increased marketing spend and higher performance-based compensation expense. We delivered operating income of $116 million compared to operating income of $22 million last year. As Fran noted, this was our best second quarter operating income and operating margin since 2008. The effective tax rate was approximately negative 6. In the quarter, we released approximately $30 million of previously established valuation allowances on certain deferred tax assets primarily in the United States, Germany and the Netherlands. Additionally, the quarter reflected a discrete benefit of approximately $4 million for U.K. rate change enacted in the quarter, which increased the value of deferred taxes in the U.K. Net income per diluted share on an adjusted non-GAAP basis was $1.70 compared to $0.23 last year. The current quarter includes a benefit of approximately $0.53 related to the tax items mentioned. Our strong financial position continues to enable us to both invest in the business and return excess cash to shareholders. We ended the quarter with cash and cash equivalents of $922 million and total liquidity of approximately $1.2 billion. During the quarter, we repurchased approximately 2.4 million shares for $100 million, bringing the year-to-date total share repurchases to about 3.5 million shares and $135 million. At the end of Q2, we had approximately 6.5 million shares remaining under our previously authorized share repurchase program. In addition, we spent $47 million to purchase $42 million at par value of our senior secured notes on the open market as a way to deleverage the
balance sheet and deploy excess cash. 7 REFINITIV STREETEVENTS | www.refinitiv.com | Contact Us ©2021 Refinitiv. All rights reserved. Republication or redistribution of Refinitiv content, including by framing or similar means, is prohibited without the prior written consent of Refinitiv. 'Refinitiv' and the Refinitiv logo are registered trademarks of Refinitiv and its affiliated companies. AUGUST 26, 2021 / 12:30PM, ANF.N - Q2 2021 Abercrombie & Fitch Co Earnings Call

Looking ahead, we will continue to focus on returning excess cash to shareholders primarily through share repurchases, pending market conditions, share price and our ability to accelerate investments in the business. Looking ahead, we continue to expect fiscal 2021 CapEx to be approximately $100 million, with about half of that related to digital and technology and the other half related to real estate and maintenance items. During the quarter, we opened 14 new stores, bringing the total to 18 for the year-to-date period and closed 12 for a total of 20 year-to-date. In the back half, we expect to open roughly 20 stores, bringing the total for the year to approximately 40. This year, we have about 240 leases up for renewal. We look forward to having thoughtful conversations with our landlord partners to find stores that are the right size, in the right location at the right economics. I'll finish up with how we are planning the remainder of the year. We will stay on offense and leverage a portion of our structural cost savings to support top line growth, including investments in marketing across brands, the digital experience and growing Gilly Hicks and Social Tourist. Reflecting ongoing global uncertainty, we will continue to maintain inventory discipline as we manage through supply chain disruptions and the costs and delays associated with it as well as read and react to the operating environment in each market around the world. Recently, we have been encouraged by back-to-school results in the U.S., where we expect to see an extended back-to-school season. We are excited for some of the largest school districts, including New York, to return in the weeks to come. For the third quarter, we are planning as follows, using 2019 as our comparison period. Net sales to be up 2% to 4% from 2019 level of approximately $863 million. We expect the U.S. to continue to outperform EMEA and APAC. At this point, our plan assumes a modest impact on sales due to supplychain constraints, with the larger impact coming from cost inflation, which I'll cover momentarily. We will work to manage through the disruption using all available tools in our toolkit, including airing inventory and shifting production as necessary and if possible. Gross profit rate to be up at least 300 basis points to 2019 level of 60.1%, including an expected negative impact of approximately 300 to 400 basis points of freight cost pressure. We remain cautiously optimistic in our ability to drive AUR improvements through lower promotion and clearance activity to offset this headwind. Operating expense, excluding other operating income, to be up low single digits to 2019 adjusted non-GAAP level of $494 million. Lower store expenses will be partially offset by higher fulfillment costs. We also plan to increase marketing spend compared to 2019, as we look to further drive momentum in social and digital media across brands. We expect to see benefits from this marketing throughout the back half and into 2022, and the tax rate to be in the low 20. Looking to the full year, as compared to 2019, we are planning as follows: net sales to be up low to mid-single digits to 2019 level of $3.6 billion; gross profit rate to be up around 300 basis points to 2019 level of 59.4%; operating expense, excluding other operating income, to be down 3% to 4% to 2019 adjusted non-GAAP level of $2.07 billion. Assuming we deliver against these expectations, we would expect operating margin at or above 9% for the full year, which is well above our 2018 Investor Day target of 5.8%. We are excited about the significant progress we have made on our operating model and cost structure. While plenty of hard work remains, we are optimistic about our future, and will provide additional detail on our 2022 assumptions on our year-end earnings call. With that, operator, we are ready for questions. 8 REFINITIV STREETEVENTS | www.refinitiv.com | Contact Us ©2021 Refinitiv. All
rights reserved. Republication or redistribution of Refinitiv content, including by framing or similar means, is prohibited without the prior written consent of Refinitiv. 'Refinitiv' and the Refinitiv logo are registered trademarks of Refinitiv and its affiliated companies. AUGUST 26, 2021 / 12:30PM, ANF.N - Q2 2021 Abercrombie & Fitch Co Earnings Call

Q U E S T I O N S A N D A N S W E R S Operator (Operator Instructions) We will begin with Paul Lejuez with Citi. Paul Lawrence Lejuez - Citigroup Inc., Research Division - MD and Senior Analyst Fran, I wonder if you could talk a little bit more about the Gilly Hicks brand and just how you're thinking about that brand in '22, how big it can be for you guys, both near term and long term. Also curious what you're seeing on the promotional environment as you begin in back-to-school, what you expect for the second half. And then, Scott, I think you still have some pricey debt. Just curious how you're thinking about what to do as far as using cash and whether use it to pay down debt, buy back more stock. Fran Horowitz - Abercrombie & Fitch Co. - CEO & Director Paul, would love to talk about Gilly. What an exciting quarter for Gilly. We're building off momentum that we were already feeling in Gilly. The team has been hard at work building that brand over the past couple of years, and we had an opportunity to really get close to the customer, understand that this is the most stressed out generation, this Gen Z generation, and to come up with a brand purpose that really helps them find their happy place has been just a huge win. The brand is resonating. The product is resonating. We opened up a freestanding store as a test and learn in Easton just a couple of weeks ago that has been really well received. We also took some of those assets and used them on our side-by-sides around the world, about 20 of them, and have seen a nice pickup from that as well. Adding this gender-inclusive and size-inclusive to it has just been an all-around win. We are excited about where we're headed, and we have not declared as part of the Hollister number today. I think your second question was the promotional environment for the second half. We are thrilled with the progress that we have made. I think you have been on this journey with us for quite some time. And beingable to actually reduce our promotions to the extent that we have thus far this year has been just a huge win for us. We are holding our inventory tight. As we've said, that's the one of the biggest learnings coming out of COVID, and we intend to remain there. So the back half is more promotional than the first half. We will continue to monitor the situation, but we expect to continue to make progress. Scott D. Lipesky - Abercrombie & Fitch Co. - Executive VP & CFO All right. I'll grab the third piece here on cash usage. Yes, year-to-date, we have put some cash to use. We put about $250 million of our cash to use $135 million in share repurchases and around $110 million to delever the balance sheet. Back in Q1, just as a reminder, we paid about $65 million to settle a multiyear obligation related to our SoHo Hollister store. And then we bought back in some of that pricey debt that you mentioned there, Paul, in the second quarter here for about $45 million. As we think about that debt in the future, first good opportunity there is we have a non-call provision on that debt. That comes up here in 2022. I can't believe it's happening already, sneaking up on us. So that's then our first decision point there will be. So in the meantime, it makes sense for us to buy a little bit of that in here in Q2. 9 REFINITIV STREETEVENTS | www.refinitiv.com | Contact Us ©2021 Refinitiv. All rights reserved. Republication or redistribution of Refinitiv content, including by framing or similar means, is prohibited without the prior written consent of Refinitiv. 'Refinitiv' and the Refinitiv logo are registered trademarks of Refinitiv and its affiliated companies. AUGUST 26, 2021 / 12:30PM, ANF.N - Q2 2021 Abercrombie & Fitch Co Earnings Call

So more to come there as we get into first quarter of next year. As we look forward to the back half and cash usage, I mentioned that we're going to be focusing on share repurchases, pending stock price and the ability to invest in the business. Operator Next, we will hear from Susan Anderson with B. Riley. Susan Kay Anderson - B. Riley Securities, Inc., Research Division - Analyst Nice job on the quarter. I guess, just to touch on the gross margin, I think you mentioned the highest since '09. And if you look back historically, it looks like it's been even higher in the upper 60s. So I'm just curious if you think there's more room there and how confident you are in maintaining that margin level as we look forward. And then just for third quarter, it looks like you're expecting gross margin to be a bit below second quarter. Is that really just all increased freight costs? Scott D. Lipesky - Abercrombie & Fitch Co. - Executive VP & CFO Susan, it's Scott. I'll grab this one. So yes, thinking about gross margin, yes, highest since 2009. Extremely pleased with the progress we've made in pulling back on promotions. Obviously, we learned a ton through COVID on inventory levels, and just the product acceptance has been great, and a huge thanks to our merchant and design teams. Thinking about the past, I don't think we'll get back to our peak. The business was very different back in 2006 and 2007 than it is today, but we are making great progress on that gross margin. Susan Kay Anderson - B. Riley Securities, Inc., Research Division - Analyst The third quarter gross margin expectation versus second, yes. Scott D. Lipesky - Abercrombie & Fitch Co. - Executive VP & CFO Yes, third quarter gross margin. Yes, to bring it back to the third quarter, yes. So we are seeing the increased freights coming into us on the third quarter. So it started to build here in the first half. Some of that gets booked up in your inventory, and then we'll start to flow that through here in the thirdquarter. So it will be a little bit down there versus Q2, but the great thing is we're still talking about 300 basis points up versus 2019, and that's baking in 300 to 400 basis points of pressure from, hopefully, transitory freight inflation that will hopefully sort itself out in the future. But we'll see when that happens. So really pleased with the progress on gross margins. Operator We'll now move to a question from Jay Sole with UBS. 10 REFINITIV STREETEVENTS | www.refinitiv.com | Contact Us ©2021 Refinitiv. All rights reserved. Republication or redistribution of Refinitiv content, including by framing or similar means, is prohibited without the prior written consent of Refinitiv. 'Refinitiv' and the Refinitiv logo are registered trademarks of Refinitiv and its affiliated companies. AUGUST 26, 2021 / 12:30PM, ANF.N - Q2 2021 Abercrombie & Fitch Co Earnings Call

Jay Daniel Sole - UBS Investment Bank, Research Division - Executive Director and Equity Research Analyst of Softlines & Luxury Great. Fran, you mentioned that there's lots of newness in denim, and lots of styles are working for both women's and men's. Can you give us a sense of what you think this fashion trend has meant for the growth rate for the category? So in other words, if before the pandemic it was growing at 1%, do you think it's growing at 5% now, 10% now? And secondly, do you think that growth rate can persist for a few more quarters? Fran Horowitz - Abercrombie & Fitch Co. - CEO & Director Jay, so what an exciting time for denim. It doesn't happen very often where our industry sees such an incredible trend happening. So the newness in denim, skinny jeans, we'll just start there. They've been around for a decade. So to talk about all of this newness in denim, we see a long, long runway. And there's so many things happening between the leg openings, the high-rise, the low-rise because of the '90s influence. I mean, I could just -- I could go on and on and on about all the exciting things that are happening, and what's great is that they're happening across brands and they're happening across genders. So our expectation is that we expect to see this newness continuing well into the future. Jay Daniel Sole - UBS Investment Bank, Research Division - Executive Director and Equity Research Analyst of Softlines & Luxury Got it. And then maybe you talked about increasing some marketing expenses, which sort of implies that you really like how the Hollister and Abercrombie & Fitch and also Social Tourist and all the different things, Gilly Hicks, you're doing with brands are positioned. But specifically on Hollister and Abercrombie, given all the work that you've put in over the last 5 years to reposition these brands, what are the KPIs that you're looking at that tell you that these brands really are where you want to be and are ready to bereally invested in a big way to continue to increase the engagement you're already seeing with consumers? Scott D. Lipesky - Abercrombie & Fitch Co. - Executive VP & CFO Jay, it's Scott, I'll grab this one. Yes. Loving where the brand positionings are for each of our brands, all 4 of them -- all 5 of them, including kids. So we're increasing marketing. This is the great position we have with a strong balance sheet, having that cash and seeing that expense savings across the store base, it's what we've been trying to do over the years is to move from more fixed into more variable, and marketing is our #1 variable cost, and we love to spend it. So the teams that we have built across our brands are just firing on all cylinders, like Fran said earlier. And we're going to give them more cash to fund that marketing. We love what's happening across social and across digital. We're finding great new partnerships. We're seeing TikTok explode. So we can put more money to work for all of our brands. And to drive those KPIs, we want new customers. We want to drive retention and so on and so forth. And that's what our teams have been executing on, and we appreciate that. Operator (Operator Instructions) We will now move to Matthew Boss with JPMorgan. Matthew Robert Boss - JPMorgan Chase & Co, Research Division - MD and Senior Analyst And congrats on the continued momentum. 11 REFINITIV STREETEVENTS | www.refinitiv.com | Contact Us ©2021 Refinitiv. All rights reserved. Republication or redistribution of Refinitiv content, including by framing or similar means, is prohibited without the prior written consent of Refinitiv. 'Refinitiv' and the Refinitiv logo are registered trademarks of Refinitiv and its affiliated companies. AUGUST 26, 2021 / 12:30PM, ANF.N - Q2 2021 Abercrombie & Fitch Co Earnings Call

Fran Horowitz - Abercrombie & Fitch Co. - CEO & Director Thank you. Matthew Robert Boss - JPMorgan Chase & Co, Research Division - MD and Senior Analyst So maybe relative to your second quarter net sales up 3% relative to 2019, what have you seen in August? Or how best to peg the continued momentum that you cited? And then, Scott, just on profitability, what are some of the puts and takes maybe as we think about the bottom line operating margin this year relative to maybe how best to think about it moving forward? Fran Horowitz - Abercrombie & Fitch Co. - CEO & Director I'll kick off. So we are pleased with the momentum that we've seen heading into August. Back-to-school for the Hollister and the kids brand, because Abercrombie, we really called back to fall, so it's really focusing on the Hollister and kids from it. Back-to-school, we're seeing nice reception to the product. The early states, like Texas and Florida and Georgia, have seen a nice start to back-to-school. Our expectation is a nice, I guess, slow and steady wins the race, right? So we're looking for a longer season for back-to-school. In the past, we've always talked about these big peaks and valleys that we've seen throughout the country as the states peak. That's a bit different this year. The consumer was spending a lot more time in vacationing and then their social activities that they got back to. So we saw a lot more wear now selling, and now we're seeing them go into more wear forward selling. So excited about what we're seeing so far. Scott D. Lipesky - Abercrombie & Fitch Co. - Executive VP & CFO Yes. Matt, on the puts and takes for profitability, it comes down to really 3 levers for us. It's the store expenses, it's fulfillment and then it's marketing. And we've taken out a significant amount of occupancy coming into this year and through this year. We expect to make continued improvements in occupancy as we go forward. And whenever we close stores, reduce stores,we do see savings come through with other store expenses. On the fulfillment side, we've seen inflation there, and we've seen higher volumes. So we'll see how that plays out in the future, but that will offset some of those store savings somewhat. And then marketing is really where we want to accelerate our spend to grow the brand because I think what we've seen, more recently, specifically, is that when we can grow that top line and thinking about the plus 3 we just talked about to 2019, in Q2, we can see an amazing flow through. And we've seen great profitability here in the first half, and that's our goal go forward, is to continue to elevate that profitability, drive the top line and see that flow through. Operator We'll now move to a question from Janine Stichter with Jefferies. 12 REFINITIV STREETEVENTS | www.refinitiv.com | Contact Us ©2021 Refinitiv. All rights reserved. Republication or redistribution of Refinitiv content, including by framing or similar means, is prohibited without the prior written consent of Refinitiv. 'Refinitiv' and the Refinitiv logo are registered trademarks of Refinitiv and its affiliated companies. AUGUST 26, 2021 / 12:30PM, ANF.N - Q2 2021 Abercrombie & Fitch Co Earnings Call

Janine M. Stichter - Jefferies LLC, Research Division - Equity Analyst I want to ask about the complexion of the sales guidance 2% to 4% versus 2019. Would you expect that the sales growth would start to improve in Europe and maybe a bit of a moderation in the U.S.? And then also just curious what you saw within the quarter in Europe as stores reopened. Interested in the cadence there. Scott D. Lipesky - Abercrombie & Fitch Co. - Executive VP & CFO Sure. Janine, I'll grab this one. So thinking about the 2% to 4%, go back in history a little bit, up 5-ish in Q1, up 3-ish in Q2. And so we're kind of right around that same range here in Q3. A couple of things happening here in Q3. We're hopeful and optimistic that Europe will slowly reopen. It's been slowly reopening. It certainly has lagged what's happening here in the U.S. So optimistic that the vaccine rollout will continue, and people will start to get out a little bit more. On the other side of it is inventory challenges and supply chain challenges that we have seen. So inventory is kind of dribbling in here as we go through the quarter, and we expect to see a little bit of a hit there in Q3. Our in-stocks are not exactly where we want them to be, so we're doing everything in our power, and a huge thanks to our transportation teams to get our products here as quickly as possible. So those things are kind of balancing in, and it just keeps us right on track with where we've been for the first half. Janine M. Stichter - Jefferies LLC, Research Division - Equity Analyst Okay. Great. And then just on the gross margin, the 300 to 400 basis points of incremental freight, could you quantify what that was in either 2Q or the first half? Just curious how that -- just trying to get a sense of what the underlying merchandise margin improvement you're expecting in the back half versus what you saw in 2Q. Scott D. Lipesky - Abercrombie & Fitch Co. - Executive VP & CFO We didn't put in there. But I'd say in Q2, a couple ofhundred basis points drag on gross margin from the freights. So a little bit of a growth here as we see that really start to flow through the inventory as those higher rates. We're bringing the product into spring and selling into fall, so it's been a drag. But the great thing is that underlying margin, how you -- merchandise margin, how you framed it is we're seeing great AURs, and we're seeing through the product acceptance and the inventory and the marketing. It's all working together to see great AURs to offset that cost pressure. And so that's our expectation here in Q3, and we'll update Q4 whenever we get there. Operator Now moving to a question from Janet Kloppenburg with JJK Research. Janet Joseph Kloppenburg - JJK Research Associates, Inc. - President Can you hear me? 13 REFINITIV STREETEVENTS | www.refinitiv.com | Contact Us ©2021 Refinitiv. All rights reserved. Republication or redistribution of Refinitiv content, including by framing or similar means, is prohibited without the prior written consent of Refinitiv. 'Refinitiv' and the Refinitiv logo are registered trademarks of Refinitiv and its affiliated companies. AUGUST 26, 2021 / 12:30PM, ANF.N - Q2 2021 Abercrombie & Fitch Co Earnings Call

Fran Horowitz - Abercrombie & Fitch Co. - CEO & Director Yes. Janet Joseph Kloppenburg - JJK Research Associates, Inc. - President Congratulations on a great quarter. Fran Horowitz - Abercrombie & Fitch Co. - CEO & Director Thank you. Janet Joseph Kloppenburg - JJK Research Associates, Inc. - President Fran, I just wanted to ask about store productivity levels. One, if you could sort of discriminate between the U.S. and Europe in the second quarter. And second, as the e-com business continues to be pretty steady, how we should think about getting back to prepandemic productivity levels in the stores, particularly the mall-based stores. And Scott, in relation to the supply chain constraints and the transportation costs, it feels like it's getting a little bit worse. And I'm wondering how you think we should think about the fourth quarter and maybe the first quarter, too. Are you cautious there that things could actually worsen from 3Q? Or do you think -- and I understand these are just temporary headwinds, but I'm just trying to get the model right. What do you think that we could get some improvement as we move through the rest of the year and into next year? Fran Horowitz - Abercrombie & Fitch Co. - CEO & Director Okay. So starting from the top, the productivity levels, yes, clearly, the U.S. currently are more productive than EMEA. We've seen continued restrictions across EMEA. And as Scott mentioned earlier, we're excited that we're starting to see some green shoots and a little bit more consistency in EMEA, but we had lots of COVID restrictions throughout the countries, particularly the U.K., which is our largest country throughout the whole second quarter. So productivity in the U.S. has been stronger, and we're actually very pleased with our U.S. performance being up 11% to prepandemic levels in total, we see as a big, big win. Your second question, let's see, digital is strong, getting back to -- I guess, so same answer. We are -- wecontinue to focus very closely on our leases, Janet, making sure that our stores are in the right location, the right economics and the right size. It's been a big, big initiative of ours since -- I mean, for years now, and we're continuing on that. We've closed 130 stores and took out 1 million square feet out of our base. We've got a lot of leases coming up in the back half, and we'll continue to stay focused on it. Hollister, just as the last step before I hand it over to Scott, we have -- most of our Hollister -- most of the stores in Europe are in our Hollister business. So with that, I'll hand it over to you. 14 REFINITIV STREETEVENTS | www.refinitiv.com | Contact Us ©2021 Refinitiv. All rights reserved. Republication or redistribution of Refinitiv content, including by framing or similar means, is prohibited without the prior written consent of Refinitiv. 'Refinitiv' and the Refinitiv logo are registered trademarks of Refinitiv and its affiliated companies. AUGUST 26, 2021 / 12:30PM, ANF.N - Q2 2021 Abercrombie & Fitch Co Earnings Call

Scott D. Lipesky - Abercrombie & Fitch Co. - Executive VP & CFO Yes, I'll just -- I'll tag on a little bit to that last one there, Janet. When we think about the new normal, and when I say you think about store productivity and store traffic, some malls have regained that traffic from 2019, but a whole lot of malls haven't. And so we're -- I'd say back-to-school was kind of the first test of people coming back and really seeing how that store traffic looks versus 2019, and it was solid but definitely not back to those levels on average. So we'll get through a holiday season and understand that. So we're all still learning on what the productivity levels of these stores will be and where that traffic settles in. And to Fran's point, we have flexibility in our leases to make sure that we can either continue to shrink our stores to drive productivity that way, get rent deals that better fit the new sales level for that store and so on and so forth. On the supply chain constraints, yes, I'd say, right now, it's tough out there. All the articles you read are real, and we're all -- those of us on this side of the fence are living through it every day. So those costs are in our inventory. It hit us in Q2. It's going to hit us in Q3. It's going to hit us in Q4. I'd say the one thing that we're thinking about is just the reopening of Vietnam and getting those units in here September into early Q4, and there'll be some air that comes along with that. And as we think about the Q4 or the kind of the full year outlook that we put out there, we have that baked in there, but we'll see how it plays out. Out of our control at this point. Operator (Operator Instructions) We'll now move to Mark Altschwager with Baird. Sarah L. Goldberg - Robert W. Baird & Co. Incorporated, Research Division - Research Analyst This is Sarah Goldberg on for Mark. And congrats on the quarter. It's impressive to see the digital sales hold flat, despite significant strength in 2020. And I'm just curious how you're thinking about the sustainabilityof these digital trends moving forward and then maybe any further implications they would have on the fleet optimization program. Scott D. Lipesky - Abercrombie & Fitch Co. - Executive VP & CFO I'll start? Fran Horowitz - Abercrombie & Fitch Co. - CEO & Director Go ahead. Scott D. Lipesky - Abercrombie & Fitch Co. - Executive VP & CFO Okay. Yes, I'll kick this one off, and Fran can chime in. But we're very happy with the digital sales hanging in. That was one of our first big learnings coming through, as the world kind of reopened specifically here in the U.S. is what was going to happen to digital whenever the stores reopen. So with the fleet work that we did last year and the huge jump that we saw last year in digital sales because of the COVID-related closures, it was great to sustain that this year. And what I love from the finance perspective is to see that flow through and to see our difference, the P&L and operating model flow through to much greater profitability, with that sales mix being at 44% of digital versus back in '19 where it wasn't. 15 REFINITIV STREETEVENTS | www.refinitiv.com | Contact Us ©2021 Refinitiv. All rights reserved. Republication or redistribution of Refinitiv content, including by framing or similar means, is prohibited without the prior written consent of Refinitiv. 'Refinitiv' and the Refinitiv logo are registered trademarks of Refinitiv and its affiliated companies. AUGUST 26, 2021 / 12:30PM, ANF.N - Q2 2021 Abercrombie & Fitch Co Earnings Call

So as we think about going forward, it does have an implication on the store fleet. I mean, this business is about omnichannel now. We need to make sure we have the right-sized stores in the right locations to support a bigger digital halo within a certain market, and that's how we look at each market that we're entering. We want to maximize that omni business. So it absolutely has an implication, and we'll be thinking about that as we go into the back half of this year when we have those 240 leases up for renewal. Operator It looks like that's all the time we have for questions today. I will turn the call back over to Fran for any additional or closing remarks. Fran Horowitz - Abercrombie & Fitch Co. - CEO & Director Thank you. Thank you for participating in our call today. I look forward to speaking with you in November when we report our third quarter results. Operator With that, ladies and gentlemen, this does conclude your conference for today. We do thank you for your participation. You may now disconnect. D I S C L A I M E R Refinitiv reserves the right to make changes to documents, content, or other information on this web site without obligation to notify any person of such changes. In the conference calls upon which Event Transcripts are based, companies may make projections or other forward-looking statements regarding a variety of items. Such forward-looking statements are based upon current expectations and involve risks and uncertainties. Actual results may differ materially from those stated in any forward-looking statement based on a number of important factors and risks, which are more specifically identified in the companies' most recent SEC filings. Although the companies may indicate and believe that the assumptions underlying the forward-looking statements are reasonable, any of the assumptions could prove inaccurate or incorrect and, therefore, there can be no assurance that the results contemplated in the forward-lookingstatements will be realized. THE INFORMATION CONTAINED IN EVENT TRANSCRIPTS IS A TEXTUAL REPRESENTATION OF THE APPLICABLE COMPANY'S CONFERENCE CALL AND WHILE EFFORTS ARE MADE TO PROVIDE AN ACCURATE TRANSCRIPTION, THERE MAY BE MATERIAL ERRORS, OMISSIONS, OR INACCURACIES IN THE REPORTING OF THE SUBSTANCE OF THE CONFERENCE CALLS. IN NO WAY DOES REFINITIV OR THE APPLICABLE COMPANY ASSUME ANY RESPONSIBILITY FOR ANY INVESTMENT OR OTHER DECISIONS MADE BASED UPON THE INFORMATION PROVIDED ON THIS WEB SITE OR IN ANY EVENT TRANSCRIPT. USERS ARE ADVISED TO REVIEW THE APPLICABLE COMPANY'S CONFERENCE CALL ITSELF AND THE APPLICABLE COMPANY'S SEC FILINGS BEFORE MAKING ANY INVESTMENT OR OTHER DECISIONS. ©2021, Refinitiv. All Rights Reserved. 14939233-2021-08-26T20:06:42.673 16 REFINITIV STREETEVENTS | www.refinitiv.com | Contact Us ©2021 Refinitiv. All rights reserved. Republication or redistribution of Refinitiv content, including by framing or similar means, is prohibited without the prior written consent of Refinitiv. 'Refinitiv' and the Refinitiv logo are registered trademarks of Refinitiv and its affiliated companies. AUGUST 26, 2021 / 12:30PM, ANF.N - Q2 2021 Abercrombie & Fitch Co Earnings Call