Ab initio Molecular Modelling of the Dealumination and ...
176
HAL Id: tel-01126877 https://tel.archives-ouvertes.fr/tel-01126877 Submitted on 6 Mar 2015 HAL is a multi-disciplinary open access archive for the deposit and dissemination of sci- entific research documents, whether they are pub- lished or not. The documents may come from teaching and research institutions in France or abroad, or from public or private research centers. L’archive ouverte pluridisciplinaire HAL, est destinée au dépôt et à la diffusion de documents scientifiques de niveau recherche, publiés ou non, émanant des établissements d’enseignement et de recherche français ou étrangers, des laboratoires publics ou privés. Ab initio Molecular Modelling of the Dealumination and Desilication Mechanisms of Relevant Zeolite Frameworks Marius-Christian Silaghi To cite this version: Marius-Christian Silaghi. Ab initio Molecular Modelling of the Dealumination and Desilication Mech- anisms of Relevant Zeolite Frameworks. Catalysis. Ecole normale supérieure de lyon - ENS LYON, 2014. English. NNT : 2014ENSL0930. tel-01126877
Transcript of Ab initio Molecular Modelling of the Dealumination and ...
HAL Id: tel-01126877https://tel.archives-ouvertes.fr/tel-01126877
Submitted on 6 Mar 2015
HAL is a multi-disciplinary open accessarchive for the deposit and dissemination of sci-entific research documents, whether they are pub-lished or not. The documents may come fromteaching and research institutions in France orabroad, or from public or private research centers.
L’archive ouverte pluridisciplinaire HAL, estdestinée au dépôt et à la diffusion de documentsscientifiques de niveau recherche, publiés ou non,émanant des établissements d’enseignement et derecherche français ou étrangers, des laboratoirespublics ou privés.
Ab initio Molecular Modelling of the Dealumination andDesilication Mechanisms of Relevant Zeolite Frameworks
Marius-Christian Silaghi
To cite this version:Marius-Christian Silaghi. Ab initio Molecular Modelling of the Dealumination and Desilication Mech-anisms of Relevant Zeolite Frameworks. Catalysis. Ecole normale supérieure de lyon - ENS LYON,2014. English. �NNT : 2014ENSL0930�. �tel-01126877�
THESE
Pour obtenir le grade de
DOCTEUR DE L’UNIVERSITE DE LYON
ECOLE NORMALE SUPERIEURE DE LYON
Ecole Doctorale de Chimie de Lyon
Travaux réalisés à IFP Energies nouvelles
Spécialité : Chimie
Présentée par
Marius-Christian SILAGHI
Ab initio Molecular Modelling of the Dealumination
and Desilication Mechanisms of Relevant Zeolite
Frameworks
Soutenance prévue le 23 septembre 2014 devant le jury composé de :
Prof. J.-F. PAUL, Université de Lille 1 Rapporteur
Dr. F. TIELENS, Université Pierre et Marie Curie (Paris 6) Rapporteur
Prof. S. BORDIGA, Università Degli Studi di Torino Examinatrice
Dr. P. SAUTET, Ecole Normale Supérieure de Lyon Examinateur
Prof. J. SAUER, Humboldt-Universität zu Berlin Examinateur
Dr. P. RAYBAUD, IFP Energies nouvelles Directeur de thèse
Dr. C. CHIZALLET, IFP Energies nouvelles Examinatrice
TABLE OF CONTENTS
***
GENERAL INTRODUCTION………………………………..………………1
References……………………………………………………………………………………..3
***
CHAPTER I : BIBLIOGRAPHY AND SCOPE OF THE THESIS ………..5
1. Introduction……………………………………………………………………………6
2. Zeolites: general feature and structures relevant to this work……………………….7 2.1. Mordenite………………………………………………………………………….8
2.2. Faujasite……………………………………………………………………….11
2.3. ZSM-5 (MFI framework)……………………………………………………..11
2.4. Chabazite……………………………………………………………………...12
3. Post-synthetic modified zeolites: synthesis methods and resulting properties……...13
3.1. Experimental synthesis methods……………………………………………...13
3.1.1. Dealumination………………………………………………………………..13
3.1.2. Desilication…………………………………………………………………...14
3.2. Impact on the framework crystallinity………………………………………..15
3.2.1. Dealumination………………………………………………………………..15
3.2.2. Desilication…………………………………………………………………...16
3.3. Mesopore formation and enhanced zeolite features…………………………..17
3.3.1. Dealumination………………………………………………………………..17
3.3.2. Desilication…………………………………………………………………...19
3.4. Structural defects and extraframework species……………………………….20
3.4.1. Extraframework aluminium (EFAL)………………………………………20
3.4.2. Extraframework Silicon (EFSI)…………………………………………….23
4. Mechanistic approaches of defect formation in zeolites…………………………….24
4.1. Mechanism of Marcilly for dealumination……………………………………….24
4.2. Desilication……………………………………………………………………25
4.3. Computational approaches of defective zeolites……………………………...28
4.3.1. Ab initio calculations on EFAL species and their formation…………..28
4.3.2. Ab initio simulation of the step-by-step hydrolysis pathways………….29
4.3.3. Challenging perspectives in the field of molecular simulation for
dealumination/desilication……………………………………………………………………31
5. Conclusions of the bibliographic study……………………………………………...32
6. Research program……………………………………………………………………33
References………………………………………………………………………………….35
***
CHAPTER II : METHODS…………………………………………………..41
1. Theoretical Background……………………………………………………………...42
1.1. Schrödinger Equation …………………………………………………………42
1.2. The Hartree-Fock Approximation: a solution for the Schrödinger Equation
………………………………………………………………………………………...43
1.3. Post Hartree-Fock methods: Electron correlation…………………………….45
1.3.1. Configuration Interaction…………………………………………………..46
1.3.2. Møller and Plesset perturbation theory…………………………………..46
1.4. Density-Functional Theory……………………………………………………47
1.4.1. The Hohenberg-Kohn theorem……………………………………………..47
1.4.2. Kohn-Sham equations……………………………………………………….48
1.4.3. Functionals……………………………………………………………………49
1.4.4. Basis sets………………………………………………………………………51
2. Structure optimizations………………………………………………………………54
2.1. Local energy minima …………………………………………………………54
2.2. Nudged Elastic Band Method…………………………………………………54
3. Electronic calculations: tools and parameters used in this work…………………..55 3.1. Choice of the methodology…………………………………………………...55
3.2. VASP………………………………………………………………………….56
3.3. QMPOT……………………………………………………………………….57
References……………………………………………………………………………………60
***
CHAPTER III : FIRST AL-O BOND HYDROLYSIS DURING
ZEOLITES DEALUMINATION UNIFIED BY BRØNSTED-EVANS-
POLANYI RELATIONSHIP………………………………………………...63
1. Introduction…………………………………………………………………………..64
2. T site stabilities of protonated zeolites……………………………………………….64 2.1. MOR…………………………………………………………………………..65
2.2. FAU…………………………………………………………………………...67
2.3. MFI……………………………………………………………………………69
3. Reaction of a water molecule with zeolitic frameworks: how can a defect be initiated
? ……………………………………………………………………………….………..71 3.1. Investigated reaction intermediates…………………………………………...71
3.2. Water adsorption on Brønsted acid site versus Lewis acid site………………73
3.2.1. MOR…………………………………………………………………………….73
3.2.2. FAU……………………………………………………………………………..77
3.2.3. MFI……………………………………………………………………………...78
3.2.4. Synopsis…………………………………………………………………………81
3.3. First Al-O bond hydrolysis in zeolites occurring during dealumination……...82
3.3.1. Introduction…………………………………………………………………….82
3.3.2. Choice of T sites investigated in details……………………………………83
3.3.3. Methods…………………………………………………………………………84
3.3.4. Relevant intermediates ……………………………………………………….84
3.3.5. Mechanistic aspects…………………………………………………………...85
3.3.6. General trends…………………………………………………………………88
3.3.7. Summary………………………………………………………………………..90
4. Conclusion……………………………………………………………………………90
References……………………………………………………………………………………91
***
CHAPTER IV : DEALUMINATION PATHWAYS OF ZEOLITES :
MECHANISMS, EFAL CONFINEMENT AND PREDICTIVE TRENDS
………………………………………………………………………………….93
1. Introduction………………………………………………………………………………..94
2. Methods……………………………………………………………………………………96 2.1. Structure Optimization…………………………………………………………...96
2.2. Localizing transition states……………………………………………………….97
3. Results and Discussion……………………………………………………………………98 3.1 Zeolite Structures…………………………………………………………………98
3.2 Dealumination pathways leading to the Al(OH)3H2O EFAL……………………98
3.2.1 Mordenite……………………………………………………………………….98
3.2.2 Chabazite………………………………………………………………………104
3.2.3 MFI……………………………………………………………………………..107
3.2.4 FAU…………………………………………………………………………….111
3.2.5. Synopsis……………………………………………………………………….113
3.3 Brønsted-Evans-Polanyi relationships for the hydrolysis of Al-O bonds………113
3.4 Confinement effect on EFAL species…………………………………………...115
3.5. Comparison with experiments…………………………………………………..116
4. Conclusions………………………………………………………………………………117
References…………………………………………………………………………………..119
***
CHAPTER V : COMBINED DESILICATION AND DEALUMINATION
OF MORDENITE…………………………………………………………...121
1. Introduction…………………………………………………………………………122
2. Strategy……………………………………………………………………………...123
3. Consecutive Dealumination and Desilication……………………………………..126
4. Simultaneous Dealumination/Desilication reactions……………………………...127
5. Conclusions…………………………………………………………………………128
References…………………………………………………………………………………..130
***
CONCLUSIONS AND PERSPECTIVES………………………………….131
References…………………………………………………………………………………..133
***
APPENDIX…………………………………………………………………..135
A.1. Optimization of unit cell parameters………………………………………………….136 A.1.1. Method ……………………………………………………………………….136
A.1.2. Calculated cell parameters……………………………………………………138
A.2. T sites stability………………………………………………………………………….141
A.2.1. MOR………………………………………………………………………….141
A.2.2. FAU…………………………………………………………………………..141
A.2.3. MFI…………………………………………………………………………...143
A.3. First Al-O/Si-O bond breaking including one water molecule: exhaustive investigation
of plausible intermediates…………………………………………………………………..145
A.4. Water adsorption on Brønsted acid site versus Lewis acid site………………………149
A.4.1. MOR………………………………………………………………………….149
A.4.2. FAU…………………………………………………………………………..155
A.4.3. MFI…………………………………………………………………………...155
A.5. Reaction path of the first Al-O(H) bond breaking for zeolites MIF, CHA, MOR and
FAU: structural and vibrational feature…………………………………………………...165
References…………………………………………………………………………………..168
***
1
General Introduction
Nowadays solid acid catalysts have a widespread application field for example in refining, petrochemistry1, environmental protection2, 3, medicine4, 5 for the synthesis of bio-fuels and bio-chemicals6, 7 and in the field of adsorption8, inter alia. Among these catalysts, zeolites which are crystalline alumino-silicate microporous materials, have drawn a strong attention since their first use as adsorbents for industrial separation and purification which is mainly due to their intrinsic and post-synthetic characteristics. Their strong acidity, among others resulting from Lewis- and Brønsted-acid sites, linked with their thermal robustness and well manageable pore sizes make them suitable candidates for industry reactions such as fluid catalytic cracking, hydrocracking, isomerisation and alkylation of various hydrocarbon molecules9. Historically, the first synthetically made zeolite appeared in the late 1940s10 and the introduction of high-silica zeolites, containing an increased Si/Al ratio, 20 years later revolutionized the field of application of these porous materials11. The major topic in zeolite synthesis lies within the tailoring of the shape size and the connectivity of intra-framework channels. However confinement effects12 and diffusion limitations impose severe constraints on the reactants, intermediates and products. For instance, the selectivity in hydrocracking may be directly influenced by confinement effects13. Generally rate limiting steps are classified according to reactant/transition state/product shape selectivity14. Thus, to account for these selectivities and to avoid side effects (e.g. overcracking) nowadays developments in zeolite catalysis engineering attempt to design efficient and selective solids for the targeted reactions.
One solution is the use of ordered mesostructured solids such as MCM-41 (Mobil
Composition of Matter-41), one of the most known ordered mesoporous silica, developed in the early 1990's by Mobil Oil Company (now Exxon Mobil). Contrasting with zeolites, these materials have larger pores and well manageable pore size distributions15-17. MCM-41 displays an hexagonal arrangement of mesopores of around 2 – 6.5 nm18, 19 and for their synthesis supramolecular ionic surfactants, e.g. alkyltrimethylammonium halides, called structure directing agents (SDA) are used. Since the mesoporous siliceous structures do not exhibit the desired Brønsted acid site, they need to be subjected to postsynthetic functionalisations, so called "grafting"20 with aluminium isopropoxide in n-hexane21 for example. However, the acidity of aluminium-doped MCM-41 is globally closer to amorphous silica-alumina22. Additionally, since these materials are thermically and hydrothermically less stable15 (Al is easily removable from the framework) than zeolites, they are less suitable in processes such as fluid catalytic cracking or hydrocracking.
With that respect, "hierarchical zeolites"23 have opened new perspectives because they
show improved catalytic performances compared to non-treated ones, e.g. for Mordenite, Zeolite Y and ZSM-524. There are two possibilities leading to these hierarchical zeolites: either the template or the non-template method23, 25. Where the first one lies in an ab initio tailoring of the shape size and connectivity within a zeolite by bulky templating agents during crystallization26, the second method uses already synthesized zeolites followed by dealumination27-29 and/or desilication30-33 to create intracrystalline mesopores. The dealumination is performed by steaming and/or acid leaching34, 35. Although thermal treatment is sufficient to create local defect domains in zeolites, steaming combined with acid leaching is preferred in most cases since it makes the Si and Al debris more labile (extraframework species – extraframework aluminum EFAL and silicon EFSI - and amorphous silica-alumina)
2
within the pores enhancing the diffusion properties of the catalysts. The second demetallation (desilication) consists in selectively removing the silicon from the framework by dint of aqueous basic conditions36-38.
One remaining delicate problem is the characterization of extraframework species39-43 within the cavities and the newly formed mesopores as well as the nature of the resulting acid sites. To elucidate this problem one has to understand the mechanism of formation of such extraframework species and their mobility taking place during the dealumination and desilication steps as well as the accurate description of both crystalline and local amorphous phases.
In the present research program, we propose to use ab initio molecular modelling to
address those questions at the molecular scale. This tool brought some new concepts in the past decades for the investigation of heterogeneous catalysts, in particular in the field of crystalline zeolites44, 45. We use both periodic Density Functional Theory calculations and hybrid approaches (QM/QM), to calculate reaction pathways for demetallation reactions, starting from perfect zeolitic frameworks models, adding reacting water molecules sequentially. To the best of our knowledge, this ambitious task was undertaken by one other research team only, Swang and collaborators
46, 47, who very recently addressed dealumination and desilication of Chabazite. They proposed original reactions pathways, with the drawback of presenting very high activation energies. Our aim is to get molecular insights for several zeolitic frameworks (FAU, MFI, MOR, CHA) to obtain general concepts applicable to zeolites of industrial interest, trying to find more plausible reaction routes, hopefully with lower activation barriers.
Chapter I is devoted to a detailed analysis of the state of the art based on the existing
experimental and computational literature. From this analysis, the work program is presented. Chapter II deals with the methods chosen. The following chapters are devoted to the results obtained in the course of this PhD work. We focused first and in depth on the dealumination reaction, whereas results regarding desilication of zeolitic frameworks are only preliminary. Chapter III reports the results obtained regarding the initiation of dealumination, which is the first Al-O bond breaking. Chapter IV generalizes this approach for the full EFAL extraction. Chapter V presents preliminary results obtained regarding desilication and mixed dealumination/desilication pathways of zeolites.
3
References 1. A. V. Abramova, E. V. Slivinskii, Y. Y. Goldfarb, A. A. Panin, E. A. Kulikova and G.
A. Kliger, Kinet. Catal., 2005, 46, 758-769. 2. L. Gao, Y. Cao, S. L. Zhou, T. T. Zhuang, Y. Wang and J. H. Zhu, J. Hazard. Mater.,
2009, 169, 1034-1039. 3. J. Yang, L. L. Ma, B. Shen and J. H. Zhu, Mater. Manuf. Processes, 2007, 22, 750-
757. 4. M. Martinez, M. Castro, K. Hidalgo, U. Ayala, R. Perez, L. Hernandez and L. Baez,
Cuban J Agr Sci, 2004, 38, 387-390. 5. P. Pellegrino, B. Mallet, S. Delliaux, Y. Jammes, R. Guieu and O. Schaf, Biochem.
Biophys. Res. Commun., 2011, 410, 478-483. 6. G. Busca, Chem. Rev., 2007, 107, 5366-5410. 7. J. Q. Bond, D. M. Alonso, D. Wang, R. M. West and J. A. Dumesic, Science, 2010,
327, 1110-1114. 8. Z. Wu and D. Zhao, Chem. Com., 2011, 47, 3332-3338. 9. W. Vermeiren and J. P. Gilson, Top. Catal., 2009, 52, 1131-1161. 10. R. M. Barrer, J. Chem. Soc., 1948, 2158-2163. 11. C. Marcilly, ed., Acido-Basic Catalysis - Application to Refining and Petrochemistry,
Editions TECHNIP, 2005. 12. E. G. Derouane, J. M. Andre and A. A. Lucas, J. Catal., 1988, 110, 58-73. 13. H. Toulhoat, P. Raybaud and E. Benazzi, J. Catal., 2004, 221, 500-509. 14. B. Smit and T. Maesen, Chem. Rev., 2008, 108, 4125–4184. 15. S. Hitz and R. Prins, J. Catal., 1997, 168, 194-206. 16. J. S. Beck, J. C. Vartuli, W. J. Roth, M. E. Leonowicz, C. T. Kresge, K. D. Schmitt, C.
T. W. Chu, D. H. Olson and E. W. Sheppard, J. Am. Chem. Soc., 1992, 114, 10834-10843.
17. C. T. Kresge, M. E. Leonowicz, W. J. Roth, J. C. Vartuli and J. S. Beck, Nature, 1992, 359, 710-712.
18. M. Kruk, M. Jaroniec and A. Sayari, Langmuir, 1997, 13, 6267-6273. 19. A. V. Neimark, P. I. Ravikovitch, M. Grün, F. Schüth and K. K. Unger, J Colloid
Interf Sci, 1998, 207, 159-169. 20. N. K. Mal, M. Fujiwara, Y. Tanaka, T. Taguchi and M. Matsukata, Chem. Mater.,
2003, 15, 3385-3394. 21. M. Rozwadowski, M. Lezanska, J. Wloch and K. Erdmann, Stud. Surf. Sci. Catal.,
2005, Volume 158, Part A, 447-454. 22. A. Corma, M. S. Grande, V. Gonzalez-Alfaro and A. V. Orchilles, J. Catal., 1996,
159, 375-382. 23. J. Pérez-Ramírez, C. H. Christensen, K. Egeblad, C. H. Christensen and J. C. Groen,
Chem. Soc. Rev., 2008, 37, 2530-2542. 24. P. Voogd and H. Vanbekkum, Appl. Catal., 1990, 59, 311-331. 25. Y. Tao, H. Kanoh, L. Abrams and K. Kaneko, Chem. Rev., 2006, 106, 896-910. 26. K. Egeblad, C. H. Christensen, M. Kustova and C. H. Christensen, Chem. Mater.,
2007, 20, 946-960. 27. M. Boveri, C. Márquez-Álvarez, M. Á. Laborde and E. Sastre, Catal. Today, 2006,
114, 217-225. 28. M. D. González, Y. Cesteros and P. Salagre, Microporous Mesoporous Mater., 2011,
144, 162-170.
4
29. F. Hernández-Beltrán, J. C. Moreno-Mayorga, M. a. de Lourdes Guzmán-Castillo, J. Navarrete-Bolaños, M. González-González and B. E. Handy, Appl. Catal., A, 2003, 240, 41-51.
30. J. C. Groen, L. A. A. Peffer, J. A. Moulijn and J. Perez-Ramirez, Microporous
Mesoporous Mater., 2004, 69, 29-34. 31. J. C. Groen, T. Bach, U. Ziese, A. M. Paulaime-van Donk, K. P. de Jong, J. A.
Moulijn and J. Pérez-Ramírez, J. Am. Chem. Soc., 2005, 127, 10792-10793. 32. D. Verboekend, G. Vile and J. Perez-Ramirez, Adv. Funct. Mater., 2012, 22, 916-928. 33. D. Verboekend, T. C. Keller, M. Milina, R. Hauert and J. Pérez-Ramírez, Chem.
Mater., 2013, 25, 1947-1959. 34. M. Müller, G. Harvey and R. Prins, Microporous Mesoporous Mater., 2000, 34, 135-
147. 35. N. Viswanadham and M. Kumar, Microporous Mesoporous Mater., 2006, 92, 31-37. 36. V. Paixão, A. P. Carvalho, J. Rocha, A. Fernandes and A. Martins, Microporous
Mesoporous Mater., 2010, 131, 350-357. 37. V. Paixao, R. Monteiro, M. Andrade, A. Fernandes, J. Rocha, A. P. Carvalho and A.
Martins, Appl. Catal., A, 2011, 402, 59-68. 38. F. Schmidt, M. R. Lohe, B. Büchner, F. Giordanino, F. Bonino and S. Kaskel,
Microporous Mesoporous Mater., 2012. 39. R. Dimitrijevic, W. Lutz and a. Ritzmann, J. Phys. Chem. Solids, 2006, 67, 1741-
1748. 40. S. Li, A. Zheng, Y. Su, H. Fang, W. Shen, Z. Yu, L. Chen and F. Deng, Phys. Chem.
Chem. Phys., 2010, 12, 3895-3903. 41. O. Lisboa, M. Sánchez and F. Ruette, J. Mol. Catal. A: Chem., 2008, 294, 93-101. 42. W. Lutz, C. H. Rüscher and D. Heidemann, Microporous Mesoporous Mater., 2002,
55, 193-202. 43. J. M. Ruiz, M. H. McAdon and J. M. Garcés, J. Phys. Chem. B, 1997, 101, 1733-1744. 44. J. Sauer, Chem. Rev., 1989, 89, 199-255. 45. R. van Santen and G. J. Kramer, Chem. Rev., 1995, 95, 637-660. 46. S. Malola, S. Svelle, F. L. Bleken and O. Swang, Angew. Chem., Int. Ed., 2011, 51,
652-655. 47. T. Fjermestad, S. Svelle and O. Swang, J. Phys. Chem. C, 2013, 117, 13442-13451.
5
CHAPTER I : Bibliography and Scope of the Thesis
6
Preliminary note: The first parts of this chapter (1-5) are the adaptation of the following review article: “Challenges on molecular aspects of dealumination and desilication of zeolites”, by M.C. Silaghi, C. Chizallet, P. Raybaud, Mic. Mes. Mat., 191, 82, 2014.
1. Introduction
Zeolites are widely used heterogeneous catalysts in the field of chemistry and refining. 1, 2 These microporous and crystalline aluminosilicates exhibit a strong Brønsted acidity making them attractive for processes such as hydrocracking and fluid catalytic cracking. However, micropores can induce diffusion limitations and confinement3 effects resulting in the formation of undesired side products. For instance, the selectivity in hydrocracking may be directly influenced by confinement effects4. One solution is the use of ordered mesostructured solids such as MCM-41 (Mobil Composition of Matter-41), one of the most known ordered mesoporous silica, developed in the early 1990's by Mobil Oil Company (now Exxon Mobil). Contrasting with zeolites, these materials have larger pores and well manageable pore size distributions5-7. MCM-41 displays an hexagonal arrangement of mesopores of around 2 – 6.5 nm8, 9 and for their synthesis supramolecular ionic surfactants, e.g. alkyltrimethylammonium halides, called structure directing agents (SDA) are used. Since the mesoporous siliceous structures do not exhibit the desired Brønsted acid site, they need to be subjected to postsynthetic functionalisations, so called "grafting"10 with aluminium isopropoxide in n-hexane11 for example. However, the acidity of aluminium-doped MCM-41 is globally closer to amorphous silica-alumina12. Additionally, since these materials are thermically and hydrothermically less stable5 (Al is easily removable from the framework) than zeolites, they are less suitable in processes such as fluid catalytic cracking or hydrocracking.
With that respect, "hierarchical zeolites"13 have opened new perspectives because they show improved catalytic performances compared to non-treated ones, e.g. for Mordenite, Zeolite Y and ZSM-514. There are two possibilities leading to these hierarchical zeolites: either the template or the non-template method13, 15. Where the first one lies in an ab initio tailoring of the shape size and connectivity within a zeolite by bulky templating agents during crystallization16, the second method uses already synthesized zeolites followed by dealumination17-19 and/or desilication20-23 to create intracrystalline mesopores. The dealumination is performed by steaming and/or acid leaching24, 25. Although thermal treatment is sufficient to create local defect domains in zeolites, steaming combined with acid leaching is preferred in most cases since it makes the Si and Al debris more labile (extraframework species – extraframework aluminum EFAL and silicon EFSI - and amorphous silica-alumina) within the pores enhancing the diffusion properties of the catalysts. The second demetallation (desilication) consists in selectively removing the silicon from the framework by dint of aqueous basic conditions26-28. One remaining delicate problem is the characterization of extraframework species29-33 within the cavities and the newly formed mesopores as well as the nature of the resulting acid sites.
Several reviews already focused on the synthesis of aluminium-containing mesostructural materials34, the generation, characterization and impact of mesopores in zeolites35, 36
, and the enhanced utilization of hierarchical zeolites in catalysis 13, 37. Despite significant achievements in the control of synthetic procedures and the mesoscale knowledge of the porous structure after demetallation, the previous reviews did not address the nanometric – even molecular – scale’s origins of the demetallation mechanisms, and of the improved performances of the resulting solids. Consistently, the present review article aims at analyzing published works
7
attempting to elucidate the possible atomistic scale mechanisms for the dealumination and desilication by dint of experimental techniques and emerging computational chemistry methods. The impact on the resulting properties of zeolites must rather be viewed as a highlight into non exhaustive examples.
In the present review, Mordenite, Faujasite, ZSM-5 and Chabazite (Figure I-1) were chosen as model systems due to their large application mainly in oil refinery (e.g. Fluid catalytic cracking and Hydrocracking) and their large application field as shape-selective compounds catalyzing reactions such as isomerisation, alkylation and cracking. Some of their important feature will be detailed in section 2. Then, section 3 will focus on these post-synthetic modified zeolites from the point of view of synthesis and resulting features known at a molecular scale. We will address the dealumination/desilication processes and the formed species under given treatment conditions. Then, mechanistic approaches on the dealumination/desilication reactions available from both experimental and theoretical data will be presented in section 4. Some challenges open for future studies will then be suggested. Note that, although the recent outcomes of zeolite demetallation has shown, that a combination of dealumination and desilication paths is the key to obtain inter alia well manageable pore sizes as well as enhanced catalytic characteristics compared to non-treated zeolites23, we treat the two pathways separately. This is due to the fact that we focus on the mechanistic approaches of the dealumination and desilication at the molecular scale. At this scale, each step has to be decoupled, and studied independently, or consecutively (to mimic the synthetic procedure). In particular, at the single site scale, one would like to better understand which bonds are formed or broken for each relevant step. So we chose to present dealumination and desilication separately.
2. Zeolites: general feature and structures relevant to this work
Zeolites belong to a species-rich family of chemically very complex alumino-silicates. Their framework structures are built of corner-connected AlO4 and SiO4 tetrahedra. The empiric Löwenstein rule postulates that no Al-O-Al bond can exist within zeolites due to the unfavourable interaction of the aluminate tetrahedra. Formally these solids consist of a pure silicon dioxide structure wherein more or less randomly Si4+ ions are substituted by Al3+ ions leading to a negative overall framework charge which in nature is compensated by alkali- or earth-alkali ions (e.g. Na+, K+; Mg2+) leading to different crystal structures38-40. The so formed micro pores which have a opening cavities ranging from 0.3 to 1 nm are able to take up small molecules, such as hydrocarbons or water. The negative charge of the tetrahedral unit can also be compensated by a proton giving rise to a so called Brønsted acid site. There are two different ways to replace the cation by a proton: either by direct metallic cation exchange in an acid aqueous solution41 if the zeolites structure allows it (aluminium rich zeolites are not stable in acid aqueous solutions) or by indirect exchange in an aqueous ammonium rich solution followed by a thermal decomposition42 (e.g. 400 to 600 °C) of the ammonium into a proton and ammonia. The quantity of the acid sites within a zeolite is therefore characterised by the level of aluminium and its Si/Al ratio43.
In order to maintain the zeolites acidity and stability towards harsh reaction conditions (e. g. in the fluid catalytic cracking process), and to reduce mass transfer limitations as found in conventional zeolites, a new class of zeolites conquer this field. These 'hierarchical zeolites'13 show improved catalytic performance compared to non-treated ones, e.g. for Mordenite, Zeolite Y and ZSM-514. There are two possibilities leading to these hierarchical zeolites: either the template or the non-template method13, 15. Where the first one lies in an ab initio tailoring of the shape size and connectivity within a zeolite by bulky templating agents during
8
crystallization16, the second method uses already synthesized zeolites followed by dealumination17-19 and/or desilication20-23 to create intracrystalline mesopores. The dealumination is performed by steaming and/or acid leaching24, 25. Although thermal treatment is sufficient to create local defect domains in zeolites, steaming combined with acid leaching is preferred in most cases since it can mobilise the Si and Al debris (extraframework species and amorphous silica-alumina) within the pores enhancing the diffusion behaviour of the catalysts. The second demetallation (desilication) consists in selectively removing the silicon from the framework by dint of aqueous basic conditions26-28.
The delicate problem that is still left, is the description of extraframework species29-33 within the cavities and the newly formed mesopores as well as the nature of the resulting acid sites. To elucidate this problem one has to understand the mechanism of formation of such extraframework species and their mobility taking place during the dealumination and desilication steps as well as the accurate description of both crystalline and local amorphous phases.
The catalytic activity and selectivity of a zeolite is governed by multiple and complex factors such as the acidity, i.e. mainly the Brønsted acid sites, the porosity and the chemical composition especially within the voids and cavities. As a very common feature of many silicon-rich zeolites one has found a high number of crystallographic distinguishable T sites. Moreover it is not fully clear if there are T sites which are occupied preferentially by Al or if the distribution occurs statistically and whether the Si/Al ratio, determined by the synthesis parameters, e.g. Si/Al ratio of the starting gel and heating time among others, affects this occupancy. Lu et al. reported that the Al distribution for MOR zeolites with a Si/Al ratio of more than 10 is strongly dependent upon the Si/Al ratio44. The localization of Brønsted acid sites is also important for the molecular point of view. In order to describe and correlate experimental observations to theoretical data it is primordial to know which sites are affected by the dealumination and desilication. In the following we will focus on four zeolites with high interest for the present study 45.
2.1. Mordenite
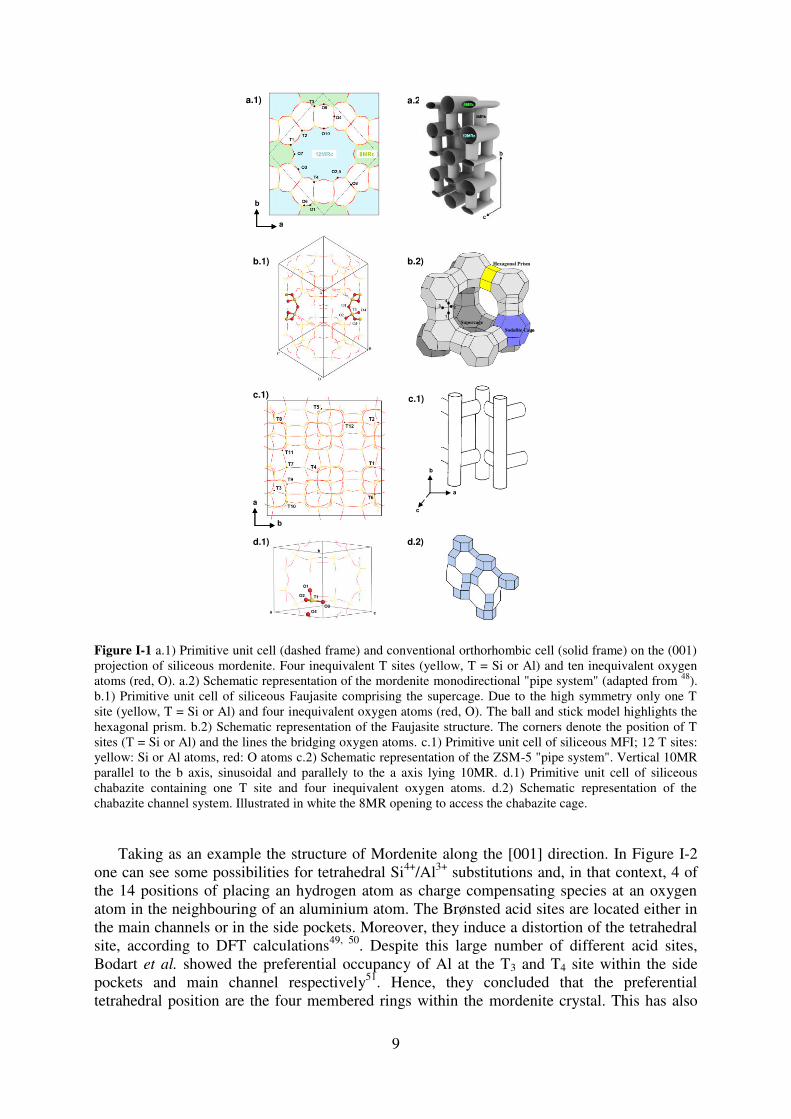
The sodium form of Mordenite was first synthesised by Barrer in 194846. One can obtain a high silica form by introducing SDAs during the thermal synthesis. In its pure silica state, the conventional orthorhombic cell (average space group Cmcm) contains 24 silicon atoms and 48 oxygen atoms (Figure I-1, a.1)). It encloses 16 T1, 16 T2, 8 T3 and 8 T4 sites. These T sites, for natural zeolites38, can be randomly occupied by Al atoms, although showing preferential locations47. The main channel is located parallel to the crystallographic axis [001] (Figure I-1, a.2)) and consists of a 12 membered ring (12MRc) with dimensions of about 6.7 x 7.0 Å and a smaller second channel surrounded by an 8MRc distorted to an ellipse (2.6 x 5.7 Å). These two channels are linked by pores formed of (i) more circular 8MRb (3.4 x 4.8 Å) and (ii) 5MR. They are called "side pockets" and allow diffusion of only small molecules since they can be only entered from the main channel but are not connected to adjacent channels.
9
b
a
a.1) a.2)
T1
O3
O4
O1
O2
a c
b
c.1)
d.1)
b.1) Hexagonal Prism
Sodalite Cage
Supercage
1
2
4
3
Hexagonal Prism
Sodalite Cage
Supercage
1
2
4
3
b.2)
c.1)
a
b
c
a
b
d.2)
Figure I-1 a.1) Primitive unit cell (dashed frame) and conventional orthorhombic cell (solid frame) on the (001) projection of siliceous mordenite. Four inequivalent T sites (yellow, T = Si or Al) and ten inequivalent oxygen atoms (red, O). a.2) Schematic representation of the mordenite monodirectional "pipe system" (adapted from 48). b.1) Primitive unit cell of siliceous Faujasite comprising the supercage. Due to the high symmetry only one T site (yellow, T = Si or Al) and four inequivalent oxygen atoms (red, O). The ball and stick model highlights the hexagonal prism. b.2) Schematic representation of the Faujasite structure. The corners denote the position of T sites (T = Si or Al) and the lines the bridging oxygen atoms. c.1) Primitive unit cell of siliceous MFI; 12 T sites: yellow: Si or Al atoms, red: O atoms c.2) Schematic representation of the ZSM-5 "pipe system". Vertical 10MR parallel to the b axis, sinusoidal and parallely to the a axis lying 10MR. d.1) Primitive unit cell of siliceous chabazite containing one T site and four inequivalent oxygen atoms. d.2) Schematic representation of the chabazite channel system. Illustrated in white the 8MR opening to access the chabazite cage.
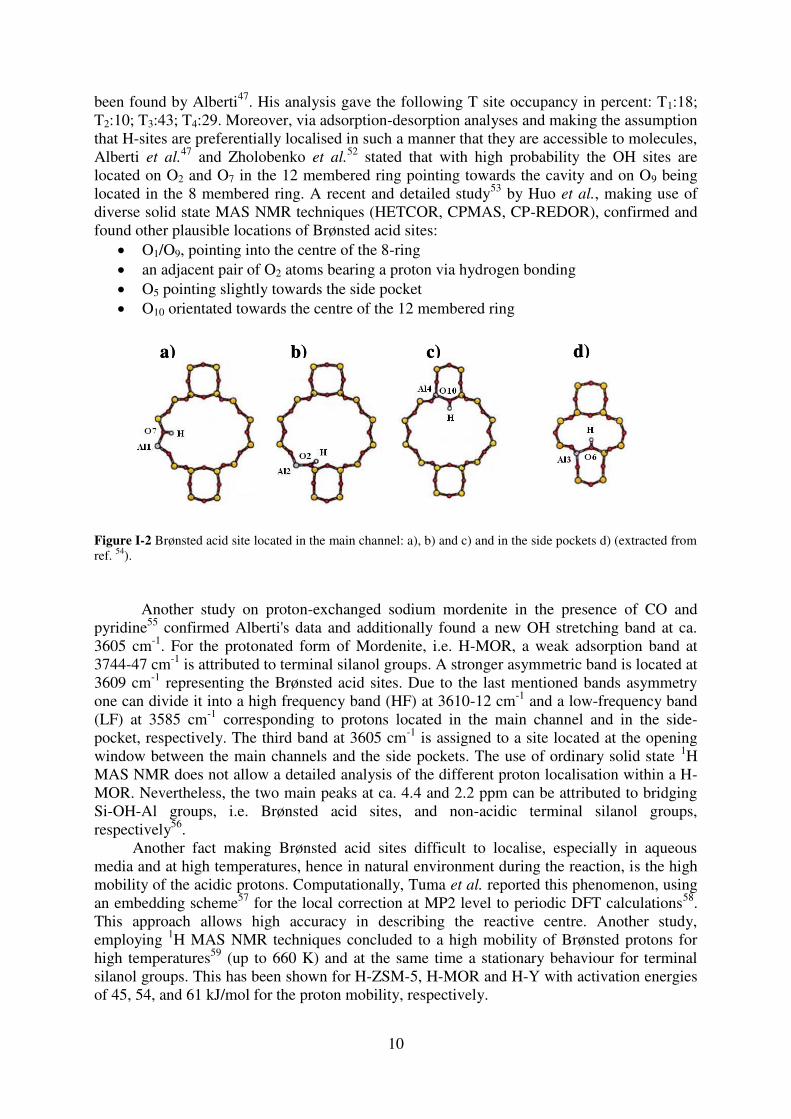
Taking as an example the structure of Mordenite along the [001] direction. In Figure I-2
one can see some possibilities for tetrahedral Si4+/Al3+ substitutions and, in that context, 4 of the 14 positions of placing an hydrogen atom as charge compensating species at an oxygen atom in the neighbouring of an aluminium atom. The Brønsted acid sites are located either in the main channels or in the side pockets. Moreover, they induce a distortion of the tetrahedral site, according to DFT calculations49, 50. Despite this large number of different acid sites, Bodart et al. showed the preferential occupancy of Al at the T3 and T4 site within the side pockets and main channel respectively51. Hence, they concluded that the preferential tetrahedral position are the four membered rings within the mordenite crystal. This has also
10
been found by Alberti47. His analysis gave the following T site occupancy in percent: T1:18; T2:10; T3:43; T4:29. Moreover, via adsorption-desorption analyses and making the assumption that H-sites are preferentially localised in such a manner that they are accessible to molecules, Alberti et al.
47 and Zholobenko et al.52 stated that with high probability the OH sites are
located on O2 and O7 in the 12 membered ring pointing towards the cavity and on O9 being located in the 8 membered ring. A recent and detailed study53 by Huo et al., making use of diverse solid state MAS NMR techniques (HETCOR, CPMAS, CP-REDOR), confirmed and found other plausible locations of Brønsted acid sites:
O1/O9, pointing into the centre of the 8-ring an adjacent pair of O2 atoms bearing a proton via hydrogen bonding O5 pointing slightly towards the side pocket O10 orientated towards the centre of the 12 membered ring
a) c)b) d)a) c)b) d)
Figure I-2 Brønsted acid site located in the main channel: a), b) and c) and in the side pockets d) (extracted from ref. 54).
Another study on proton-exchanged sodium mordenite in the presence of CO and pyridine55 confirmed Alberti's data and additionally found a new OH stretching band at ca. 3605 cm-1. For the protonated form of Mordenite, i.e. H-MOR, a weak adsorption band at 3744-47 cm-1 is attributed to terminal silanol groups. A stronger asymmetric band is located at 3609 cm-1 representing the Brønsted acid sites. Due to the last mentioned bands asymmetry one can divide it into a high frequency band (HF) at 3610-12 cm-1 and a low-frequency band (LF) at 3585 cm-1 corresponding to protons located in the main channel and in the side-pocket, respectively. The third band at 3605 cm-1 is assigned to a site located at the opening window between the main channels and the side pockets. The use of ordinary solid state 1H MAS NMR does not allow a detailed analysis of the different proton localisation within a H-MOR. Nevertheless, the two main peaks at ca. 4.4 and 2.2 ppm can be attributed to bridging Si-OH-Al groups, i.e. Brønsted acid sites, and non-acidic terminal silanol groups, respectively56.
Another fact making Brønsted acid sites difficult to localise, especially in aqueous media and at high temperatures, hence in natural environment during the reaction, is the high mobility of the acidic protons. Computationally, Tuma et al. reported this phenomenon, using an embedding scheme57 for the local correction at MP2 level to periodic DFT calculations58. This approach allows high accuracy in describing the reactive centre. Another study, employing 1H MAS NMR techniques concluded to a high mobility of Brønsted protons for high temperatures59 (up to 660 K) and at the same time a stationary behaviour for terminal silanol groups. This has been shown for H-ZSM-5, H-MOR and H-Y with activation energies of 45, 54, and 61 kJ/mol for the proton mobility, respectively.
11
2.2. Faujasite
Synthetically manufactured Zeolite Y and Zeolite X have the same crystal structure as
the faujasite mineral. They only differ in their Si/Al ratio, zeolite X having ratios between 1 and 1.5 whereas the Si/Al ratio of Y ranges from 1.5 to 3 or even above. Additionally low silica zeolite X (LSX) has been reported in literature60-62 having an Si/Al ratio of nearly 1. The faujasite framework (Figure I-1, b.1)) is build up by sodalite cages connected over hexagonal prisms (Figure I-1, b.2)). This gives rise to a so called supercage α, with a diameter of about 13 Å. The supercages are linked together with openings having a diameter of 7.4 Å. Four crystallographic different oxygen atoms are located in the structure: (i) oxygen 1 and 4 point into the supercage, (ii) oxygen 2 into the sodalite cage and (iii) and oxygen 3 into the hexagonal prism. Moreover, there are several occupation sites for extraframework cationic positions.
By dint of IR spectroscopy two bands, corresponding to hydroxyl stretching modes at
the Brønsted acid sites, can be observed for zeolite Y. The first band, i.e. a HF band, at 3643 cm-1 is assigned to the hydroxyl groups pointing into the supercage. These protons are located at O1. On the other hand, the protons at O2 and O3 evoke a LF band at 3547 cm-1 being located in the sodalite cage. The band at 3742 cm-1 is attributed to terminal silanol groups63. A detailed and accurate description of the proton positions in deuterated zeolite Y (D-Y) containing water and completely dehydrated D-Y and hydrogenated zeolite Y (H-Y) using high resolution neutron powder diffraction was reported by Czjzek et al.
64. They found and confirmed existing data65 that the preferred proton positions are located near the O1 and O3 framework oxygen atoms and the highest occupation of protons for a given sample, i.e. Na3H53Al56Si136O384 (Si/Al = 2.4) was to be found near O1. Moreover, the occupation order they found was O1 > O3 > O2 and no protons located at oxygen O4 in all their three samples. The widely used 1H MAS NMR characterization technique to analyze the Brønsted acid sites reveals the following results for HY66: (i) terminal Si-OH groups at δ = 1.8 – 2.3 ppm, (ii) acidic protons pointing towards the supercages at δ = 3.8 – 4.4 ppm (increases to 4.4 ppm with increasing Si/Al ratio and remains constant for Si/Al > 10 ppm ), (iii) acidic protons within the sodalite cages at δ = 5.2 ppm, (iv) ammonium ions – if still present after synthesis - at δ = 6.5 – 7.0 ppm and (v) hydroxyl groups of extra-framework aluminium (EFAL) at δ = 2.6 – 3.6 ppm. Moreover, by dint of 1H MAS NMR, van Santen et al
67., using NH3 as a probe
molecule, could show, that ammonium ions in the sodalite cages are observed at δ = 6.5 and δ = 8.1 ppm corresponding to the sites II' and I'; respectively. At low NH3 concentrations the proton exchange between an ammonium ion and an acid site in other cavities is slow. On the other hand, at high concentrations the proton jump68 can be fast resulting in an smaller chemical shift than δ = 8.1 ppm.
2.3. ZSM-5 (MFI framework)
The ZSM-5 zeolite which structural type corresponds to MFI, i.e. Mordenite Framework Inverted, was discovered in the end of 1960 by the Mobil Oil company and has the given chemical composition: Na2O Al2O3 2nSiO2 xH2O with n higher or equal six but also can attend values up to 1000, which corresponds to the nearly pure silica form, then called silicalite-1, and the aluminium atoms can be viewed as impurity.
12
The unit cell (Figure I-1, c.1)) contains 96 T sites (T = Si or Al) and 196 O sites as well as charge compensating ions depending on the Si/Al ratio, ranging from 12, i.e. ZSM-5, up to infinity69. ZSM-5 consists of interconnected cylindrical channels containing openings between 5.1 and 5.6 Å of two different types (Figure I-1, c.2)): (i) linear 10MR with pore openings of 5.3 x 5.6 Å as well as (ii) sinusoidal 10MR with openings of 5.1 x 5.5 Å. Their intersections form quasi spherical voids with a diameter of 8.0 to 9.0 Å. A step in the direction of determining the aluminium occupancy on the active T sites, which is a major task in zeolite science was recently evaluated by van Bokhoven et al. using X-ray standing waves (XSW) as an evaluation method, in particular for ZSM-570. By dint of XSW one can determine simultaneously the framework atom at the T site and the extraframework species in zeolites, i.e. the structure of the crystallite and the interfaces. The simulated aluminium distribution ρ(r) in ZSM-5, containing 12 non-equivalent T sites within the unit cell, along the three axes x, y and z, shows an equal occupancy of the T6, T7 and T10, T11 sites. Nevertheless, despite these findings, it still remains open how the protons are placed around the T sites. One has to keep in mind the complexity of the XSW method inasmuch synchrotron radiation has to be used in order to obtain these fine and precise information. Hence, this technique still remains limited in terms of an everyday use and the problem of finding the residual acid sides is not simplified and thus remains a matter of debate.
However, there are a few studies using IR (associated to microcalorimetric and electron spin resonance investigations71 or temperature-programmed desorption studies72) indicating three different adsorption peaks. The one at 3600 cm-1 corresponds to sites most probably located at the channel intersection (responsible for the adsorption of NH3 in the highly energetic γ state: desorption activation energy = 165 kJ/mol) whereas weaker IR bands are observed at 3720-3740 cm-1 (terminal silanols on the surface of the zeolite) and a smaller shoulder at 3665 cm-1 which was assigned to a ≡Si-OH adjacent to a trigonally coordinated Al.
2.4. Chabazite
The zeolitic Chabazite structure possess a wide range of composition on Si/Al and on the content of cations (Ca, Mg, K, Ba, Sr) within the cavities. The most common and not in nature available acidic aluminosilicate structure is SSZ-13 with an Si/Al ratio of 14 and was patented in 1985 by Chevron for its use in the methanol-to-olefin process which has a widespread application nowadays73-75.
The three dimensional structure consists of 4 and 6MR, where the double six-rings, i.e.
hexagonal prisms, are linked together via the four-rings. Hence, at each apex of the rhombohedral unit cell a hexagonal prism can be found where their interconnection leads to the so called chabazite cage. These cages (7.3 Å x 12 Å) are connected by smaller 8MR (3.8 Å x 3.8 Å) and thus allow only the diffusion of small molecules in and out of the pores giving rise to so called product shape selectivity76. The pure silica unit cell (Figure I-1, d.1)) contains 12T sites (T = Si or Al) and 24 oxygen atoms but due to its high symmetry only one inequivalent T site where Si can be replaced by an Al atom. Moreover, there are four crystallographic different oxygen atoms belonging to the following ring types (Figure I-1, d.2)): (i) oxygen 1, as part of the 4MR bridging between the two 6MR and points towards the chabazite cage, (ii) oxygen 2 is part of the hexagonal prism as well as of the 8MR connecting the chabazite cages, (iii) oxygen 3 is located in the 4MR linking the hexagonal prisms as well as part of the hexagonal prism pointing slightly towards the 6MR and (iv) oxygen 4 belonging to a 4MR of the hexagonal prism and pointing in the opening of the 8MR.
13
In a recent and very detailed study by the aid of FTIR and CO as a probe molecule Bordiga et al. were able to identify two families of OH-groups77. The LF band at 3584 cm-1 can be attributed to the proton sited at O3 where its lower stretching mode can be assigned to a slight interaction with the 6MR of the hexagonal prism. Hence, this "confined" proton is the only one belonging to this family. O1, O2 and O4 on the other hand are members of the HF family with a stretching frequency of 3616 cm-1 since they all point into the 8MR ring openings connecting the chabazite cages.
The experimental characterization of Brønsted acid sites in the four chosen zeolites
shows that some non-ideal (Si-OH-Al) sites can be present at the surface (external silanols) or within the pores (EFAL, silanol nests), all resulting from synthesis or crystallisation conditions. This is the illustration of the presence of defects within the crystalline solids, which is very hard to avoid. Hence, a better knowledge on the structure and formation mechanisms of these defects is required to understand the physico-chemical behaviour of such materials. The next section introduces and presents extraframework species created during various treatment conditions and the resulting structural defects accompanying it.
3. Post-synthetic modified zeolites: synthesis methods and
resulting properties
3.1. Experimental synthesis methods
3.1.1. Dealumination
The atomistic Si/Al framework ratio of zeolites is an important factor impacting the
zeolites properties such as thermal and hydrothermal stability, concentration and strength of Brønsted acid sites, catalytic activity and selectivity. It is obvious that with an increased Si/Al ratio the concentration of acid sites diminishes. Zeolites containing a low aluminium concentration are in general thermally and chemically more stable, which is especially desired when used in the fluid catalytic cracking process as acid catalysts. In general, the framework Si/Al ratio of zeolites prepared by direct synthesis is restricted to certain limits. As an example, FAU zeolite cannot be directly, i.e. in an economically reasonable time, synthesized with a Si/Al ratio higher than 3. Thus, to obtain high silica zeolite Y, i.e. ultrastable zeolite Y (USY), one has to treat the synthesized parental zeolite by dealumination methods.
Barrer and Makki are the first researchers who reported this post-synthetic treatment
of zeolites in the early 1960s78. Then, McDaniel and Maher reported a method to increase the thermal stability of zeolite Y were in the late 1970's79. Their so called "ultra-stabilisation" process consists of two major steps, i) a nearly complete removal of sodium ions by ammonium exchange with discontinuous heating and ii) a conversion of the obtained zeolite by heat treatment at T > 800 °C to obtain a faujasite being resistant to temperatures up to 1000 °C. However, the tribute for the description of the mechanism goes to Kerr80 who showed that the water formed during the thermal dehydroxylation of the hydrogenated form of the zeolite plays a major role in the ultra-stabilisation. Though, if hydrogenated zeolite Y reacts with water at higher temperatures an immense hydrolysis of the framework aluminium occurs resulting in the collapse of the framework since too many Si-O-Al bonds are broken resulting in the formation of hydroxyl nests and EFAL. But, if the reaction with water is done
14
simultaneously with the deamination, a crystalline and mesoporous solid is obtained. It is assumed that hydroxylated aluminium, Al(OH)3, as an intermediate can react with other acid sites resulting in the creation of new cationic forms within the zeolite. This Al(OH)3 can react further, giving rise to Al(OH)2+ and Al3+ ions81.
In general, the dealumination protocols which can be seen in the literature more often are led: - in vapour phase, either by thermal treatment, possibly with water vapour (steaming)24 - in solution, by acid leaching or hydrothermal treatment82
Note that true substitution reactions between the framework aluminium and the dealumination agent can also be aimed at (re-silication by SiCl4 for example83). This last mentioned point is out of the scope of the present review and will not be expatiated in what follows.
However, dealumination of the framework can sometimes lead to the loss of the
structure. Acidic low-silica zeolites are unstable upon thermal treatment (e.g. ion exchange with 0.1 M ammonium nitrate for 1 h under reflux, washed with deionised water, calcination for 5h at 550 °C24) and even mild hydrothermal treatments (e.g. varying temperatures (500 – 700 °C) under variant water vapor pressures84) cause the loss of crystallinity85.
3.1.2. Desilication
Already in the late 1980s, Aouali et al. discussed the silicon removal from zeolite Y
by dint of alkaline solutions at different pH levels at 80 °C86. Principally, the desilication process of zeolitic framework should follow the same pattern as the dealumination, i.e., in the same type of lattice defects and mesopore formation. Compared to the strong efforts made over the last five decades in analyzing the dealumination and re-alumination of zeolites, the desilication attracted only in recent years more and more attention as a post-synthetic way to introduce mesoporosity within zeolites20-22, 87-91. The main difference in this method compared to the dealumination lies in the leaching method by alkaline solutions.
Variations of a large set of parameters during the alkaline treatment were investigated: nature of the base (e.g. NaOH or Na2CO3), pH, presence of organic additives to better control the propagation of desilication23, 92. Generally, a zeolite framework contains more silicon than aluminium and hence it would be easier to create an interconnected network of micro-and mesopores upon silicon removal. Within this context, Groen et al.
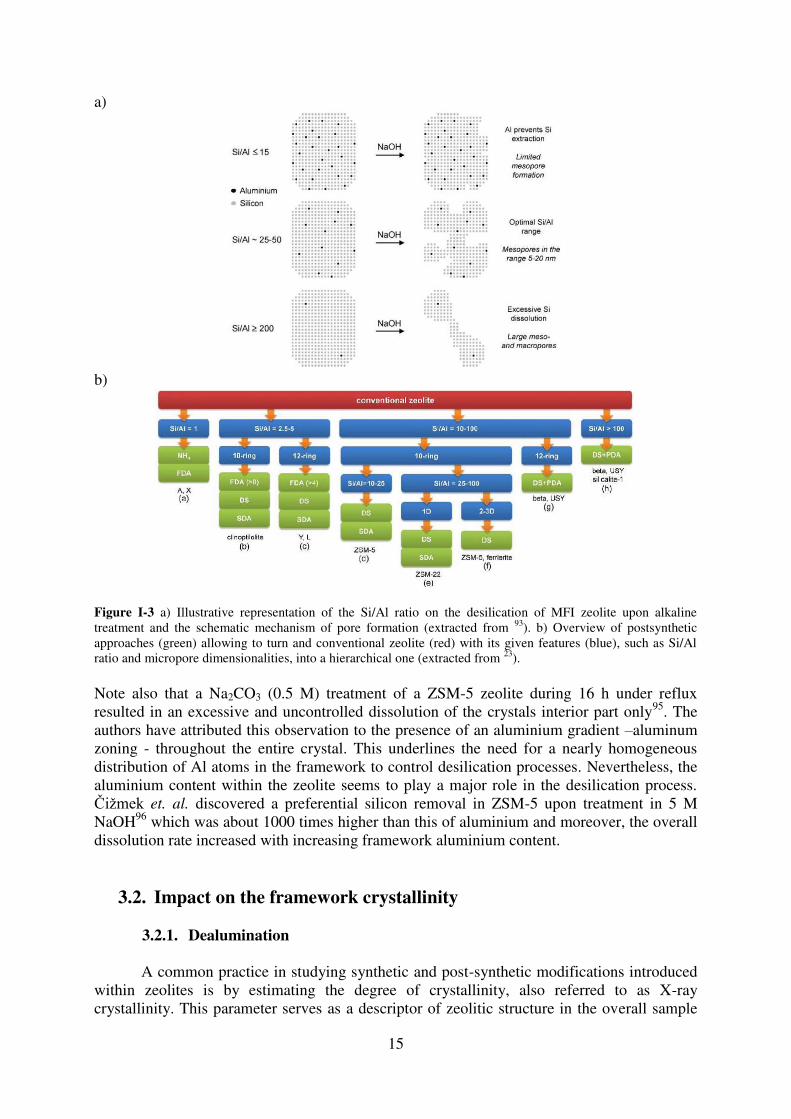
93 showed an optimal aluminium-assisted mesopore formation for MFI type zeolites upon desilication in alkaline medium. They found an optimal Si/Al ratio of ~20-50 where mesopores in the range of 5-20 nm are generated (Figure I-3a)). Above this ratio the aluminium atoms prevent a Si extraction, resulting in a limited mesopore formation, whereas for very high Si/Al ratios an excessive Si dissolution occurs displaying large meso- and macropores within the zeolite's structure.
A very recent study by Pérez-Ramirez et. al. stresses the importance of additional post-synthetic treatment steps94. Without these steps hierarchical MFI type zeolites for instance, can only be obtained by NaOH treatment for Si/Al ratios of 25-50. For Si/Al ratios of 10-20 and additional step of HCl washing is necessary whereas for Si/Al ratios of 100-∞ the addition of PDAs to the alkaline solution is used to guarantee also in these ranges of Si/Al ratios well manageable mesopores without dissolution of the zeolite crystal or obtaining limited mesopore formation. Combining this knowledge with that of preferred dealumination conditions, a global strategy for generating hierarchical zeolites, depending on the Si/Al ratio and the structure of the zeolites was established, summarized in Figure I-3b)23.
15
a)
b)
Figure I-3 a) Illustrative representation of the Si/Al ratio on the desilication of MFI zeolite upon alkaline treatment and the schematic mechanism of pore formation (extracted from 93). b) Overview of postsynthetic approaches (green) allowing to turn and conventional zeolite (red) with its given features (blue), such as Si/Al ratio and micropore dimensionalities, into a hierarchical one (extracted from 23). Note also that a Na2CO3 (0.5 M) treatment of a ZSM-5 zeolite during 16 h under reflux resulted in an excessive and uncontrolled dissolution of the crystals interior part only95. The authors have attributed this observation to the presence of an aluminium gradient –aluminum zoning - throughout the entire crystal. This underlines the need for a nearly homogeneous distribution of Al atoms in the framework to control desilication processes. Nevertheless, the aluminium content within the zeolite seems to play a major role in the desilication process. Čižmek et. al. discovered a preferential silicon removal in ZSM-5 upon treatment in 5 M NaOH96 which was about 1000 times higher than this of aluminium and moreover, the overall dissolution rate increased with increasing framework aluminium content.
3.2. Impact on the framework crystallinity
3.2.1. Dealumination
A common practice in studying synthetic and post-synthetic modifications introduced
within zeolites is by estimating the degree of crystallinity, also referred to as X-ray crystallinity. This parameter serves as a descriptor of zeolitic structure in the overall sample
16
and is usually evaluated using X-ray powder diffraction patterns and comparing them to diffractogamms of a reference zeolite. Van Niekerk et al.
97 found that by dint of nitric acid, the degree of dealumination and the number of extraframework species remaining within the zeolites cavities was strongly influenced by the size of the crystal and that dealumination is linked to a partial loss of its crystallinity. However, it is also obvious that aluminium-rich zeolites, upon dealumination, form high lattice defects concentrations resulting in a lower stability of the crystal structure. Faujasite type zeolites displayed a complete structural collapse upon treatment with mineral acids and a similar behaviour was to be observed for Na-mordenite83. Ha et al. showed that for MOR containing different Si/Al ratio the unit cell parameters are not equal98. Furthermore they used different types of pretreatment, i.e. heating at 500 °C with varying time and vapour conditions to favour the dealumination and to obtain different Si/Al ratios. Zeolites containing fewer framework Al atoms per unit cell show a slight contraction in each cell parameter (maximum of 0.2 Å for the b-axis) compared to low Si/Al ratio zeolites.
One has to keep in mind that zeolites contain charge compensating cations such as sodium. Thus this influences the unit cell parameters too, as the cations are located in the cavities and voids of a zeolite. Hence, the unit cell parameters are very sensitive on the framework Al content and slightly sensitive to the counter ions residing within the voids99. Hong et al. used different zeolite types under thermal treatment to favour dealumination but without acid leaching. They observed that the residual EFAL within the pores do not lead to a unit cell dilatation. By contrast, the removal of framework Al reflects itself in a slight contraction of the unit cell parameters100. A more detailed study with a broader spectrum of dealuminated mordenites containing different Si/Al ratios, was shown by Olsson et al. where they could correlate each cell parameter change to this ratio99. As a general outline one can say that a and c axes are the less affected upon dealumination. From a Si/Al ratio 1 to 7 the maximum change is approximately 0.1 and 0.06 Å for a and c, respectively. On the other hand in the same Si/Al range the cell parameter b shows a variation of about 0.2 Å. By dint of X-ray diffraction data of Olsson et al. and the plots of the lattice parameters versus Al/(unit cell) a strongly non-linear behaviour has been found. On the basis of structural projections in the respective directions they could find that the Al atoms on T3 and T4 (see Figure I-1) are being removed only with difficulty and often linked to structural collapse of the mordenite framework.
3.2.2. Desilication
Aouali et al.
86 analysed the structural evolution of dealuminated faujasite Y amongst others using basic solutions. The removal of silicon from the zeolites framework up to pH = 12 and at moderate temperatures resulted in an increase of the unit cell parameters since the framework Si/Al ratio is decreased (explainable by the reinsertion of EFAL into the framework). Moreover, for one zeolitic sample they found a new phase, which they identified as sillimanite (Al2SiO5) and which coexists besides the damaged parental zeolite. According to their findings, i.e., diffraction patterns of the sample, an assumption for the formation of sillimanite is the origin of amorphous silica present in the parental zeolite. According to the findings of Mao et al.
101 for the zeolites Na-Y, Na-X and ZSM-5 and after removing silicon atoms from the framework no drastic changes occurred concerning the structure and the degree of crystallinity. Other studies using alkaline treatment at varying concentrations, temperature and reaction time upon different zeolites (ZSM-5, ZSM-12, Beta, hierarchical Y, USY, MOR), could generally confirm these findings22, 26, 27, 102-104. Additionally, an overall increase of the surface area with accompanying mesopore formation has been found
17
indicating a migration of extraframework species to the exterior surface and an internal migration of T atoms (T: Si, Al) filling up the vacancies and hence being the cause of intrazeolite mesopore formation. However, XRD analyses and unit cell volume measurements demonstrate no drastic changes compared to the parental zeolite. Additionally, from microporosity measurements, they observed a slight micropore narrowing and the appearance of a secondary pore system, which they assigned to the result of a healing process (Si migration from framework positions) occurring after desilication. It is assumed with high probability that lattice vacancies created during the desilication could be filled up in the same way and under similar conditions as those created by dealumination (T-jump mechanism105,
106). Hence, a re-crystallisation of the desilicated and partially amorphized zeolite to a product with well-ordered crystal structure and nano pores is apparently effected by water vapour. This water vapour is a product of the dehydroxylation of hydroxyl nest, re-condensing and leading to a local re-crystallisation.
3.3. Mesopore formation and enhanced zeolite features
The well-defined pore sizes and geometries make hierarchical zeolites resistant towards harsh reaction conditions and suitable for many catalytic reactions. Although both methods, i.e. desilication and dealumination are easy in mechanical handling and are known to enhance molecular transport properties, not much is known about the location, distribution and size of the obtained intrazeolite mesopores.
3.3.1. Dealumination
Karwacki et al. used the combination of focus ion beam (FIB) and scanning electron
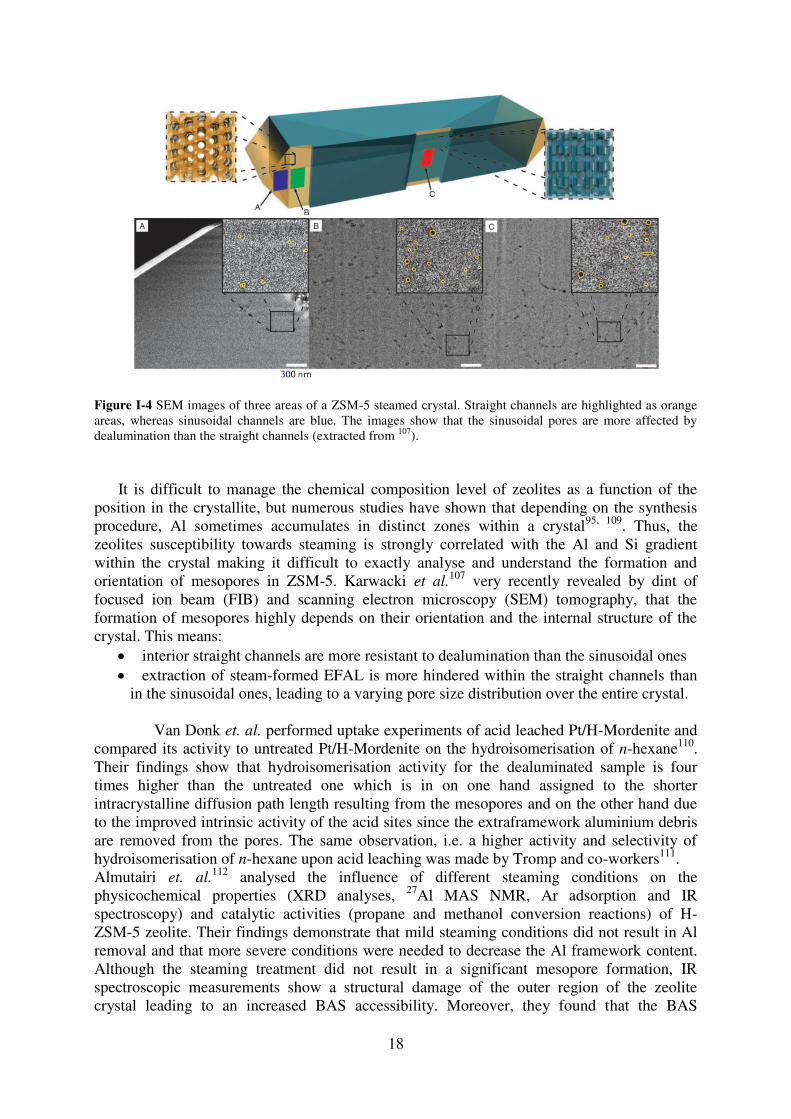
microscopy (SEM) to characterise coffin-shaped ZSM-5 crystals by determining the type of mesopores obtained by steaming reactions (length, width, morphology)107. From previous studies108 they found for the ZSM-5 parental crystal straight and sinusoidal channels open towards the crystal exterior and parallel to the crystal surface. The steamed ZSM-5 probe shows significant changes in the crystal structure resulting in the formation of vast areas of mesopores. One can observe a non-uniform distribution upon the steam treated ZSM-5. The tip region of the crystal (region A, cf. Figure I-4) contains a smaller number of formed mesopores than the side and middle regions, B and C respectively, which leads to the conclusion that the sinusoidal pores are more affected by dealumination than the straight channels. Upon dealumination the entire crystal volume displays a mesopore generation. Moreover the diameter and amount of the generated pores showed a significant dependency on the location over the entire crystal region. The average diameters in the regions A, B and C (Figure I-4) are 6.2, 8.2 and 8.0 nm respectively and a statistical analysis of steamed crystals showed that region A contains about 23% of the overall mesopores, whereas the other 40% and 37% are located in regions B and C, respectively. Moreover, they could find that nearly all mesopore sizes over the entire crystal do not exceed 10 nm in diameter.
18
Figure I-4 SEM images of three areas of a ZSM-5 steamed crystal. Straight channels are highlighted as orange areas, whereas sinusoidal channels are blue. The images show that the sinusoidal pores are more affected by dealumination than the straight channels (extracted from 107).
It is difficult to manage the chemical composition level of zeolites as a function of the position in the crystallite, but numerous studies have shown that depending on the synthesis procedure, Al sometimes accumulates in distinct zones within a crystal95, 109. Thus, the zeolites susceptibility towards steaming is strongly correlated with the Al and Si gradient within the crystal making it difficult to exactly analyse and understand the formation and orientation of mesopores in ZSM-5. Karwacki et al.
107 very recently revealed by dint of focused ion beam (FIB) and scanning electron microscopy (SEM) tomography, that the formation of mesopores highly depends on their orientation and the internal structure of the crystal. This means:
interior straight channels are more resistant to dealumination than the sinusoidal ones extraction of steam-formed EFAL is more hindered within the straight channels than
in the sinusoidal ones, leading to a varying pore size distribution over the entire crystal. Van Donk et. al. performed uptake experiments of acid leached Pt/H-Mordenite and compared its activity to untreated Pt/H-Mordenite on the hydroisomerisation of n-hexane110. Their findings show that hydroisomerisation activity for the dealuminated sample is four times higher than the untreated one which is in on one hand assigned to the shorter intracrystalline diffusion path length resulting from the mesopores and on the other hand due to the improved intrinsic activity of the acid sites since the extraframework aluminium debris are removed from the pores. The same observation, i.e. a higher activity and selectivity of hydroisomerisation of n-hexane upon acid leaching was made by Tromp and co-workers111. Almutairi et. al.
112 analysed the influence of different steaming conditions on the physicochemical properties (XRD analyses, 27Al MAS NMR, Ar adsorption and IR spectroscopy) and catalytic activities (propane and methanol conversion reactions) of H-ZSM-5 zeolite. Their findings demonstrate that mild steaming conditions did not result in Al removal and that more severe conditions were needed to decrease the Al framework content. Although the steaming treatment did not result in a significant mesopore formation, IR spectroscopic measurements show a structural damage of the outer region of the zeolite crystal leading to an increased BAS accessibility. Moreover, they found that the BAS
19
concentration determines the catalytic property of the methanol conversion. Parent and mildly steamed samples displayed a higher rate of deactivation because of consecutive reactions leading to the creation of coke, deactivating the catalyst. Severely steamed zeolites on the other hand increase the amount of methanol converted per BAS. The same enhanced catalytic activity of more severely steamed H-ZSM-5 compared to parent zeolites was found by Sheng et. al.
113 for ethanol dehydration to ethylene. Mesoporous catalysts contained less coke deposition than its microporous counterpart.
3.3.2. Desilication
The first publication highlighting desilication and thus mesopore formation in ZSM-5
zeolites using basic aqueous conditions was in 2000 from Ogura et al.114 and subsequent studies by Groen et al. 20, 21, 93, 115 confirmed that controlled desilication leads to intracrystralline mesopore formation. By analyzing synthesis parameters such as time, stirring speed, temperature but also intrinsic material specific ones like Si/Al ratio, crystal size and different framework type, they could find that framework aluminium determines zeolites properties after alkaline treatment115. Hence, the framework aluminium concentration has an important role as pore-directing agent in post-synthetic treatments21. The desilication displays the same pattern concerning the bimodal or multimodal pore structure as the dealumination. A typical mesopore size within ZSM-5 after desilication in aqueous basic medium is around 10 nm20. Interestingly, the existence of framework Al atoms in different T site positions that are more or less susceptible to basic conditions and the occurrence of re-alumination may be explanations for the influence of Al onto the desilication process and hence the mesopore formation21. The presence of EFAL (obtained by steaming methods) within the cavities, inhibits the Si extraction and the accompanied mesopore formation. This can be explained by the re-alumination process of the EFAL occurring during alkaline treatment115. Thus, the term desilication is not strictly correct: indeed even though silicon is preferentially removed in alkaline solutions, aluminium is also re-introduced in the framework raising the question: does the framework and the Al distribution or re-introduced aluminium play a role in the mesopore formation? Recently, Pérez-Ramirez et al. showed that the formation of mesopores is influenced by the addition of pore directing agents (PDA), i.e., adding tetraalkylammonium cations to the alkaline medium89, 116. This yielded in, e.g. better preserved micropore volume and a smaller mesopore size of 5 nm instead of 10 nm. Considering the formation of mesopores in zeolites, MFI, mordenite, BEA and ferrierite are very susceptible to desilication20. Upon this method, time and temperature play an important role in tailoring the mesopore size and so the porous volume. Very recently Holm et al. examined in a very detailed study, employing FT-IR using CO and collidine as probe molecules, a series of desilicated H-ZSM-5 catalysts117 showing a selective mechanism for the mesopore formation since the framework dissolution preferentially takes place at defect sites (i.e. internal silanols). Additionally an improved catalytic activity towards the methanol-to-gasoline reaction due to the aforementioned posterior introduced mesopores118 have been demonstrated. In the same context of accessibility of mesopores by dint of various alkylpyridines probe molecules, Pérez-Ramirez et al. could derive an accessibility index (ACI) from IR-spectroscopy of alkylpyridines to quantify the accessibility of enhanced acid sites in mesopore containing zeolites119. Their findings show that the higher the mesopores surface area of ZSM-5, the higher the ACI indicating that also Lutidine and Collidine can enter the zeolite pores contrary to non-treated counterparts. Moreover, these hierarchical ZSM-5 zeolites display improved catalytic activity in shape selective xylene isomerisation120 and methanol to olefin reaction121 compared to purely microporous ones122.
20
Groen et al. found an intermediate Si/Al ratio, which is situated in the optimal molar Si/Al range (25-50) leading to an optimal mesopore formation with pore sizes centered around 10 nm115. At lower framework Si/Al ratios the high amount of framework Al inhibits the extraction of Si and nearly no mesopores are created. Moreover, the presence of EFAL species, as a result of steaming treatments, inhibits the Si extraction and the related mesopore formation, since a reinsertion of hydrolysed EFAL occurs during NaOH treatment. Additionally, Groen et al. could show that in alkaline medium treated zeolites, MOR and MFI, displayed a significant mesopore formation by dint of adsorption studies and tunnel electron microscopy20, 21. As the MFI framework exhibits relatively large interconnected pores this leads to a relatively good transport of hydroxyl ions within the channels for the hydrolysis of Si-O-Si bonds and the consequently formed extraframework species are better eliminated through the pores. On the contrary, MOR requires more severe treatment conditions resulting in a partial deformation and dissolution of the outer crystal surface but leading to the creation of larger mesopores compared to MFI. Moreover, van Laak et al. showed for mordenite that a sequential acid and alkaline treatment123 was the most effective approach to obtain mesoporous mordenite, where the mesopore formation started close to the external surface and propagated towards the centre. Additionally an increased activity for the liquid-phase alkylation of benzene was found, mainly attributed to the larger intra-crystalline mesopores but also to the Si/Al ratio at higher porosities.
For both dealumination and desilication processes, some characterizations were reported in this part for the species obtained, the mesopores formed and the enhanced catalytic activity and selectivity. Some rules were established for the optimization of extra-framework species formation. However, the molecular mechanisms of the complex transformations involved are far from being clear by now. A better knowledge is thus still required in this field to provide rational tools for a better control of such treatments.
3.4. Structural defects and extraframework species
Different types of bulk defects are usually encountered within zeolites, e.g. structural
defects, due to the lack of a chemical bond between two vicinal TO4 tetrahedra resulting in the formation of T-OH groups, structural defects occurring by reason of missing T atoms with formation of hydroxyl nests. These bulk defects affect in a large extent the properties such as ion exchange, adsorption and catalytic properties. To analyse these defects, either in as-synthesized or post synthetically modified zeolites, one uses high resolution solid state NMR spectroscopy of 29Si, 1H and 27Al and FT-IR spectroscopy. Moreover, due to these treatments extraframework species are generated such as extraframework aluminium (EFAL) and extraframework silicon (EFSI) simultaneously the zeolitic structure evolves and hydroxyl nests, especially silanol nests are created. These silanol nests, surrounding vacant tetrahedral sites are stabilised by a network of hydrogen bonds117: every Si-OH group is bonded via a hydrogen bond to an oxygen atom of a neighbouring OH group. Since the nature and changes of these species are of great importance for the understanding of the catalytic process of hierarchical zeolites13, there lies a great interest in studying them.
3.4.1. Extraframework aluminium (EFAL)
A variety of different experimental techniques were applied to analyse and
characterize the local environment of Al, such as 27Al magic angle spinning (MAS)-NMR124, X-ray absorption spectra (XAS), X-ray powder diffraction (XRPD)125 and X-ray absorption near-edge spectroscopy (XANES)126, and the evaluation of hydroxyl bands in IR-spectra.
21
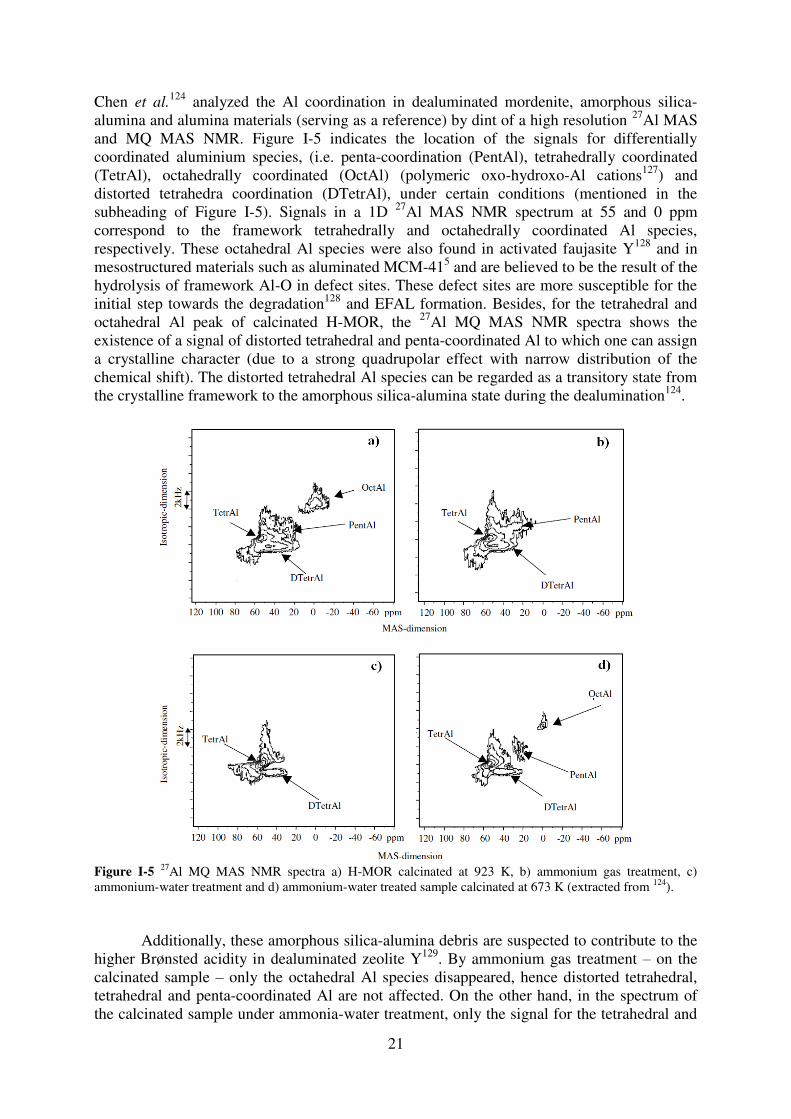
Chen et al.124 analyzed the Al coordination in dealuminated mordenite, amorphous silica-
alumina and alumina materials (serving as a reference) by dint of a high resolution 27Al MAS and MQ MAS NMR. Figure I-5 indicates the location of the signals for differentially coordinated aluminium species, (i.e. penta-coordination (PentAl), tetrahedrally coordinated (TetrAl), octahedrally coordinated (OctAl) (polymeric oxo-hydroxo-Al cations127) and distorted tetrahedra coordination (DTetrAl), under certain conditions (mentioned in the subheading of Figure I-5). Signals in a 1D 27Al MAS NMR spectrum at 55 and 0 ppm correspond to the framework tetrahedrally and octahedrally coordinated Al species, respectively. These octahedral Al species were also found in activated faujasite Y128 and in mesostructured materials such as aluminated MCM-415 and are believed to be the result of the hydrolysis of framework Al-O in defect sites. These defect sites are more susceptible for the initial step towards the degradation128 and EFAL formation. Besides, for the tetrahedral and octahedral Al peak of calcinated H-MOR, the 27Al MQ MAS NMR spectra shows the existence of a signal of distorted tetrahedral and penta-coordinated Al to which one can assign a crystalline character (due to a strong quadrupolar effect with narrow distribution of the chemical shift). The distorted tetrahedral Al species can be regarded as a transitory state from the crystalline framework to the amorphous silica-alumina state during the dealumination124.
Figure I-5 27Al MQ MAS NMR spectra a) H-MOR calcinated at 923 K, b) ammonium gas treatment, c) ammonium-water treatment and d) ammonium-water treated sample calcinated at 673 K (extracted from 124).
Additionally, these amorphous silica-alumina debris are suspected to contribute to the higher Brønsted acidity in dealuminated zeolite Y129. By ammonium gas treatment – on the calcinated sample – only the octahedral Al species disappeared, hence distorted tetrahedral, tetrahedral and penta-coordinated Al are not affected. On the other hand, in the spectrum of the calcinated sample under ammonia-water treatment, only the signal for the tetrahedral and
22
distorted tetrahedral Al remain. One should keep in mind, that the presence of tetrahedrally (approx. 55 ppm) and distorted tetrahedrally Al (approx. 20 ppm) does not necessarily mean, that the corresponding species are part of the framework since basic conditions can transform penta-coordinated and octahedral Al to tetrahedral ones. All these findings indicate a very complicated interplay between framework and non-framework species occurring during the dealumination.
The dealumination of mordenite with acids, such as HCl and HNO3, was monitored by 27Al and 29Si MAS NMR by Bodart et al.
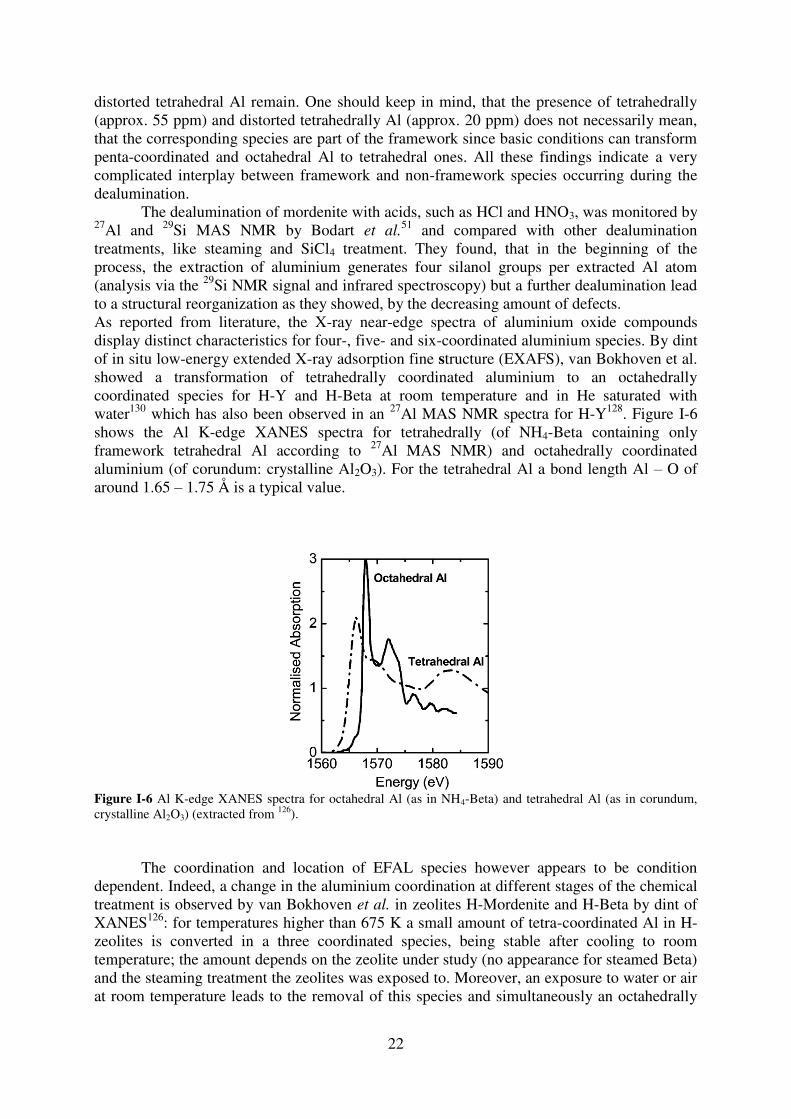
51 and compared with other dealumination treatments, like steaming and SiCl4 treatment. They found, that in the beginning of the process, the extraction of aluminium generates four silanol groups per extracted Al atom (analysis via the 29Si NMR signal and infrared spectroscopy) but a further dealumination lead to a structural reorganization as they showed, by the decreasing amount of defects. As reported from literature, the X-ray near-edge spectra of aluminium oxide compounds display distinct characteristics for four-, five- and six-coordinated aluminium species. By dint of in situ low-energy extended X-ray adsorption fine structure (EXAFS), van Bokhoven et al. showed a transformation of tetrahedrally coordinated aluminium to an octahedrally coordinated species for H-Y and H-Beta at room temperature and in He saturated with water130 which has also been observed in an 27Al MAS NMR spectra for H-Y128. Figure I-6 shows the Al K-edge XANES spectra for tetrahedrally (of NH4-Beta containing only framework tetrahedral Al according to 27Al MAS NMR) and octahedrally coordinated aluminium (of corundum: crystalline Al2O3). For the tetrahedral Al a bond length Al – O of around 1.65 – 1.75 Å is a typical value.
Figure I-6 Al K-edge XANES spectra for octahedral Al (as in NH4-Beta) and tetrahedral Al (as in corundum, crystalline Al2O3) (extracted from 126).
The coordination and location of EFAL species however appears to be condition dependent. Indeed, a change in the aluminium coordination at different stages of the chemical treatment is observed by van Bokhoven et al. in zeolites H-Mordenite and H-Beta by dint of XANES126: for temperatures higher than 675 K a small amount of tetra-coordinated Al in H-zeolites is converted in a three coordinated species, being stable after cooling to room temperature; the amount depends on the zeolite under study (no appearance for steamed Beta) and the steaming treatment the zeolites was exposed to. Moreover, an exposure to water or air at room temperature leads to the removal of this species and simultaneously an octahedrally
23
coordinated Al appears. This octahedral species connected to the framework is unstable at temperatures higher than 395 K, where it readopts tetrahedral coordination. This would suggest either:
(i) the EFAL species loses part of their coordination sphere under increase of temperature, down to AlIII (breaking/elongation of the weakest bond being Al...OH-Si at very high temperatures)
(ii) the EFAL generated at room temperature is integrated back in the framework at high temperature, and that one of the four Al-O bond is more sensitive than the others to a further increase of the temperature
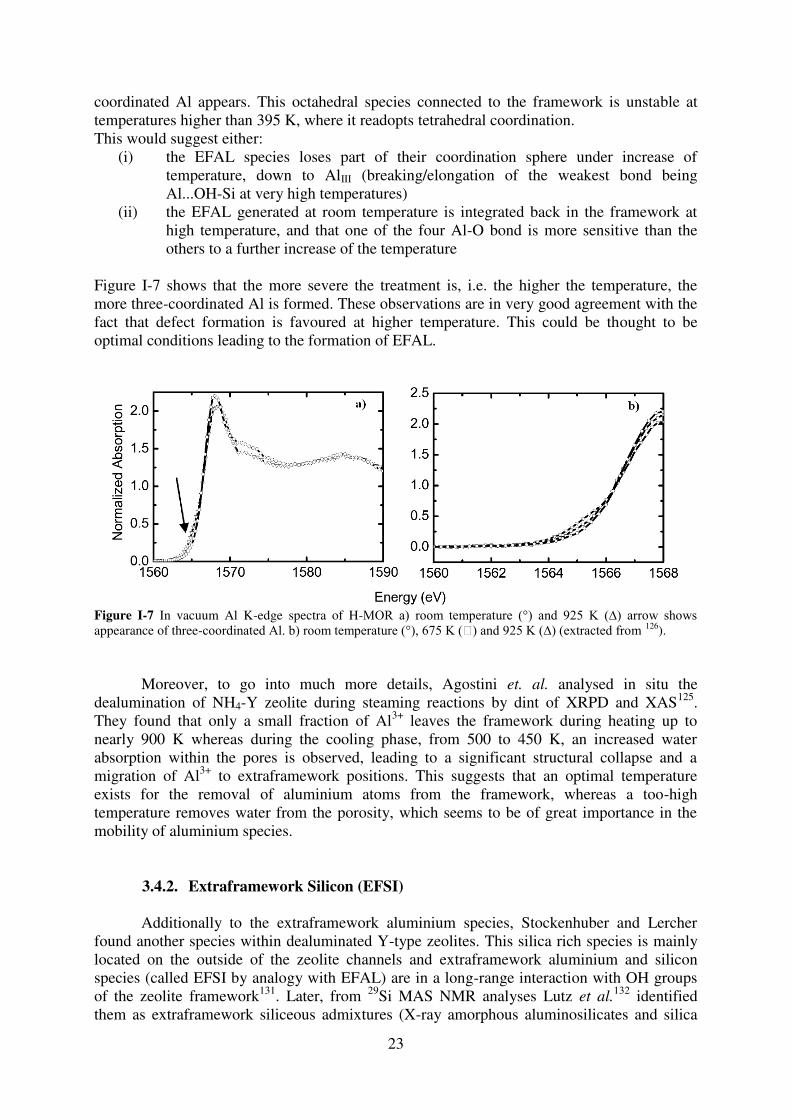
Figure I-7 shows that the more severe the treatment is, i.e. the higher the temperature, the more three-coordinated Al is formed. These observations are in very good agreement with the fact that defect formation is favoured at higher temperature. This could be thought to be optimal conditions leading to the formation of EFAL.
Figure I-7 In vacuum Al K-edge spectra of H-MOR a) room temperature (°) and 925 K (∆) arrow shows appearance of three-coordinated Al. b) room temperature (°), 675 K () and 925 K (∆) (extracted from 126).
Moreover, to go into much more details, Agostini et. al. analysed in situ the dealumination of NH4-Y zeolite during steaming reactions by dint of XRPD and XAS125. They found that only a small fraction of Al3+ leaves the framework during heating up to nearly 900 K whereas during the cooling phase, from 500 to 450 K, an increased water absorption within the pores is observed, leading to a significant structural collapse and a migration of Al3+ to extraframework positions. This suggests that an optimal temperature exists for the removal of aluminium atoms from the framework, whereas a too-high temperature removes water from the porosity, which seems to be of great importance in the mobility of aluminium species.
3.4.2. Extraframework Silicon (EFSI)
Additionally to the extraframework aluminium species, Stockenhuber and Lercher
found another species within dealuminated Y-type zeolites. This silica rich species is mainly located on the outside of the zeolite channels and extraframework aluminium and silicon species (called EFSI by analogy with EFAL) are in a long-range interaction with OH groups of the zeolite framework131. Later, from 29Si MAS NMR analyses Lutz et al.
132 identified them as extraframework siliceous admixtures (X-ray amorphous aluminosilicates and silica
24
gel) and experimentally for the first time Dimitrijevic et al. even found the growth of kaolinite (and probably metakaolinite) and amorphous silica gel, by dint of XRD analyses29.
In a 29Si MAS NMR spectra of different parental NaY samples with framework silicon Si(nAl) of different building units (n = 0 – 4) the range of the chemical shifts is from -84 to -108 ppm and one can assign them as followed (values extracted from 133): i) δSi(0Al) ~ -108 ppm, ii) δSi(1Al) ~ -98 to -104 ppm, iii) δSi(2Al) ~ -95 ppm, iv) δSi(3Al) ~ -88 ppm, v) δSi(4Al) ~ -84 ppm. After steaming the peak positions are shifted to higher values and the ones for Si(4Al), Si(3Al) and Si(2Al) decrease whereas the ones for Si(1Al) and Si(0Al) increase explaining the formation of silanol nest left behind by the extraction of framework aluminium. The appearance of two shoulders [first: between – 80 and – 90 ppm (Si(4Al)); second: about – 112 ppm (Si(0Al))] corresponding to an internal change of the framework structure attributed to the formation of extraframework siliceous species.
All the aforementioned examples for EFAL and EFSI formation were obtained upon
dealumination treatments. For the desilication and the further analysis of extra-framework species only few papers exist in the literature. Mainly the works of Lutz et al. must be cited here 32, 134. Their results of parental, steamed and leached zeolite Y by different demetallation procedures32 show that EFAL formation occurs only during steam treatment (26.1 [AlO2] units composed of 8.3 [AlO2] units as monomers and 17.8 [AlO2] units as polymers) and not upon acid leaching. However, upon steaming and acid treatment a fraction of 9.5 polymeric [SiO2] units are detected and this fraction nearly doubles upon alkaline or combined acid-base treatment. In a very recent publication134 they showed that EFAL species and Q2 and Q3 EFSI as well as silicon-rich parts of the zeolite framework are transformed into X-ray amorphous aluminosilicates in all KOH treated USY samples.
4. Mechanistic approaches of defect formation in zeolites
4.1. Mechanism of Marcilly for dealumination
All the aforementioned microscopic studies resulting from dealumination and desilication, i.e. post-synthetical treatment, are preliminary steps to a microscopic analysis and to the understanding of the mechanism of mesopore formation. Figure I-8 shows in a schematic way the main phenomena occurring during dealumination, which is the synthesis of a large set of studies. We will call this mechanism as "the mechanism of Marcilly"1 referring to the name of the IFPEN researcher who proposed it earlier. The first step is the Al removal from its framework positions leaving atomic gaps and silanol nests behind. Since the Al distribution over the entire crystal is assumed to be randomly, but as a consequence of the Löwenstein's rule, this first step does not create the desired mesopores, but rather atomic gaps. With the second step Marcilly proposed that the Si atoms, coming from amorphous silica-alumina debris created during zeolites synthesis or more probably from small zones where the crystal structure has been partially degraded, as a result of the dealumination, tend to migrate and refill the atomic gaps.
The extracted Al atoms are not necessarily removed from the zeolite cavities but remain within the micropores/mesopores as, for instance, cations (Al3+, AlO+) and neutral or charged, to a certain degree polymerized, hydroxyaluminates (Al(OH)2+, Al(OH)2
+ AlOOH, Al(OH)3)
135. Moreover, it was shown that this Al(OH)3 can react further, giving rise to Al(OH)2+ and Al3+ ions81which interact with Brønsted acid sites resulting in an enhanced acidity. Additionally to the extraframework aluminium species framework vacancies and mesopores are generated. Per extracted aluminium atom a hydroxyl nest is created and as
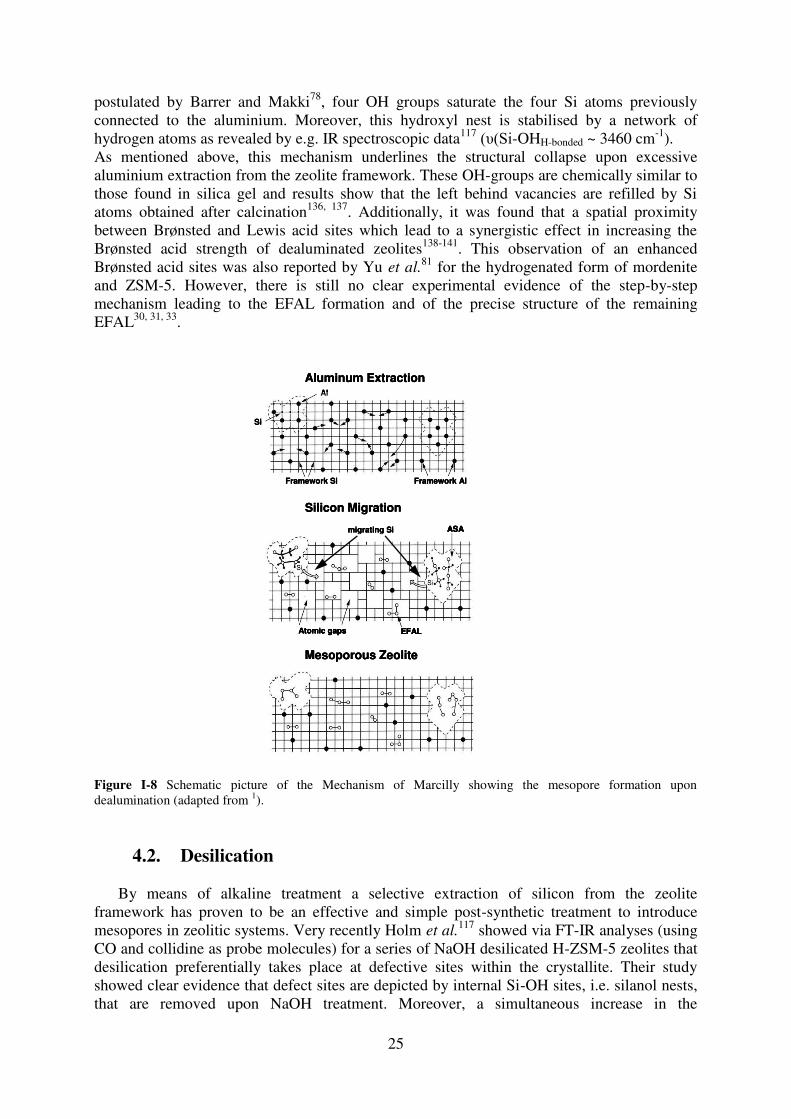
25
postulated by Barrer and Makki78, four OH groups saturate the four Si atoms previously connected to the aluminium. Moreover, this hydroxyl nest is stabilised by a network of hydrogen atoms as revealed by e.g. IR spectroscopic data117 (υ(Si-OHH-bonded ~ 3460 cm-1). As mentioned above, this mechanism underlines the structural collapse upon excessive aluminium extraction from the zeolite framework. These OH-groups are chemically similar to those found in silica gel and results show that the left behind vacancies are refilled by Si atoms obtained after calcination136, 137. Additionally, it was found that a spatial proximity between Brønsted and Lewis acid sites which lead to a synergistic effect in increasing the Brønsted acid strength of dealuminated zeolites138-141. This observation of an enhanced Brønsted acid sites was also reported by Yu et al.
81 for the hydrogenated form of mordenite and ZSM-5. However, there is still no clear experimental evidence of the step-by-step mechanism leading to the EFAL formation and of the precise structure of the remaining EFAL30, 31, 33.
Si
Al
Framework Si Framework Al
Aluminum Extraction
Atomic gaps EFAL
ASA
Silicon Migration
migrating Si
Mesoporous Zeolite
Si
Al
Framework Si Framework Al
Aluminum Extraction
Si
Al
Framework Si Framework Al
Aluminum Extraction
Atomic gaps EFAL
ASA
Silicon Migration
migrating Si
Atomic gaps EFAL
ASA
Atomic gaps EFAL
ASA
Silicon Migration
migrating Si
Mesoporous ZeoliteMesoporous Zeolite
Figure I-8 Schematic picture of the Mechanism of Marcilly showing the mesopore formation upon dealumination (adapted from 1).
4.2. Desilication
By means of alkaline treatment a selective extraction of silicon from the zeolite framework has proven to be an effective and simple post-synthetic treatment to introduce mesopores in zeolitic systems. Very recently Holm et al.
117 showed via FT-IR analyses (using CO and collidine as probe molecules) for a series of NaOH desilicated H-ZSM-5 zeolites that desilication preferentially takes place at defective sites within the crystallite. Their study showed clear evidence that defect sites are depicted by internal Si-OH sites, i.e. silanol nests, that are removed upon NaOH treatment. Moreover, a simultaneous increase in the

26
concentration of free, external Si-OH sites could be observed indicating a selective dissolution of the framework preferentially occurring at defective sites (silanol nests) in the crystal. Additionally to the mesopore formation strong Lewis acid sites were observed, possibly resulting from dislodged framework aluminium. The FT-IR spectra in Figure 8 correspond to three treated and non-treated zeolites, being parental H-ZSM-5 and desilicated H-ZSM-5 treated with 0.05M NaOH and 0.20M NaOH. In the first spectrum for parental H-ZSM-5 one can assign the following bands:
i) 3746 cm-1: isolated Si-OH groups located on the external surface of the zeolite ii) 3728 cm-1: slightly perturbed Si-OH sites mainly located inside the zeolite iii) 3692 cm-1: same as ii) but with stronger perturbation iv) 3613 cm-1: strong Al-O(H)-Si Brønsted acid sites v) 3460 cm-1: internal silanol nests in strong interaction by strong hydrogen bonds,
around a vacant T site
As seen from Figure I-9, an increase of the NaOH concentration causes a drastic increase of the band for isolated Si-OH groups and a simultaneous decrease of the band for silanol nests. On the other hand, the Brønsted acid sites remain mainly unaffected and a band for extra lattice Al-OH groups appears, indicating the creation of EFAL species even upon NaOH treatment and not necessarily only during steam treatment. This is a first and important step towards the understanding of the mechanism for the mesopore formation upon desilication.
Figure I-9 FT-IR spectra at room temperature of dehydrated H-ZMS-5-PARENT and desilicated H-ZSM-5 using different NaOH concentrations (0.05M and 0.20M) (only the ν(OH) parts are shown) (extracted from 117).
Based on their findings, they proposed a mechanism of such mesopore formation (Figure I-10) but only at a mesoscopic scale, without any insights from the atomistic point of view. Additionally to the fact that local defect sites initiate the mesopore formation upon desilication, Groen et al. show that for H-ZSM-5 the framework Si/Al ratio plays a major role in this process93. They found an optimum range for the Si/Al ratio of 25-50. For zeolites containing a higher amount of Al (lower Si/Al ratio) the framework aluminium prevents a Si extraction resulting in a limited mesopore formation whereas lower Al concentrations (higher Si/Al ratio) lead to an excessive Si dissolution characterized by large mesopores or even
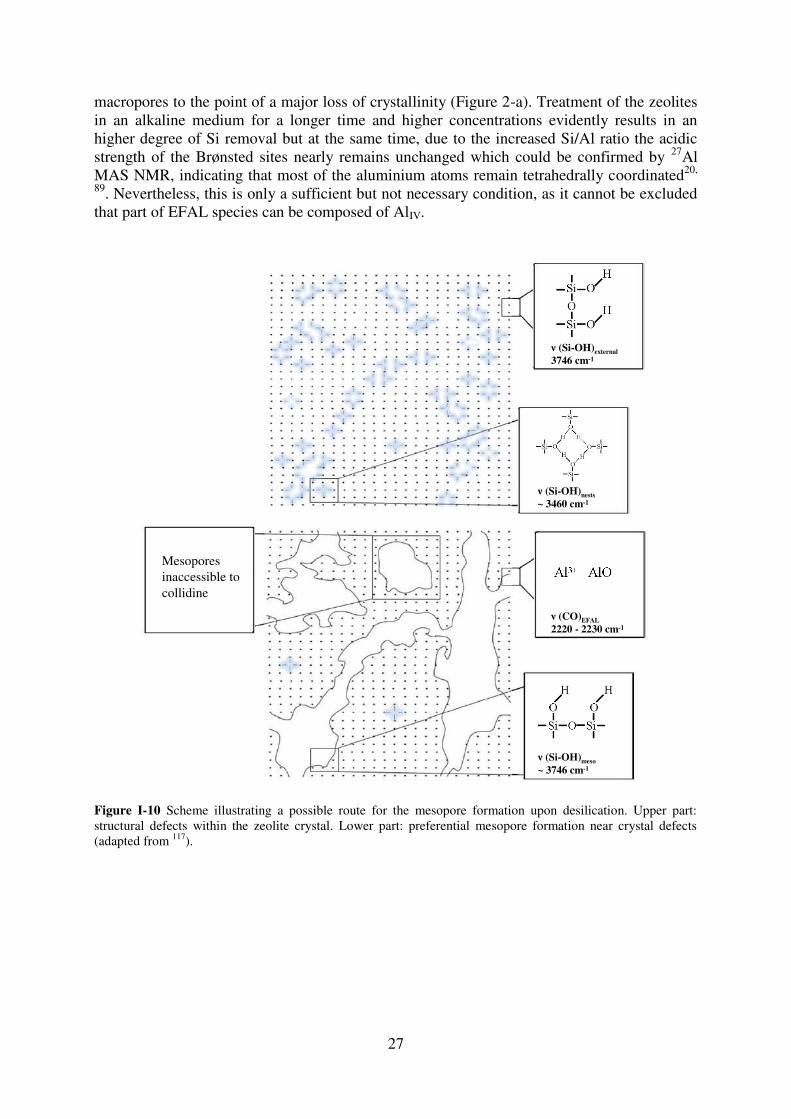
27
macropores to the point of a major loss of crystallinity (Figure 2-a). Treatment of the zeolites in an alkaline medium for a longer time and higher concentrations evidently results in an higher degree of Si removal but at the same time, due to the increased Si/Al ratio the acidic strength of the Brønsted sites nearly remains unchanged which could be confirmed by 27Al MAS NMR, indicating that most of the aluminium atoms remain tetrahedrally coordinated20,
89. Nevertheless, this is only a sufficient but not necessary condition, as it cannot be excluded that part of EFAL species can be composed of AlIV.
Mesopores inaccessible to collidine
ν (Si-OH)external
3746 cm-1
ν (Si-OH)nests
~ 3460 cm-1
ν (CO)EFAL
2220 - 2230 cm-1
ν (Si-OH)meso
~ 3746 cm-1
Mesopores inaccessible to collidine
Mesopores inaccessible to collidine
ν (Si-OH)external
3746 cm-1
ν (Si-OH)nests
~ 3460 cm-1
ν (CO)EFAL
2220 - 2230 cm-1
ν (Si-OH)meso
~ 3746 cm-1
Figure I-10 Scheme illustrating a possible route for the mesopore formation upon desilication. Upper part: structural defects within the zeolite crystal. Lower part: preferential mesopore formation near crystal defects (adapted from 117).
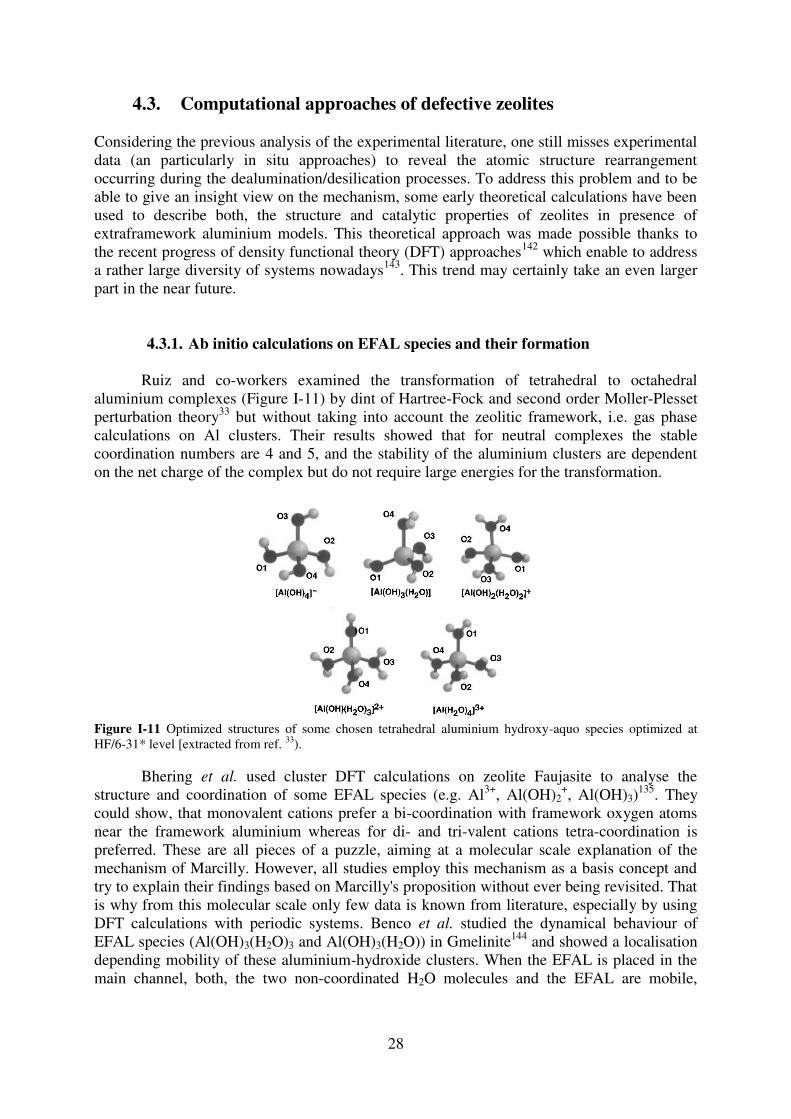
28
4.3. Computational approaches of defective zeolites Considering the previous analysis of the experimental literature, one still misses experimental data (an particularly in situ approaches) to reveal the atomic structure rearrangement occurring during the dealumination/desilication processes. To address this problem and to be able to give an insight view on the mechanism, some early theoretical calculations have been used to describe both, the structure and catalytic properties of zeolites in presence of extraframework aluminium models. This theoretical approach was made possible thanks to the recent progress of density functional theory (DFT) approaches142 which enable to address a rather large diversity of systems nowadays143. This trend may certainly take an even larger part in the near future.
4.3.1. Ab initio calculations on EFAL species and their formation
Ruiz and co-workers examined the transformation of tetrahedral to octahedral
aluminium complexes (Figure I-11) by dint of Hartree-Fock and second order Moller-Plesset perturbation theory33 but without taking into account the zeolitic framework, i.e. gas phase calculations on Al clusters. Their results showed that for neutral complexes the stable coordination numbers are 4 and 5, and the stability of the aluminium clusters are dependent on the net charge of the complex but do not require large energies for the transformation.
Figure I-11 Optimized structures of some chosen tetrahedral aluminium hydroxy-aquo species optimized at HF/6-31* level [extracted from ref. 33).
Bhering et al. used cluster DFT calculations on zeolite Faujasite to analyse the structure and coordination of some EFAL species (e.g. Al3+, Al(OH)2
+, Al(OH)3)135. They
could show, that monovalent cations prefer a bi-coordination with framework oxygen atoms near the framework aluminium whereas for di- and tri-valent cations tetra-coordination is preferred. These are all pieces of a puzzle, aiming at a molecular scale explanation of the mechanism of Marcilly. However, all studies employ this mechanism as a basis concept and try to explain their findings based on Marcilly's proposition without ever being revisited. That is why from this molecular scale only few data is known from literature, especially by using DFT calculations with periodic systems. Benco et al. studied the dynamical behaviour of EFAL species (Al(OH)3(H2O)3 and Al(OH)3(H2O)) in Gmelinite144 and showed a localisation depending mobility of these aluminium-hydroxide clusters. When the EFAL is placed in the main channel, both, the two non-coordinated H2O molecules and the EFAL are mobile,
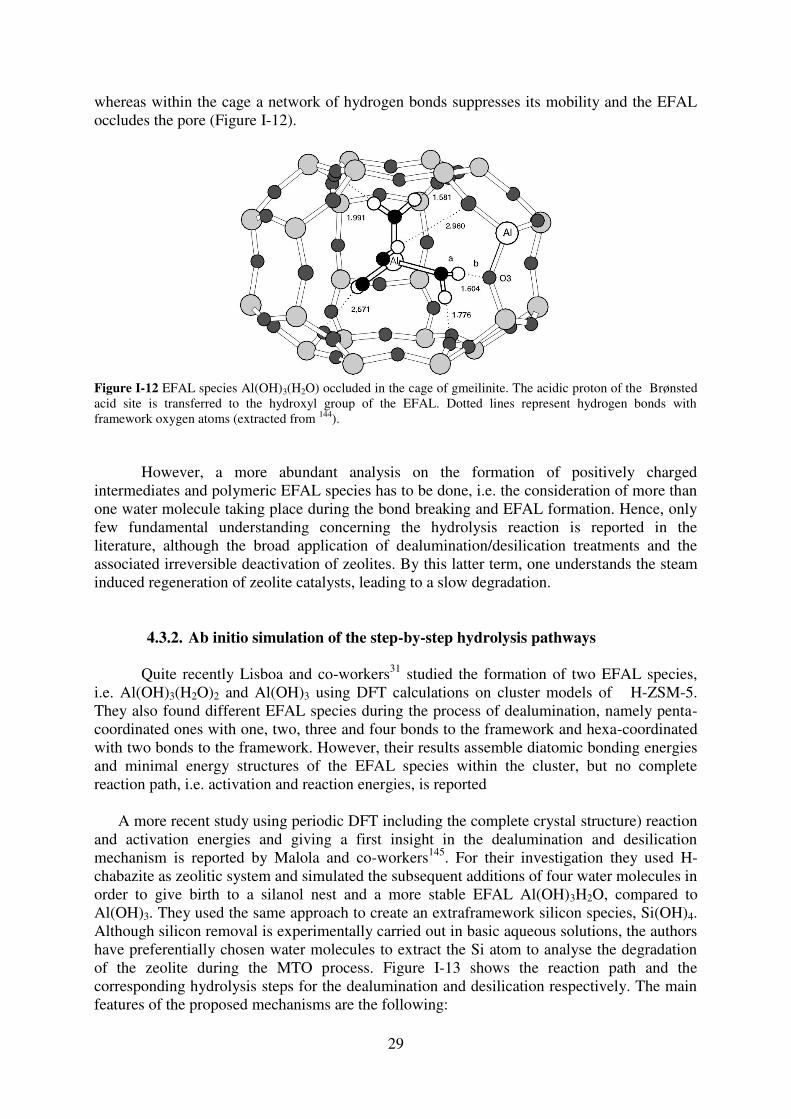
29
whereas within the cage a network of hydrogen bonds suppresses its mobility and the EFAL occludes the pore (Figure I-12).
Figure I-12 EFAL species Al(OH)3(H2O) occluded in the cage of gmeilinite. The acidic proton of the Brønsted acid site is transferred to the hydroxyl group of the EFAL. Dotted lines represent hydrogen bonds with framework oxygen atoms (extracted from 144).
However, a more abundant analysis on the formation of positively charged intermediates and polymeric EFAL species has to be done, i.e. the consideration of more than one water molecule taking place during the bond breaking and EFAL formation. Hence, only few fundamental understanding concerning the hydrolysis reaction is reported in the literature, although the broad application of dealumination/desilication treatments and the associated irreversible deactivation of zeolites. By this latter term, one understands the steam induced regeneration of zeolite catalysts, leading to a slow degradation.
4.3.2. Ab initio simulation of the step-by-step hydrolysis pathways
Quite recently Lisboa and co-workers31 studied the formation of two EFAL species,
i.e. Al(OH)3(H2O)2 and Al(OH)3 using DFT calculations on cluster models of H-ZSM-5. They also found different EFAL species during the process of dealumination, namely penta-coordinated ones with one, two, three and four bonds to the framework and hexa-coordinated with two bonds to the framework. However, their results assemble diatomic bonding energies and minimal energy structures of the EFAL species within the cluster, but no complete reaction path, i.e. activation and reaction energies, is reported
A more recent study using periodic DFT including the complete crystal structure) reaction
and activation energies and giving a first insight in the dealumination and desilication mechanism is reported by Malola and co-workers145. For their investigation they used H-chabazite as zeolitic system and simulated the subsequent additions of four water molecules in order to give birth to a silanol nest and a more stable EFAL Al(OH)3H2O, compared to Al(OH)3. They used the same approach to create an extraframework silicon species, Si(OH)4. Although silicon removal is experimentally carried out in basic aqueous solutions, the authors have preferentially chosen water molecules to extract the Si atom to analyse the degradation of the zeolite during the MTO process. Figure I-13 shows the reaction path and the corresponding hydrolysis steps for the dealumination and desilication respectively. The main features of the proposed mechanisms are the following:
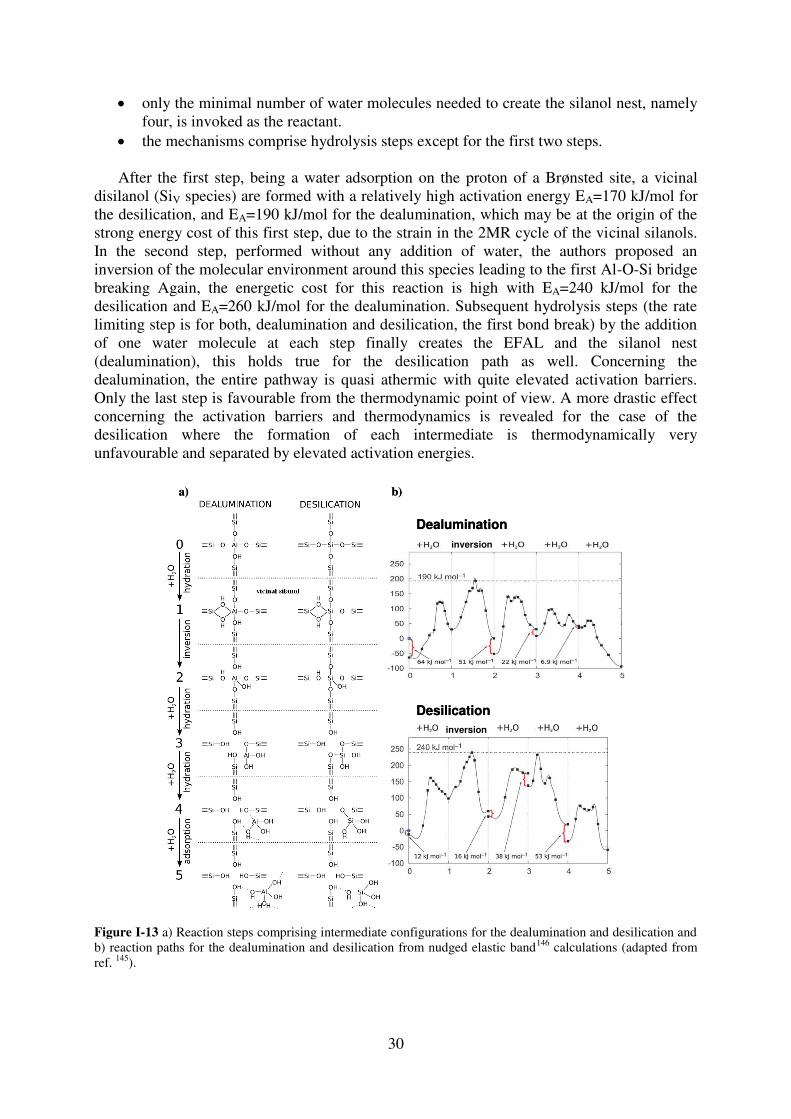
30
only the minimal number of water molecules needed to create the silanol nest, namely four, is invoked as the reactant.
the mechanisms comprise hydrolysis steps except for the first two steps.
After the first step, being a water adsorption on the proton of a Brønsted site, a vicinal disilanol (SiV species) are formed with a relatively high activation energy EA=170 kJ/mol for the desilication, and EA=190 kJ/mol for the dealumination, which may be at the origin of the strong energy cost of this first step, due to the strain in the 2MR cycle of the vicinal silanols. In the second step, performed without any addition of water, the authors proposed an inversion of the molecular environment around this species leading to the first Al-O-Si bridge breaking Again, the energetic cost for this reaction is high with EA=240 kJ/mol for the desilication and EA=260 kJ/mol for the dealumination. Subsequent hydrolysis steps (the rate limiting step is for both, dealumination and desilication, the first bond break) by the addition of one water molecule at each step finally creates the EFAL and the silanol nest (dealumination), this holds true for the desilication path as well. Concerning the dealumination, the entire pathway is quasi athermic with quite elevated activation barriers. Only the last step is favourable from the thermodynamic point of view. A more drastic effect concerning the activation barriers and thermodynamics is revealed for the case of the desilication where the formation of each intermediate is thermodynamically very unfavourable and separated by elevated activation energies.
inversion
Dealumination
Desilication
inversion
a) b)
inversioninversion
Dealumination
Desilication
inversioninversion
a) b)
Figure I-13 a) Reaction steps comprising intermediate configurations for the dealumination and desilication and b) reaction paths for the dealumination and desilication from nudged elastic band146 calculations (adapted from ref. 145).
31
In the same context of dealumination/desilication of aluminosilicates Fjemerstad et
al.147 compared the mechanisms of the desilication within SAPO-34
(silicoaluminophosphates) and the dealumination within SSZ-13. Also here and for both cases, their proposed first step is a water adsorption on the Brønsted proton with an afterwards formation of a vicinal disilanol. As in the previous work, very high activation barriers of about 200 kJ/mol for the first Al-O (SSZ-13) and Si-O (SAPO-34) bond break are found.
4.3.3. Challenging perspectives in the field of molecular simulation for
dealumination/desilication
Thus these theoretical insights in the field of dealumination/desilication of microporous
zeolites are preliminary pieces of the puzzle and still a major open question remains open: why certain T sites or why certain zeolite frameworks are more susceptible to the
demetallation ? what is the most probable mechanism of such a post-synthetic initiation step ? what are the structural and acidic properties of the extra-framework species obtained
from demetallation, and of the surface of the remaining zeolite walls ? is the very first demetallation step kinetically determining for the formation of pores
at a the mesoscale, or is it linked with the demetallation propagation mechanism?
The first two aspects, i.e. the “local” ones, can be reasonably treated by DFT calculations for the case of dealumination in steam, as undertaken by Malola et al.
145. Regarding the very high barriers obtained for each step of Al removal, perspectives are still open in the finding preferred mechanisms for Al-O bond breaking. Considering the effect of water pressure will also require the investigation of the presence of several water molecules at the same time, rather than a step-by-step approach as undertaken by Malola et al.
145. Considering the desilication, a realistic simulation appears by far more complex, as this process is systematically performed in alkaline aqueous solution. In this respect, the study of Malola et
al., performed in the same spirit as for dealumination (with individual water molecules added step-by-step), provides some preliminary insights, although the chemical process is certainly more complex due to collective effects of an assembly of water molecules, and to the presence of counter ions, i.e. Na+, coming from the alkaline solution. Hence, taking into account at the same time the dynamics of water molecules as well as the effects of ions is a hurdle. Force-Field simulation tools could be more pragmatic for such a goal, but the breaking and formation of bonds are to be modelled accurately, which is not well rendered by usual force-fields. Reactive force-fields on the other hand could be thought of, but a careful benchmarking on DFT data has to be performed first. It should be stressed that no DFT results are currently available on the demetallation reactions regarding zeolite frameworks of high industrial interests such as MOR, FAU or MFI. This is an urgent need in the field.
Concerning the mesoscale approach applied to the propagation of demetallation leading
to the formation of mesopores, an explicit quantum simulation by itself is clearly out of the scope of current state-of-the-art periodic DFT, due to the huge cell sizes required (several thousands of atoms). It should be combined to statistic approaches better designed to answer part of the questions raised by mesopore formation. For instance, Kinetic Monte Carlo (KMC) calculations were undertaken by Ban et al.
148 assuming arbitrary rate constants for aluminium removal, silicon migration and self-healing, according to a simplified Marcilly’s mechanism. Such an approach could be refined by including relevant barriers for each step of the reaction,
32
possibly estimated by DFT on smaller but relevant simulation cells. Thus, the combination of KMC parameterized with sufficient DFT data may enable to overcome the multi-scale problem and provide a complete dynamic understanding of the formation of mesopores and possible extra-framework species accumulation. However, for that purpose, we still need first to build a rather exhaustive DFT database on the relevant elementary steps, which remains a long term and challenging objective.
5. Conclusions of the bibliographic study
Zeolites are acid catalysts which find a widespread application especially in petrochemistry and refining. Compared to their mesostructured counterparts, with posterior introduced acidic functionality, zeolites induce severe mass-transfer limitations due to their intrinsic micropores. Hence, for some targeted processes (such as hydrocracking), undesired secondary reactions occur, e.g. overcracking which leads to lighter hydrocarbon molecules. Therefore a great interest lies in overcoming this phenomenon by means of post-synthetically introduced mesopores. The chemical treatments are either base or acid leaching and/or thermal treatments which evoke the desilication or dealumination, resulting in:
1. introducing mesopores: post-synthetically introduced mesopores overcome mass-transfer limitations leading to the class of mesoporous materials, called "hierarchical zeolites"13
2. stabilizing the zeolites structure: zeolites exhibiting a low Si/Al ratio, e.g. FAU Y, are unstable and display a loss of the catalytic activity during their lifetime; this occurs mainly as a result of Al atoms leaving their T sites and becoming extraframework species.
Such "hierarchical zeolites" exhibit improved molecular diffusion properties and
confinement effect resulting from their larger mesopores. These secondary pore systems were analysed by a large set of techniques at the mesoscale. Some general rules regarding the mesopore generation, as a function of the reaction parameters, zeolite structure and chemical composition, were obtained. Moreover, "hierarchical zeolites", show a nearly unaffected Brønsted acidity or sometimes even an augmentation, due to Lewis-Brønsted-synergism138-141. This results from the fact that upon the dealumination process extraframework species leave the framework but still remain in close proximity to the Brønsted acid sites. However, the nature and the mechanism of formation of such EFAL and EFSI species are still a matter of debate although extensive experimental and theoretical studies provide an insight to this cationic (e.g. Al3+, AlO+), neutral or charged, to a certain degree polymerized, hydroxyaluminates (e.g. Al(OH)2+, Al(OH)2
+ AlOOH, Al(OH)3) or silicate ions. Challenges still exist in the definition at the molecular scale of these extra-framework species, their degree of oligomerization, the environment of Al and Si atoms, and the resulting acidity.
Mesopores and to a certain extend the extraframework species can be described by experimental and theoretical studies, however very few is known on the mechanisms leading to their formation. Does there exist a template mechanism transposable to zeolitic frameworks and thus predicting their formation? For this, DFT calculations are a powerful tool. To date, available mechanistic data either do not include a complete reaction profile31 or if they do so145, the involved reaction barriers are very unfavourable. Thus, a more detailed analysis, e.g. varying zeolite structures and different reaction possibilities, especially for the initiation of an Al-O/Si-O bond, are missing. Taking into account the dynamics of water molecules as well as the effects of ions, as for instance for the desilication, which is done in alkaline solutions, will
33
also be required in the future. Mesoscale approaches like Kinetic Monte Carlo calculations could also be a good way to get information about mesopore generation, thanks to relevant barriers for bond breaking calculated with DFT approaches.
The aim of the present chapter was to analyze the current state of the art in the understanding of the mechanism of mesopore formation and the extraframework species. It appears, however, that mechanistic studies of both dealumination and desilication remain scarce in the literature, resulting in a limited knowledge at the atomic scale of the origin of the effect of various operating parameters. Hence, this is still an open question to provide a more precise description of the dealumination/desilication pathways at a molecular scale as well as an accurate description of the reconstructed zeolitic framework and amorphous phase (extraframework species). This molecular scale understanding is mandatory to better control simultaneously the evolution of the intrinsic acidity of the framework and its mesoporosity. In the near future, we suspect that this scientific challenge will attract an increasing attention and will be at the core of a great number of forthcoming investigations combining state of the art theoretical approaches and cutting edge in operando experimental techniques.
6. Research program
Our goal is thus to unravel the more “local” aspects of the wider challenges evoked in section 4.3.3., which is the first step for a better understanding of the complex reaction network occurring during dealumination and desilication. The underlying questions are : (i) why certain T sites or why certain zeolite frameworks are more susceptible to the demetallation ? (ii) what is the most probable mechanism of such a post-synthetic initiation step ? For time constraint reasons, we focused first on dealumination reactions, desilication being treated in a preliminary manner only. Our methodology based on first-principles calculations is quite similar to the one of Swang et al. 145, 147 Note that their first work was published after the launching of our research project, which illustrates the topical nature of the present research project, by choosing a periodic representation of the solids under study, calculating the reactivity of water molecules step by step, by identifying stable intermediates and accurate transition states. However, we will improve and expand this approach by:
- Considering several relevant zeolitic frameworks, so as to try to identify general
trends rationalizing the behavior of each T site. Motivated by the amount of work (mainly experimental) available and the potential interest for industrial applications, we chose four zeolitic frameworks to be the object of this local investigation: FAU, MFI, MOR and CHA. Considering almost isolated Brønsted acid sites is required in a first step, so as to avoid any interaction between them, which would be problematic to deduce general concept. Thus, high Si/Al ratios will be considered.
- Looking at each step (first water addition and dissociation, then second water addition and dissociation, etc.) for as many mechanistic alternative as possible. Molecular adsorption of water on specific sites of the zeolite will be compared with dissociation reactions of water on M-O bond (M = Al, Si), possibly accompanied by M-O bond breaking.
- Performing systematic DFT + D calculations (“D” means adding corrections for long range interactions, which are poorly taken into account in standard DFT), contrary to pure DFT approaches in the work of Swang et al. In particular, this will

34
be important if confinement effect plays an important role in the stabilization of certain hydrolysis intermediates or products.
- Looking for validations of the quantitative data found by a hybrid approach,
namely QM/QM, the core of the reactive system being treated at the MP2 level, whereas the periodic background is treated at the DFT+D level. The approach implemented by Sauer and Tuma in the QMPOT code will be used 58, 149, 150 within the framework of a collaboration between IFPEN and Humboldt University Berlin
The results will be discussed in terms of relative reactivity of T sites, mechanistic issues, and compared to the few atomic scale data available in the experimental literature in the field.
35
References 1. C. Marcilly, ed., Acido-Basic Catalysis - Application to Refining and Petrochemistry,
Editions TECHNIP, 2005. 2. W. Vermeiren and J. P. Gilson, Top. Catal., 2009, 52, 1131-1161. 3. E. G. Derouane, J. M. Andre and A. A. Lucas, J. Catal., 1988, 110, 58-73. 4. H. Toulhoat, P. Raybaud and E. Benazzi, J. Catal., 2004, 221, 500-509. 5. S. Hitz and R. Prins, J. Catal., 1997, 168, 194-206. 6. J. S. Beck, J. C. Vartuli, W. J. Roth, M. E. Leonowicz, C. T. Kresge, K. D. Schmitt, C.
T. W. Chu, D. H. Olson and E. W. Sheppard, J. Am. Chem. Soc., 1992, 114, 10834-10843.
7. C. T. Kresge, M. E. Leonowicz, W. J. Roth, J. C. Vartuli and J. S. Beck, Nature, 1992, 359, 710-712.
8. M. Kruk, M. Jaroniec and A. Sayari, Langmuir, 1997, 13, 6267-6273. 9. A. V. Neimark, P. I. Ravikovitch, M. Grün, F. Schüth and K. K. Unger, J Colloid
Interf Sci, 1998, 207, 159-169. 10. N. K. Mal, M. Fujiwara, Y. Tanaka, T. Taguchi and M. Matsukata, Chem. Mater.,
2003, 15, 3385-3394. 11. M. Rozwadowski, M. Lezanska, J. Wloch and K. Erdmann, Stud. Surf. Sci. Catal.,
2005, Volume 158, Part A, 447-454. 12. A. Corma, M. S. Grande, V. Gonzalez-Alfaro and A. V. Orchilles, J. Catal., 1996,
159, 375-382. 13. J. Pérez-Ramírez, C. H. Christensen, K. Egeblad, C. H. Christensen and J. C. Groen,
Chem. Soc. Rev., 2008, 37, 2530-2542. 14. P. Voogd and H. Vanbekkum, Appl. Catal., 1990, 59, 311-331. 15. Y. Tao, H. Kanoh, L. Abrams and K. Kaneko, Chem. Rev., 2006, 106, 896-910. 16. K. Egeblad, C. H. Christensen, M. Kustova and C. H. Christensen, Chem. Mater.,
2007, 20, 946-960. 17. M. Boveri, C. Márquez-Álvarez, M. Á. Laborde and E. Sastre, Catal. Today, 2006,
114, 217-225. 18. M. D. González, Y. Cesteros and P. Salagre, Microporous Mesoporous Mater., 2011,
144, 162-170. 19. F. Hernández-Beltrán, J. C. Moreno-Mayorga, M. a. de Lourdes Guzmán-Castillo, J.
Navarrete-Bolaños, M. González-González and B. E. Handy, Appl. Catal., A, 2003, 240, 41-51.
20. J. C. Groen, L. A. A. Peffer, J. A. Moulijn and J. Perez-Ramirez, Microporous
Mesoporous Mater., 2004, 69, 29-34. 21. J. C. Groen, T. Bach, U. Ziese, A. M. Paulaime-van Donk, K. P. de Jong, J. A.
Moulijn and J. Pérez-Ramírez, J. Am. Chem. Soc., 2005, 127, 10792-10793. 22. D. Verboekend, G. Vile and J. Perez-Ramirez, Adv. Funct. Mater., 2012, 22, 916-928. 23. D. Verboekend, T. C. Keller, M. Milina, R. Hauert and J. Pérez-Ramírez, Chem.
Mater., 2013, 25, 1947-1959. 24. M. Müller, G. Harvey and R. Prins, Microporous Mesoporous Mater., 2000, 34, 135-
147. 25. N. Viswanadham and M. Kumar, Microporous Mesoporous Mater., 2006, 92, 31-37. 26. V. Paixão, A. P. Carvalho, J. Rocha, A. Fernandes and A. Martins, Microporous
Mesoporous Mater., 2010, 131, 350-357. 27. V. Paixao, R. Monteiro, M. Andrade, A. Fernandes, J. Rocha, A. P. Carvalho and A.
Martins, Appl. Catal., A, 2011, 402, 59-68.
36
28. F. Schmidt, M. R. Lohe, B. Büchner, F. Giordanino, F. Bonino and S. Kaskel, Microporous Mesoporous Mater., 2012.
29. R. Dimitrijevic, W. Lutz and a. Ritzmann, J. Phys. Chem. Solids, 2006, 67, 1741-1748.
30. S. Li, A. Zheng, Y. Su, H. Fang, W. Shen, Z. Yu, L. Chen and F. Deng, Phys. Chem.
Chem. Phys., 2010, 12, 3895-3903. 31. O. Lisboa, M. Sánchez and F. Ruette, J. Mol. Catal. A: Chem., 2008, 294, 93-101. 32. W. Lutz, C. H. Rüscher and D. Heidemann, Microporous Mesoporous Mater., 2002,
55, 193-202. 33. J. M. Ruiz, M. H. McAdon and J. M. Garcés, J. Phys. Chem. B, 1997, 101, 1733-1744. 34. A. Stein and B. Holland, Journal of Porous Materials, 1996, 3, 83-92. 35. V. Valtchev, G. Majano, S. Mintova and J. Perez-Ramirez, Chem. Soc. Rev., 2013, 42,
263-290. 36. S. van Donk, A. H. Janssen, J. H. Bitter and K. P. de Jong, Catal. Rev., 2003, 45, 297-
319. 37. M. S. Holm, E. Taarning, K. Egeblad and C. H. Christensen, Catal. Today, 2011, 168,
3-16. 38. A. Alberti, P. Davoli and G. Vezzalini, Z. Kristallogr., 1986, 175, 249-256. 39. A. Alberti, A. Martucci, E. Galli and G. Vezzalini, Zeolites, 1997, 19, 349-352. 40. O. V. Yakubovich, W. Massa, P. G. Gavrilenko and I. V. Pekov, Crystallogr. Rep.,
2005, 50, 544-553. 41. M. J. Stephenson, S. M. Holmes and R. A. W. Dryfe, Angew. Chem., Int. Ed., 2005,
44, 3075-3078. 42. Y. F. Wang, F. Lin and W. Q. Pang, J. Hazard. Mater., 2007, 142, 160-164. 43. D. Barthomeuf, Mater. Chem. Phys., 1987, 17, 49-71. 44. B. Lu, T. Kanai, Y. Oumi and T. Sano, Journal of Porous Materials, 2006, 14, 89-96. 45. B. Yilmaz and U. Müller, Top. Catal., 2009, 52, 888-895. 46. R. M. Barrer, J. Chem. Soc., 1948, 2158-2163. 47. A. Alberti, Zeolites, 1997, 19, 411-415. 48. P. Simoncic and T. Armbruster, Am Mineral, 2004, 89, 421-431. 49. T. Bucko, L. Benco, T. Demuth and J. Hafner, J. Chem. Phys., 2002, 117, 7295-7295. 50. T. Demuth, J. Hafner, L. Benco and H. Toulhoat, J. Phys. Chem. B, 2000, 104, 4593-
4607. 51. P. Bodart, J. B. Nagy, G. Debras, Z. Gabelica and P. a. Jacobs, J. Phys. Chem., 1986,
90, 5183-5190. 52. V. L. Zholobenko, M. A. Makarova and J. Dwyer, J. Phys. Chem., 1993, 97, 5962-
5964. 53. H. Huo, L. Peng, Z. Gan and C. P. Grey, J. Am. Chem. Soc., 2012, 134, 9708-9720. 54. J. Hafner, L. Benco and T. Bucko, Top. Catal., 2006, 37, 41-54. 55. O. Marie, P. Massiani and F. Thibault-Starzyk, J. Phys. Chem. B, 2004, 108, 5073-
5081. 56. F. Deng, Y. Yue and C. Ye, Solid State Nucl. Magn. Reson., 1998, 10, 151-160. 57. J. Sauer and M. Sierka, J. Comput. Chem., 2000, 21, 1470-1493. 58. C. Tuma and J. Sauer, Chem. Phys. Lett., 2004, 387, 388-394. 59. P. Sarv, T. Tuherm, E. Lippmaa, K. Keskinen and A. Root, J. Phys. Chem., 1995, 99,
13763-13768. 60. D. Akolekar, A. Chaffee and R. F. Howe, Zeolites, 1997, 19, 359-365. 61. M. Igarashi, T. Nakano, T. Shimizu, A. Goto, K. Hashi, K. Goto, K. Yamamichi and
Y. Nozue, J. Magn. Magn. Mater., 2007, 310, E307-E309.
37
62. R. Khaleghian-Moghadam and F. Seyedeyn-Azad, Microporous Mesoporous Mater., 2009, 120, 285-293.
63. I. R. Subbotina, B. N. Shelimov and V. B. Kazanskii, Kinet. Catal., 2002, 43, 412-418.
64. M. Czjzek, H. Jobic, A. N. Fitch and T. Vogt, J. Phys. Chem., 1992, 96, 1535-1540. 65. D. H. Olson and E. Dempsey, J. Catal., 1969, 13, 221-231. 66. D. Freude, M. Hunger, H. Pfeifer and W. Schwieger, Chem. Phys. Lett., 1986, 128,
62-66. 67. W. P. J. H. Jacobs, J. W. de Haan, L. J. M. van de Ven and R. A. van Santen, J. Phys.
Chem., 1993, 97, 10394-10402. 68. M. Sierka and J. Sauer, J. Phys. Chem. B, 2001, 105, 1603-1613. 69. R. Grau-Crespo, E. Acuay and R. R. Ruiz-Salvador, Chem. Com., 2002, 2544-2545. 70. J. a. van Bokhoven, T.-L. Lee, M. Drakopoulos, C. Lamberti, S. Thiess and J.
Zegenhagen, Nat. Mater., 2008, 7, 551-555. 71. J. C. Védrine, A. Auroux, V. Bolis, P. Dejaifve, C. Naccache, P. Wierzchowski, E. G.
Derouane, J. B. Nagy, J.-P. Gilson, J. H. C. van Hooff, J. P. van den Berg and J. Wolthuizen, J. Catal., 1979, 59, 248-262.
72. N.-Y. Topsøe, K. Pedersen and E. G. Derouane, J. Catal., 1981, 70, 41-52. 73. F. Bleken, M. Bjørgen, L. Palumbo, S. Bordiga, S. Svelle, K.-P. Lillerud and U.
Olsbye, Top. Catal., 2009, 52, 218-228. 74. L. Sommer, D. Mores, S. Svelle, M. Stöcker, B. M. Weckhuysen and U. Olsbye,
Microporous Mesoporous Mater., 2010, 132, 384-394. 75. L.-T. Yuen, S. I. Zones, T. V. Harris, E. J. Gallegos and A. Auroux, Microporous
Mater., 1994, 2, 105-117. 76. B. P. C. Hereijgers, F. Bleken, M. H. Nilsen, S. Svelle, K.-P. Lillerud, M. Bjørgen, B.
M. Weckhuysen and U. Olsbye, J. Catal., 2009, 264, 77-87. 77. S. Bordiga, L. Regli, D. Cocina, C. Lamberti, M. Bjørgen and K. P. Lillerud, The
Journal of Physical Chemistry B, 2005, 109, 2779-2784. 78. R. M. Barrer and M. B. Makki, Can. J. Chem., 1964, 42, 1481-1487. 79. C. V. McDaniel and P. K. Maher, Mol. Sieves, 1968, 186. 80. G. T. Kerr, J. Phys. Chem., 1967, 71, 4155-4156. 81. Z. Yu, S. Li, Q. Wang, A. Zheng, X. Jun, L. Chen and F. Deng, J. Phys. Chem. C,
2011, 115, 22320-22327. 82. T. Kawai and K. Tsutsumi, Zeolites, 1998, 231, 225-231. 83. H. K. Beyer, I. M. Belenykaja, I. W. Mishin and G. Borbely, Stud. Surf. Sci. Catal.,
1984, Volume 18, 133-140. 84. T. Sano, H. Ikeya, T. Kasuno, Z. B. Wang, Y. Kawakami and K. Soga, Zeolites, 1997,
19, 80-86. 85. A. P. Carvalho, M. Brotas de Carvalho and J. Pires, Zeolites, 1997, 19, 382-386. 86. L. Aouali, J. Jeanjean, A. Dereigne, P. Tougne and D. Delafosse, Zeolites, 1988, 8,
517-522. 87. J. C. Groen, J. A. Moulijn and J. Perez-Ramirez, J. Mater. Chem., 2006, 16, 2121-
2131. 88. D. Verboekend and J. Perez-Ramirez, Catal.Sci.Technol., 2011, 1, 879-890. 89. D. Verboekend and J. Pérez-Ramírez, Chem. Eur. J., 2011, 17, 1137-1147. 90. D. Verboekend, G. Vilé and J. Pérez-Ramírez, Cryst Growth Des, 2012, 12, 3123-
3132. 91. S. Abelló, A. Bonilla and J. Pérez-Ramírez, Applied Catalysis A: General, 2009, 364,
191-198. 92. D. Verboekend, G. Vilé and J. Pérez-Ramírez, Adv. Funct. Mater., 2012, 22, 916-928.
38
93. J. C. Groen, J. C. Jansen, J. A. Moulijn and J. Pérez-Ramírez, J. Phys. Chem. B, 2004, 108, 13062-13065.
94. D. Verboekend, S. Mitchell, M. Milina, J. C. roen and J. P re -Ram re , J. Phys.
Chem. C, 2011, 115, 14193-14203. 95. R. M. Dessau, E. W. Valyocsik and N. H. Goeke, Zeolites, 1992, 12, 776-779. 96. A. Čižmek, B. Subotić, R. Aiello, F. Crea, A. Nastro and C. Tuoto, Microporous
Mater., 1995, 4, 159-168. 97. M. J. Van Niekerk, J. C. Q. Fletcher and C. T. O'Connor, J. Catal., 1992, 138, 150-
163. 98. B. Ha, J. Chem. Soc., Faraday Trans., 1979, 75, 1245-1245. 99. R. W. Olsson and L. D. Rollmann, Inorg. Chem., 1977, 16, 651-654. 100. Y. Hong and J. J. Fripiat, Microporous Mater., 1995, 4, 323-334. 101. R. L. V. Mao, S. Y. Xiao, A. Ramsaran and J. H. Yao, J. Mater. Chem., 1994, 4, 605-
610. 102. S. Abello and J. Perez-Ramirez, Phys. Chem. Chem. Phys., 2009, 11, 2959-2963. 103. A. N. C. van laak, L. Zhang, A. N. Parvulescu, P. C. A. Bruijnincx, B. M.
Weckhuysen, K. P. de Jong and P. E. de Jongh, Catal. Today, 2011, 168, 48-56. 104. W. C. Yoo, X. Zhang, M. Tsapatsis and A. Stein, Microporous Mesoporous Mater.,
2012, 149, 147-157. 105. M. Hunger, J. Karger, H. Pfeifer, J. Caro, B. Zibrowius, M. Bulow and R. Mostowicz,
J. Chem. Soc., Faraday Trans. 1, 1987, 83, 3459-3468. 106. J. Kornatowski, W. H. Baur, G. Pieper, M. Rozwadowski, W. Schmitz and A.
Cichowlas, J. Chem. Soc., Faraday Trans., 1992, 88, 1339-1343. 107. L. Karwacki, D. A. M. de Winter, L. R. Aramburo, M. N. Lebbink, J. A. Post, M. R.
Drury and B. M. Weckhuysen, Angew. Chem., Int. Ed., 2011, 50, 1294-1298. 108. L. Karwacki, M. H. F. Kox, D. A. Matthijs de Winter, M. R. Drury, J. D. Meeldijk, E.
Stavitski, W. Schmidt, M. Mertens, P. Cubillas, N. John, A. Chan, N. Kahn, S. R. Bare, M. Anderson, J. Kornatowski and B. M. Weckhuysen, Nat Mater, 2009, 8, 959-965.
109. N. Danilina, F. Krumeich, S. A. Castelanelli and J. A. van Bokhoven, J. Phys. Chem.
C, 2010, 114, 6640-6645. 110. S. van Donk, A. Broersma, O. L. J. Gijzeman, J. A. van Bokhoven, J. H. Bitter and K.
P. de Jong, J. Catal., 2001, 204, 272-280. 111. M. Tromp, J. A. van Bokhoven, M. T. Garriga Oostenbrink, J. H. Bitter, K. P. de Jong
and D. C. Koningsberger, J. Catal., 2000, 190, 209-214. 112. S. M. T. Almutairi, B. Mezari, E. A. Pidko, P. C. M. M. Magusin and E. J. M. Hensen,
J. Catal., 2013, 307, 194-203. 113. Q. Sheng, K. Ling, Z. Li and L. Zhao, Fuel Process Technol, 2013, 110, 73-78. 114. M. Ogura, S. Y. Shinomiya, J. Tateno, Y. Nara, E. Kikuchi and H. Matsukata, Chem
Lett, 2000, 882-883. 115. J. C. Groen, L. A. A. Peffer, J. A. Moulijn and J. Pérez-Ramírez, Chem. Eur. J., 2005,
11, 4983-4994. 116. J. Pérez-Ramírez, D. Verboekend, A. Bonilla and S. Abelló, Adv. Funct. Mater., 2009,
19, 3972-3979. 117. M. S. Holm, S. Svelle, F. Joensen, P. Beato, C. H. Christensen, S. Bordiga and M.
Bjørgen, Appl. Catal., A, 2009, 356, 23-30. 118. M. Bjørgen, F. Joensen, M. Spangsberg Holm, U. Olsbye, K.-P. Lillerud and S.
Svelle, Appl. Catal., A, 2008, 345, 43-50. 119. F. Thibault-Starzyk, I. Stan, S. Abelló, A. Bonilla, K. Thomas, C. Fernandez, J.-P.
Gilson and J. Pérez-Ramírez, J. Catal., 2009, 264, 11-14.
39
120. C. Fernandez, I. Stan, J.-P. Gilson, K. Thomas, A. Vicente, A. Bonilla and J. Pérez-Ramírez, Chem. Eur. J., 2010, 16, 6224-6233.
121. S. Mitchell, N.-L. Michels, K. Kunze and J. Pérez-Ramírez, Nat Chem, 2012, 4, 825-831.
122. K. P. de Jong, J. Zečević, H. Friedrich, P. E. de Jongh, M. Bulut, S. van Donk, R. Kenmogne, A. Finiels, V. Hulea and F. Fajula, Angew. Chem., 2010, 122, 10272-10276.
123. A. N. C. van Laak, S. L. Sagala, J. Zečević, H. Friedrich, P. E. de Jongh and K. P. de Jong, J. Catal., 2010, 276, 170-180.
124. T.-H. Chen, K. Houthoofd and P. J. Grobet, Microporous Mesoporous Mater., 2005, 86, 31-37.
125. G. Agostini, C. Lamberti, L. Palin, M. Milanesio, N. Danilina, B. Xu, M. Janousch and J. a. van Bokhoven, J. Am. Chem. Soc., 2010, 132, 667-678.
126. J. a. van Bokhoven, A. M. J. van der Eerden and D. C. Koningsberger, J. Am. Chem.
Soc., 2003, 125, 7435-7442. 127. R. Bertram, U. Lohse and W. Gessner, Z. Anorg. Allg. Chem., 1988, 567, 145-152. 128. B. H. Wouters, T. H. Chen and P. J. Grobet, J. Am. Chem. Soc., 1998, 120, 11419-
11425. 129. O. Cairon, T. Chevreau and J.-C. Lavalley, J. Chem. Soc., Faraday Trans., 1998, 94,
3039-3047. 130. J. A. van Bokhoven, A. M. J. van der Eerden and D. C. Koningsberger, Stud. Surf. Sci.
Catal., 2002, Volume 142, 1885-1890. 131. M. Stockenhuber and J. A. Lercher, Microporous Mater., 1995, 3, 457-465. 132. W. Lutz, H. Toufar, D. Heidemann, N. Salman, C. H. Rüscher, T. M. Gesing, J. C.
Buhl and R. Bertram, Microporous Mesoporous Mater., 2007, 104, 171-178. 133. E. Lippmaa, M. Maegi, A. Samoson, G. Engelhardt and A. R. Grimmer, J. Am. Chem.
Soc., 1980, 102, 4889-4893. 134. W. Lutz, R. Bertram, D. Heidemann, R. Kurzhals, C. Rüscher and G. Kryukova,
Zeitschrift für anorganische und allgemeine Chemie, 2011, 637, 75-82. 135. D. L. Bhering, A. Ramirez-Solis and C. J. A. Mota, J. Phys. Chem. B, 2003, 107,
4342-4347. 136. P. Gallezot, R. Beaumont and D. Barthomeuf, J. Phys. Chem., 1974, 78, 1550-1553. 137. P. Pichat, R. Beaumont and D. Barthomeuf, J. Chem. Soc., Faraday Trans. 1, 1974,
70, 1402-1407. 138. N. Malicki, P. Beccat, P. Bourges, C. Fernandez, A.-A. Quoineaud, L. J. Simon and F.
Thibault-Starzyk, in Stud. Surf. Sci. Catal., eds. Z. G. J. C. Ruren Xu and Y. Wenfu, Elsevier, 2007, vol. Volume 170, pp. 762-770.
139. N. Malicki, G. Mali, A.-A. Quoineaud, P. Bourges, L. J. Simon, F. Thibault-Starzyk and C. Fernandez, Microporous Mesoporous Mater., 2010, 129, 100-105.
140. Z. Yu, S. Li, W. Qiang, A. Zheng, J. Xu, L. Chen and F. Deng, J. Phys. Chem. C, 2011, 22320-22327.
141. S. M. T. Almutairi, B. Mezari, G. A. Filonenko, P. C. M. M. Magusin, M. S. Rigutto, E. A. Pidko and E. J. M. Hensen, Chemcatchem, 2013, 5, 452-466.
142. W. Kohn and L. J. Sham, Physical Review, 1965, 140, A1133-A1138. 143. J. Hafner, Nat Mater, 2010, 9, 690-692. 144. L. Benco, T. Demuth, J. Hafner, F. Hutschka and H. Toulhoat, J. Catal., 2002, 209,
480-488. 145. S. Malola, S. Svelle, F. L. Bleken and O. Swang, Angew. Chem., Int. Ed., 2011, 51,
652-655. 146. G. Henkelman and H. Jonsson, J. Chem. Phys., 2000, 113, 9978-9985.

40
147. T. Fjermestad, S. Svelle and O. Swang, J. Phys. Chem. C, 2013, 117, 13442-13451. 148. S. Ban, a. N. C. van Laak, J. Landers, a. V. Neimark, P. E. de Jongh, K. P. de Jong and
T. J. H. Vlugt, J. Phys. Chem. C, 2010, 114, 2056-2065. 149. C. Tuma and J. Sauer, Phys. Chem. Chem. Phys., 2006, 8, 3955-3965. 150. C. Tuma, T. Kerber and J. Sauer, Angew. Chem., Int. Ed., 2010, 49, 4678-4680.
41
CHAPTER II : Methods
42
1. Theoretical Background
1.1. Schrödinger Equation
In order to obtain the energy of an polyatomic system one would have to solve, the
non-relativistic time-independent Schrödinger equation:
1 2 1 2 1 2 1 2ˆ , ,..., , , ,..., , ,..., , , ,...,
N M N MH x x x R R R E x x x R R R Eq. II-1
Where the total Hamiltonian, i.e. for a system of N electrons and M nuclei, consists of the
operator for the electrons kinetic energy e
T , for the kinetic energy of the nuclei nT , the one for
describing the electrostatic electron-electron interaction ee
V , the electrostatic nucleus-nucleus
interaction nnV and the electrostatic nucleus-electron interaction ne
V .
ˆ ˆ ˆ ˆ ˆ ˆ e n ee nn ne
H T T V V V Eq. II-2
with
2
1
1ˆ2
N
e i
i
T Eq. II-3
2
1
ˆ2
MA
n
A A
TM
Eq. II-4
1
1ˆ
N N
ee
i i j i j
Vr r
Eq. II-5
1
ˆ
M MA B
nn
A B A A B
Z ZV
R R Eq. II-6
1 1
ˆ
N MA
ne
i A i A
ZV
r R Eq. II-7
given in atomic units. In the above shown equations AM and AZ stand for the mass and charge of a nucleus, respectively. As the exact Schrödinger equation of a many-body system can neither analytically nor numerically be solved, one has to apply approximations. The most fundamental one is the Born-Oppenheimer approximation. The idea in this approach lies in the separation of electron and nucleus motion by using the fact that nuclei, due to their higher mass, move much slower than electrons. This approximation makes the assumption that the kinetic energy and electrostatic repulsion term of the nuclei in the total Hamiltonian can be seen as constant, hence resulting in an electronic Hamiltonian describing the motion of N electrons in an external field extV of M fixed point charges
ˆ ˆ ˆ ˆ elec e ee ne
H T V V Eq. II-8 where the solution to this electronic Hamiltonian is the electronic wave function
; el el i Ar R Eq. II-9
It describes the electron motion explicitly and the nuclear coordinates parametrically, i.e. for a given nuclei configuration el is a different function of the electron coordinates. Hence, the
total energy totE is then the sum of electronic energy elecE and the constant term for the
nuclear repulsion 1
M M
A Bnn
A B A AB
Z ZE
r, thus
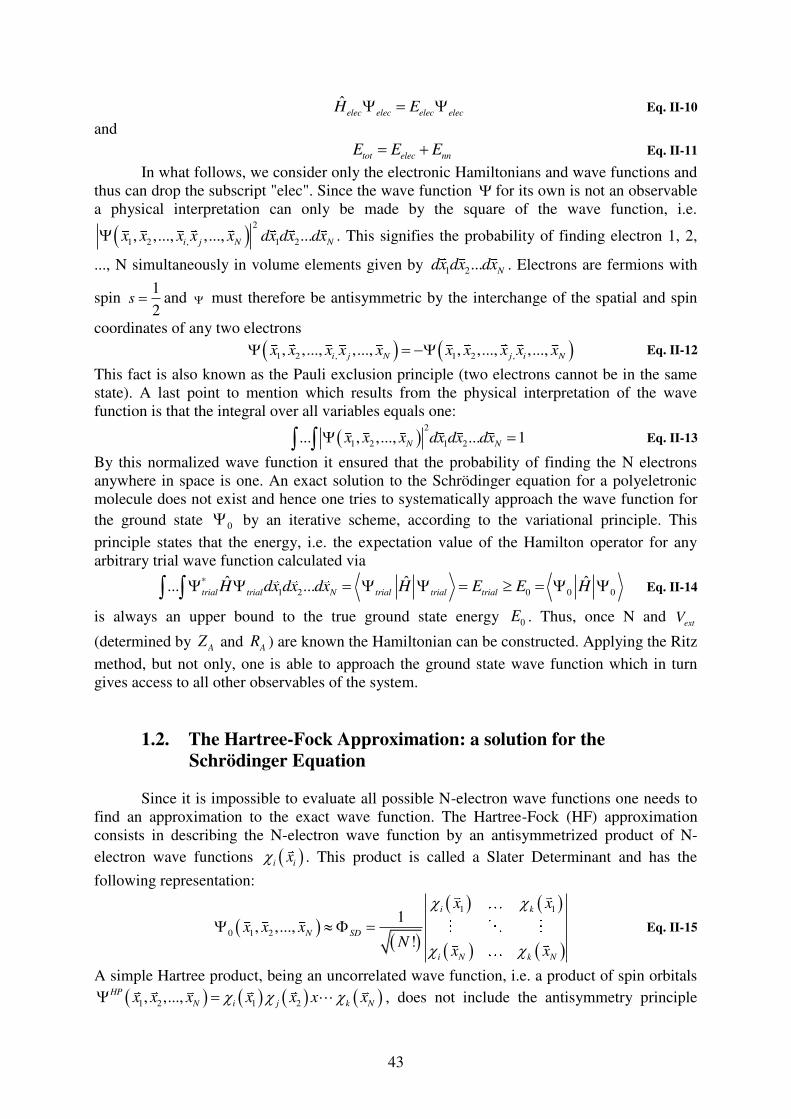
43
ˆelec elec elec elec
H E Eq. II-10
and tot elec nnE E E Eq. II-11
In what follows, we consider only the electronic Hamiltonians and wave functions and thus can drop the subscript "elec". Since the wave function for its own is not an observable a physical interpretation can only be made by the square of the wave function, i.e.
2
1 2 , 1 2, ,..., ,..., ...i j N N
x x x x x dx dx dx . This signifies the probability of finding electron 1, 2,
..., N simultaneously in volume elements given by 1 2... Ndx dx dx . Electrons are fermions with
spin 12
s and must therefore be antisymmetric by the interchange of the spatial and spin
coordinates of any two electrons
1 2 , 1 2 ,, ,..., ,..., , ,..., ,..., i j N j i N
x x x x x x x x x x Eq. II-12
This fact is also known as the Pauli exclusion principle (two electrons cannot be in the same state). A last point to mention which results from the physical interpretation of the wave function is that the integral over all variables equals one:
2
1 2 1 2... , ,..., ... 1 N Nx x x dx dx dx Eq. II-13
By this normalized wave function it ensured that the probability of finding the N electrons anywhere in space is one. An exact solution to the Schrödinger equation for a polyeletronic molecule does not exist and hence one tries to systematically approach the wave function for the ground state 0 by an iterative scheme, according to the variational principle. This principle states that the energy, i.e. the expectation value of the Hamilton operator for any arbitrary trial wave function calculated via
*1 2 0 0 0
ˆ ˆ ˆ... ...trial trial N trial trial trial
H dx dx dx H E E H Eq. II-14
is always an upper bound to the true ground state energy 0E . Thus, once N and ext
V
(determined by AZ and AR ) are known the Hamiltonian can be constructed. Applying the Ritz method, but not only, one is able to approach the ground state wave function which in turn gives access to all other observables of the system.
1.2. The Hartree-Fock Approximation: a solution for the
Schrödinger Equation
Since it is impossible to evaluate all possible N-electron wave functions one needs to find an approximation to the exact wave function. The Hartree-Fock (HF) approximation consists in describing the N-electron wave function by an antisymmetrized product of N-electron wave functions i ix . This product is called a Slater Determinant and has the
following representation:
1 1
0 1 2
1, ,...,
!
i k
N SD
i N k N
x x
x x xN
x x
Eq. II-15
A simple Hartree product, being an uncorrelated wave function, i.e. a product of spin orbitals
1 2 1 2, ,...,HP
N i j k Nx x x x x x x , does not include the antisymmetry principle
44
and therefore are not apt to correctly describe the wave function of fermions. By i ix one
understand the one electron wave function, called spin orbitals, being composed of a spatial orbital i r and one of the two spin orbitals s or s resulting in
i ix r s , , Eq. II-16
with the Kronecker delta ij
which equals 1 for i j , it is said that the spin orbitals are
orthonormal, and 0 for i j
*i i i i i i ij
x x dx Eq. II-17
Nevertheless, a Slater determinant representing the true N-electron wave function is also a drastic approximation, but however a more convenient approach than a simple Hartree product. In the HF scheme the i i
x are varied under the constraint that they rest
orthonormal and the energy of a Slater determinant is minimal. Expanding the determinant for the various parts of the Hamiltonian results in the HF energy given by
1ˆ2
N N N
HF SD SD
i i j
E H i h i ii jj ij ji Eq. II-18
with
* 21 1 1
1
1ˆ2
A
Ai i
M A
Zi h i x x dx
r Eq. II-19
describing the contribution resulting from the kinetic energy of the electrons and the electron-nucleus attraction and with
2 2
1 2 1 212
1 i iii jj x x dx dx
r Eq. II-20
* *1 1 2 2 1 2
12
1 i j j iij ji x x x x dx dx
r Eq. II-21
where the first term is called the Coulomb integral and the second exchange integral. The only variational freedom in this approximation is the choice of the orbitals. By the constraint that during energy minimisation the i i
x must remain orthonormal one obtains the HF equations
for a single particle which aims in finding the most apt spin orbitals for which HFE is minimal ˆ
i i if , 1,2,...,i N Eq. II-22
These N equations are eigenvalue equations where the Lagrangian multipliers i are the eigenvalues of the Fock operator and represent orbital energies. As mentioned above, the Fock operator is an effective one-electron operator given by the following definition
21ˆ ( )2
MA
i i HF
A iA
Zf V i
r Eq. II-23
The first two terms are the kinetic energy of the electrons and the energy due to the nucleus-electron attraction, with HFV i being the HF potential. This potential represents the
average repulsive potential seen by electron i in the field of the remaining N-1 electrons.
Hence, the two-electron operator 1
ijr
in the Hamiltonian is replaced by a simpler one-electron
operator HFV i constituted of the following two terms:
45
1 1 1ˆ ˆ ˆ
N
HF j j
j
V x J x K x Eq. II-24
Herein the Coulomb operator J is
2
1 2 212
1ˆj j
J x x dxr
Eq. II-25
and describes the potential that one electron at position 1x experiences due to the average
charge distribution of another electron in the spin orbital j
. This operator and its resulting
potential are called local, because it depends only on j
at the given position 1x . Whereas the
second term, i.e. the exchange contribution to the HF potential is described by the exchange operator K defined by
*1 1 2 2 2 1
12
1ˆj i j i j
K x x x x dx xr
Eq. II-26
The result of K operating on the spin orbital 1i x depends not only on the value of i on
all points space but is also related to 2x . Hence, it is said the exchange potential is non-local. Moreover, as the spin orbitals are orthonormal the exchange potential contribution exists only for electrons with identical spin, integrands of electrons with antiparallel spin would result in zero. The double summation given in equation II-21 allows terms such as i j which means that the Coulomb interaction of equation II-23 describes the interaction of the charge distribution of one electron with itself. However, the exchange part accounts for this self-interaction. As the HF operator depends via the HF potential on its own spin orbitals one has to solve the problem iteratively by a technique called the self-consistent field (SCF).
1.3. Post Hartree-Fock methods: Electron correlation
As seen in the preceding section Slater determinants SD are approximations to the real wave function and thus according to the variational principle one always gets the HF energy which is higher than the exact ground state energy 0E (within the Born-Oppenheimer approximation and without taking relativistic effects into account). According to Löwdin1, 1959, the difference between these two energies is called the correlation energy HF
corrE
0HF
corr HFE E E Eq. II-27
and is a measure for the error introduced by the HF approximation. The major part of the electron correlation results from the instantaneous repulsion of the electrons which is not described by the HF potential. Herein the electron-electron repulsion is treated in an average manner resulting in a too large term and yielding an energy HFE which is above 0E .This short range effect is called dynamical correlation since it is related to the movements of the distinct electrons whereas the second part, i.e. the static correlation, of HF
corrE is due to the fact that one
Slater determinant is not a good approximation to the real ground state wave function since there are other nearly degenerated Slater determinants describing the ground state. To overcome these problems several so called post HF methods exist.
46
1.3.1. Configuration Interaction
The principle of the configuration interaction (CI) is in such a way different form HF
that the system's wave function is described by more than one Slater determinant. The Slater determinant which is also used for HF calculations is called ground state or HF-determinant. All other determinants are sorted the way in how many orbitals they differ from the HF-determinant. They are called single, double, triple, etc. excited determinants. A linear combination of these determinants gives the CI-wave function of the system:
0, ,
...
HF r r rs rs rst rst
elec a a ab ab abc abc
ra a b r s a b c r s t
a a a a Eq. II-28
Herein a, b, c are the occupied molecular orbitals, whereas r, s, t are called unoccupied or virtual orbitals. By variation of the coefficients a and if every possible determinant is taken into account, one speaks of a full-CI calculation, leading to the full-CI wave function of the system. However, a full-CI calculation is from the computational point of view only feasible for small molecules with small basis sets (see later for the definition of the basis set). For larger systems and basis sets the CI space is limited, leading to a so called truncated CI method. The most popular approach takes only determinants to a certain excitation level into account, e.g. single excitations (CIS), single and double excitations (CISD) or single, double and triple excitations (CISDT). This truncated CI method is still variational, so that the calculated energy gets smaller, the more determinants are taken into account. Both, the CI coefficients and those of the HF orbital expansion are varied to get the energy of the ground state. Therefore the multi-configurational self-consistent field (MCSCF) approach is used.
1.3.2. Møller and Plesset perturbation theory
One of the computationally less demanding approach to account for the correlation
energy is via the perturbation theory presented by Møller and Plesset2. The starting point is the HF wave function and energy to which a perturbation A is applied. The total Hamiltonian of the system can then be written as the sum of the HF Hamiltonian and a perturbation. However, the approach makes only sense, if the perturbation is smaller than the exact Hamiltonian.
0ˆˆ ˆ H H A Eq. II-29
with 0 1 . This theory allows to evaluate the energy and the wave function at the nth order, where the 0th order is the HF energy and wave function, E0 and 0 respectively. With this new Hamiltonian the eigenvalue problem becomes
0ˆˆ ˆ
i i iH H EA Eq. II-30
with known eigenfunctions and eigenvalues of 0H , 0 0 0
0ˆ
i i iH E Eq. II-31
The eigenfunctions and eigenvalues can now be expanded in a Taylor series, 0 1 22 ...
i i i iE E E E Eq. II-32
0 1 22 ... i i i i Eq. II-33
The main idea is now, that the undisturbed Hamiltonian is given by the HF theory and the small perturbation comes from the electron-correlation, hence the difference between the true ground state and the HF energy.
47
0ˆ ˆˆ ˆ ˆ i i ij ij
i i ij
H f h J K Eq. II-34
0
1 1ˆ ˆ ˆ ˆ ˆ2 2
i ij ij
i ij ijij ij
h H J Kr r
A Eq. II-35
The zeroth order energy is the expectation value of 0H with the zeroth order wave function,
i.e. the Slater determinants. The true ground state energy in zeroth order ( 00E ) is the sum of
the eigenvalues and hence does not correspond to the HF energy. This is obtained in first order and hence the HF ground state energy can be written as
0 10 0
1 1ˆˆ ˆ ˆ ˆ2 2
i ij ij i ij ij
i ij i ij
E E J K h J K Eq. II-36
The correction to the true ground state energy in second order is
20 0
0 02
0 0 00 0
ˆ
m m
EE E
A
Eq. II-37
and contains the interactions of the HF ground state with all excited HF determinants 0m . An
evaluation of the MP2 energy is expensive. First of all, the HF problem has to be solved, i.e. the diagonalisation of the Fock-Matrix, calculated in an atomic orbital basis. The dimension of this matrix M is given by the number of basis-functions used. An MP2 evaluation of the energy covers about 80-90% of the correlation-energy, whereas MP4 covers 95-98%, but both with a very high expenditure of time (MP2 scales N5, and MP4 N6, with N being the number of basis functions). However, instead of determining the system's wave function in order to obtain the ground state energy, a computationally less demanding ab initio theory exists, providing a computationally easier way to evaluate the electron correlation. This method is referred to as density functional theory (DFT).
1.4. Density-Functional Theory
1.4.1. The Hohenberg-Kohn theorem
The density-functional theory (DFT) is based on the groundbreaking first theorem by
Hohenberg and Kohn3 which proofs that the ground state energy of an electronic system with N electrons is a functional of the electronic density:
2
1 2 2 2 1 2( ) ... ( , , , ..., , ) ... N N Nr N r s r s r s drdr dr Eq. II-38
Hence, with a given known density ( ) r it is possible to establish the Hamilton operator, solve the Schrödinger equation and determine the system's wave function and energy eigenvalues and lastly all the properties of the system. Therefore, and compared to the HF theory, only three (or four, if spin is included) variables are needed to describe an N-electron system. As mentioned in the preceding chapter, within the Born-Oppenheimer approximation, the electrons are moving in an electrostatic field of fixed nuclei. As a consequence, the kinetic energy of the nuclei equals zero and the nuclei-nuclei repulsion can be expressed by a constant. With this approximation, the electronic energy can therefore be written as a functional of the electron density:
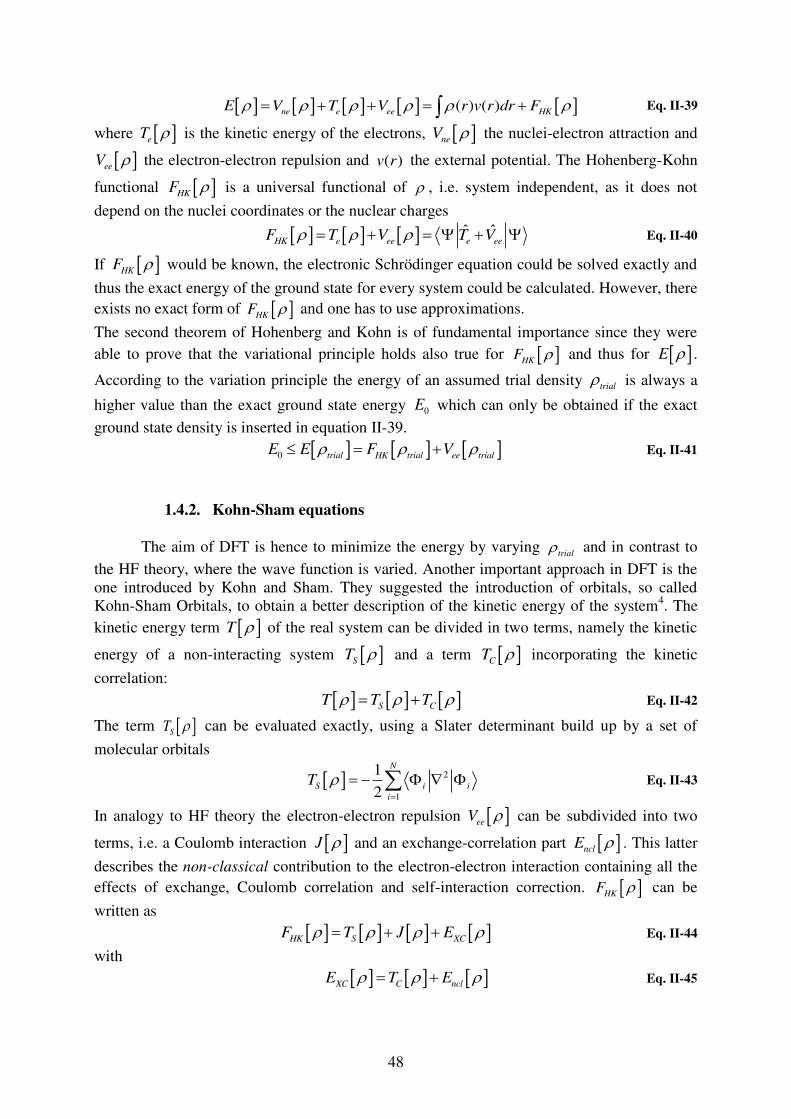
48
( ) ( ) ne e ee HKE V T V r v r dr F Eq. II-39
where eT is the kinetic energy of the electrons, neV the nuclei-electron attraction and
eeV the electron-electron repulsion and ( )v r the external potential. The Hohenberg-Kohn
functional HKF is a universal functional of , i.e. system independent, as it does not
depend on the nuclei coordinates or the nuclear charges
ˆ ˆ HK e ee e ee
F T V T V Eq. II-40
If HKF would be known, the electronic Schrödinger equation could be solved exactly and
thus the exact energy of the ground state for every system could be calculated. However, there exists no exact form of HK
F and one has to use approximations.
The second theorem of Hohenberg and Kohn is of fundamental importance since they were able to prove that the variational principle holds also true for HK
F and thus for E .
According to the variation principle the energy of an assumed trial density trial is always a
higher value than the exact ground state energy 0E which can only be obtained if the exact ground state density is inserted in equation II-39.
0 trial HK trial ee trialE E F V Eq. II-41
1.4.2. Kohn-Sham equations
The aim of DFT is hence to minimize the energy by varying
trial and in contrast to
the HF theory, where the wave function is varied. Another important approach in DFT is the one introduced by Kohn and Sham. They suggested the introduction of orbitals, so called Kohn-Sham Orbitals, to obtain a better description of the kinetic energy of the system4. The kinetic energy term T of the real system can be divided in two terms, namely the kinetic
energy of a non-interacting system ST and a term CT incorporating the kinetic
correlation:
S CT T T Eq. II-42
The term ST can be evaluated exactly, using a Slater determinant build up by a set of
molecular orbitals
2
1
12
N
S i i
i
T Eq. II-43
In analogy to HF theory the electron-electron repulsion eeV can be subdivided into two
terms, i.e. a Coulomb interaction J and an exchange-correlation part nclE . This latter
describes the non-classical contribution to the electron-electron interaction containing all the effects of exchange, Coulomb correlation and self-interaction correction. HK
F can be
written as
HK S XCF T J E Eq. II-44
with
XC C nclE T E Eq. II-45
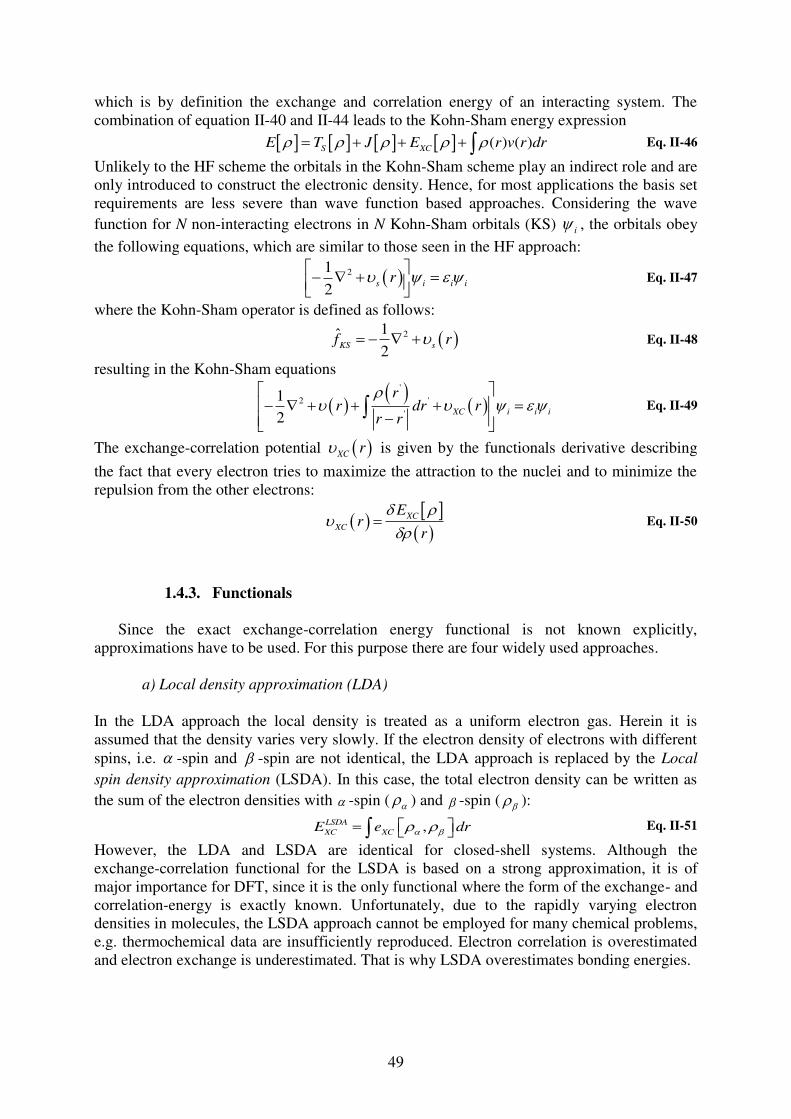
49
which is by definition the exchange and correlation energy of an interacting system. The combination of equation II-40 and II-44 leads to the Kohn-Sham energy expression
( ) ( ) S XCE T J E r v r dr Eq. II-46
Unlikely to the HF scheme the orbitals in the Kohn-Sham scheme play an indirect role and are only introduced to construct the electronic density. Hence, for most applications the basis set requirements are less severe than wave function based approaches. Considering the wave function for N non-interacting electrons in N Kohn-Sham orbitals (KS) i , the orbitals obey the following equations, which are similar to those seen in the HF approach:
212
s i i i
r Eq. II-47
where the Kohn-Sham operator is defined as follows:
21ˆ2
KS s
f r Eq. II-48
resulting in the Kohn-Sham equations
'
2 '
'
12
XC i i i
rr dr r
r r Eq. II-49
The exchange-correlation potential XC r is given by the functionals derivative describing
the fact that every electron tries to maximize the attraction to the nuclei and to minimize the repulsion from the other electrons:
XC
XC
Er
r Eq. II-50
1.4.3. Functionals
Since the exact exchange-correlation energy functional is not known explicitly,
approximations have to be used. For this purpose there are four widely used approaches.
a) Local density approximation (LDA)
In the LDA approach the local density is treated as a uniform electron gas. Herein it is assumed that the density varies very slowly. If the electron density of electrons with different spins, i.e. -spin and -spin are not identical, the LDA approach is replaced by the Local
spin density approximation (LSDA). In this case, the total electron density can be written as the sum of the electron densities with -spin ( ) and -spin ( ):
, LSDA
XC XCE e dr Eq. II-51
However, the LDA and LSDA are identical for closed-shell systems. Although the exchange-correlation functional for the LSDA is based on a strong approximation, it is of major importance for DFT, since it is the only functional where the form of the exchange- and correlation-energy is exactly known. Unfortunately, due to the rapidly varying electron densities in molecules, the LSDA approach cannot be employed for many chemical problems, e.g. thermochemical data are insufficiently reproduced. Electron correlation is overestimated and electron exchange is underestimated. That is why LSDA overestimates bonding energies.

50
b) Generalized gradient approximation (GGA)
A way to improve LSDA is in considering the electron gas as non-uniform. For the GGA approach (or semi-local method) the electron density and its gradients are evaluated.
, , , , GGA
XCE f dr Eq. II-52
Moreover, the exchange-correlation energy is divided into and exchange ( GGA
XE ) and
correlation part ( GGA
CE ). Both terms are approximated separately and in general the larger
energetic contribution arises from GGA
XE . Becke introduced in 1988 one of the today's most
famous exchange-functional5. It makes use of an empirical parameter, fitted to the exact-exchange energies of noble gas atoms. It is known under the abbreviation B or B88 and is often combined with a correlation functional developed by Lee, Yang and Parr (LYP)6. The combination of both terms results in the most widely used GGA functional called BLYP7. It includes the dynamical correlation and yields good results in thermochemistry, but barriers are underestimated due to the fact that GGAs are not self-interaction free. However, all GGA functionals lack in describing long-range electronic correlation effects, responsible for van der Waals forces, playing an important role for many chemical problems (e.g. orientation of molecules on surfaces). Therefore, finding DFT functionals including dispersion forces have become an active field of research over the last years.
c) DFT + dispersion corrections
A widely used method is the use of semi empirical GGAs with long range dispersion correction as presented by Grimme8 and employed in VASP. The method used in this work is referred to as DFT-D2 (employed functional: PBE)9. In this approach an empiric energy correction
dispE is added to the electronic energy after each SCF.
DFT D KS DFT disp
E E E Eq. II-53
The dispersion term depends on dispersion coefficients (calculated from atomic ionisation potentials and static dipole polarizabilities), the distance between atomic pairs and the sum of atomic van der Waals radii.
1
66 6
1 1
at atN N ij
disp damp ij
i j i ij
CE s f R
R Eq. II-54
with :
/ 1
1
1
ij r
damp ij d R Rf R
e
Eq. II-55
And:
6s : a global scaling factor depending on the employed functional
atN : number of atoms in the system
6ij
C : dispersion coefficients for atom pair ij
ijR : interatomic distance
dampf : damping function allowing to avoid problems at short distances and the double
counting of van der Waals interactions already included in the functional d : damping parameter
rR : sum of the atomic radii
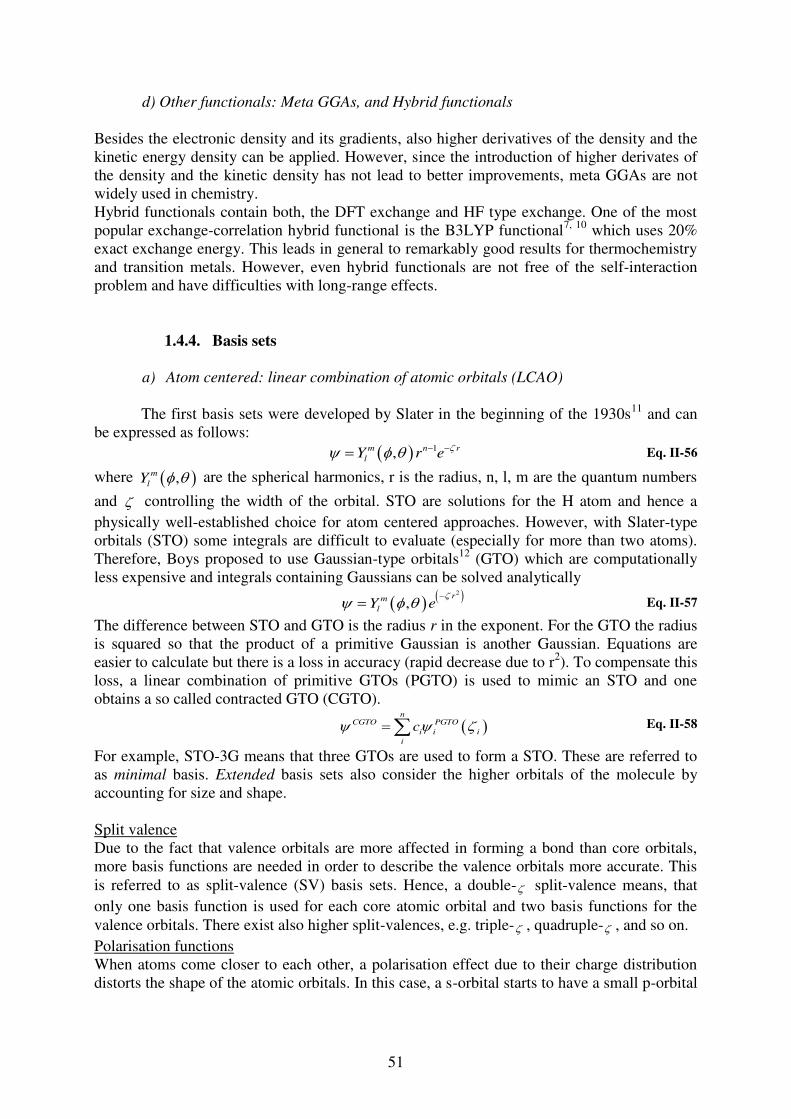
51
d) Other functionals: Meta GGAs, and Hybrid functionals
Besides the electronic density and its gradients, also higher derivatives of the density and the kinetic energy density can be applied. However, since the introduction of higher derivates of the density and the kinetic density has not lead to better improvements, meta GGAs are not widely used in chemistry. Hybrid functionals contain both, the DFT exchange and HF type exchange. One of the most popular exchange-correlation hybrid functional is the B3LYP functional7, 10 which uses 20% exact exchange energy. This leads in general to remarkably good results for thermochemistry and transition metals. However, even hybrid functionals are not free of the self-interaction problem and have difficulties with long-range effects.
1.4.4. Basis sets
a) Atom centered: linear combination of atomic orbitals (LCAO)
The first basis sets were developed by Slater in the beginning of the 1930s11 and can
be expressed as follows: 1,m n r
lY r e Eq. II-56
where , m
lY are the spherical harmonics, r is the radius, n, l, m are the quantum numbers
and controlling the width of the orbital. STO are solutions for the H atom and hence a physically well-established choice for atom centered approaches. However, with Slater-type orbitals (STO) some integrals are difficult to evaluate (especially for more than two atoms). Therefore, Boys proposed to use Gaussian-type orbitals12 (GTO) which are computationally less expensive and integrals containing Gaussians can be solved analytically
2
,
rm
lY e Eq. II-57
The difference between STO and GTO is the radius r in the exponent. For the GTO the radius is squared so that the product of a primitive Gaussian is another Gaussian. Equations are easier to calculate but there is a loss in accuracy (rapid decrease due to r2). To compensate this loss, a linear combination of primitive GTOs (PGTO) is used to mimic an STO and one obtains a so called contracted GTO (CGTO).
n
CGTO PGTO
i i i
i
c Eq. II-58
For example, STO-3G means that three GTOs are used to form a STO. These are referred to as minimal basis. Extended basis sets also consider the higher orbitals of the molecule by accounting for size and shape. Split valence Due to the fact that valence orbitals are more affected in forming a bond than core orbitals, more basis functions are needed in order to describe the valence orbitals more accurate. This is referred to as split-valence (SV) basis sets. Hence, a double- split-valence means, that only one basis function is used for each core atomic orbital and two basis functions for the valence orbitals. There exist also higher split-valences, e.g. triple- , quadruple- , and so on. Polarisation functions When atoms come closer to each other, a polarisation effect due to their charge distribution distorts the shape of the atomic orbitals. In this case, a s-orbital starts to have a small p-orbital
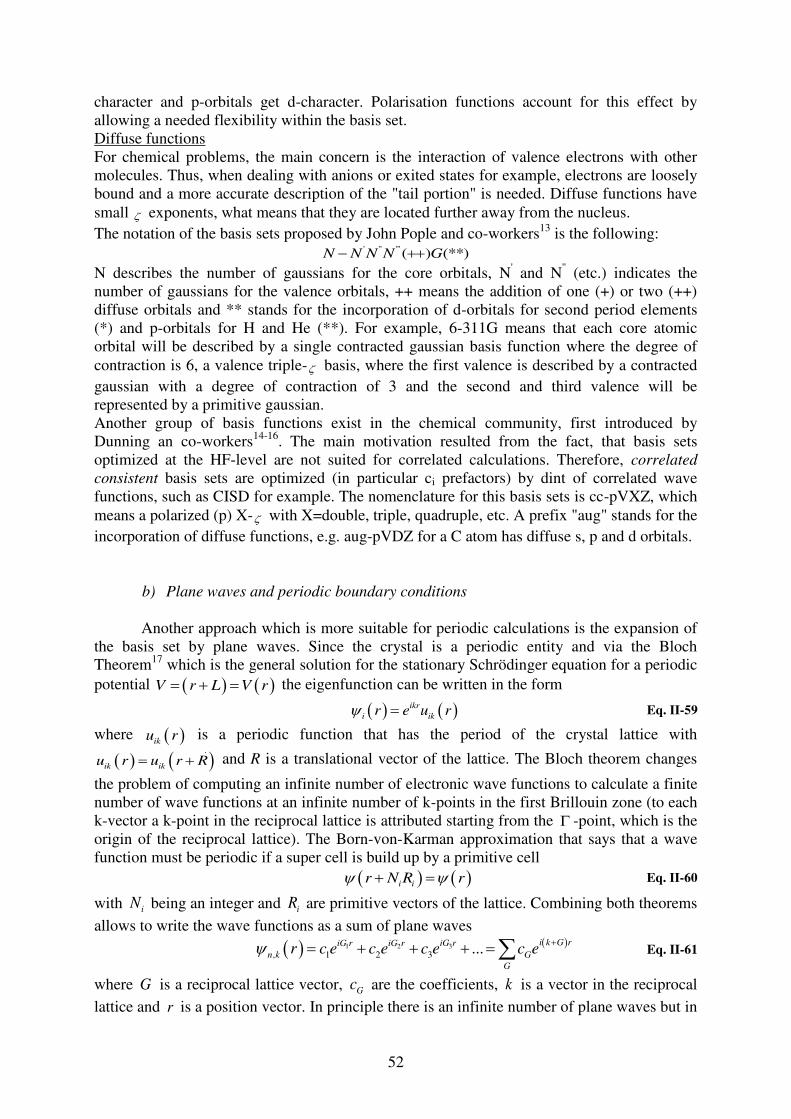
52
character and p-orbitals get d-character. Polarisation functions account for this effect by allowing a needed flexibility within the basis set. Diffuse functions For chemical problems, the main concern is the interaction of valence electrons with other molecules. Thus, when dealing with anions or exited states for example, electrons are loosely bound and a more accurate description of the "tail portion" is needed. Diffuse functions have small exponents, what means that they are located further away from the nucleus. The notation of the basis sets proposed by John Pople and co-workers13 is the following:
' '' '''( ) (**) N N N N G N describes the number of gaussians for the core orbitals, N' and N'' (etc.) indicates the number of gaussians for the valence orbitals, ++ means the addition of one (+) or two (++) diffuse orbitals and ** stands for the incorporation of d-orbitals for second period elements (*) and p-orbitals for H and He (**). For example, 6-311G means that each core atomic orbital will be described by a single contracted gaussian basis function where the degree of contraction is 6, a valence triple- basis, where the first valence is described by a contracted gaussian with a degree of contraction of 3 and the second and third valence will be represented by a primitive gaussian. Another group of basis functions exist in the chemical community, first introduced by Dunning an co-workers14-16. The main motivation resulted from the fact, that basis sets optimized at the HF-level are not suited for correlated calculations. Therefore, correlated
consistent basis sets are optimized (in particular ci prefactors) by dint of correlated wave functions, such as CISD for example. The nomenclature for this basis sets is cc-pVXZ, which means a polarized (p) X- with X=double, triple, quadruple, etc. A prefix "aug" stands for the incorporation of diffuse functions, e.g. aug-pVDZ for a C atom has diffuse s, p and d orbitals.
b) Plane waves and periodic boundary conditions
Another approach which is more suitable for periodic calculations is the expansion of
the basis set by plane waves. Since the crystal is a periodic entity and via the Bloch Theorem17 which is the general solution for the stationary Schrödinger equation for a periodic potential V r L V r the eigenfunction can be written in the form
ikr
i ikr e u r Eq. II-59
where iku r is a periodic function that has the period of the crystal lattice with
ik ik
u r u r R and R is a translational vector of the lattice. The Bloch theorem changes
the problem of computing an infinite number of electronic wave functions to calculate a finite number of wave functions at an infinite number of k-points in the first Brillouin zone (to each k-vector a k-point in the reciprocal lattice is attributed starting from the -point, which is the origin of the reciprocal lattice). The Born-von-Karman approximation that says that a wave function must be periodic if a super cell is build up by a primitive cell
i ir N R r Eq. II-60
with iN being an integer and iR are primitive vectors of the lattice. Combining both theorems allows to write the wave functions as a sum of plane waves
31 2, 1 2 3 ... i k G riG riG r iG r
n k G
G
r c e c e c e c e Eq. II-61
where G is a reciprocal lattice vector, Gc are the coefficients, k is a vector in the reciprocal lattice and r is a position vector. In principle there is an infinite number of plane waves but in
53
practice only those reciprocal lattice vectors are kept in the expansion that fulfil the following condition
2
2 cut
k GE
Eq. II-62
while the remaining coefficients are set to zero. Hence, the cut-off energy, cutE determines the energy and the number of plane waves that are kept in the expansion. From this, it is obvious that the higher the cut-off energy, the more plane waves are included in the expansion and thus the better the description of the electronic system. However, a higher number of plane waves is computationally more expensive.
c) Pseudopotentials
The fact that core electrons have a high kinetic energy, i.e. a short wave length, means
that they have to be treated with a higher spatial resolution. Pseudopotentials serve to replace the atomic all-electron potential in such a way, that the electronic core states are no longer treated explicitly. They are treated as frozen cores. In quantum mechanics all wave functions describing electronic states need to be orthogonal to each other. Hence, the valence electron wave function has to be orthogonal to the core electron wave function which is difficult to describe numerically, due to the high oscillation of the wave function near the core. Thus, it is more justifiable to replace the real wave function by an ionic component describing the cores by a nodeless, smoother wave function (frozen core approximation) which describe the electrons properties in the bonding region and nearly zero probability for the valence electrons in the core region (i.e. no oscillation of the wave function). Hence, the wave function of the pseudo-potentials have the same scattering properties of the all electron wave function outside the scattering region (defined by a cut-off radius Cr ) and a smoother behavior inside the core region. Throughout this work and mostly used are pseudo-potentials of the projector augmented wave (PAW)18, 19 method. The main idea is to replace the real valence electron wave function AE
V
into three terms: AE PS PS AE
V V i i i i
i i
c c Eq. II-63
where PS
V is a valence electron pseudo-wave function which reproduces the behavior of the
all electron wave function (in the augmentation region) expected in the core region, AE
i is
exact in the augmentation region (incorporating the node structure of the exact wave function) and smoothly decays to zero in the outside and a net part PS
i which is also smooth. The latter
two are local functions defined in the augmentation spheres where i comprises the quantum numbers n, l and m.
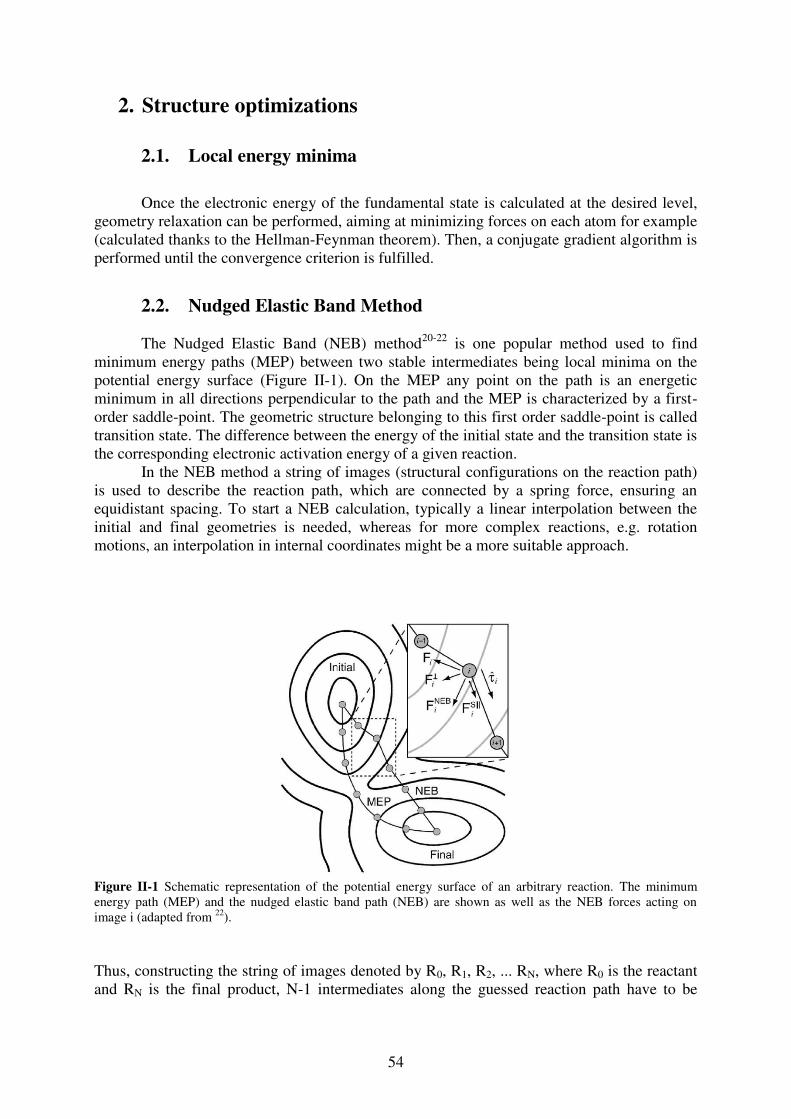
54
2. Structure optimizations
2.1. Local energy minima
Once the electronic energy of the fundamental state is calculated at the desired level,
geometry relaxation can be performed, aiming at minimizing forces on each atom for example (calculated thanks to the Hellman-Feynman theorem). Then, a conjugate gradient algorithm is performed until the convergence criterion is fulfilled.
2.2. Nudged Elastic Band Method
The Nudged Elastic Band (NEB) method20-22 is one popular method used to find
minimum energy paths (MEP) between two stable intermediates being local minima on the potential energy surface (Figure II-1). On the MEP any point on the path is an energetic minimum in all directions perpendicular to the path and the MEP is characterized by a first-order saddle-point. The geometric structure belonging to this first order saddle-point is called transition state. The difference between the energy of the initial state and the transition state is the corresponding electronic activation energy of a given reaction.
In the NEB method a string of images (structural configurations on the reaction path) is used to describe the reaction path, which are connected by a spring force, ensuring an equidistant spacing. To start a NEB calculation, typically a linear interpolation between the initial and final geometries is needed, whereas for more complex reactions, e.g. rotation motions, an interpolation in internal coordinates might be a more suitable approach.
Figure II-1 Schematic representation of the potential energy surface of an arbitrary reaction. The minimum energy path (MEP) and the nudged elastic band path (NEB) are shown as well as the NEB forces acting on image i (adapted from 22). Thus, constructing the string of images denoted by R0, R1, R2, ... RN, where R0 is the reactant and RN is the final product, N-1 intermediates along the guessed reaction path have to be

55
optimized. In order to avoid problems (i.e. corner cutting and down-sliding from the MEP) related with the optimization of an object function F
12
1 11 1
( ,..., ) ( ) ( )2
N N
N i i i
i i
kF R R E R R R Eq. II-64
where k is the spring constant, a force projection is introduced, referring to as "nudging". Since the corner-cutting results from the component of the spring force perpendicular to the path and the reason for the down-sliding comes from the parallel component from the interaction between the atoms in the system, the structures along the NEB path are relaxed to the MEP by a force projection scheme. Here, potential forces are perpendicular to the band and the spring forces act parallel to the band. Hence, this leads to a NEB force on image i containing two components
|| NEB S
i i iF F F Eq. II-65
with : ˆ ˆ( ) ( )
i i i i iF R R Eq. II-66
being the force component due to the potential perpendicular to the band and : ||
1 1 ˆ( ) S
i i i i i iF k R R R R Eq. II-67
as the spring force parallel to the band.
Note, 1 1
1 1
i i
i
i i
R R
R R is the unit vector at an image i estimated from two adjacent images,
Ri+1 and Ri-1, along the path. The most common strategies for finding a saddle point between the initial and final states are first to roughly optimize the NEB path followed either by a 'min-mode' following transition state search or by performing a quasi-Newton structure optimization, both on the image with the highest energy. Another approach, which is similar to the NEB method and called climbing-image NEB (CI-NEB)23 can be used to more efficiently determine the saddle point. In the CI-NEB method, the images with the highest energy, is not subjected to a spring force coming from adjacent images and thus climbs to the saddle point.
3. Electronic calculations: tools and parameters used in this
work
3.1. Choice of the methodology
Since the systems under consideration are of significant size and of great complexity, density functional theory (DFT) will be used first. This level of theory is the minimal required for the simulation of the breaking and formation of bonds as well as for evaluating adsorption energies, all occurring within the zeolites cavities. Periodic boundary condition (pbc) calculations to account for surface curvature effects (confinement effect),24, 25 as implemented in the VASP code,19, 26, 27 will be used.
However, an accurate description of the reaction steps, when evaluating adsorption energies and especially activation barriers, the DFT-D approach by its own may not be accurate enough and more sophisticated levels of theory, which in particular are better accounting for the electron correlation, are needed. Hybrid schemes, such as QM/QM schemes, are used to evaluate the system at a higher level of theory. An additive hybrid MP2:DFT scheme has been proposed within the QMPOT28-30 code developed by Sauer and Tuma and has been extensively used in the literature. Within this method, one part of the
56
system is treated in a low level approach (e.g. periodic DFT), hence with a fewer accuracy, whereas the part of interest is treated as a cluster being cut out from the complete system, and treated at a higher level (e.g. MP2) of theory to better account for the electron correlation.
3.2. VASP
Structure optimisations have been performed by dint of the Vienna ab initio simulation package VASP26, 27, 31. For the exchange correlation functional, the generalized gradient approximation (GGA) of Perdew, Burke and Ernzerhof9 (PBE) is used. Moreover, an empirical method to account for van der Waals forces, firstly introduced by Grimme8 is added to the exchange correlation functional (PBE-D), giving rise to so called DFT-D calculations. This additional dispersion interaction term accounts, to a certain extent, for long range interactions (van der Waals forces) mainly taking place during physisorption (but not only). In our VASP version (available at the beginning of the thesis) the dispersion correction is only evaluated by a two-body term accounting for the dispersion energy part, whereas the most recent dispersion corrected functionals (DFT-D3)32 use a two- and a three-body term leading to a better description of the dispersion contribution to the total energy. Very recently, van der Mynsbrugge et al. analysed in a very detailed study33 the reliability of different approaches (cluster, periodic boundary conditions) and functionals (e.g. PBE, PBE-D(2,3), M06-2X, B3LYP). For adsorption enthalpies on water, alcohols and nitriles, calculated by means of periodic boundary conditions employing the PBE-D2 functional34, they found very good and coherent results compared to literature data. A plane-wave basis set using the projector-augmented wave (PAW) method 19 originally developed by Blöchl18 has been employed.
The optimization of cell parameters was the object of a preliminary study reported in Appendix A1. For cell optimization calculations on pure silica zeolites (including ionic positions and cell parameters), a 1x1x1 conventional unit cell was used for FAU, CHA and ZSM-5 and a 1x1x2 primitive unit cell for MOR. This latter has been done since the cell parameter c is to small and hence to minimize the lateral interaction between periodic images of the acid sites and the extraframework species appearing during the demetallation process. For the large unit cells of the zeolites it is reasonable that all calculations were performed at the -point. The cutoff energy for the plane-wave basis is set to 800 eV for the full cell relaxation of siliceous zeolites. This setting avoids problems related to the incompleteness of the plane wave basis set with respect to volume variations (Pulay Stress). For all further calculations (only optimizing the atomic positions; unit cell parameters obtained from all-silica structures are kept fix) on protonic structures the value is set to 400 eV. The electronic optimizations were done up to a convergence of 1x10⁻⁶ eV for the SCF loop and until all forces on atoms are lower than 0.02 eV/Å. Adsorption energies ΔUads are defined as :
ads zeo water zeo waterU U U U Eq. II-68 with Uzeo, Uzeo-water and Uwater being the energy of the zeolite, the adsorbed zeolite-water system and the water molecule respectively.
Starting with the optimized initial and final structures a reaction path comprising 8 or 16 images, depending on the complexity of the analyzed reaction, is created. For this either a linear interpolation or for complex reactions the software Opt'nPath developed by Paul Fleurat-Lessard at ENS Lyon (Fleurat-Lessard, P. Opt’n Path http://perso.ens-lyon.fr/paul.fleurat-lessard/index.html.) were employed. In a first attempt, either with 8 or 16 images, a first NEB run is carried out. For this the cut-off energy is set to 400 eV and the
57
electronic structure optimizations were conducted up to a convergence of 1x10⁻⁶ eV for the SCF cycle and until all forces are lower than 0.02 eV/Å per atom. Since even a large number of ionic steps (~500) did not result in a converged reaction path, fulfilling the above mentioned criteria, the optimization is interrupted after 200 ionic steps. For some reactions, this approach is sufficient and the image highest on energy is subsequently subjected to a quasi-Newton optimization algorithm having the same convergence criteria as the NEB calculation. For more complex reactions, where the transition state could not be found by a first NEB run a subsequent NEB with 8 images between the two structures enclosing the supposed transition state is carried out. A subsequent quasi-Newton optimization of the transition state is followed by a vibrational analysis in order to obtain only one negative frequency along the reaction coordinate. For this, the same convergence criteria as for the NEB calculation have been employed with a displacement of 0.01 Å in each direction, in order to stay within the harmonic approximation. However, it is not possible to eliminate all but one imaginary frequency. Nevertheless, the resulting frequencies are of very low cm-1 and moreover part of the zeolitic framework and not implicated in the reaction center.
3.3. QMPOT
In general, the fact that efficient periodic DFT functionals do not properly account for long-range dispersion interactions and encounter the self-interaction error, results in the underestimation of adsorption energies and hence reaction barriers are too low. However, the use of dispersion corrected DFT functionals (DFT-D) showed a major improvement solid-state calculations and adsorption problems. But whether this approach is also applicable to reactions where bond rearrangements occur, is still a matter of debate. A possible solution to correctly describe the pore topology and hence the confinement effect in zeolites, not only by a cluster approach, is the use of periodic MP2 calculations. However, periodic MP2 calculations are only feasible for systems with few atoms in the unit cell as well as for small basis sets. On the other hand, hybrid-schemes combining MP2 and periodic DFT calculations such as the one presented by Tuma and Sauer29, 30can be used for the accurate calculation of reaction barriers for even larger periodic systems 35.
The reaction site, described by a cluster, is evaluated at the MP2 level with Gaussian basis sets and the periodic system is treated by DFT under periodic boundary conditions. It is possible to perform either an optimisation of the full system (cluster and periodic system) on the MP2:DFT potential energy surface or to optimize the entire system under periodic boundary conditions and calculate the MP2 correction on a cluster cut out from periodic DFT calculations. In our study, the second approach has been employed. Hybrid MP2:DFT structure optimisations were not conducted because of (i) the computational expense and (ii) the negligible impact of high-level optimisations on the final structure30. The cluster is then saturated with link atoms, i.e. hydrogen atoms (HL), and the Si-O-HL bond length is set to 1.029 Å. Hybrid MP2:DFT calculations start with structures optimized on the DFT-D2 level
under periodic boundary conditions ( S
PBE DE ).
The next step were single point calculations on MP2 level for a T8 cluster (Tx stands for the number of Si and Al atoms of which the cluster consists) cut from the optimized structure under periodic boundary conditions (Figure II-2) and periodic DFT calculations for
the T8 cluster ( cluster
PBE DE ). MP2 single point calculations were computed with the Turbomole
package36-38. RI-MP239-41 single-point energies were not corrected for BSSE (which is expected to be negligible for this basis set) but were extrapolated to the complete basis set
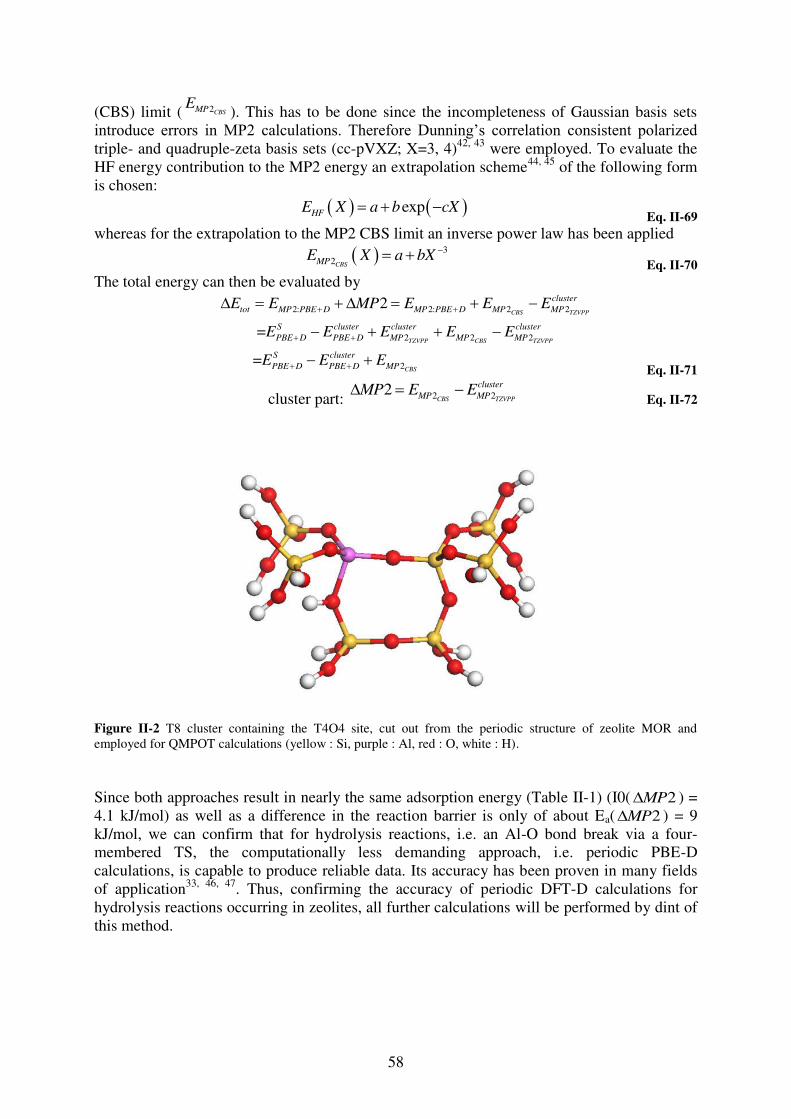
58
(CBS) limit ( 2CBSMPE
). This has to be done since the incompleteness of Gaussian basis sets introduce errors in MP2 calculations. Therefore Dunning’s correlation consistent polarized triple- and quadruple-zeta basis sets (cc-pVXZ; X=3, 4)42, 43 were employed. To evaluate the HF energy contribution to the MP2 energy an extrapolation scheme44, 45 of the following form is chosen:
exp HFE X a b cX Eq. II-69
whereas for the extrapolation to the MP2 CBS limit an inverse power law has been applied
32
CBSMPE X a bX
Eq. II-70 The total energy can then be evaluated by
2: 2: 2 2
2 2 2
2
2
=
=
CBS TZVPP
TZVPP CBS TZVPP
CBS
cluster
tot MP PBE D MP PBE D MP MP
S cluster cluster cluster
PBE D PBE D MP MP MP
S cluster
PBE D PBE D MP
E E MP E E E
E E E E E
E E E Eq. II-71
cluster part: 2 22CBS TZVPP
cluster
MP MPMP E E Eq. II-72
Figure II-2 T8 cluster containing the T4O4 site, cut out from the periodic structure of zeolite MOR and employed for QMPOT calculations (yellow : Si, purple : Al, red : O, white : H). Since both approaches result in nearly the same adsorption energy (Table II-1) (I0( 2MP ) = 4.1 kJ/mol) as well as a difference in the reaction barrier is only of about Ea( 2MP ) = 9 kJ/mol, we can confirm that for hydrolysis reactions, i.e. an Al-O bond break via a four-membered TS, the computationally less demanding approach, i.e. periodic PBE-D calculations, is capable to produce reliable data. Its accuracy has been proven in many fields of application33, 46, 47. Thus, confirming the accuracy of periodic DFT-D calculations for hydrolysis reactions occurring in zeolites, all further calculations will be performed by dint of this method.
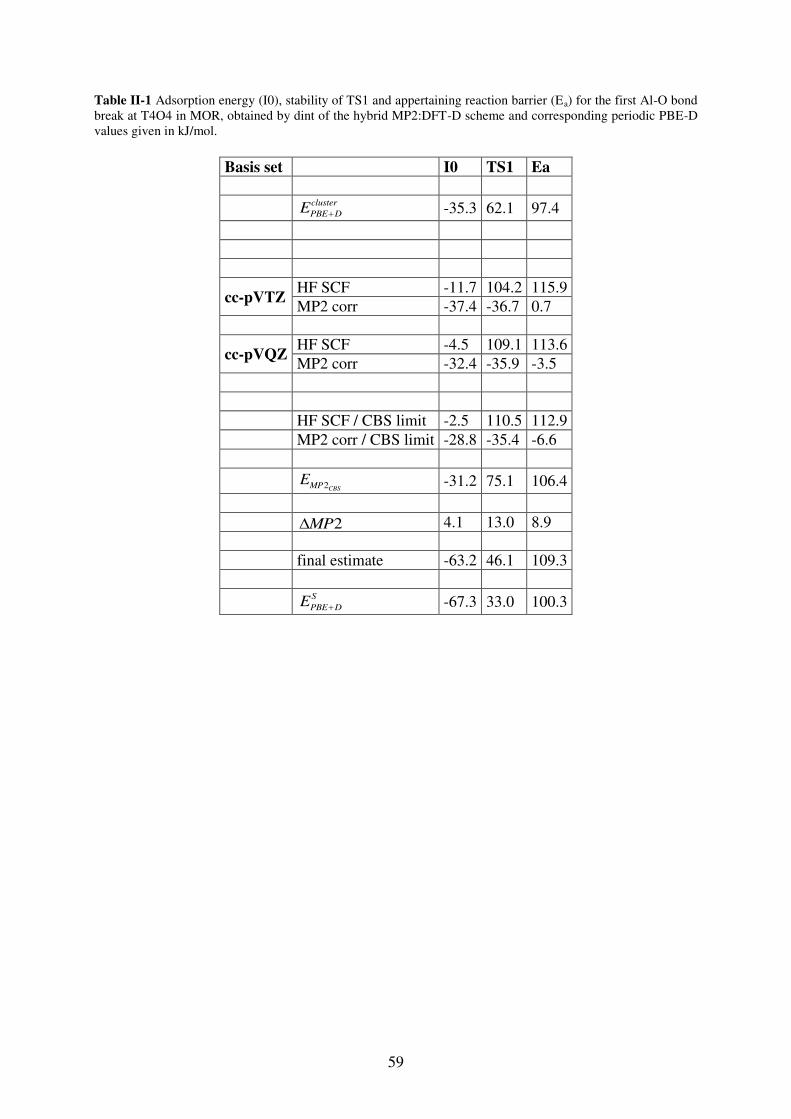
59
Table II-1 Adsorption energy (I0), stability of TS1 and appertaining reaction barrier (Ea) for the first Al-O bond break at T4O4 in MOR, obtained by dint of the hybrid MP2:DFT-D scheme and corresponding periodic PBE-D values given in kJ/mol.
Basis set I0 TS1 Ea
cluster
PBE DE -35.3 62.1 97.4
cc-pVTZ HF SCF -11.7 104.2 115.9 MP2 corr -37.4 -36.7 0.7
cc-pVQZ HF SCF -4.5 109.1 113.6 MP2 corr -32.4 -35.9 -3.5
HF SCF / CBS limit -2.5 110.5 112.9 MP2 corr / CBS limit -28.8 -35.4 -6.6 2CBSMP
E -31.2 75.1 106.4
2MP 4.1 13.0 8.9 final estimate -63.2 46.1 109.3
S
PBE DE -67.3 33.0 100.3
60
References 1. P.-O. Löwdin, Physical Review, 1955, 97, 1509-1520. 2. C. Møller and M. S. Plesset, Physical Review, 1934, 46, 618-622. 3. P. Hohenberg and W. Kohn, Physical Review, 1964, 136, B864-B871. 4. W. Kohn and L. J. Sham, Physical Review, 1965, 140, A1133-A1138. 5. A. D. Becke, Phys Rev A, 1988, 38, 3098-3100. 6. C. Lee, W. Yang and R. G. Parr, Phys Rev B, 1988, 37, 785-789. 7. A. D. Becke, The Journal of Chemical Physics, 1993, 98, 5648-5652. 8. S. Grimme, J. Comput. Chem., 2006, 27, 1787-1799. 9. J. P. Perdew, K. Burke and M. Ernzerhof, Phys. Rev. Lett., 1996, 77, 3865-3868. 10. P. J. Stephens, F. J. Devlin, C. F. Chabalowski and M. J. Frisch, J. Phys. Chem., 1994,
98, 11623-11627. 11. J. C. Slater, Physical Review, 1930, 36, 57-64. 12. S. F. Boys, Proceedings of the Royal Society of London. Series A. Mathematical and
Physical Sciences, 1950, 201, 125-137. 13. R. Ditchfield, W. J. Hehre and J. A. Pople, J. Chem. Phys., 1971, 54, 724-728. 14. J. T. H. Dunning, J. Chem. Phys., 1989, 90, 1007-1023. 15. R. A. Kendall, J. T. H. Dunning and R. J. Harrison, J. Chem. Phys., 1992, 96, 6796-
6806. 16. D. E. Woon and J. Thom H. Dunning, J. Chem. Phys., 1994, 100, 2975-2988. 17. F. Bloch, Z. Physik, 1929, 52, 555-600. 18. P. E. Blöchl, Phys Rev B, 1994, 50, 17953-17979. 19. G. Kresse and D. Joubert, Phys Rev B, 1999, 59, 1758-1775. 20. G. Henkelman and H. Jonsson, J. Chem. Phys., 2000, 113, 9978-9985. 21. H. Jónsson, G. Mills and K. W. Jacobsen, in Classical and quantum dynamics in
condensed phase simulations, World Scientific, 1998, pp. 385-404. 22. D. Sheppard, R. Terrell and G. Henkelman, J. Chem. Phys., 2008, 128. 23. G. Henkelman, B. P. Uberuaga and H. Jonsson, J. Chem. Phys., 2000, 113, 9901-
9904. 24. B. Boekfa, S. Choomwattana, P. Khongpracha and J. Limtrakul, Langmuir : the ACS
journal of surfaces and colloids, 2009, 25, 12990-12999. 25. E. G. Derouane, J. M. Andre and A. A. Lucas, J. Catal., 1988, 110, 58-73. 26. G. Kresse and J. Furthmüller, Computational Materials Science, 1996, 6, 15-50. 27. G. Kresse and J. Hafner, Phys Rev B, 1994, 49, 14251-14269. 28. J. Sauer and M. Sierka, J. Comput. Chem., 2000, 21, 1470-1493. 29. C. Tuma and J. Sauer, Chem. Phys. Lett., 2004, 387, 388-394. 30. C. Tuma and J. Sauer, Phys. Chem. Chem. Phys., 2006, 8, 3955-3965. 31. G. Kresse, J Non-Cryst Solids, 1995, 192–193, 222-229. 32. S. Grimme, J. Antony, S. Ehrlich and H. Krieg, J. Chem. Phys., 2010, 132, 154104. 33. J. Van der Mynsbrugge, K. Hemelsoet, M. Vandichel, M. Waroquier and V. Van
Speybroeck, J. Phys. Chem. C, 2012, 116, 5499-5508. 34. S. Grimme, J. Comput. Chem., 2004, 25, 1463-1473. 35. S. Svelle, C. Tuma, X. Rozanska, T. Kerber and J. Sauer, J. Am. Chem. Soc., 2009,
131, 816-825. 36. R. Ahlrichs, M. Bär, M. Häser, H. Horn and C. Kölmel, Chem. Phys. Lett., 1989, 162,
165-169. 37. C. Hattig, J. Chem. Phys., 2003, 118, 7751-7761. 38. C. Hattig, A. Hellweg and A. Kohn, Phys. Chem. Chem. Phys., 2006, 8, 1159-1169.
61
39. K. Eichkorn, O. Treutler, H. Öhm, M. Häser and R. Ahlrichs, Chem. Phys. Lett., 1995, 240, 283-290.
40. K. Eichkorn, O. Treutler, H. Öhm, M. Häser and R. Ahlrichs, Chem. Phys. Lett., 1995, 242, 652-660.
41. K. Eichkorn, F. Weigend, O. Treutler and R. Ahlrichs, Theor Chem Acc, 1997, 97, 119-124.
42. J. Thom H. Dunning, J. Chem. Phys., 1989, 90, 1007-1023. 43. D. E. Woon and J. Thom H. Dunning, J. Chem. Phys., 1993, 98, 1358-1371. 44. A. Halkier, T. Helgaker, P. Jørgensen, W. Klopper and J. Olsen, Chem. Phys. Lett.,
1999, 302, 437-446. 45. F. Jensen, Theoretical Chemistry Accounts: Theory, Computation, and Modeling
(Theoretica Chimica Acta), 2005, 113, 267-273. 46. J. Antony and S. Grimme, Phys. Chem. Chem. Phys., 2006, 8, 5287-5293. 47. W. Hujo and S. Grimme, Phys. Chem. Chem. Phys., 2011, 13, 13942-13950.

62
63
CHAPTER III:
First Al-O bond hydrolysis during zeolites dealumination unified by Brønsted-Evans-Polanyi relationship
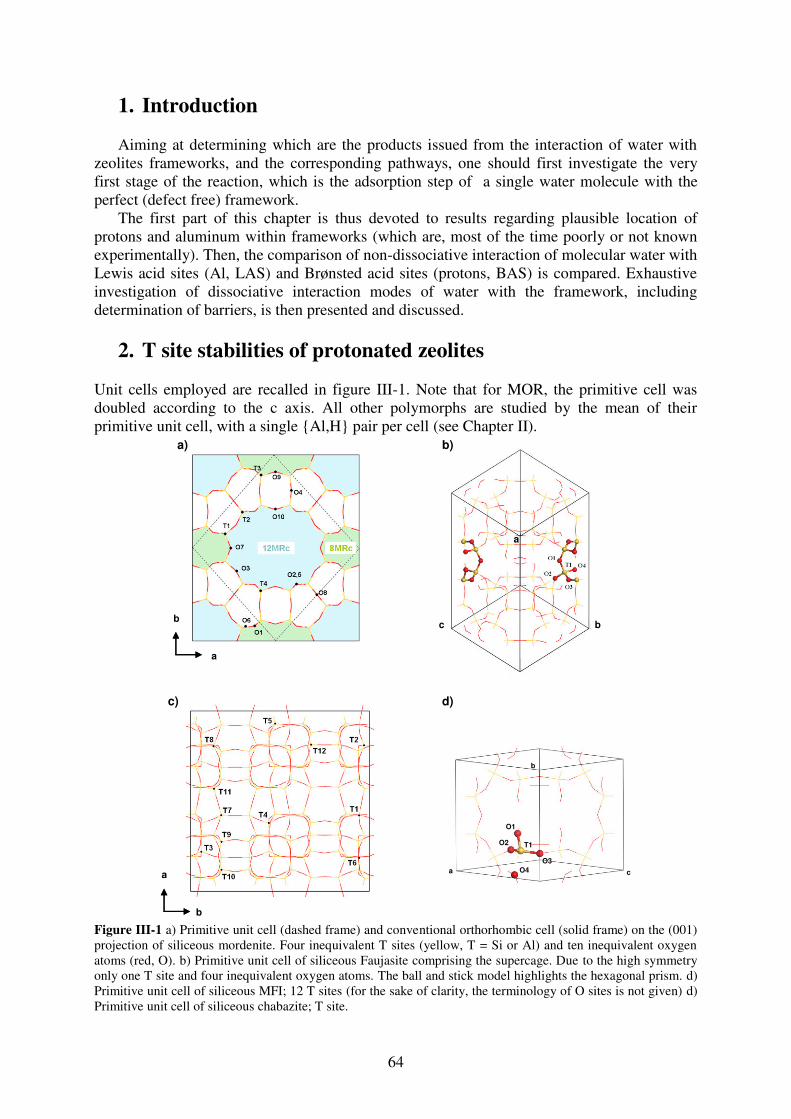
64
1. Introduction Aiming at determining which are the products issued from the interaction of water with
zeolites frameworks, and the corresponding pathways, one should first investigate the very first stage of the reaction, which is the adsorption step of a single water molecule with the perfect (defect free) framework.
The first part of this chapter is thus devoted to results regarding plausible location of protons and aluminum within frameworks (which are, most of the time poorly or not known experimentally). Then, the comparison of non-dissociative interaction of molecular water with Lewis acid sites (Al, LAS) and Brønsted acid sites (protons, BAS) is compared. Exhaustive investigation of dissociative interaction modes of water with the framework, including determination of barriers, is then presented and discussed.
2. T site stabilities of protonated zeolites Unit cells employed are recalled in figure III-1. Note that for MOR, the primitive cell was doubled according to the c axis. All other polymorphs are studied by the mean of their primitive unit cell, with a single {Al,H} pair per cell (see Chapter II).
Figure III-1 a) Primitive unit cell (dashed frame) and conventional orthorhombic cell (solid frame) on the (001) projection of siliceous mordenite. Four inequivalent T sites (yellow, T = Si or Al) and ten inequivalent oxygen atoms (red, O). b) Primitive unit cell of siliceous Faujasite comprising the supercage. Due to the high symmetry only one T site and four inequivalent oxygen atoms. The ball and stick model highlights the hexagonal prism. d) Primitive unit cell of siliceous MFI; 12 T sites (for the sake of clarity, the terminology of O sites is not given) d) Primitive unit cell of siliceous chabazite; T site.
b
a
a) b)
a
b
c)
c b
a
d)
T1
O3
O4
O1
O2
a c
b
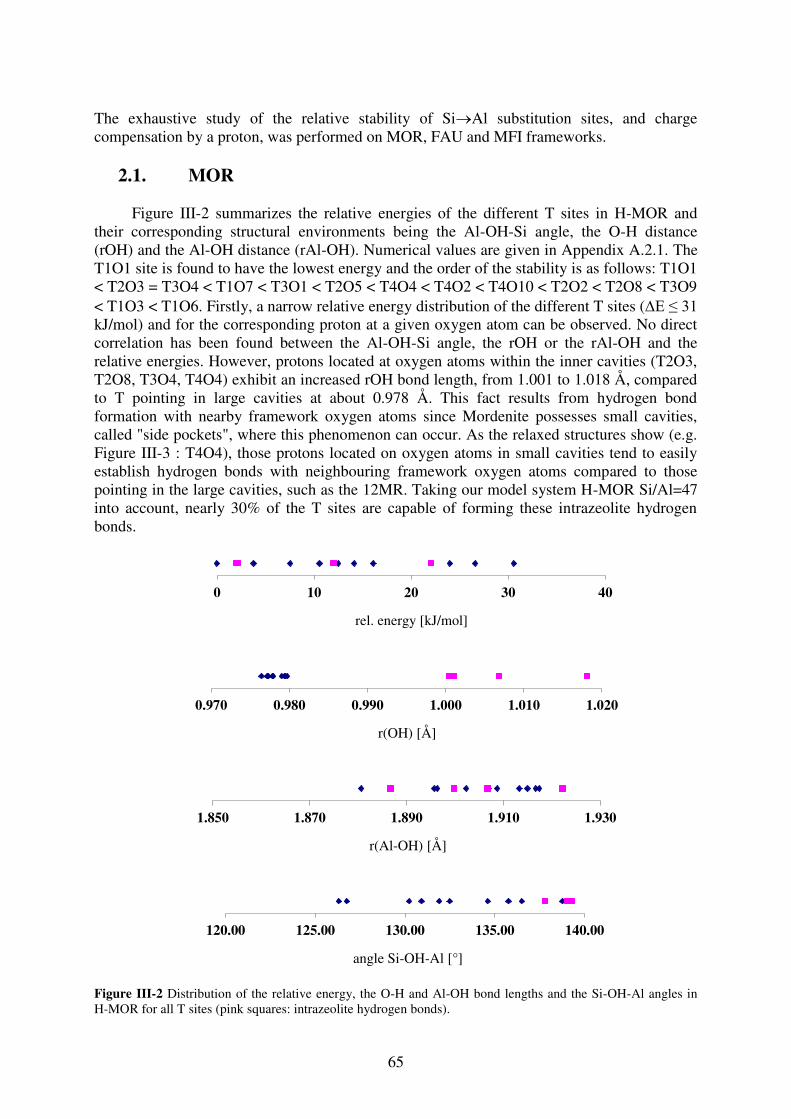
65
The exhaustive study of the relative stability of SiAl substitution sites, and charge compensation by a proton, was performed on MOR, FAU and MFI frameworks.
2.1. MOR
Figure III-2 summarizes the relative energies of the different T sites in H-MOR and their corresponding structural environments being the Al-OH-Si angle, the O-H distance (rOH) and the Al-OH distance (rAl-OH). Numerical values are given in Appendix A.2.1. The T1O1 site is found to have the lowest energy and the order of the stability is as follows: T1O1 < T2O3 = T3O4 < T1O7 < T3O1 < T2O5 < T4O4 < T4O2 < T4O10 < T2O2 < T2O8 < T3O9 < T1O3 < T1O6. Firstly, a narrow relative energy distribution of the different T sites (E ≤ 31 kJ/mol) and for the corresponding proton at a given oxygen atom can be observed. No direct correlation has been found between the Al-OH-Si angle, the rOH or the rAl-OH and the relative energies. However, protons located at oxygen atoms within the inner cavities (T2O3, T2O8, T3O4, T4O4) exhibit an increased rOH bond length, from 1.001 to 1.018 Å, compared to T pointing in large cavities at about 0.978 Å. This fact results from hydrogen bond formation with nearby framework oxygen atoms since Mordenite possesses small cavities, called "side pockets", where this phenomenon can occur. As the relaxed structures show (e.g. Figure III-3 : T4O4), those protons located on oxygen atoms in small cavities tend to easily establish hydrogen bonds with neighbouring framework oxygen atoms compared to those pointing in the large cavities, such as the 12MR. Taking our model system H-MOR Si/Al=47 into account, nearly 30% of the T sites are capable of forming these intrazeolite hydrogen bonds.
Figure III-2 Distribution of the relative energy, the O-H and Al-OH bond lengths and the Si-OH-Al angles in H-MOR for all T sites (pink squares: intrazeolite hydrogen bonds).
0.000.501.001.50
0 10 20 30 40
rel. energy [kJ/mol]
0.000.501.001.50
0.970 0.980 0.990 1.000 1.010 1.020
r(OH) [Å]
0.000.501.001.50
1.850 1.870 1.890 1.910 1.930
r(Al-OH) [Å]
0.000.501.001.50
120.00 125.00 130.00 135.00 140.00
angle Si-OH-Al [°]
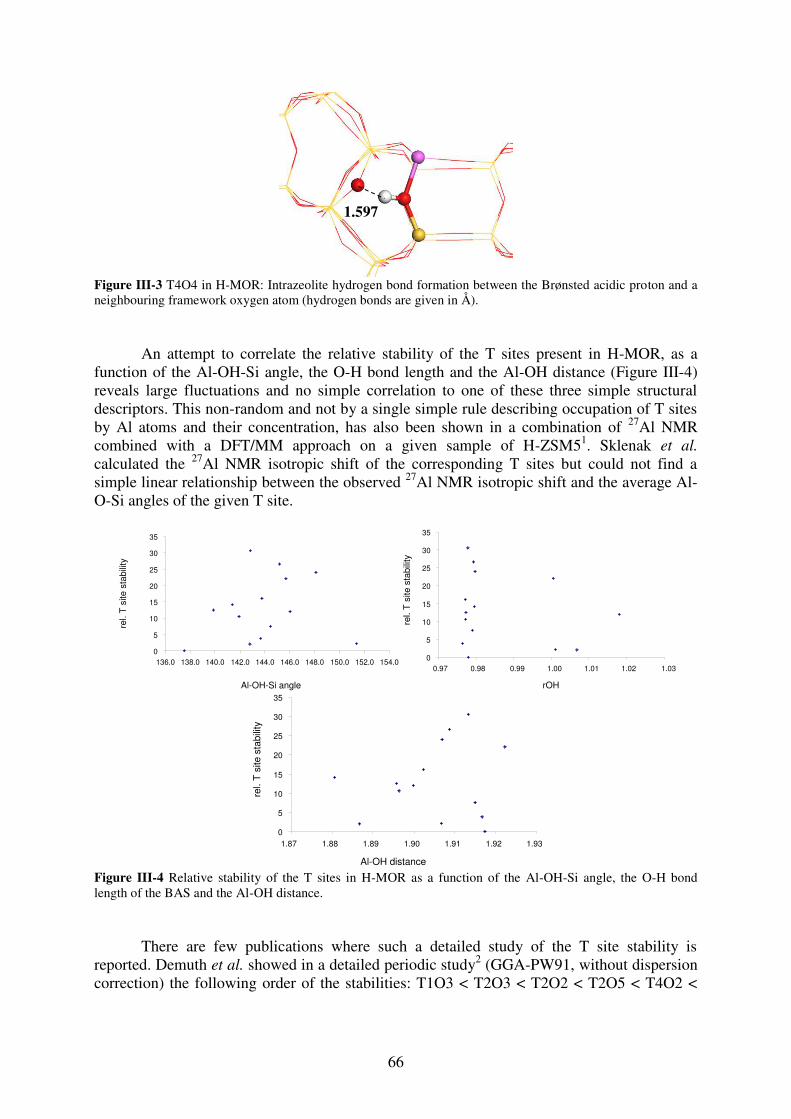
66
Figure III-3 T4O4 in H-MOR: Intrazeolite hydrogen bond formation between the Brønsted acidic proton and a neighbouring framework oxygen atom (hydrogen bonds are given in Å).
An attempt to correlate the relative stability of the T sites present in H-MOR, as a
function of the Al-OH-Si angle, the O-H bond length and the Al-OH distance (Figure III-4) reveals large fluctuations and no simple correlation to one of these three simple structural descriptors. This non-random and not by a single simple rule describing occupation of T sites by Al atoms and their concentration, has also been shown in a combination of 27Al NMR combined with a DFT/MM approach on a given sample of H-ZSM51. Sklenak et al. calculated the 27Al NMR isotropic shift of the corresponding T sites but could not find a simple linear relationship between the observed 27Al NMR isotropic shift and the average Al-O-Si angles of the given T site.
Figure III-4 Relative stability of the T sites in H-MOR as a function of the Al-OH-Si angle, the O-H bond length of the BAS and the Al-OH distance.
There are few publications where such a detailed study of the T site stability is
reported. Demuth et al. showed in a detailed periodic study2 (GGA-PW91, without dispersion correction) the following order of the stabilities: T1O3 < T2O3 < T2O2 < T2O5 < T4O2 <
rel.
T s
ite s
tabi
lity
Al-OH-Si angle
0
5
10
15
20
25
30
35
136.0 138.0 140.0 142.0 144.0 146.0 148.0 150.0 152.0 154.0
rOH
rel.
T s
ite s
tabi
lity
0
5
10
15
20
25
30
35
0.97 0.98 0.99 1.00 1.01 1.02 1.03
Al-OH distance
rel.
T s
ite s
tabi
lity
0
5
10
15
20
25
30
35
1.87 1.88 1.89 1.90 1.91 1.92 1.93
1.597
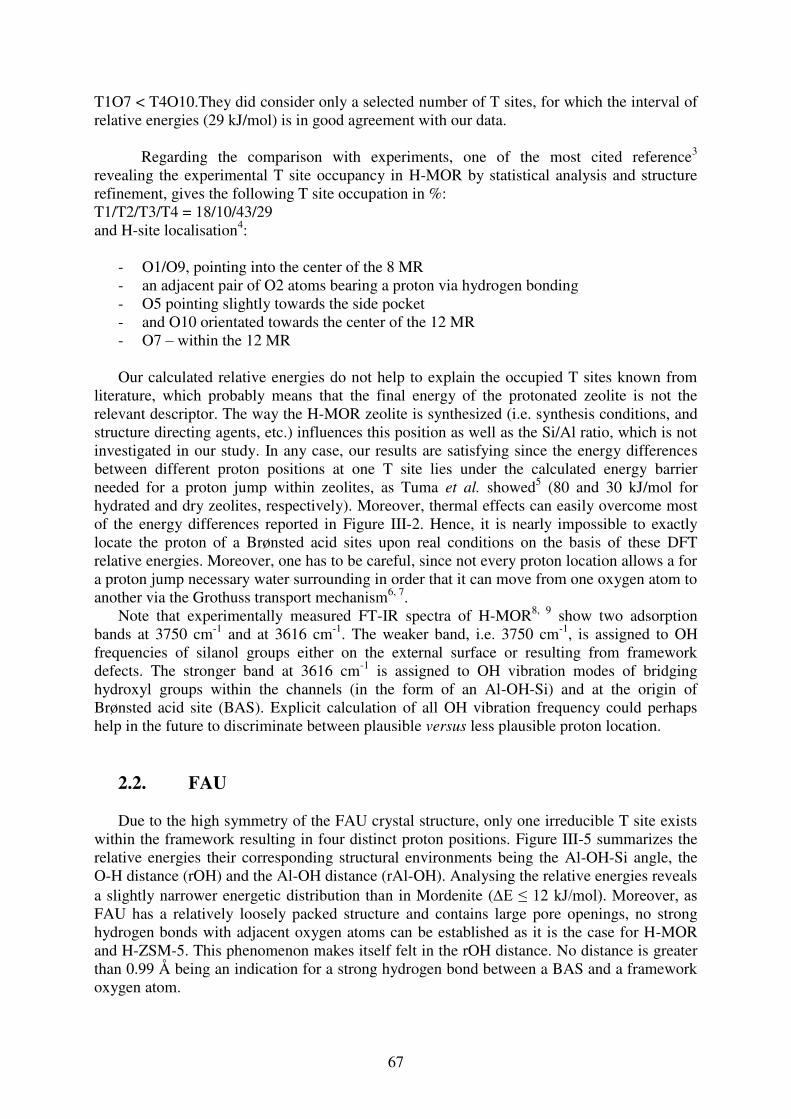
67
T1O7 < T4O10.They did consider only a selected number of T sites, for which the interval of relative energies (29 kJ/mol) is in good agreement with our data.
Regarding the comparison with experiments, one of the most cited reference3
revealing the experimental T site occupancy in H-MOR by statistical analysis and structure refinement, gives the following T site occupation in %: T1/T2/T3/T4 = 18/10/43/29 and H-site localisation4:
- O1/O9, pointing into the center of the 8 MR - an adjacent pair of O2 atoms bearing a proton via hydrogen bonding - O5 pointing slightly towards the side pocket - and O10 orientated towards the center of the 12 MR - O7 – within the 12 MR Our calculated relative energies do not help to explain the occupied T sites known from
literature, which probably means that the final energy of the protonated zeolite is not the relevant descriptor. The way the H-MOR zeolite is synthesized (i.e. synthesis conditions, and structure directing agents, etc.) influences this position as well as the Si/Al ratio, which is not investigated in our study. In any case, our results are satisfying since the energy differences between different proton positions at one T site lies under the calculated energy barrier needed for a proton jump within zeolites, as Tuma et al. showed5 (80 and 30 kJ/mol for hydrated and dry zeolites, respectively). Moreover, thermal effects can easily overcome most of the energy differences reported in Figure III-2. Hence, it is nearly impossible to exactly locate the proton of a Brønsted acid sites upon real conditions on the basis of these DFT relative energies. Moreover, one has to be careful, since not every proton location allows a for a proton jump necessary water surrounding in order that it can move from one oxygen atom to another via the Grothuss transport mechanism6, 7.
Note that experimentally measured FT-IR spectra of H-MOR8, 9 show two adsorption bands at 3750 cm-1 and at 3616 cm-1. The weaker band, i.e. 3750 cm-1, is assigned to OH frequencies of silanol groups either on the external surface or resulting from framework defects. The stronger band at 3616 cm-1 is assigned to OH vibration modes of bridging hydroxyl groups within the channels (in the form of an Al-OH-Si) and at the origin of Brønsted acid site (BAS). Explicit calculation of all OH vibration frequency could perhaps help in the future to discriminate between plausible versus less plausible proton location.
2.2. FAU
Due to the high symmetry of the FAU crystal structure, only one irreducible T site exists
within the framework resulting in four distinct proton positions. Figure III-5 summarizes the relative energies their corresponding structural environments being the Al-OH-Si angle, the O-H distance (rOH) and the Al-OH distance (rAl-OH). Analysing the relative energies reveals a slightly narrower energetic distribution than in Mordenite (E ≤ 12 kJ/mol). Moreover, as FAU has a relatively loosely packed structure and contains large pore openings, no strong hydrogen bonds with adjacent oxygen atoms can be established as it is the case for H-MOR and H-ZSM-5. This phenomenon makes itself felt in the rOH distance. No distance is greater than 0.99 Å being an indication for a strong hydrogen bond between a BAS and a framework oxygen atom.
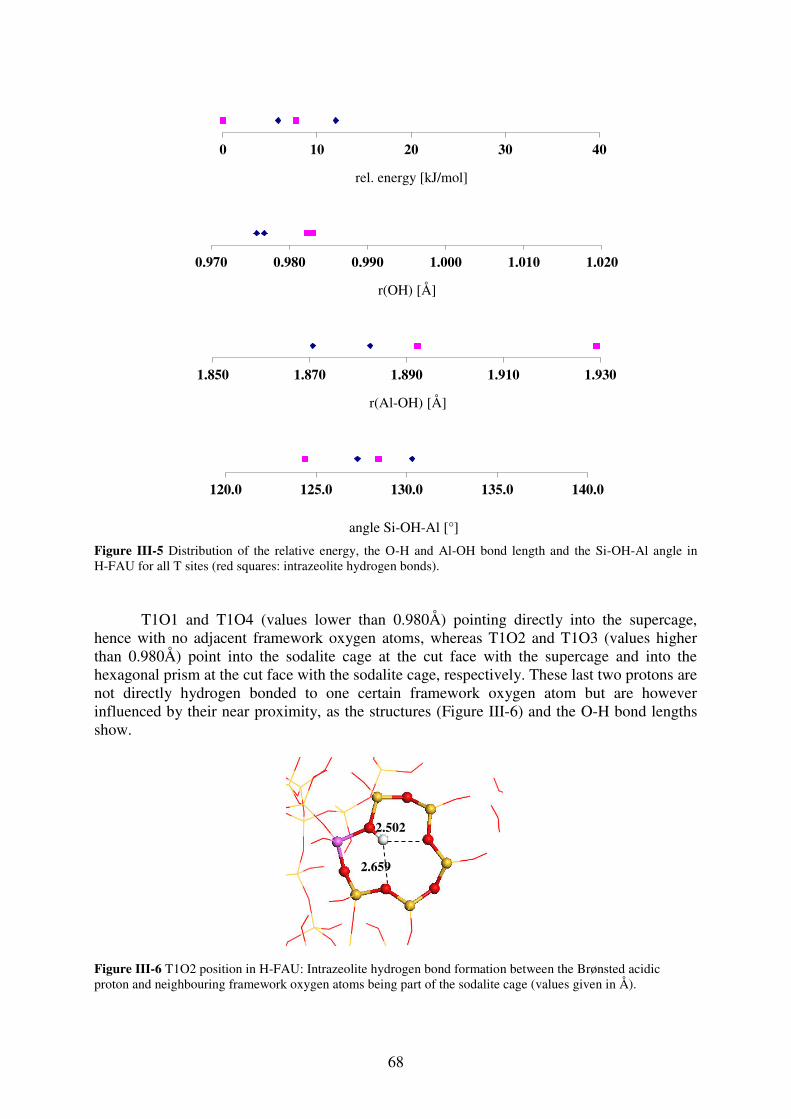
68
Figure III-5 Distribution of the relative energy, the O-H and Al-OH bond length and the Si-OH-Al angle in H-FAU for all T sites (red squares: intrazeolite hydrogen bonds).
T1O1 and T1O4 (values lower than 0.980Å) pointing directly into the supercage, hence with no adjacent framework oxygen atoms, whereas T1O2 and T1O3 (values higher than 0.980Å) point into the sodalite cage at the cut face with the supercage and into the hexagonal prism at the cut face with the sodalite cage, respectively. These last two protons are not directly hydrogen bonded to one certain framework oxygen atom but are however influenced by their near proximity, as the structures (Figure III-6) and the O-H bond lengths show.
Figure III-6 T1O2 position in H-FAU: Intrazeolite hydrogen bond formation between the Brønsted acidic proton and neighbouring framework oxygen atoms being part of the sodalite cage (values given in Å).
0.000.501.001.50
0 10 20 30 40
rel. energy [kJ/mol]
0.000.501.001.50
0.970 0.980 0.990 1.000 1.010 1.020
r(OH) [Å]
0.000.501.001.50
1.850 1.870 1.890 1.910 1.930
r(Al-OH) [Å]
0.000.501.001.50
120.0 125.0 130.0 135.0 140.0
angle Si-OH-Al [°]
2.659
2.502
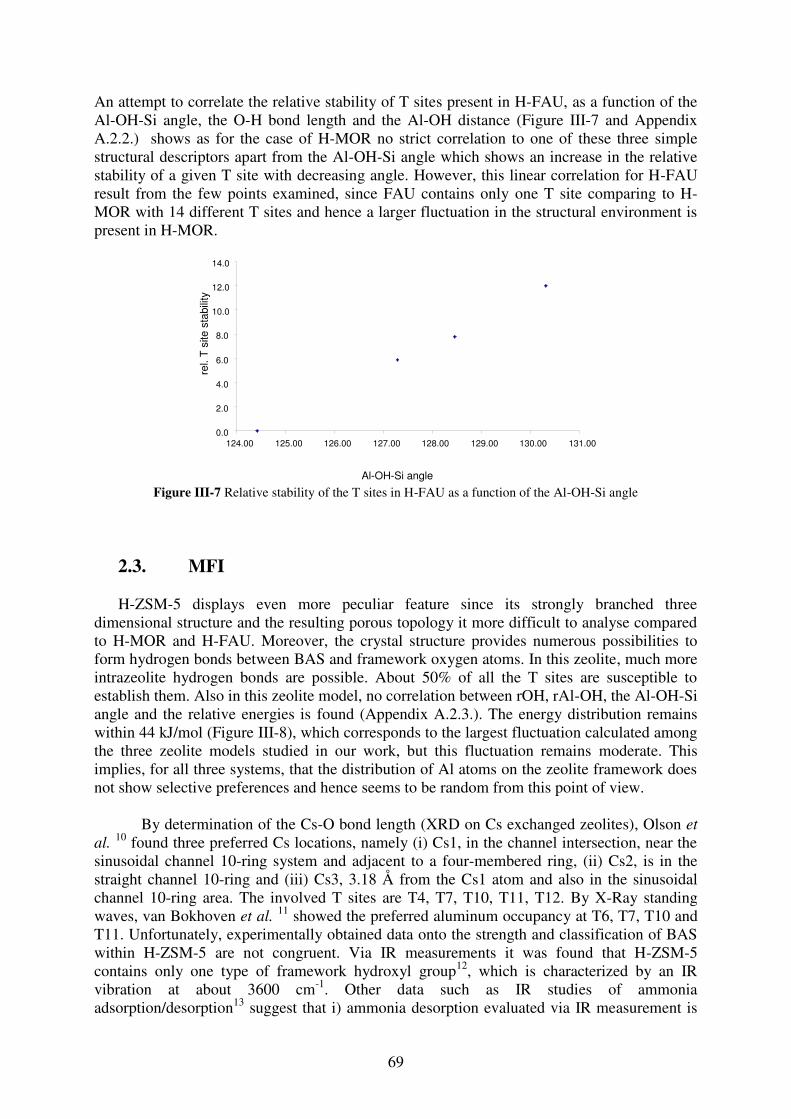
69
An attempt to correlate the relative stability of T sites present in H-FAU, as a function of the Al-OH-Si angle, the O-H bond length and the Al-OH distance (Figure III-7 and Appendix A.2.2.) shows as for the case of H-MOR no strict correlation to one of these three simple structural descriptors apart from the Al-OH-Si angle which shows an increase in the relative stability of a given T site with decreasing angle. However, this linear correlation for H-FAU result from the few points examined, since FAU contains only one T site comparing to H-MOR with 14 different T sites and hence a larger fluctuation in the structural environment is present in H-MOR.
Figure III-7 Relative stability of the T sites in H-FAU as a function of the Al-OH-Si angle
2.3. MFI
H-ZSM-5 displays even more peculiar feature since its strongly branched three dimensional structure and the resulting porous topology it more difficult to analyse compared to H-MOR and H-FAU. Moreover, the crystal structure provides numerous possibilities to form hydrogen bonds between BAS and framework oxygen atoms. In this zeolite, much more intrazeolite hydrogen bonds are possible. About 50% of all the T sites are susceptible to establish them. Also in this zeolite model, no correlation between rOH, rAl-OH, the Al-OH-Si angle and the relative energies is found (Appendix A.2.3.). The energy distribution remains within 44 kJ/mol (Figure III-8), which corresponds to the largest fluctuation calculated among the three zeolite models studied in our work, but this fluctuation remains moderate. This implies, for all three systems, that the distribution of Al atoms on the zeolite framework does not show selective preferences and hence seems to be random from this point of view.
By determination of the Cs-O bond length (XRD on Cs exchanged zeolites), Olson et
al. 10 found three preferred Cs locations, namely (i) Cs1, in the channel intersection, near the sinusoidal channel 10-ring system and adjacent to a four-membered ring, (ii) Cs2, is in the straight channel 10-ring and (iii) Cs3, 3.18 Å from the Cs1 atom and also in the sinusoidal channel 10-ring area. The involved T sites are T4, T7, T10, T11, T12. By X-Ray standing waves, van Bokhoven et al. 11 showed the preferred aluminum occupancy at T6, T7, T10 and T11. Unfortunately, experimentally obtained data onto the strength and classification of BAS within H-ZSM-5 are not congruent. Via IR measurements it was found that H-ZSM-5 contains only one type of framework hydroxyl group12, which is characterized by an IR vibration at about 3600 cm-1. Other data such as IR studies of ammonia adsorption/desorption13 suggest that i) ammonia desorption evaluated via IR measurement is
0.0
2.0
4.0
6.0
8.0
10.0
12.0
14.0
124.00 125.00 126.00 127.00 128.00 129.00 130.00 131.00
rel.
T s
ite s
tabi
lity
Al-OH-Si angle
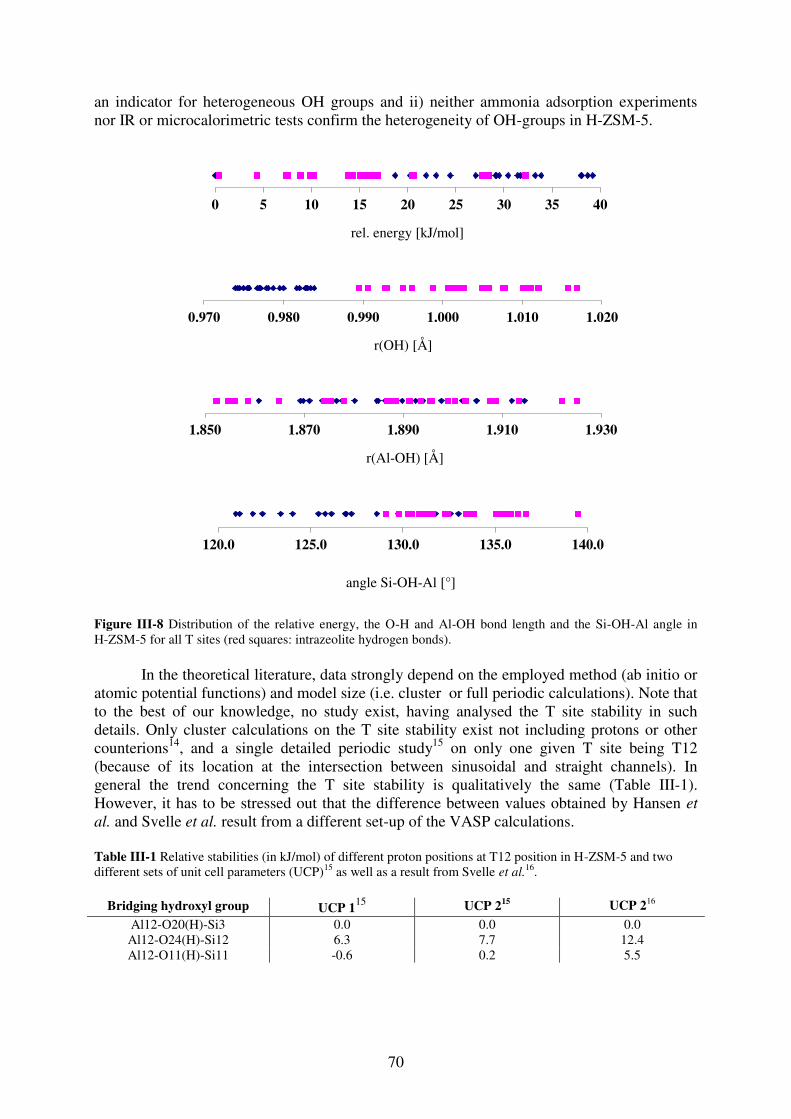
70
an indicator for heterogeneous OH groups and ii) neither ammonia adsorption experiments nor IR or microcalorimetric tests confirm the heterogeneity of OH-groups in H-ZSM-5.
Figure III-8 Distribution of the relative energy, the O-H and Al-OH bond length and the Si-OH-Al angle in H-ZSM-5 for all T sites (red squares: intrazeolite hydrogen bonds).
In the theoretical literature, data strongly depend on the employed method (ab initio or
atomic potential functions) and model size (i.e. cluster or full periodic calculations). Note that to the best of our knowledge, no study exist, having analysed the T site stability in such details. Only cluster calculations on the T site stability exist not including protons or other counterions14, and a single detailed periodic study15 on only one given T site being T12 (because of its location at the intersection between sinusoidal and straight channels). In general the trend concerning the T site stability is qualitatively the same (Table III-1). However, it has to be stressed out that the difference between values obtained by Hansen et
al. and Svelle et al. result from a different set-up of the VASP calculations. Table III-1 Relative stabilities (in kJ/mol) of different proton positions at T12 position in H-ZSM-5 and two different sets of unit cell parameters (UCP)15 as well as a result from Svelle et al.
16.
Bridging hydroxyl group UCP 115 UCP 215 UCP 216 Al12-O20(H)-Si3 0.0 0.0 0.0 Al12-O24(H)-Si12 6.3 7.7 12.4 Al12-O11(H)-Si11 -0.6 0.2 5.5
00.511.5
0 5 10 15 20 25 30 35 40
rel. energy [kJ/mol]
00.511.5
0.970 0.980 0.990 1.000 1.010 1.020
r(OH) [Å]
00.511.5
1.850 1.870 1.890 1.910 1.930
r(Al-OH) [Å]
00.511.5
120.0 125.0 130.0 135.0 140.0
angle Si-OH-Al [°]
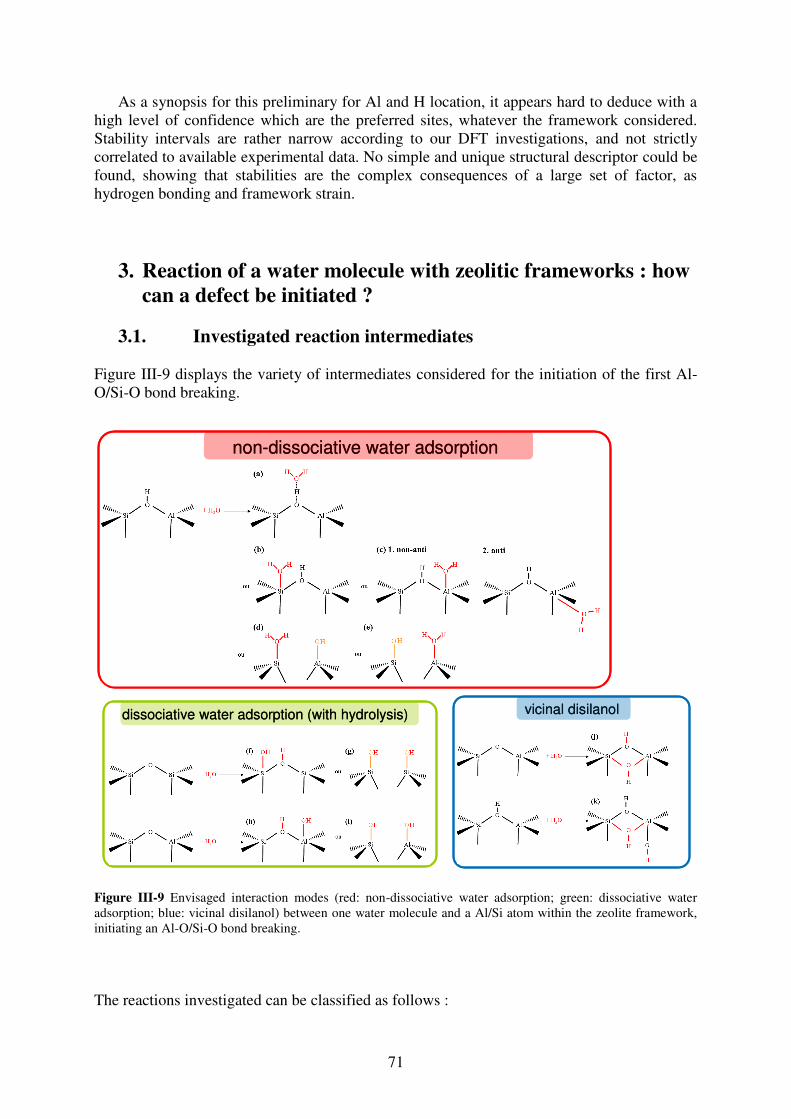
71
As a synopsis for this preliminary for Al and H location, it appears hard to deduce with a high level of confidence which are the preferred sites, whatever the framework considered. Stability intervals are rather narrow according to our DFT investigations, and not strictly correlated to available experimental data. No simple and unique structural descriptor could be found, showing that stabilities are the complex consequences of a large set of factor, as hydrogen bonding and framework strain.
3. Reaction of a water molecule with zeolitic frameworks : how can a defect be initiated ?
3.1. Investigated reaction intermediates
Figure III-9 displays the variety of intermediates considered for the initiation of the first Al-O/Si-O bond breaking.
Figure III-9 Envisaged interaction modes (red: non-dissociative water adsorption; green: dissociative water adsorption; blue: vicinal disilanol) between one water molecule and a Al/Si atom within the zeolite framework, initiating an Al-O/Si-O bond breaking. The reactions investigated can be classified as follows :
non-dissociative water adsorptionnon-dissociative water adsorption
dissociative water adsorption (with hydrolysis)dissociative water adsorption (with hydrolysis) vicinal disilanolvicinal disilanol
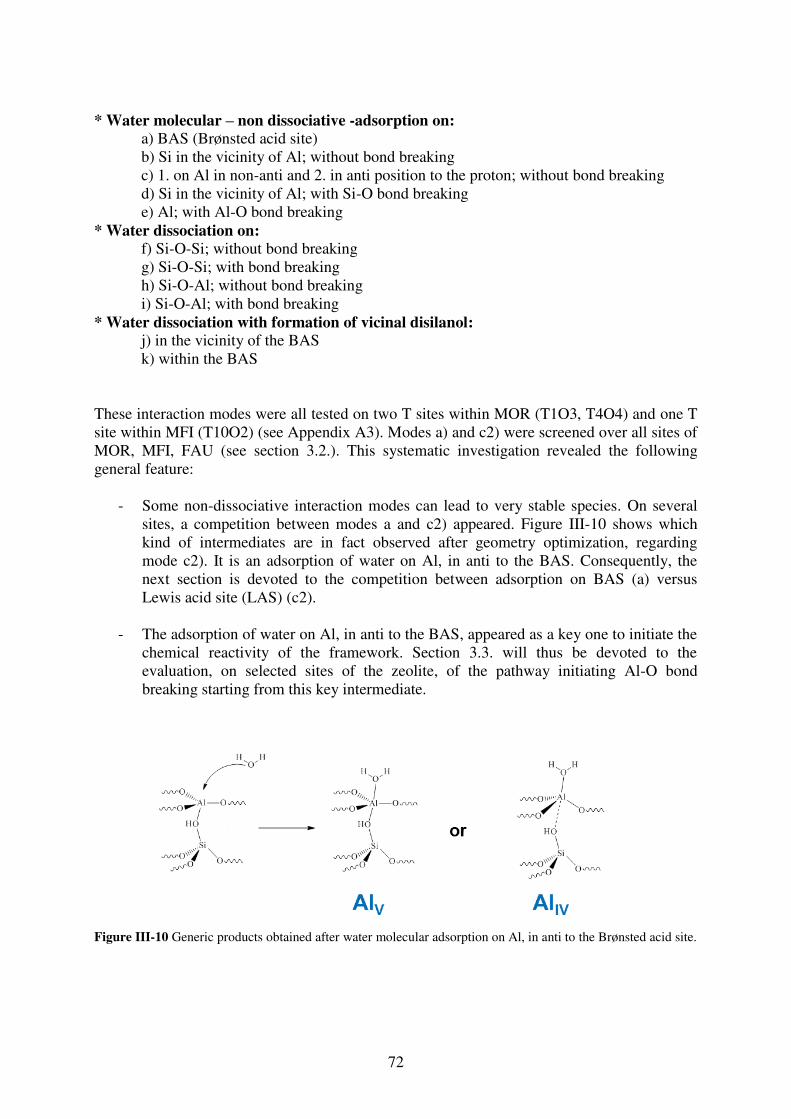
72
* Water molecular – non dissociative -adsorption on:
a) BAS (Brønsted acid site) b) Si in the vicinity of Al; without bond breaking c) 1. on Al in non-anti and 2. in anti position to the proton; without bond breaking d) Si in the vicinity of Al; with Si-O bond breaking e) Al; with Al-O bond breaking
* Water dissociation on: f) Si-O-Si; without bond breaking g) Si-O-Si; with bond breaking h) Si-O-Al; without bond breaking i) Si-O-Al; with bond breaking
* Water dissociation with formation of vicinal disilanol: j) in the vicinity of the BAS k) within the BAS
These interaction modes were all tested on two T sites within MOR (T1O3, T4O4) and one T site within MFI (T10O2) (see Appendix A3). Modes a) and c2) were screened over all sites of MOR, MFI, FAU (see section 3.2.). This systematic investigation revealed the following general feature:
- Some non-dissociative interaction modes can lead to very stable species. On several sites, a competition between modes a and c2) appeared. Figure III-10 shows which kind of intermediates are in fact observed after geometry optimization, regarding mode c2). It is an adsorption of water on Al, in anti to the BAS. Consequently, the next section is devoted to the competition between adsorption on BAS (a) versus Lewis acid site (LAS) (c2).
- The adsorption of water on Al, in anti to the BAS, appeared as a key one to initiate the chemical reactivity of the framework. Section 3.3. will thus be devoted to the evaluation, on selected sites of the zeolite, of the pathway initiating Al-O bond breaking starting from this key intermediate.
Figure III-10 Generic products obtained after water molecular adsorption on Al, in anti to the Brønsted acid site.
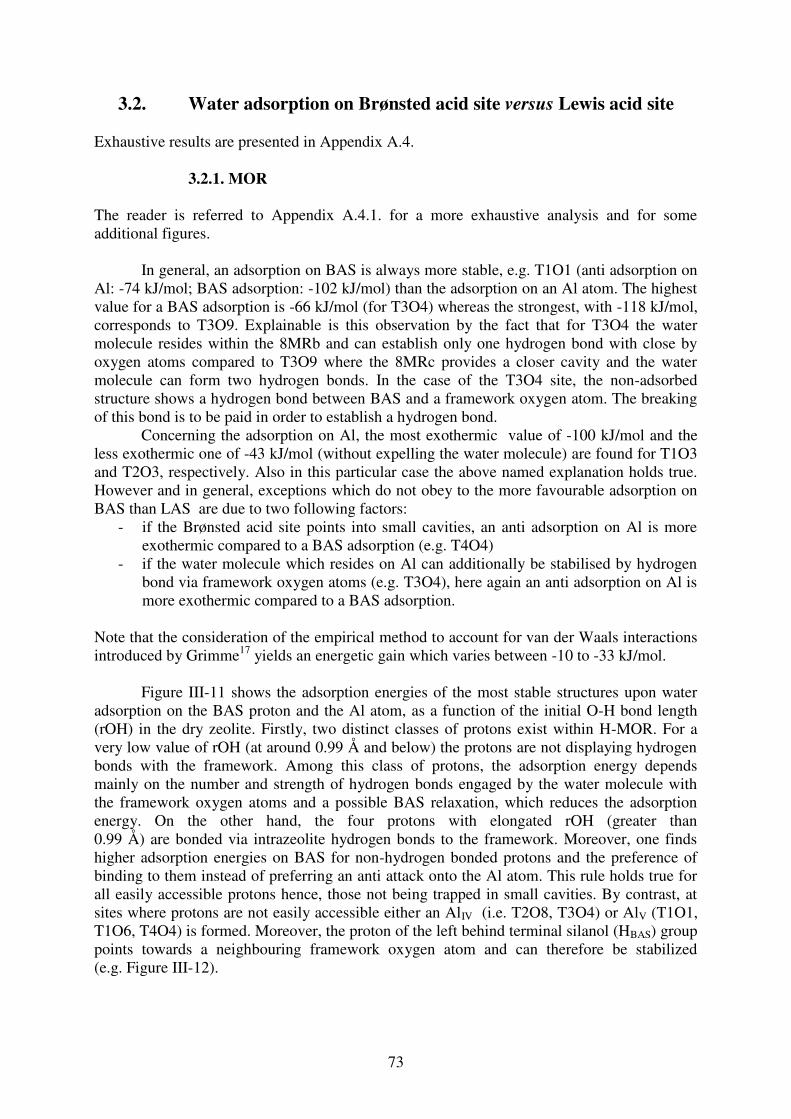
73
3.2. Water adsorption on Brønsted acid site versus Lewis acid site Exhaustive results are presented in Appendix A.4.
3.2.1. MOR The reader is referred to Appendix A.4.1. for a more exhaustive analysis and for some additional figures.
In general, an adsorption on BAS is always more stable, e.g. T1O1 (anti adsorption on Al: -74 kJ/mol; BAS adsorption: -102 kJ/mol) than the adsorption on an Al atom. The highest value for a BAS adsorption is -66 kJ/mol (for T3O4) whereas the strongest, with -118 kJ/mol, corresponds to T3O9. Explainable is this observation by the fact that for T3O4 the water molecule resides within the 8MRb and can establish only one hydrogen bond with close by oxygen atoms compared to T3O9 where the 8MRc provides a closer cavity and the water molecule can form two hydrogen bonds. In the case of the T3O4 site, the non-adsorbed structure shows a hydrogen bond between BAS and a framework oxygen atom. The breaking of this bond is to be paid in order to establish a hydrogen bond.
Concerning the adsorption on Al, the most exothermic value of -100 kJ/mol and the less exothermic one of -43 kJ/mol (without expelling the water molecule) are found for T1O3 and T2O3, respectively. Also in this particular case the above named explanation holds true. However and in general, exceptions which do not obey to the more favourable adsorption on BAS than LAS are due to two following factors:
- if the Brønsted acid site points into small cavities, an anti adsorption on Al is more exothermic compared to a BAS adsorption (e.g. T4O4)
- if the water molecule which resides on Al can additionally be stabilised by hydrogen bond via framework oxygen atoms (e.g. T3O4), here again an anti adsorption on Al is more exothermic compared to a BAS adsorption.
Note that the consideration of the empirical method to account for van der Waals interactions introduced by Grimme17 yields an energetic gain which varies between -10 to -33 kJ/mol.
Figure III-11 shows the adsorption energies of the most stable structures upon water adsorption on the BAS proton and the Al atom, as a function of the initial O-H bond length (rOH) in the dry zeolite. Firstly, two distinct classes of protons exist within H-MOR. For a very low value of rOH (at around 0.99 Å and below) the protons are not displaying hydrogen bonds with the framework. Among this class of protons, the adsorption energy depends mainly on the number and strength of hydrogen bonds engaged by the water molecule with the framework oxygen atoms and a possible BAS relaxation, which reduces the adsorption energy. On the other hand, the four protons with elongated rOH (greater than 0.99 Å) are bonded via intrazeolite hydrogen bonds to the framework. Moreover, one finds higher adsorption energies on BAS for non-hydrogen bonded protons and the preference of binding to them instead of preferring an anti attack onto the Al atom. This rule holds true for all easily accessible protons hence, those not being trapped in small cavities. By contrast, at sites where protons are not easily accessible either an AlIV (i.e. T2O8, T3O4) or AlV (T1O1, T1O6, T4O4) is formed. Moreover, the proton of the left behind terminal silanol (HBAS) group points towards a neighbouring framework oxygen atom and can therefore be stabilized (e.g. Figure III-12).
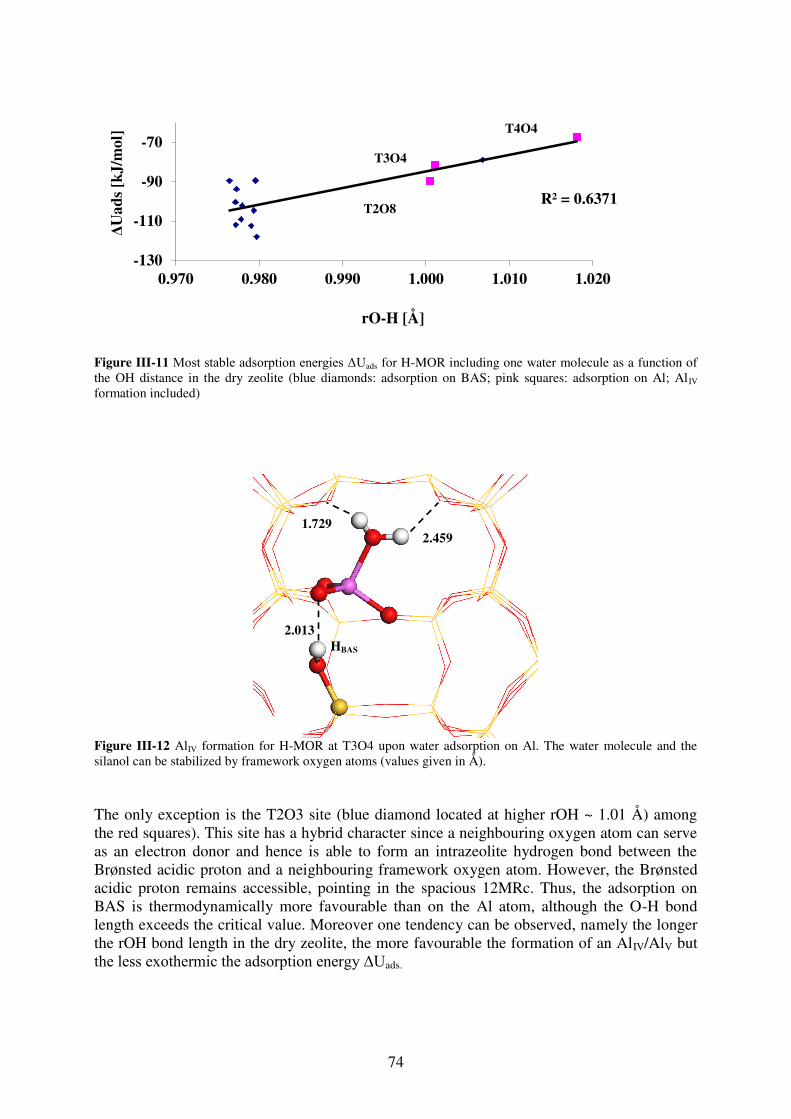
74
Figure III-11 Most stable adsorption energies ΔUads for H-MOR including one water molecule as a function of the OH distance in the dry zeolite (blue diamonds: adsorption on BAS; pink squares: adsorption on Al; Al IV formation included)
Figure III-12 AlIV formation for H-MOR at T3O4 upon water adsorption on Al. The water molecule and the silanol can be stabilized by framework oxygen atoms (values given in Å). The only exception is the T2O3 site (blue diamond located at higher rOH ~ 1.01 Å) among the red squares). This site has a hybrid character since a neighbouring oxygen atom can serve as an electron donor and hence is able to form an intrazeolite hydrogen bond between the Brønsted acidic proton and a neighbouring framework oxygen atom. However, the Brønsted acidic proton remains accessible, pointing in the spacious 12MRc. Thus, the adsorption on BAS is thermodynamically more favourable than on the Al atom, although the O-H bond length exceeds the critical value. Moreover one tendency can be observed, namely the longer the rOH bond length in the dry zeolite, the more favourable the formation of an AlIV/AlV but the less exothermic the adsorption energy ΔUads.
R² = 0.6371
-130
-110
-90
-70
0.970 0.980 0.990 1.000 1.010 1.020
ΔUad
s [k
J/m
ol]
rO-H [Å]
T2O8
T3O4
T4O4
2.013
1.729 2.459
HBAS
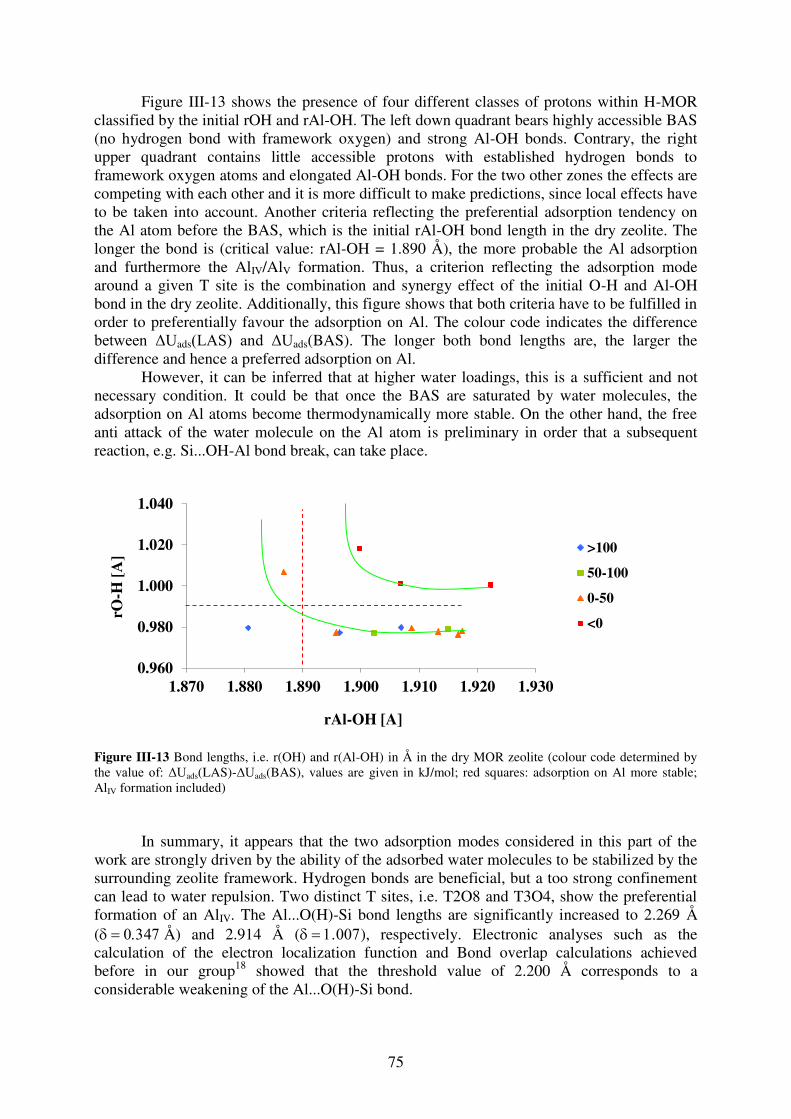
75
Figure III-13 shows the presence of four different classes of protons within H-MOR classified by the initial rOH and rAl-OH. The left down quadrant bears highly accessible BAS (no hydrogen bond with framework oxygen) and strong Al-OH bonds. Contrary, the right upper quadrant contains little accessible protons with established hydrogen bonds to framework oxygen atoms and elongated Al-OH bonds. For the two other zones the effects are competing with each other and it is more difficult to make predictions, since local effects have to be taken into account. Another criteria reflecting the preferential adsorption tendency on the Al atom before the BAS, which is the initial rAl-OH bond length in the dry zeolite. The longer the bond is (critical value: rAl-OH = 1.890 Å), the more probable the Al adsorption and furthermore the AlIV/AlV formation. Thus, a criterion reflecting the adsorption mode around a given T site is the combination and synergy effect of the initial O-H and Al-OH bond in the dry zeolite. Additionally, this figure shows that both criteria have to be fulfilled in order to preferentially favour the adsorption on Al. The colour code indicates the difference between ΔUads(LAS) and ΔUads(BAS). The longer both bond lengths are, the larger the difference and hence a preferred adsorption on Al.
However, it can be inferred that at higher water loadings, this is a sufficient and not necessary condition. It could be that once the BAS are saturated by water molecules, the adsorption on Al atoms become thermodynamically more stable. On the other hand, the free anti attack of the water molecule on the Al atom is preliminary in order that a subsequent reaction, e.g. Si...OH-Al bond break, can take place.
Figure III-13 Bond lengths, i.e. r(OH) and r(Al-OH) in Å in the dry MOR zeolite (colour code determined by the value of: ΔUads(LAS)-ΔUads(BAS), values are given in kJ/mol; red squares: adsorption on Al more stable; AlIV formation included)
In summary, it appears that the two adsorption modes considered in this part of the work are strongly driven by the ability of the adsorbed water molecules to be stabilized by the surrounding zeolite framework. Hydrogen bonds are beneficial, but a too strong confinement can lead to water repulsion. Two distinct T sites, i.e. T2O8 and T3O4, show the preferential formation of an AlIV. The Al...O(H)-Si bond lengths are significantly increased to 2.269 Å (Å) and 2.914 Å (), respectively. Electronic analyses such as the calculation of the electron localization function and Bond overlap calculations achieved before in our group18 showed that the threshold value of 2.200 Å corresponds to a considerable weakening of the Al...O(H)-Si bond.
0.960
0.980
1.000
1.020
1.040
1.870 1.880 1.890 1.900 1.910 1.920 1.930
rO-H
[A]
rAl-OH [A]
>100
50-100
0-50
<0
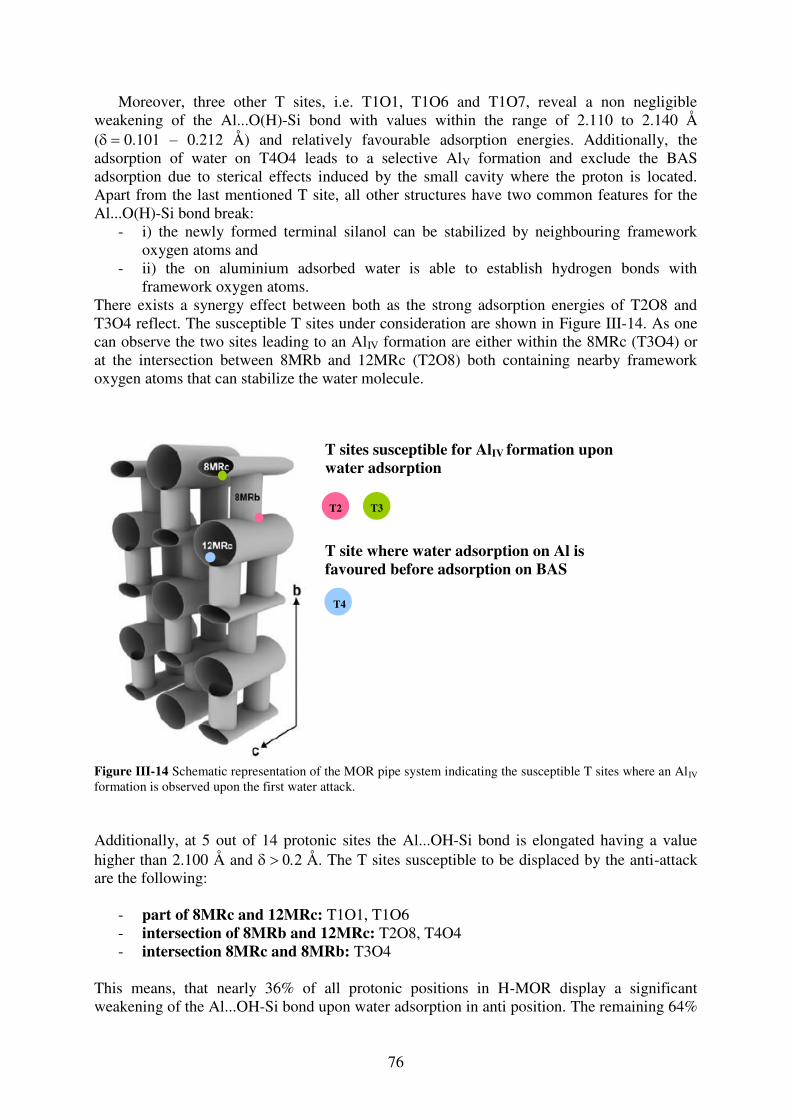
76
Moreover, three other T sites, i.e. T1O1, T1O6 and T1O7, reveal a non negligible weakening of the Al...O(H)-Si bond with values within the range of 2.110 to 2.140 Å (0.101 – 0.212 Å) and relatively favourable adsorption energies. Additionally, the adsorption of water on T4O4 leads to a selective AlV formation and exclude the BAS adsorption due to sterical effects induced by the small cavity where the proton is located. Apart from the last mentioned T site, all other structures have two common features for the Al...O(H)-Si bond break:
- i) the newly formed terminal silanol can be stabilized by neighbouring framework oxygen atoms and
- ii) the on aluminium adsorbed water is able to establish hydrogen bonds with framework oxygen atoms.
There exists a synergy effect between both as the strong adsorption energies of T2O8 and T3O4 reflect. The susceptible T sites under consideration are shown in Figure III-14. As one can observe the two sites leading to an AlIV formation are either within the 8MRc (T3O4) or at the intersection between 8MRb and 12MRc (T2O8) both containing nearby framework oxygen atoms that can stabilize the water molecule.
Figure III-14 Schematic representation of the MOR pipe system indicating the susceptible T sites where an AlIV
formation is observed upon the first water attack. Additionally, at 5 out of 14 protonic sites the Al...OH-Si bond is elongated having a value higher than 2.100 Å and Å. The T sites susceptible to be displaced by the anti-attack are the following:
- part of 8MRc and 12MRc: T1O1, T1O6 - intersection of 8MRb and 12MRc: T2O8, T4O4 - intersection 8MRc and 8MRb: T3O4
This means, that nearly 36% of all protonic positions in H-MOR display a significant weakening of the Al...OH-Si bond upon water adsorption in anti position. The remaining 64%
T sites susceptible for AlIV formation upon
water adsorption
T2 T3
T4 T site where water adsorption on Al is favoured before adsorption on BAS
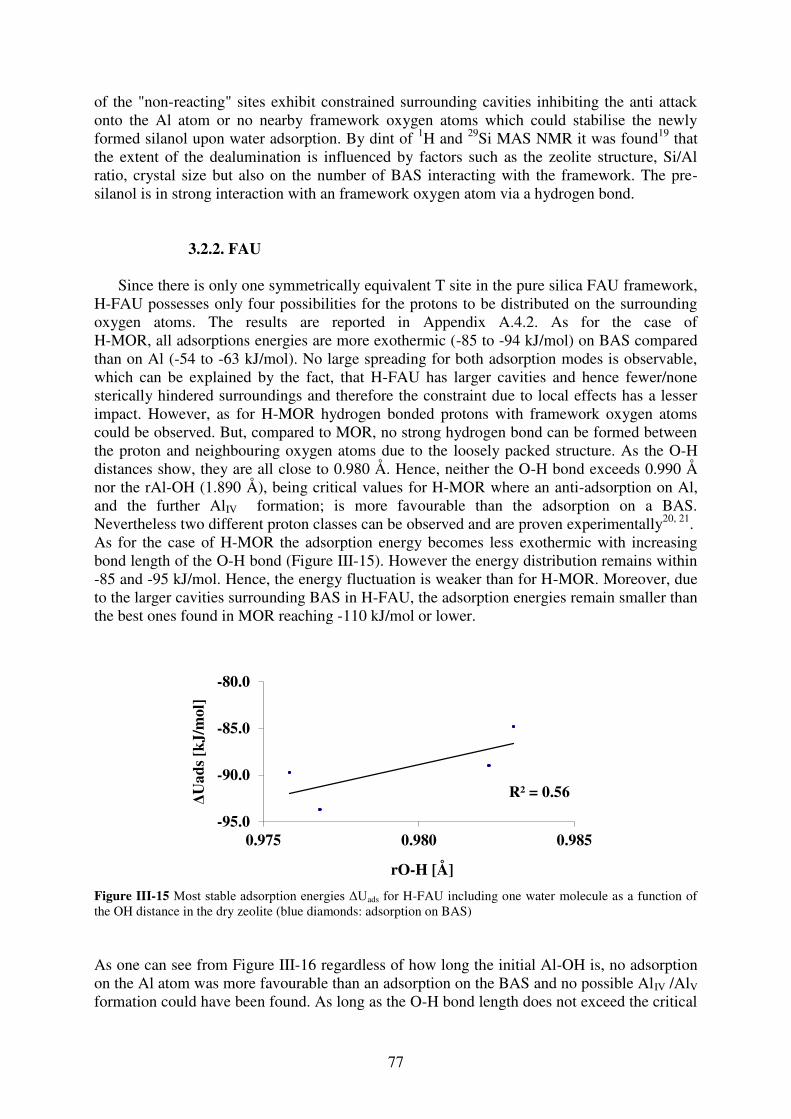
77
of the "non-reacting" sites exhibit constrained surrounding cavities inhibiting the anti attack onto the Al atom or no nearby framework oxygen atoms which could stabilise the newly formed silanol upon water adsorption. By dint of 1H and 29Si MAS NMR it was found19 that the extent of the dealumination is influenced by factors such as the zeolite structure, Si/Al ratio, crystal size but also on the number of BAS interacting with the framework. The pre-silanol is in strong interaction with an framework oxygen atom via a hydrogen bond.
3.2.2. FAU
Since there is only one symmetrically equivalent T site in the pure silica FAU framework, H-FAU possesses only four possibilities for the protons to be distributed on the surrounding oxygen atoms. The results are reported in Appendix A.4.2. As for the case of H-MOR, all adsorptions energies are more exothermic (-85 to -94 kJ/mol) on BAS compared than on Al (-54 to -63 kJ/mol). No large spreading for both adsorption modes is observable, which can be explained by the fact, that H-FAU has larger cavities and hence fewer/none sterically hindered surroundings and therefore the constraint due to local effects has a lesser impact. However, as for H-MOR hydrogen bonded protons with framework oxygen atoms could be observed. But, compared to MOR, no strong hydrogen bond can be formed between the proton and neighbouring oxygen atoms due to the loosely packed structure. As the O-H distances show, they are all close to 0.980 Å. Hence, neither the O-H bond exceeds 0.990 Å nor the rAl-OH (1.890 Å), being critical values for H-MOR where an anti-adsorption on Al, and the further AlIV formation; is more favourable than the adsorption on a BAS. Nevertheless two different proton classes can be observed and are proven experimentally20, 21. As for the case of H-MOR the adsorption energy becomes less exothermic with increasing bond length of the O-H bond (Figure III-15). However the energy distribution remains within -85 and -95 kJ/mol. Hence, the energy fluctuation is weaker than for H-MOR. Moreover, due to the larger cavities surrounding BAS in H-FAU, the adsorption energies remain smaller than the best ones found in MOR reaching -110 kJ/mol or lower.
Figure III-15 Most stable adsorption energies ΔUads for H-FAU including one water molecule as a function of the OH distance in the dry zeolite (blue diamonds: adsorption on BAS) As one can see from Figure III-16 regardless of how long the initial Al-OH is, no adsorption on the Al atom was more favourable than an adsorption on the BAS and no possible AlIV /AlV formation could have been found. As long as the O-H bond length does not exceed the critical
R² = 0.56
-95.0
-90.0
-85.0
-80.0
0.975 0.980 0.985
ΔUad
s [k
J/m
ol]
rO-H [Å]
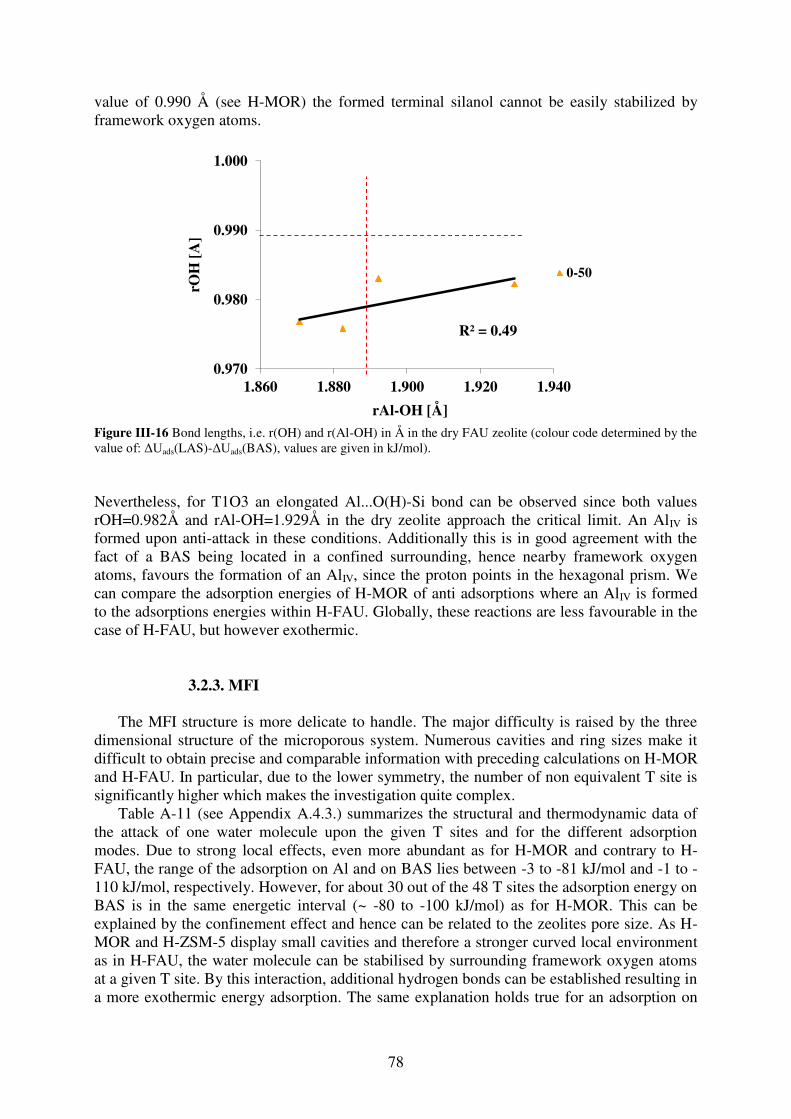
78
value of 0.990 Å (see H-MOR) the formed terminal silanol cannot be easily stabilized by framework oxygen atoms.
Figure III-16 Bond lengths, i.e. r(OH) and r(Al-OH) in Å in the dry FAU zeolite (colour code determined by the value of: ΔUads(LAS)-ΔUads(BAS), values are given in kJ/mol). Nevertheless, for T1O3 an elongated Al...O(H)-Si bond can be observed since both values rOH=0.982Å and rAl-OH=1.929Å in the dry zeolite approach the critical limit. An AlIV is formed upon anti-attack in these conditions. Additionally this is in good agreement with the fact of a BAS being located in a confined surrounding, hence nearby framework oxygen atoms, favours the formation of an AlIV, since the proton points in the hexagonal prism. We can compare the adsorption energies of H-MOR of anti adsorptions where an AlIV is formed to the adsorptions energies within H-FAU. Globally, these reactions are less favourable in the case of H-FAU, but however exothermic.
3.2.3. MFI
The MFI structure is more delicate to handle. The major difficulty is raised by the three dimensional structure of the microporous system. Numerous cavities and ring sizes make it difficult to obtain precise and comparable information with preceding calculations on H-MOR and H-FAU. In particular, due to the lower symmetry, the number of non equivalent T site is significantly higher which makes the investigation quite complex.
Table A-11 (see Appendix A.4.3.) summarizes the structural and thermodynamic data of the attack of one water molecule upon the given T sites and for the different adsorption modes. Due to strong local effects, even more abundant as for H-MOR and contrary to H-FAU, the range of the adsorption on Al and on BAS lies between -3 to -81 kJ/mol and -1 to -110 kJ/mol, respectively. However, for about 30 out of the 48 T sites the adsorption energy on BAS is in the same energetic interval (~ -80 to -100 kJ/mol) as for H-MOR. This can be explained by the confinement effect and hence can be related to the zeolites pore size. As H-MOR and H-ZSM-5 display small cavities and therefore a stronger curved local environment as in H-FAU, the water molecule can be stabilised by surrounding framework oxygen atoms at a given T site. By this interaction, additional hydrogen bonds can be established resulting in a more exothermic energy adsorption. The same explanation holds true for an adsorption on
R² = 0.49
0.970
0.980
0.990
1.000
1.860 1.880 1.900 1.920 1.940
rOH
[A
]
rAl-OH [Å]
0-50
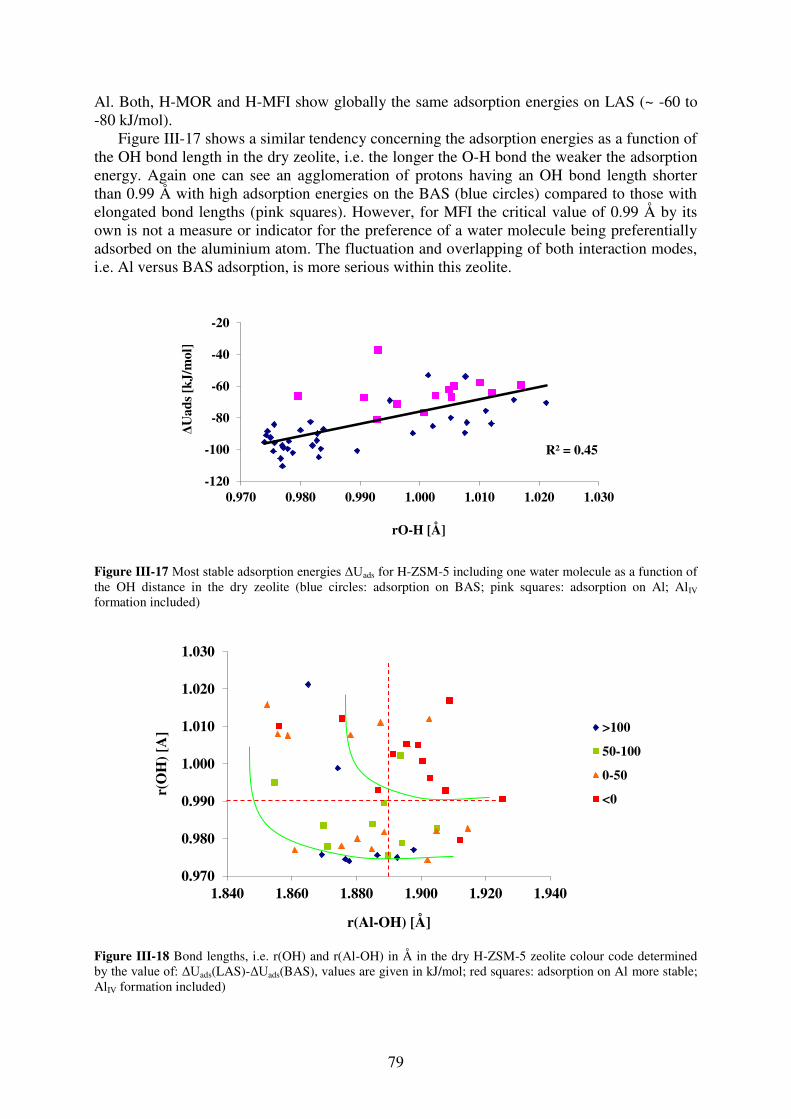
79
Al. Both, H-MOR and H-MFI show globally the same adsorption energies on LAS (~ -60 to -80 kJ/mol).
Figure III-17 shows a similar tendency concerning the adsorption energies as a function of the OH bond length in the dry zeolite, i.e. the longer the O-H bond the weaker the adsorption energy. Again one can see an agglomeration of protons having an OH bond length shorter than 0.99 Å with high adsorption energies on the BAS (blue circles) compared to those with elongated bond lengths (pink squares). However, for MFI the critical value of 0.99 Å by its own is not a measure or indicator for the preference of a water molecule being preferentially adsorbed on the aluminium atom. The fluctuation and overlapping of both interaction modes, i.e. Al versus BAS adsorption, is more serious within this zeolite.
Figure III-17 Most stable adsorption energies ΔUads for H-ZSM-5 including one water molecule as a function of the OH distance in the dry zeolite (blue circles: adsorption on BAS; pink squares: adsorption on Al; AlIV formation included)
Figure III-18 Bond lengths, i.e. r(OH) and r(Al-OH) in Å in the dry H-ZSM-5 zeolite colour code determined by the value of: ΔUads(LAS)-ΔUads(BAS), values are given in kJ/mol; red squares: adsorption on Al more stable; AlIV formation included)
R² = 0.45
-120
-100
-80
-60
-40
-20
0.970 0.980 0.990 1.000 1.010 1.020 1.030
ΔUad
s [k
J/m
ol]
rO-H [Å]
0.970
0.980
0.990
1.000
1.010
1.020
1.030
1.840 1.860 1.880 1.900 1.920 1.940
r(O
H)
[A]
r(Al-OH) [Å]
>100
50-100
0-50
<0
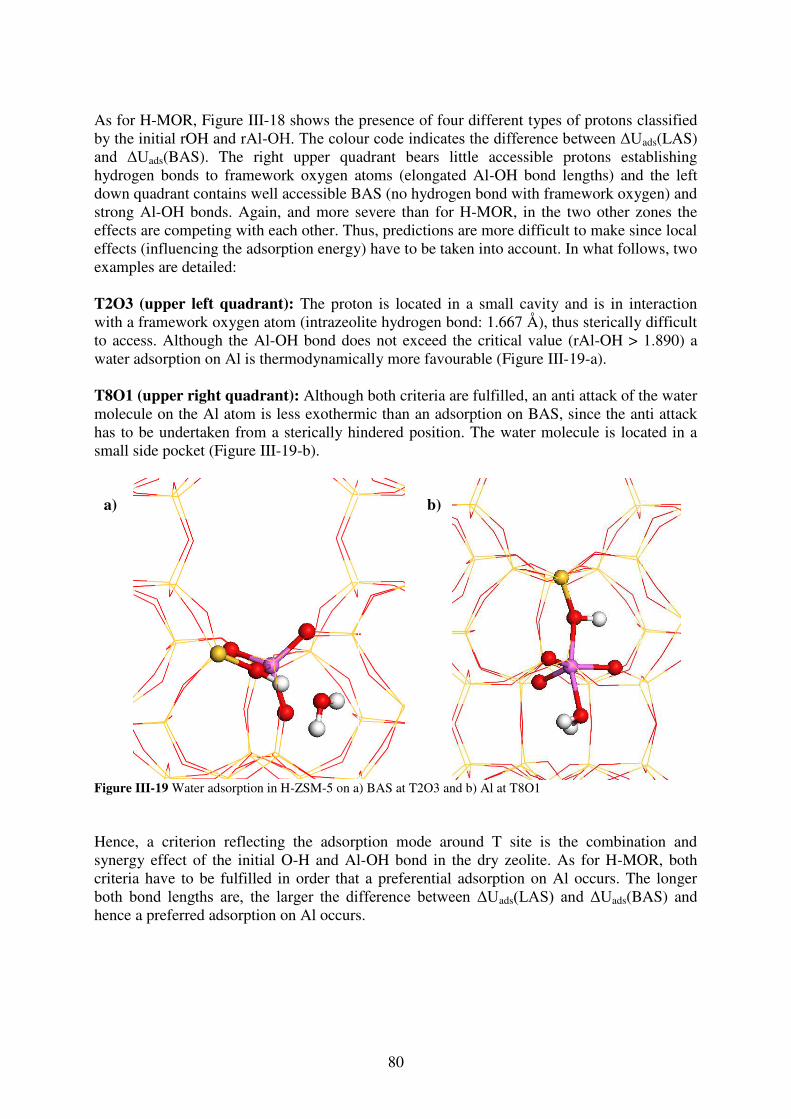
80
As for H-MOR, Figure III-18 shows the presence of four different types of protons classified by the initial rOH and rAl-OH. The colour code indicates the difference between ΔUads(LAS) and ΔUads(BAS). The right upper quadrant bears little accessible protons establishing hydrogen bonds to framework oxygen atoms (elongated Al-OH bond lengths) and the left down quadrant contains well accessible BAS (no hydrogen bond with framework oxygen) and strong Al-OH bonds. Again, and more severe than for H-MOR, in the two other zones the effects are competing with each other. Thus, predictions are more difficult to make since local effects (influencing the adsorption energy) have to be taken into account. In what follows, two examples are detailed: T2O3 (upper left quadrant): The proton is located in a small cavity and is in interaction with a framework oxygen atom (intrazeolite hydrogen bond: 1.667 Å), thus sterically difficult to access. Although the Al-OH bond does not exceed the critical value (rAl-OH > 1.890) a water adsorption on Al is thermodynamically more favourable (Figure III-19-a). T8O1 (upper right quadrant): Although both criteria are fulfilled, an anti attack of the water molecule on the Al atom is less exothermic than an adsorption on BAS, since the anti attack has to be undertaken from a sterically hindered position. The water molecule is located in a small side pocket (Figure III-19-b).
Figure III-19 Water adsorption in H-ZSM-5 on a) BAS at T2O3 and b) Al at T8O1 Hence, a criterion reflecting the adsorption mode around T site is the combination and synergy effect of the initial O-H and Al-OH bond in the dry zeolite. As for H-MOR, both criteria have to be fulfilled in order that a preferential adsorption on Al occurs. The longer both bond lengths are, the larger the difference between ΔUads(LAS) and ΔUads(BAS) and hence a preferred adsorption on Al occurs.
a) b)
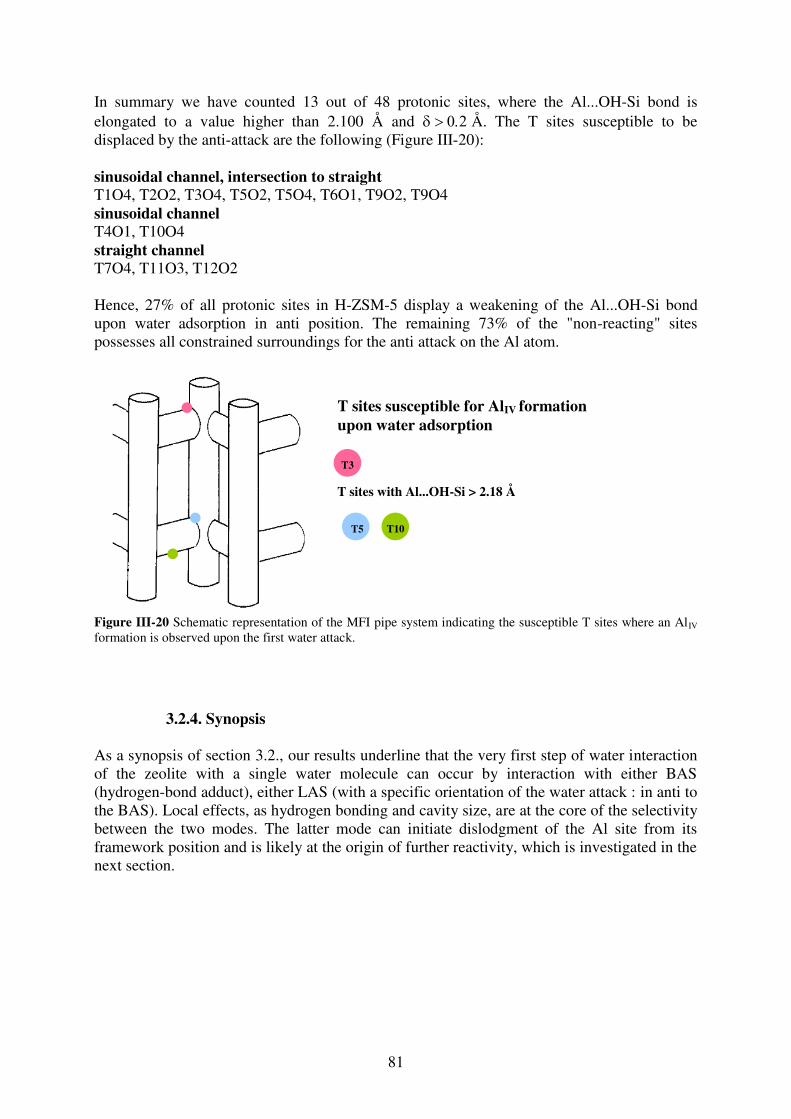
81
In summary we have counted 13 out of 48 protonic sites, where the Al...OH-Si bond is elongated to a value higher than 2.100 Å and Å. The T sites susceptible to be displaced by the anti-attack are the following (Figure III-20): sinusoidal channel, intersection to straight T1O4, T2O2, T3O4, T5O2, T5O4, T6O1, T9O2, T9O4 sinusoidal channel T4O1, T10O4 straight channel T7O4, T11O3, T12O2 Hence, 27% of all protonic sites in H-ZSM-5 display a weakening of the Al...OH-Si bond upon water adsorption in anti position. The remaining 73% of the "non-reacting" sites possesses all constrained surroundings for the anti attack on the Al atom.
Figure III-20 Schematic representation of the MFI pipe system indicating the susceptible T sites where an AlIV
formation is observed upon the first water attack.
3.2.4. Synopsis As a synopsis of section 3.2., our results underline that the very first step of water interaction of the zeolite with a single water molecule can occur by interaction with either BAS (hydrogen-bond adduct), either LAS (with a specific orientation of the water attack : in anti to the BAS). Local effects, as hydrogen bonding and cavity size, are at the core of the selectivity between the two modes. The latter mode can initiate dislodgment of the Al site from its framework position and is likely at the origin of further reactivity, which is investigated in the next section.
T3
T10 T5
T sites susceptible for AlIV formation
upon water adsorption
T sites with Al...OH-Si > 2.18 Å
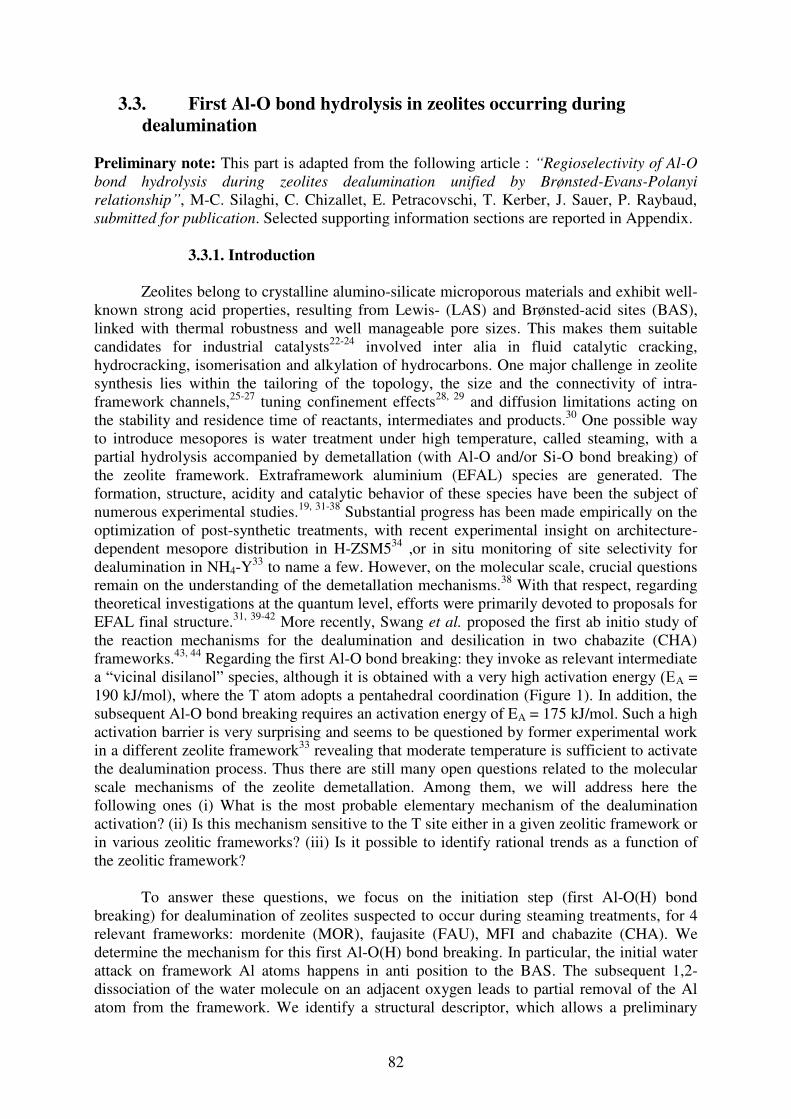
82
3.3. First Al-O bond hydrolysis in zeolites occurring during dealumination
Preliminary note: This part is adapted from the following article : “Regioselectivity of Al-O
bond hydrolysis during zeolites dealumination unified by Brønsted-Evans-Polanyi
relationship”, M-C. Silaghi, C. Chizallet, E. Petracovschi, T. Kerber, J. Sauer, P. Raybaud, submitted for publication. Selected supporting information sections are reported in Appendix.
3.3.1. Introduction
Zeolites belong to crystalline alumino-silicate microporous materials and exhibit well-known strong acid properties, resulting from Lewis- (LAS) and Brønsted-acid sites (BAS), linked with thermal robustness and well manageable pore sizes. This makes them suitable candidates for industrial catalysts22-24 involved inter alia in fluid catalytic cracking, hydrocracking, isomerisation and alkylation of hydrocarbons. One major challenge in zeolite synthesis lies within the tailoring of the topology, the size and the connectivity of intra-framework channels,25-27 tuning confinement effects28, 29 and diffusion limitations acting on the stability and residence time of reactants, intermediates and products.30 One possible way to introduce mesopores is water treatment under high temperature, called steaming, with a partial hydrolysis accompanied by demetallation (with Al-O and/or Si-O bond breaking) of the zeolite framework. Extraframework aluminium (EFAL) species are generated. The formation, structure, acidity and catalytic behavior of these species have been the subject of numerous experimental studies.19, 31-38 Substantial progress has been made empirically on the optimization of post-synthetic treatments, with recent experimental insight on architecture-dependent mesopore distribution in H-ZSM534 ,or in situ monitoring of site selectivity for dealumination in NH4-Y
33 to name a few. However, on the molecular scale, crucial questions remain on the understanding of the demetallation mechanisms.38 With that respect, regarding theoretical investigations at the quantum level, efforts were primarily devoted to proposals for EFAL final structure.31, 39-42 More recently, Swang et al. proposed the first ab initio study of the reaction mechanisms for the dealumination and desilication in two chabazite (CHA) frameworks.43, 44 Regarding the first Al-O bond breaking: they invoke as relevant intermediate a “vicinal disilanol” species, although it is obtained with a very high activation energy (EA = 190 kJ/mol), where the T atom adopts a pentahedral coordination (Figure 1). In addition, the subsequent Al-O bond breaking requires an activation energy of EA = 175 kJ/mol. Such a high activation barrier is very surprising and seems to be questioned by former experimental work in a different zeolite framework33 revealing that moderate temperature is sufficient to activate the dealumination process. Thus there are still many open questions related to the molecular scale mechanisms of the zeolite demetallation. Among them, we will address here the following ones (i) What is the most probable elementary mechanism of the dealumination activation? (ii) Is this mechanism sensitive to the T site either in a given zeolitic framework or in various zeolitic frameworks? (iii) Is it possible to identify rational trends as a function of the zeolitic framework?
To answer these questions, we focus on the initiation step (first Al-O(H) bond breaking) for dealumination of zeolites suspected to occur during steaming treatments, for 4 relevant frameworks: mordenite (MOR), faujasite (FAU), MFI and chabazite (CHA). We determine the mechanism for this first Al-O(H) bond breaking. In particular, the initial water attack on framework Al atoms happens in anti position to the BAS. The subsequent 1,2-dissociation of the water molecule on an adjacent oxygen leads to partial removal of the Al atom from the framework. We identify a structural descriptor, which allows a preliminary
83
estimation of transition state (TS) stabilities, depending on T site location. Additionally, an appealing Brønsted-Evans-Polanyi relationship is found.
3.3.2. Choice of T sites investigated in details
On the basis of the narrow relative stability of all T sites in our given zeolitic systems and the fact that our results are satisfying since the energy difference between different proton positions at one T site lies under the calculated energy needed for a proton jump within zeolites, as Tuma et al. showed by means of a hybrid MP2/planewave DFT scheme5 (80 and 30 kJ/mol for dry and hydrated zeolite, respectively) the following T sites were chosen: MOR Our for the investigation chosen T site for the dealumination in zeolite mordenite was the T4O4 site (Chapter I). At this, the aluminium atom is located in a 4MR in the wall of the 12MR and the residence of the proton on oxygen atom O4 leads to intrazeolite hydrogen bonds with two framework oxygen atoms (1.68 Å, 2.56 Å) and one oxygen atom linked to Al (2.50 Å). This T site was chosen according to experimental data45 amongst others of Müller et
al. stating that the extent of dealumination increased with the number of Brønsted acid sites being in interaction with framework oxygen atoms19 and of van Geem et al. showing that the T sites located in the 4MR are the first to dealuminate46. CHA Since the chabazite structure contains only one inequivalent tetrahedral site, only four different asymmetric oxygen atoms exist giving four possible Brønsted acid site configurations. For the mechanistic investigation, we chose the T1O3 site, where the proton resides on an oxygen atom being a member of two four-membered and one six-membered ring. Contrary to the other three proton positions that are all part of the 8MR window, the proton at O3 can interact via intrazeolite hydrogen bonds (2.22 Å, 2.62 Å, 3.19 Å) with oxygen atoms of a six-membered ring. This was chosen in accordance with experimental findings on other zeolites (MFI, Beta, Mordenite) and by dint of 1H-NMR spectra proposing that the extent of dealumination increased with the number of Brønsted acid sites being in interaction with framework oxygen atoms 19. Moreover, Bordiga et al. showed by dint of adsorption studies of CO on high silica H-CHA, that there exist two distinct families of acid sites and all proton permutations have to be taken into consideration for an accurate description of the resulting IR spectra47. MFI The T sites we chose for the mechanistic investigation in MFI type zeolite is based on experimental findings by Karwacki et al. showing by dint of FIB and SEM analyses on steamed ZSM-5 that sinusoidal channels are more susceptible to the dealumination than straight channels34. Therefore we envisaged the following T sites as representative example (Chapter I): i) T3O4: part of the intersection region between sinusoidal and straight channels At this T site the BAS proton points in a small cavity displaying intrazeolite hydrogen bonds with one oxygen atom bound to the Al (2.18 Å) and two framework oxygen atoms (2.37 Å, 2.97 Å). ii) T10O2: located in the sinusoidal channels The proton at T10O2 displays only one intrazeolite hydrogen bond with a framework oxygen atom of length 1.70 Å. iii) T11O3: located in the straight channel
84
The proton at this T site is in interaction via a hydrogen bond with two framework oxygen atoms of length 1.89 Å and 2.36 Å. FAU The framework of Faujasite contains only one inequivalent T site resulting in four proton positions. According to Neutron Powder Diffraction studies of D-Y and H-Y zeolite samples Czjzek et al. found the preferred proton positions for the O1 and O3 site where the highest occupation of protons was at the O1 site20. These proton sites were then considered in the mechanistic investigation (Figure S1). While the proton bound to O1 points in to the super cage and displays an hydrogen bond with an oxygen atom linked to Al (2.34 Å), the proton located at O3 is oriented towards the hexagonal prism and in interaction with two framework oxygen atoms (2.62 Å, 2.59 Å). Moreover, an in situ XAS and XRPD analysis on steam dealuminated zeolite Y by Agostini et al. revealed that 30-35% of the total framework Al occupy the sodalite cage in form of tetra-coordinated EFAL species33.
3.3.3. Methods
We have used periodic DFT calculations as implemented in the VASP code48 with a dispersion corrected17, 49 Perdew-Burke-Erznerhof functional.50 Except cell relaxation, all calculations were performed at the -point with a cut-off energy of 400eV. For the localization of transition states the Nudged Elastic Band method was employed.51 The highest energy image, i.e. the supposed TS, was subjected to a quasi-newton algorithm and confirmed by vibrational analyses. Additionally, a hybrid QM/QM scheme (MP2:DFT+D2),52, 53 was applied, showing that PBE-D2 reproduces adsorption energies within 4 kJ/mol, and barriers within 9 kJ/mol (see Chapter II).
3.3.4. Relevant intermediates
The possible initiation steps of an Al-O/Si-O bond breaking including one water molecule were exhaustively analyzed for one T site within MOR (T4O4, part of the 12MR channel and located in a 4MR ring) and one T site within MFI (T10O2, located in the sinusoidal channel) (see Appendix A-3). Figure III-21 illustrates relevant intermediates initiating the first Al-O(H) bond breaking we identified.
The first intermediate (I0) results from water adsorption on Al in anti position to the BAS leading to the formation of either a trigonal bipyramidal AlV or a distorted tetrahedral AlIV species, depending on the local configuration for the adsorbed water molecule. The adsorption energies are -67 kJ/mol and -59 kJ/mol for the T4O4 site in H-MOR and the T10O2 site in H-MFI, respectively. Such Al species were also proposed in literature and are supposed to be the initial dislodgement of Al to extraframework positions by identifying the NMR chemical shift for 27Al at about 30 ppm attributed to distorted tetrahedral or pentahedral Al species.33 23,33 After water adsorption, the Al-O(H) distance increases from 1.90 Å to 2.12 Å for the T4O4 site in H-MOR and from 1.90 Å to 2.19 Å for the T10O2 site in H-MFI which can already be seen as the initiation of the bond breaking, with the formation of a pseudo-bridging silanol.36, 54
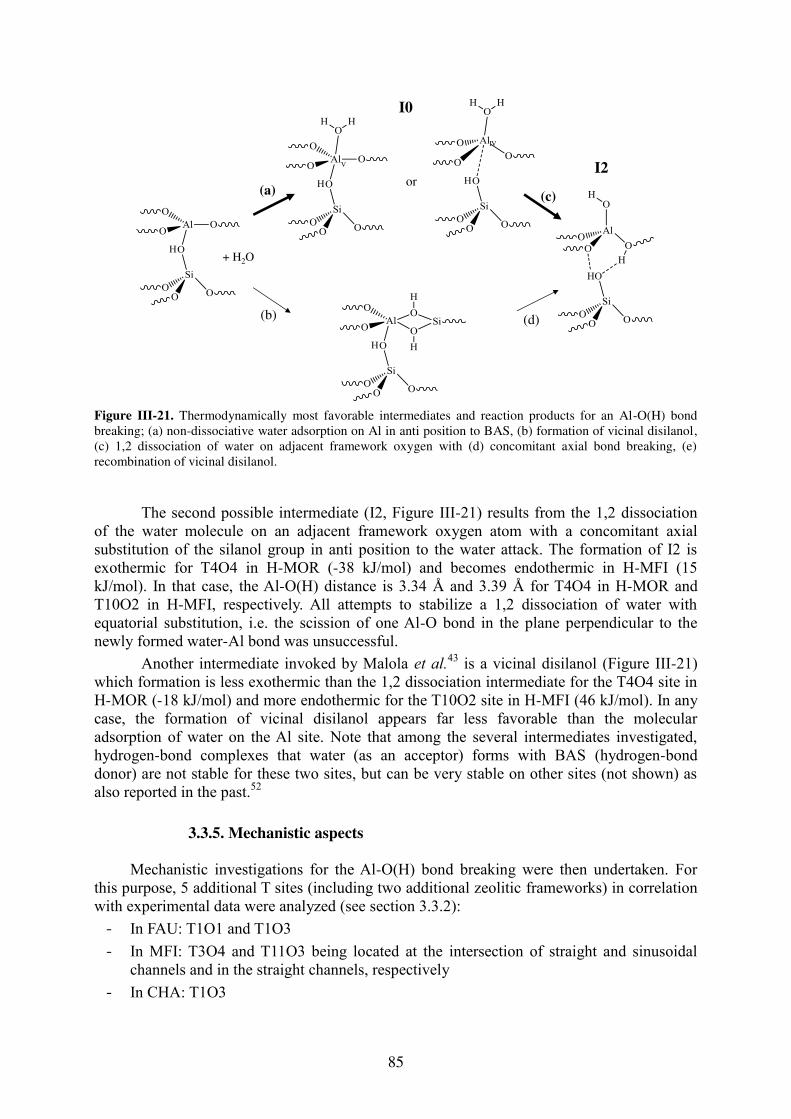
85
Figure III-21. Thermodynamically most favorable intermediates and reaction products for an Al-O(H) bond breaking; (a) non-dissociative water adsorption on Al in anti position to BAS, (b) formation of vicinal disilanol, (c) 1,2 dissociation of water on adjacent framework oxygen with (d) concomitant axial bond breaking, (e) recombination of vicinal disilanol.
The second possible intermediate (I2, Figure III-21) results from the 1,2 dissociation
of the water molecule on an adjacent framework oxygen atom with a concomitant axial substitution of the silanol group in anti position to the water attack. The formation of I2 is exothermic for T4O4 in H-MOR (-38 kJ/mol) and becomes endothermic in H-MFI (15 kJ/mol). In that case, the Al-O(H) distance is 3.34 Å and 3.39 Å for T4O4 in H-MOR and T10O2 in H-MFI, respectively. All attempts to stabilize a 1,2 dissociation of water with equatorial substitution, i.e. the scission of one Al-O bond in the plane perpendicular to the newly formed water-Al bond was unsuccessful.
Another intermediate invoked by Malola et al.43 is a vicinal disilanol (Figure III-21) which formation is less exothermic than the 1,2 dissociation intermediate for the T4O4 site in H-MOR (-18 kJ/mol) and more endothermic for the T10O2 site in H-MFI (46 kJ/mol). In any case, the formation of vicinal disilanol appears far less favorable than the molecular adsorption of water on the Al site. Note that among the several intermediates investigated, hydrogen-bond complexes that water (as an acceptor) forms with BAS (hydrogen-bond donor) are not stable for these two sites, but can be very stable on other sites (not shown) as also reported in the past.52
3.3.5. Mechanistic aspects
Mechanistic investigations for the Al-O(H) bond breaking were then undertaken. For this purpose, 5 additional T sites (including two additional zeolitic frameworks) in correlation with experimental data were analyzed (see section 3.3.2):
- In FAU: T1O1 and T1O3
- In MFI: T3O4 and T11O3 being located at the intersection of straight and sinusoidal channels and in the straight channels, respectively
- In CHA: T1O3
+ H2O
or
V
(a)
(b)
IV
(d)
(c)
I0
I2
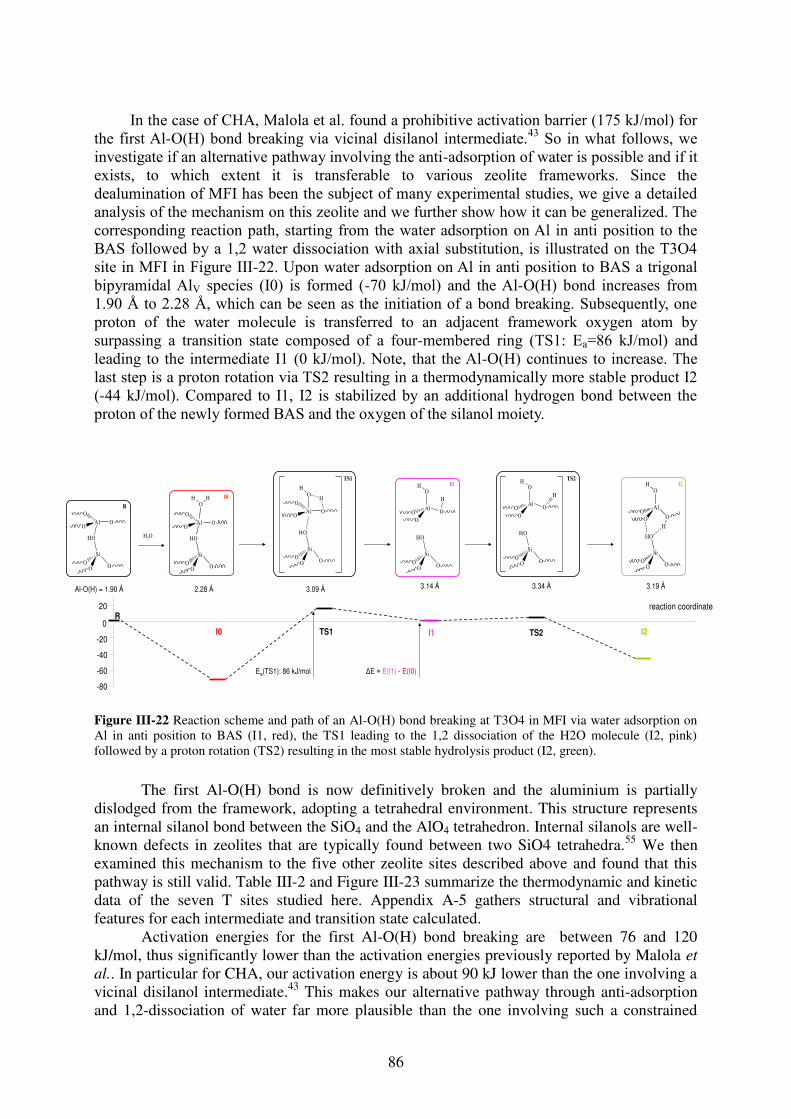
86
In the case of CHA, Malola et al. found a prohibitive activation barrier (175 kJ/mol) for
the first Al-O(H) bond breaking via vicinal disilanol intermediate.43 So in what follows, we investigate if an alternative pathway involving the anti-adsorption of water is possible and if it exists, to which extent it is transferable to various zeolite frameworks. Since the dealumination of MFI has been the subject of many experimental studies, we give a detailed analysis of the mechanism on this zeolite and we further show how it can be generalized. The corresponding reaction path, starting from the water adsorption on Al in anti position to the BAS followed by a 1,2 water dissociation with axial substitution, is illustrated on the T3O4 site in MFI in Figure III-22. Upon water adsorption on Al in anti position to BAS a trigonal bipyramidal AlV species (I0) is formed (-70 kJ/mol) and the Al-O(H) bond increases from 1.90 Å to 2.28 Å, which can be seen as the initiation of a bond breaking. Subsequently, one proton of the water molecule is transferred to an adjacent framework oxygen atom by surpassing a transition state composed of a four-membered ring (TS1: Ea=86 kJ/mol) and leading to the intermediate I1 (0 kJ/mol). Note, that the Al-O(H) continues to increase. The last step is a proton rotation via TS2 resulting in a thermodynamically more stable product I2 (-44 kJ/mol). Compared to I1, I2 is stabilized by an additional hydrogen bond between the proton of the newly formed BAS and the oxygen of the silanol moiety.
Figure III-22 Reaction scheme and path of an Al-O(H) bond breaking at T3O4 in MFI via water adsorption on Al in anti position to BAS (I1, red), the TS1 leading to the 1,2 dissociation of the H2O molecule (I2, pink) followed by a proton rotation (TS2) resulting in the most stable hydrolysis product (I2, green).
The first Al-O(H) bond is now definitively broken and the aluminium is partially
dislodged from the framework, adopting a tetrahedral environment. This structure represents an internal silanol bond between the SiO4 and the AlO4 tetrahedron. Internal silanols are well-known defects in zeolites that are typically found between two SiO4 tetrahedra.55 We then examined this mechanism to the five other zeolite sites described above and found that this pathway is still valid. Table III-2 and Figure III-23 summarize the thermodynamic and kinetic data of the seven T sites studied here. Appendix A-5 gathers structural and vibrational features for each intermediate and transition state calculated.
Activation energies for the first Al-O(H) bond breaking are between 76 and 120 kJ/mol, thus significantly lower than the activation energies previously reported by Malola et
al.. In particular for CHA, our activation energy is about 90 kJ lower than the one involving a vicinal disilanol intermediate.43 This makes our alternative pathway through anti-adsorption and 1,2-dissociation of water far more plausible than the one involving such a constrained
H2O
AlO
OO
OH
Si
OH
H
OO O
TS1
Al O
OH
H
OH
Si
OO O
OO
I1
AlO
OO
OH
Si
OO O
R
AlO
OO
OH
Si
OO
OH H
O
I0Al O
OH
H
OH
Si
OO O
OO
TS2
-80
-60
-40
-20
0
20
ΔE = E(I1) - E(I0)Ea(TS1): 86 kJ/mol
I0 TS1 I1 TS2 I2
Rreaction coordinate
I2
Al-O(H) = 1.90 Å 2.28 Å 3.09 Å 3.14 Å 3.34 Å 3.19 Å
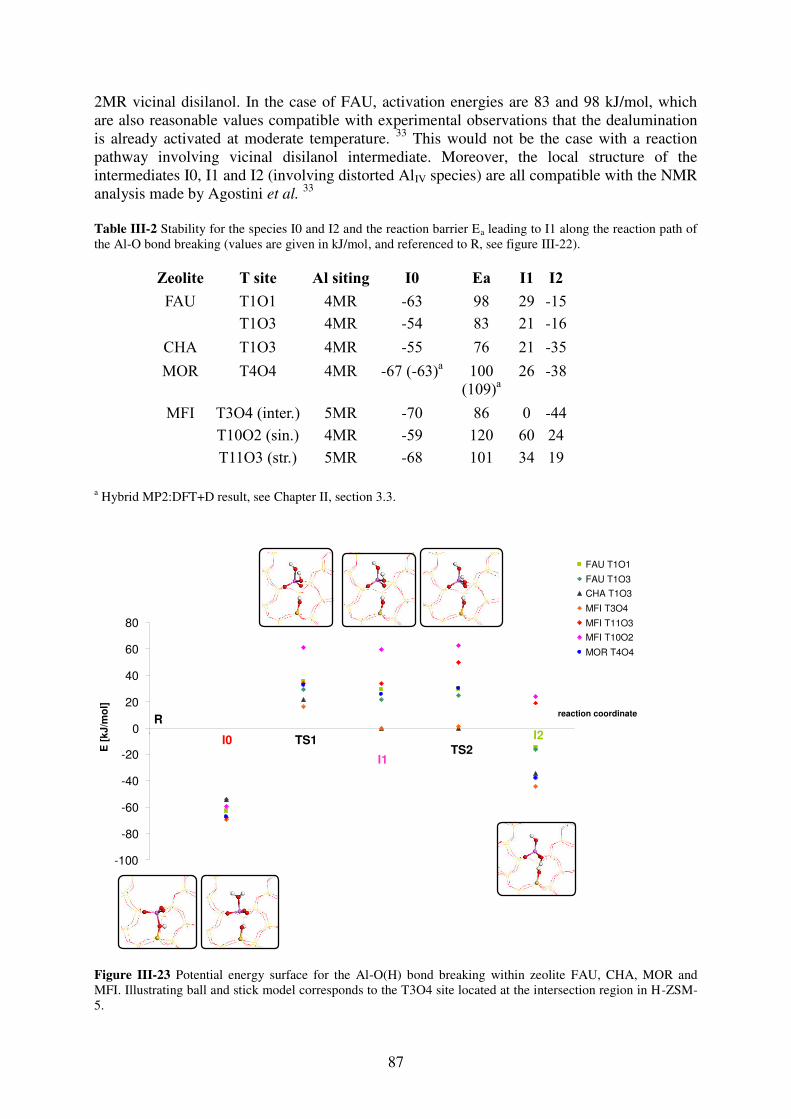
87
2MR vicinal disilanol. In the case of FAU, activation energies are 83 and 98 kJ/mol, which are also reasonable values compatible with experimental observations that the dealumination is already activated at moderate temperature. 33 This would not be the case with a reaction pathway involving vicinal disilanol intermediate. Moreover, the local structure of the intermediates I0, I1 and I2 (involving distorted AlIV species) are all compatible with the NMR analysis made by Agostini et al. 33 Table III-2 Stability for the species I0 and I2 and the reaction barrier Ea leading to I1 along the reaction path of the Al-O bond breaking (values are given in kJ/mol, and referenced to R, see figure III-22).
Zeolite T site Al siting I0 Ea I1 I2
FAU T1O1 T1O3
4MR 4MR
-63 -54
98 83
29 21
-15 -16
CHA T1O3 4MR -55 76 21 -35
MOR T4O4 4MR -67 (-63)a 100 (109)a
26 -38
MFI T3O4 (inter.) T10O2 (sin.) T11O3 (str.)
5MR 4MR 5MR
-70 -59 -68
86 120 101
0 60 34
-44 24 19
a Hybrid MP2:DFT+D result, see Chapter II, section 3.3.
Figure III-23 Potential energy surface for the Al-O(H) bond breaking within zeolite FAU, CHA, MOR and MFI. Illustrating ball and stick model corresponds to the T3O4 site located at the intersection region in H-ZSM-5.
-100
-80
-60
-40
-20
0
20
40
60
80
0
FAU T1O1
FAU T1O3
CHA T1O3
MFI T3O4
MFI T11O3
MFI T10O2
MOR T4O4
reaction coordinate
E [
kJ
/mo
l]
I0 TS1
I1TS2
I2
R
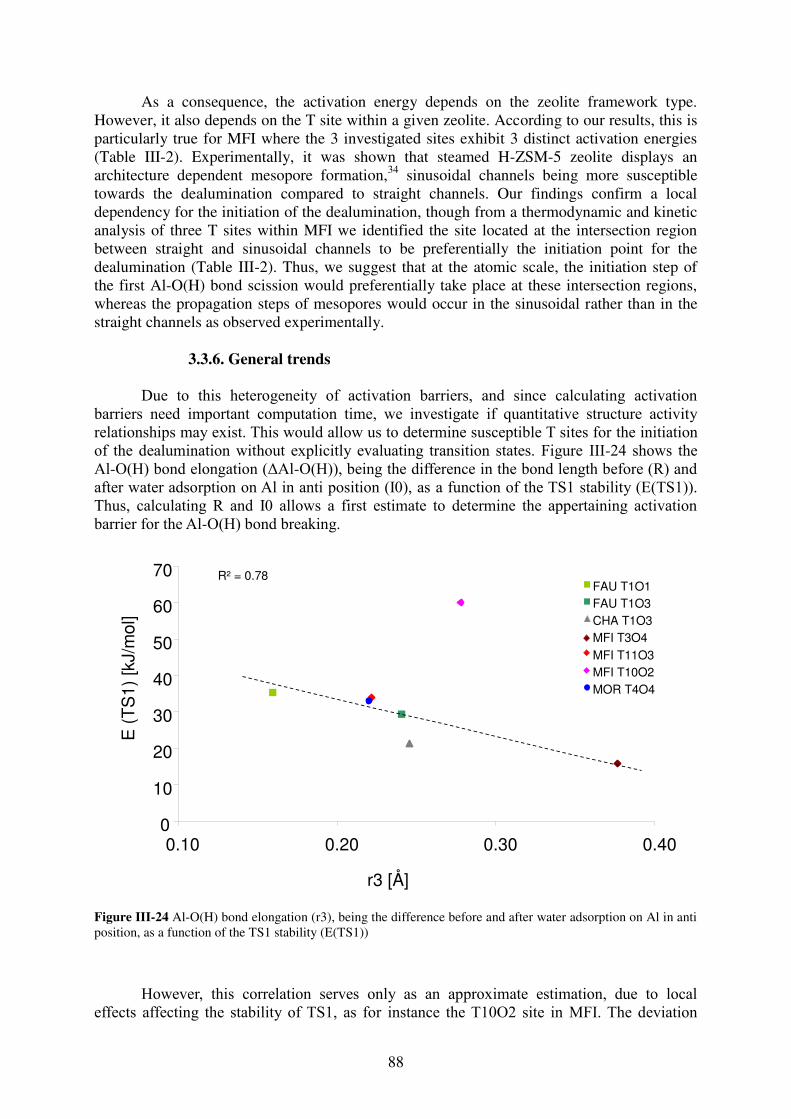
88
As a consequence, the activation energy depends on the zeolite framework type. However, it also depends on the T site within a given zeolite. According to our results, this is particularly true for MFI where the 3 investigated sites exhibit 3 distinct activation energies (Table III-2). Experimentally, it was shown that steamed H-ZSM-5 zeolite displays an architecture dependent mesopore formation,34 sinusoidal channels being more susceptible towards the dealumination compared to straight channels. Our findings confirm a local dependency for the initiation of the dealumination, though from a thermodynamic and kinetic analysis of three T sites within MFI we identified the site located at the intersection region between straight and sinusoidal channels to be preferentially the initiation point for the dealumination (Table III-2). Thus, we suggest that at the atomic scale, the initiation step of the first Al-O(H) bond scission would preferentially take place at these intersection regions, whereas the propagation steps of mesopores would occur in the sinusoidal rather than in the straight channels as observed experimentally.
3.3.6. General trends
Due to this heterogeneity of activation barriers, and since calculating activation barriers need important computation time, we investigate if quantitative structure activity relationships may exist. This would allow us to determine susceptible T sites for the initiation of the dealumination without explicitly evaluating transition states. Figure III-24 shows the Al-O(H) bond elongation (ΔAl-O(H)), being the difference in the bond length before (R) and after water adsorption on Al in anti position (I0), as a function of the TS1 stability (E(TS1)). Thus, calculating R and I0 allows a first estimate to determine the appertaining activation barrier for the Al-O(H) bond breaking.
Figure III-24 Al-O(H) bond elongation (r3), being the difference before and after water adsorption on Al in anti position, as a function of the TS1 stability (E(TS1))
However, this correlation serves only as an approximate estimation, due to local
effects affecting the stability of TS1, as for instance the T10O2 site in MFI. The deviation
FAU T1O1FAU T1O3CHA T1O3MFI T3O4MFI T11O3MFI T10O2MOR T4O4
R² = 0.78
0
10
20
30
40
50
60
70
0.10 0.20 0.30 0.40
r3 [Å]
E (
TS
1) [k
J/m
ol]
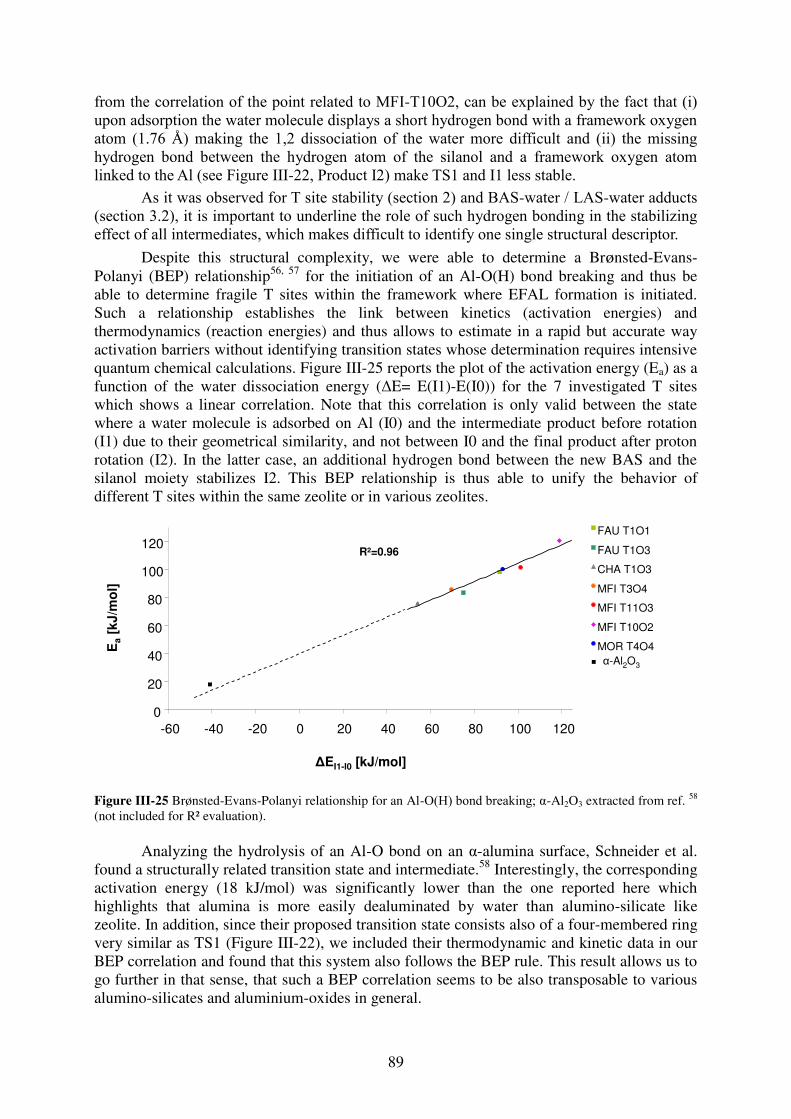
89
from the correlation of the point related to MFI-T10O2, can be explained by the fact that (i) upon adsorption the water molecule displays a short hydrogen bond with a framework oxygen atom (1.76 Å) making the 1,2 dissociation of the water more difficult and (ii) the missing hydrogen bond between the hydrogen atom of the silanol and a framework oxygen atom linked to the Al (see Figure III-22, Product I2) make TS1 and I1 less stable.
As it was observed for T site stability (section 2) and BAS-water / LAS-water adducts (section 3.2), it is important to underline the role of such hydrogen bonding in the stabilizing effect of all intermediates, which makes difficult to identify one single structural descriptor.
Despite this structural complexity, we were able to determine a Brønsted-Evans-Polanyi (BEP) relationship56, 57 for the initiation of an Al-O(H) bond breaking and thus be able to determine fragile T sites within the framework where EFAL formation is initiated. Such a relationship establishes the link between kinetics (activation energies) and thermodynamics (reaction energies) and thus allows to estimate in a rapid but accurate way activation barriers without identifying transition states whose determination requires intensive quantum chemical calculations. Figure III-25 reports the plot of the activation energy (Ea) as a function of the water dissociation energy (ΔE= E(I1)-E(I0)) for the 7 investigated T sites which shows a linear correlation. Note that this correlation is only valid between the state where a water molecule is adsorbed on Al (I0) and the intermediate product before rotation (I1) due to their geometrical similarity, and not between I0 and the final product after proton rotation (I2). In the latter case, an additional hydrogen bond between the new BAS and the silanol moiety stabilizes I2. This BEP relationship is thus able to unify the behavior of different T sites within the same zeolite or in various zeolites.
Figure III-25 Brønsted-Evans-Polanyi relationship for an Al-O(H) bond breaking; α-Al2O3 extracted from ref. 58 (not included for R² evaluation).
Analyzing the hydrolysis of an Al-O bond on an α-alumina surface, Schneider et al. found a structurally related transition state and intermediate.58 Interestingly, the corresponding activation energy (18 kJ/mol) was significantly lower than the one reported here which highlights that alumina is more easily dealuminated by water than alumino-silicate like zeolite. In addition, since their proposed transition state consists also of a four-membered ring very similar as TS1 (Figure III-22), we included their thermodynamic and kinetic data in our BEP correlation and found that this system also follows the BEP rule. This result allows us to go further in that sense, that such a BEP correlation seems to be also transposable to various alumino-silicates and aluminium-oxides in general.
Ea
[kJ
/mo
l]
ΔEI1-I0 [kJ/mol]
0
20
40
60
80
100
120
-60 -40 -20 0 20 40 60 80 100 120
FAU T1O1
FAU T1O3
CHA T1O3
MFI T3O4
MFI T11O3
MFI T10O2
MOR T4O4
R²=0.96
α-Al2O3
90
3.3.7. Summary
We have identified a general and relevant mechanism for the activation step of zeolite dealumination, e.g. the first Al-O(H) bond breaking. The key intermediate formed before the Al-O(H) bond breaking is a water adsorption on Al in anti position to the BAS resulting in either an AlV or distorted tetrahedral AlIV. The subsequent 1,2 dissociation of the water molecule on adjacent framework oxygen atom with a concomitant axial substitution of the silanol group in anti position to the water attack leads to a partial dislodgement of the Al from the zeolitic framework. This mechanism seems far more plausible than the previous one reported in the literature due to the lower activation energy and its compatibility with experimental observations. In subsequent mechanistic analyses a Brønsted-Evans-Polanyi relationship was established. We hope that this work may deserve the molecular scale understanding of the hydrolysis - dealumination process of alumino-silicates and aluminum oxides in the future.
4. Conclusion
Contrary to well-admitted ideas, promoting the first Al-O bond breaking within a perfect zeolite framework appears is a non-straightforward process. Some intermediates only can be formed with reasonable energy gain, in particular BAS-water adducts and LAS-water adducts. The latter is favourable only when the water molecule attacks the aluminium atom in anti to the BAS, which is a major finding, as this interaction mode is at the origin of the dislodgment of Al from its framework position.
Local effects, in particular hydrogen-bonding and confinement considerations, play a huge role in the regioselectivity of the zeolite-water reaction at each stage (formation of the LAS-water in anti to the BAS, then 1,2-dissociation, then rotation of the newly formed Al-(OH)-Si group), making reactivity prediction on structural basis rather difficult. However, we were able to establish a BEP relationship which will be of great help in the future to investigate larger amounts of sites within various zeolitic frameworks.
These findings were compared to experimental features when available, and motivate further computational studies to understand the next reaction steps. Indeed, following the detailed investigation of the first Al-O bond breaking, one may wonder whether the mechanism found here is transposable to the next steps of EFAL formation. Knowledge on the respective kinetics of the first breaking versus the next ones is also required to identify which step is limiting and controls dealumination reactions. This is the purpose of the next chapter.
91
References 1. S. Sklenak, J. Dedecek, C. Li, B. Wichterlova, V. Gabova, M. Sierka and J. Sauer,
Phys. Chem. Chem. Phys., 2009, 11, 1237-1247. 2. T. Demuth, J. Hafner, L. Benco and H. Toulhoat, J. Phys. Chem. B, 2000, 104, 4593-
4607. 3. A. Alberti, Zeolites, 1997, 19, 411-415. 4. H. Huo, L. Peng, Z. Gan and C. P. Grey, J. Am. Chem. Soc., 2012, 134, 9708-9720. 5. C. Tuma and J. Sauer, Chem. Phys. Lett., 2004, 387, 388-394. 6. C. J. T. Grotthuss, Ann. Chim., 1806, 54–74. 7. C. Tuma, T. Kerber and J. Sauer, Angew. Chem., Int. Ed., 2010, 49, 4678-4680. 8. S. Bordiga, C. Lamberti, F. Geobaldo, A. Zecchina, G. T. Palomino and C. O. Arean,
Langmuir, 1995, 11, 527-533. 9. T. Fujino, M. Kashitani, K. Fukuyama, J. Kubota, J. N. Kondo, A. Wada, K. Domen,
C. Hirose, F. Wakabayashi and S. S. Kano, Chem. Phys. Lett., 1996, 261, 534-538. 10. D. H. Olson, N. Khosrovani, A. W. Peters and B. H. Toby, J. Phys. Chem. B, 2000,
104, 4844-4848. 11. J. a. van Bokhoven, T.-L. Lee, M. Drakopoulos, C. Lamberti, S. Thiess and J.
Zegenhagen, Nat. Mater., 2008, 7, 551-555. 12. P. A. Jacobs and R. Vonballmoos, J. Phys. Chem., 1982, 86, 3050-3052. 13. J. Datka and B. Gil, J Mol Struct, 2001, 596, 41-45. 14. A. E. Alvarado-Swaisgood, M. K. Barr, P. J. Hay and A. Redondo, J. Phys. Chem.,
1991, 95, 10031-10036. 15. N. Hansen, T. Kerber, J. Sauer, A. T. Bell and F. J. Keil, J. Am. Chem. Soc., 2010,
132, 11525-11538. 16. S. Svelle, C. Tuma, X. Rozanska, T. Kerber and J. Sauer, J. Am. Chem. Soc., 2009,
131, 816-825. 17. S. Grimme, J. Comput. Chem., 2006, 27, 1787-1799. 18. E. Petracovschi and C. Chizallet, Institut Francais du Pétrole Energies Nouvelles,
Rapport 62062, 2011. 19. M. Müller, G. Harvey and R. Prins, Microporous Mesoporous Mater., 2000, 34, 135-
147. 20. M. Czjzek, H. Jobic, A. N. Fitch and T. Vogt, J. Phys. Chem., 1992, 96, 1535-1540. 21. D. H. Olson and E. Dempsey, J. Catal., 1969, 13, 221-231. 22. A. Corma, Chem. Rev., 1995, 95, 559-614. 23. W. Vermeiren and J. P. Gilson, Top. Catal., 2009, 52, 1131-1161. 24. K. P. de Jong, J. Zečević, H. Friedrich, P. E. de Jongh, M. Bulut, S. van Donk, R.
Kenmogne, A. Finiels, V. Hulea and F. Fajula, Angew. Chem., 2010, 122, 10272-10276.
25. S. Mitchell, N.-L. Michels, K. Kunze and J. Pérez-Ramírez, Nat Chem, 2012, 4, 825-831.
26. V. Valtchev, G. Majano, S. Mintova and J. Perez-Ramirez, Chem. Soc. Rev., 2013, 42, 263-290.
27. C. H. Christensen, K. Johannsen, I. Schmidt and C. H. Christensen, J. Am. Chem. Soc., 2003, 125, 13370-13371.
28. E. G. Derouane, J. M. Andre and A. A. Lucas, J. Catal., 1988, 110, 58-73. 29. M. Kishima, H. Mizuhata and T. Okubo, The Journal of Physical Chemistry B, 2006,
110, 13889-13896.

92
30. B. Smit and T. Maesen, Chem. Rev., 2008, 108, 4125–4184. 31. S. Li, A. Zheng, Y. Su, H. Zhang, L. Chen, J. Yang, C. Ye and F. Deng, J. Am. Chem.
Soc., 2007, 129, 11161-11171. 32. N. Malicki, G. Mali, A.-A. Quoineaud, P. Bourges, L. J. Simon, F. Thibault-Starzyk
and C. Fernandez, Microporous Mesoporous Mater., 2010, 129, 100-105. 33. G. Agostini, C. Lamberti, L. Palin, M. Milanesio, N. Danilina, B. Xu, M. Janousch
and J. a. van Bokhoven, J. Am. Chem. Soc., 2010, 132, 667-678. 34. L. Karwacki, D. A. M. de Winter, L. R. Aramburo, M. N. Lebbink, J. A. Post, M. R.
Drury and B. M. Weckhuysen, Angew. Chem., Int. Ed., 2011, 50, 1294-1298. 35. P. C. Van Geem, K. F. M. G. J. Scholle, G. P. M. Van der Velden and W. S. Veeman,
J. Phys. Chem., 1988, 92, 1585-1589. 36. T.-H. Chen, K. Houthoofd and P. J. Grobet, Microporous Mesoporous Mater., 2005,
86, 31-37. 37. S. van Donk, A. H. Janssen, J. H. Bitter and K. P. de Jong, Catal. Rev., 2003, 45, 297-
319. 38. M.-C. Silaghi, C. Chizallet and P. Raybaud, Microporous Mesoporous Mater., 2014,
191, 82-96. 39. D. L. Bhering, A. Ramirez-Solis and C. J. A. Mota, J. Phys. Chem. B, 2003, 107,
4342-4347. 40. O. Lisboa, M. Sánchez and F. Ruette, J. Mol. Catal. A: Chem., 2008, 294, 93-101. 41. J. M. Ruiz, M. H. McAdon and J. M. Garcés, J. Phys. Chem. B, 1997, 101, 1733-1744. 42. J. To, A. A. Sokol, S. A. French, C. R. A. Catlow, P. Sherwood and H. J. J. van Dam,
Angew. Chem. Int. Ed., 2006, 45, 1633 –1638. 43. S. Malola, S. Svelle, F. L. Bleken and O. Swang, Angew. Chem., Int. Ed, 2011, 51,
652-655. 44. T. Fjermestad, S. Svelle and O. Swang, J. Phys. Chem. C, 2013, 117, 13442-13451. 45. P. Bodart, J. B. Nagy, G. Debras, Z. Gabelica and P. a. Jacobs, J. Phys. Chem., 1986,
90, 5183-5190. 46. P. C. Van Geem, K. F. M. G. J. Scholle, G. P. M. Van der Velden and W. S. Veeman,
The Journal of Physical Chemistry, 1988, 92, 1585-1589. 47. S. Bordiga, L. Regli, D. Cocina, C. Lamberti, M. Bjørgen and K. P. Lillerud, The
Journal of Physical Chemistry B, 2005, 109, 2779-2784. 48. G. Kresse and J. Hafner, Phys Rev B, 1993, 47, 558-561. 49. T. Kerber, M. Sierka and J. Sauer, J. Comput. Chem., 2008, 29, 2088-2097. 50. J. P. Perdew, K. Burke and M. Ernzerhof, Phys. Rev. Lett., 1996, 77, 3865-3868. 51. G. Henkelman and H. Jonsson, J. Chem. Phys., 2000, 113, 9978-9985. 52. C. Tuma and J. Sauer, Chem. Phys. Lett., 2004, 387, 388-394. 53. C. Tuma and J. Sauer, Phys. Chem. Chem. Phys., 2006, 8, 3955-3965. 54. C. Chizallet and P. Raybaud, Angew. Chem., Int. Ed, 2009, 48, 2891-2893. 55. S. Bordiga, P. Ugliengo, A. Damin, C. Lamberti, G. Spoto, A. Zecchina, G. Spanò, R.
Buzzoni, L. Dalloro and F. Rivetti, Top. Catal., 2001, 15, 43-52. 56. J. N. Bronsted, Chem. Rev., 1928, 5, 231-338. 57. M. G. Evans and M. Polanyi, Transactions of the Faraday Society, 1938, 34, 11-24. 58. V. c. A. Ranea, I. Carmichael and W. F. Schneider, J. Phys. Chem. C, 2009, 113,
2149-2158.
93
CHAPTER IV:
Dealumination pathways of zeolites :
mechanisms, EFAL confinement
and predictive trends
94
Preliminary note: This chapter is adapted from the following article in preparation: “Dealumination pathways of zeolites : mechanisms, EFAL confinement and predictive trends”, by M-C. Silaghi, C. Chizallet, P. Raybaud,. Selected supporting information sections are reported in Appendix.
1. Introduction
Zeolites, crystalline alumino-silicate microporous materials possess interesting intrinsic and post-synthetic features, such as a strong acidity, resulting from Lewis- (LAS) and Brønsted-acid sites (BAS), being aluminium and hydrogen respectively. Additionally their thermal robustness and well manageable pore sizes makes them suitable candidates for industrial reactions such as fluid catalytic cracking (mainly Faujasite Y), hydrocracking, isomerisation and alkylation of various hydrocarbon molecules1. However, the major topic in zeolite synthesis lies within the tailoring of the shape size and the connectivity of intra-framework channels since confinement effects2 and diffusion limitations can impose severe constraints on the reactants, intermediates and products. One possible way for introducing mesopores, where a partial hydrolysis of the zeolitic framework occurs, i.e. Al-O and Si-O bond breaks, is carried out in steaming conditions. The removal of a to a certain extend hydroxylated Al or Si species leaves a moiety called silanol nest behind. Here, four hydroxyl groups surround the tetrahedral void3, 4. Additionally, the hydroxylated species, i.e. extraframework aluminium (EFAL) and extraframework silicon (EFSI), located within the cavities, are generated and studied extensively in literature 5-10.
Experimental findings from Karwacki et al by dint of focused ion beam (FIB) and scanning electron microscopy (SEM) could reveal an architecture-dependent mesopore distribution in steamed ZSM-511
. They were able to show that upon steaming treatment sinusoidal channels are more susceptible to the dealumination and hence mesopore formation compared to straight channels. On a steamed NH4-Y and descending from the meso to the atomic scale, Agostini et al. were able to show that contrary to the general opinion the dealumination not a high-temperature process but takes already place at moderate temperatures (450 – 500 K) and also the appearance of 30-35% of the total Al within the sodalite cage12. Analyses on steam treated H-Mordenite could reveal that Al is randomly distributed over 4 and 5 membered rings (MR) and that a favored dealumination of T3 and T4, located in the 4MR13, 14 takes place.
Considering the above mentioned experimental findings, one still misses experimental data, in particular through in situ approaches, to reveal the atomic structure rearrangement occurring during the dealumination/desilication processes15. In order to face this problem and thus being able to give an atomistic insight on the mechanism, some early theoretical calculations have been used to describe both, the structure and catalytic properties of zeolites in presence of EFAL species. Ruiz and co-workers for instance examined the transformation of tetrahedral to octahedral aluminium complexes by dint of cluster calculations and with the level of theory being Hartree-Fock and second order Moller-Plesset perturbation theory calculations10. Their results show that neutral complexes prefer a tetra- or penta-coordination and that the stability of the Al clusters depend on the complex's net charge without requiring high energies for their transformation. In order to analyse the structure and coordination of some EFAL species (e.g. Al3+, Al(OH)2
+, Al(OH)3 Bhering et al. used cluster DFT calculations on zeolite Faujasite 6 and showed that monovalent cations prefer a bi-coordination whereas di- and tri-valent cations are tetrahedrally coordinated with framework oxygen atoms near the framework aluminium. By analyzing the dynamical behaviour of the EFAL species (Al(OH)3(H2O)3 and Al(OH)3(H2O)) in Gmelinite, Benco et al. revealed a
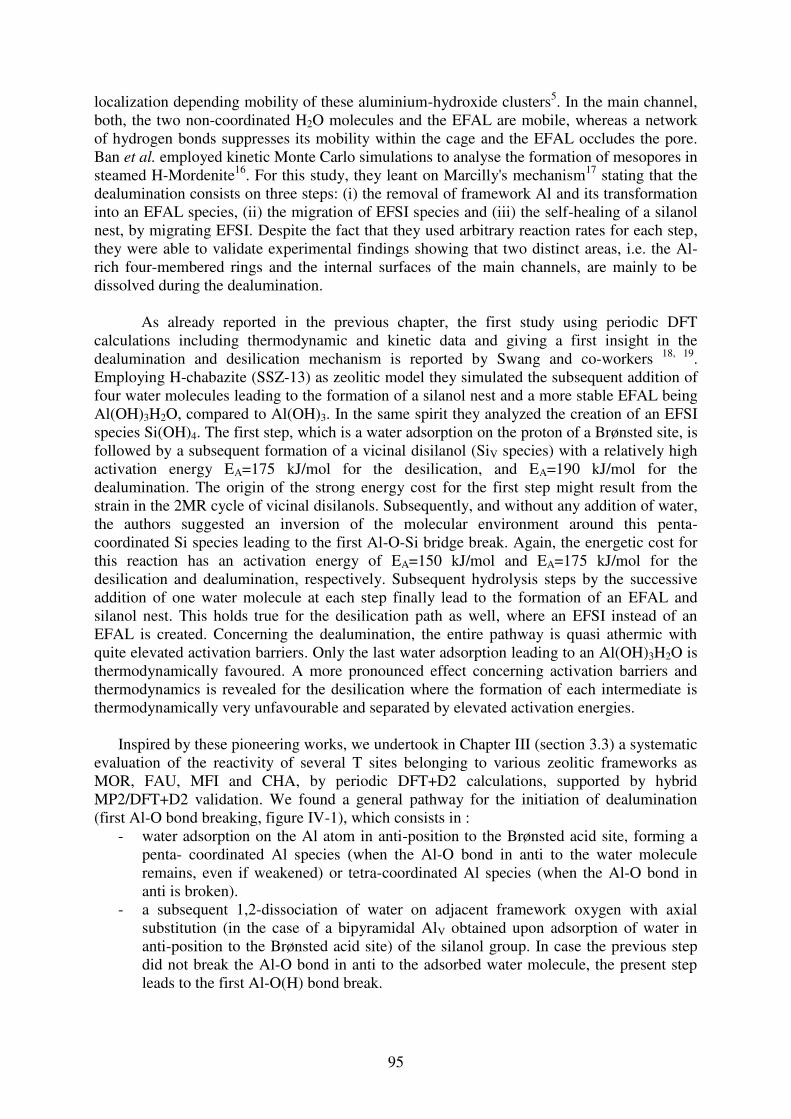
95
localization depending mobility of these aluminium-hydroxide clusters5. In the main channel, both, the two non-coordinated H2O molecules and the EFAL are mobile, whereas a network of hydrogen bonds suppresses its mobility within the cage and the EFAL occludes the pore. Ban et al. employed kinetic Monte Carlo simulations to analyse the formation of mesopores in steamed H-Mordenite16. For this study, they leant on Marcilly's mechanism17 stating that the dealumination consists on three steps: (i) the removal of framework Al and its transformation into an EFAL species, (ii) the migration of EFSI species and (iii) the self-healing of a silanol nest, by migrating EFSI. Despite the fact that they used arbitrary reaction rates for each step, they were able to validate experimental findings showing that two distinct areas, i.e. the Al-rich four-membered rings and the internal surfaces of the main channels, are mainly to be dissolved during the dealumination.
As already reported in the previous chapter, the first study using periodic DFT
calculations including thermodynamic and kinetic data and giving a first insight in the dealumination and desilication mechanism is reported by Swang and co-workers 18, 19. Employing H-chabazite (SSZ-13) as zeolitic model they simulated the subsequent addition of four water molecules leading to the formation of a silanol nest and a more stable EFAL being Al(OH)3H2O, compared to Al(OH)3. In the same spirit they analyzed the creation of an EFSI species Si(OH)4. The first step, which is a water adsorption on the proton of a Brønsted site, is followed by a subsequent formation of a vicinal disilanol (SiV species) with a relatively high activation energy EA=175 kJ/mol for the desilication, and EA=190 kJ/mol for the dealumination. The origin of the strong energy cost for the first step might result from the strain in the 2MR cycle of vicinal disilanols. Subsequently, and without any addition of water, the authors suggested an inversion of the molecular environment around this penta-coordinated Si species leading to the first Al-O-Si bridge break. Again, the energetic cost for this reaction has an activation energy of EA=150 kJ/mol and EA=175 kJ/mol for the desilication and dealumination, respectively. Subsequent hydrolysis steps by the successive addition of one water molecule at each step finally lead to the formation of an EFAL and silanol nest. This holds true for the desilication path as well, where an EFSI instead of an EFAL is created. Concerning the dealumination, the entire pathway is quasi athermic with quite elevated activation barriers. Only the last water adsorption leading to an Al(OH)3H2O is thermodynamically favoured. A more pronounced effect concerning activation barriers and thermodynamics is revealed for the desilication where the formation of each intermediate is thermodynamically very unfavourable and separated by elevated activation energies.
Inspired by these pioneering works, we undertook in Chapter III (section 3.3) a systematic
evaluation of the reactivity of several T sites belonging to various zeolitic frameworks as MOR, FAU, MFI and CHA, by periodic DFT+D2 calculations, supported by hybrid MP2/DFT+D2 validation. We found a general pathway for the initiation of dealumination (first Al-O bond breaking, figure IV-1), which consists in :
- water adsorption on the Al atom in anti-position to the Brønsted acid site, forming a penta- coordinated Al species (when the Al-O bond in anti to the water molecule remains, even if weakened) or tetra-coordinated Al species (when the Al-O bond in anti is broken).
- a subsequent 1,2-dissociation of water on adjacent framework oxygen with axial substitution (in the case of a bipyramidal AlV obtained upon adsorption of water in anti-position to the Brønsted acid site) of the silanol group. In case the previous step did not break the Al-O bond in anti to the adsorbed water molecule, the present step leads to the first Al-O(H) bond break.
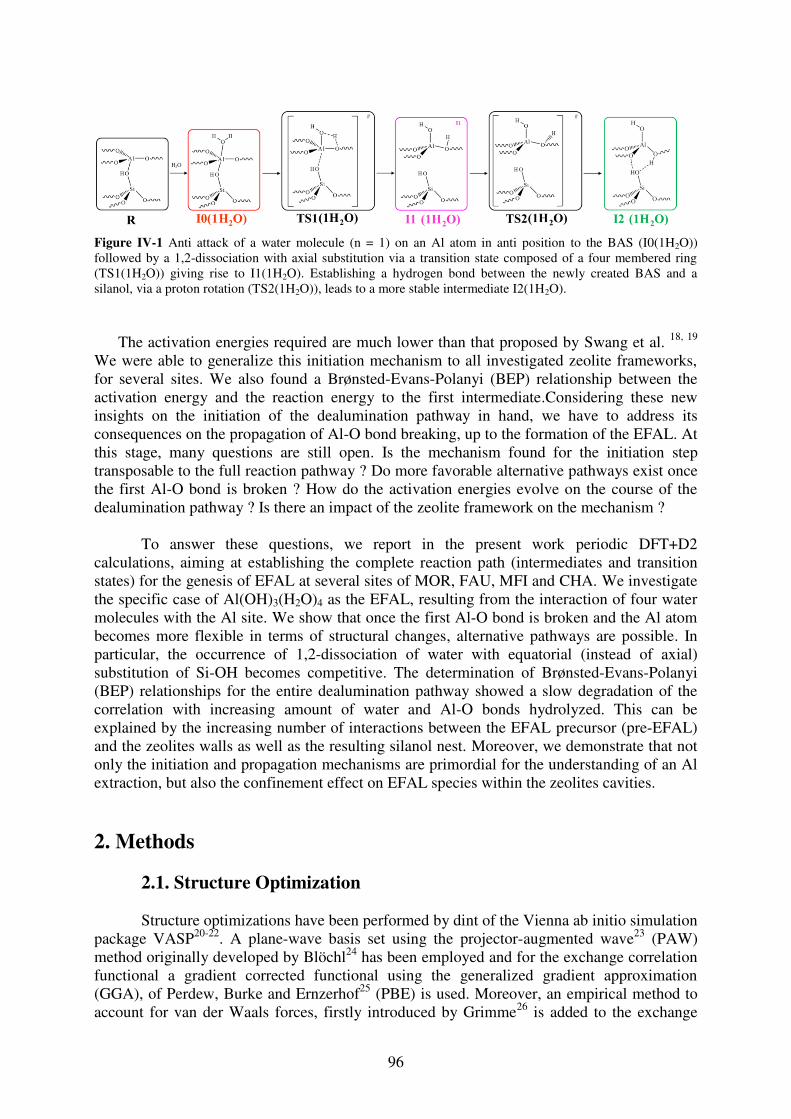
96
Figure IV-1 Anti attack of a water molecule (n = 1) on an Al atom in anti position to the BAS (I0(1H2O)) followed by a 1,2-dissociation with axial substitution via a transition state composed of a four membered ring (TS1(1H2O)) giving rise to I1(1H2O). Establishing a hydrogen bond between the newly created BAS and a silanol, via a proton rotation (TS2(1H2O)), leads to a more stable intermediate I2(1H2O).
The activation energies required are much lower than that proposed by Swang et al. 18, 19
We were able to generalize this initiation mechanism to all investigated zeolite frameworks, for several sites. We also found a Brønsted-Evans-Polanyi (BEP) relationship between the activation energy and the reaction energy to the first intermediate.Considering these new insights on the initiation of the dealumination pathway in hand, we have to address its consequences on the propagation of Al-O bond breaking, up to the formation of the EFAL. At this stage, many questions are still open. Is the mechanism found for the initiation step transposable to the full reaction pathway ? Do more favorable alternative pathways exist once the first Al-O bond is broken ? How do the activation energies evolve on the course of the dealumination pathway ? Is there an impact of the zeolite framework on the mechanism ?
To answer these questions, we report in the present work periodic DFT+D2
calculations, aiming at establishing the complete reaction path (intermediates and transition states) for the genesis of EFAL at several sites of MOR, FAU, MFI and CHA. We investigate the specific case of Al(OH)3(H2O)4 as the EFAL, resulting from the interaction of four water molecules with the Al site. We show that once the first Al-O bond is broken and the Al atom becomes more flexible in terms of structural changes, alternative pathways are possible. In particular, the occurrence of 1,2-dissociation of water with equatorial (instead of axial) substitution of Si-OH becomes competitive. The determination of Brønsted-Evans-Polanyi (BEP) relationships for the entire dealumination pathway showed a slow degradation of the correlation with increasing amount of water and Al-O bonds hydrolyzed. This can be explained by the increasing number of interactions between the EFAL precursor (pre-EFAL) and the zeolites walls as well as the resulting silanol nest. Moreover, we demonstrate that not only the initiation and propagation mechanisms are primordial for the understanding of an Al extraction, but also the confinement effect on EFAL species within the zeolites cavities.
2. Methods 2.1. Structure Optimization
Structure optimizations have been performed by dint of the Vienna ab initio simulation package VASP20-22. A plane-wave basis set using the projector-augmented wave23 (PAW) method originally developed by Blöchl24 has been employed and for the exchange correlation functional a gradient corrected functional using the generalized gradient approximation (GGA), of Perdew, Burke and Ernzerhof25 (PBE) is used. Moreover, an empirical method to account for van der Waals forces, firstly introduced by Grimme26 is added to the exchange
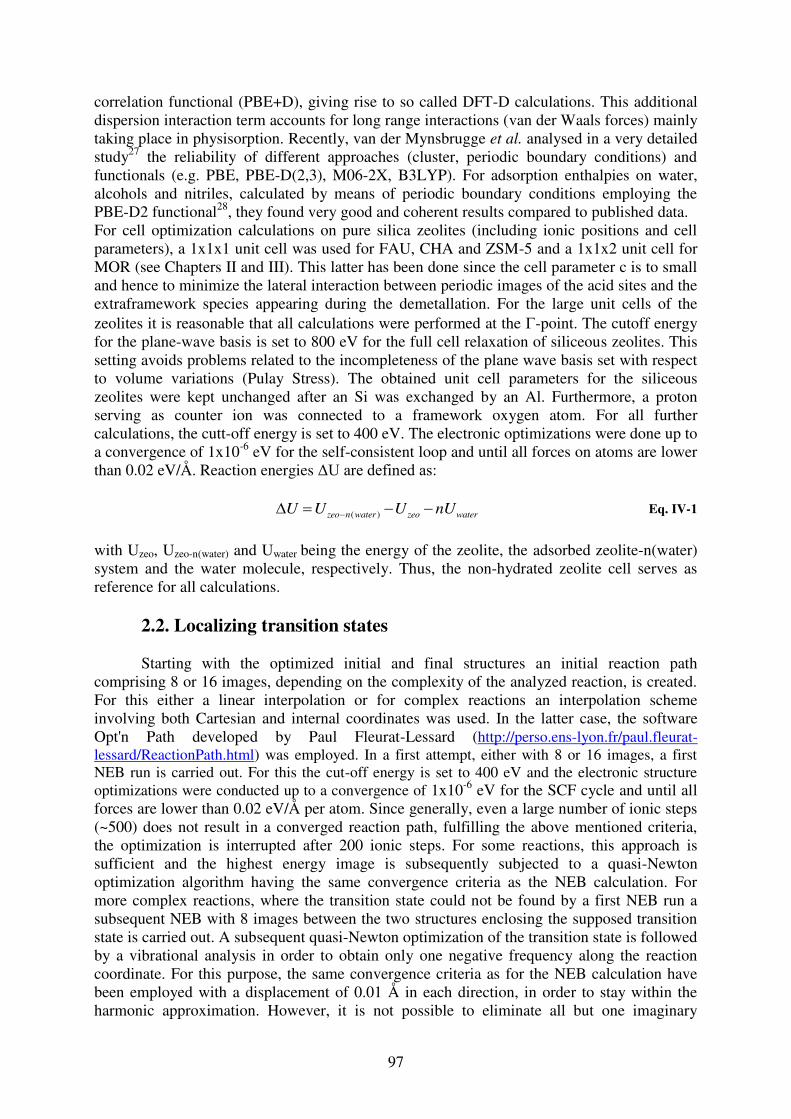
97
correlation functional (PBE+D), giving rise to so called DFT-D calculations. This additional dispersion interaction term accounts for long range interactions (van der Waals forces) mainly taking place in physisorption. Recently, van der Mynsbrugge et al. analysed in a very detailed study27 the reliability of different approaches (cluster, periodic boundary conditions) and functionals (e.g. PBE, PBE-D(2,3), M06-2X, B3LYP). For adsorption enthalpies on water, alcohols and nitriles, calculated by means of periodic boundary conditions employing the PBE-D2 functional28, they found very good and coherent results compared to published data. For cell optimization calculations on pure silica zeolites (including ionic positions and cell parameters), a 1x1x1 unit cell was used for FAU, CHA and ZSM-5 and a 1x1x2 unit cell for MOR (see Chapters II and III). This latter has been done since the cell parameter c is to small and hence to minimize the lateral interaction between periodic images of the acid sites and the extraframework species appearing during the demetallation. For the large unit cells of the zeolites it is reasonable that all calculations were performed at the -point. The cutoff energy for the plane-wave basis is set to 800 eV for the full cell relaxation of siliceous zeolites. This setting avoids problems related to the incompleteness of the plane wave basis set with respect to volume variations (Pulay Stress). The obtained unit cell parameters for the siliceous zeolites were kept unchanged after an Si was exchanged by an Al. Furthermore, a proton serving as counter ion was connected to a framework oxygen atom. For all further calculations, the cutt-off energy is set to 400 eV. The electronic optimizations were done up to a convergence of 1x10⁻⁶ eV for the self-consistent loop and until all forces on atoms are lower than 0.02 eV/Å. Reaction energies ΔU are defined as:
( )zeo n water zeo waterU U U nU Eq. IV-1
with Uzeo, Uzeo-n(water) and Uwater being the energy of the zeolite, the adsorbed zeolite-n(water) system and the water molecule, respectively. Thus, the non-hydrated zeolite cell serves as reference for all calculations.
2.2. Localizing transition states
Starting with the optimized initial and final structures an initial reaction path comprising 8 or 16 images, depending on the complexity of the analyzed reaction, is created. For this either a linear interpolation or for complex reactions an interpolation scheme involving both Cartesian and internal coordinates was used. In the latter case, the software Opt'n Path developed by Paul Fleurat-Lessard (http://perso.ens-lyon.fr/paul.fleurat-lessard/ReactionPath.html) was employed. In a first attempt, either with 8 or 16 images, a first NEB run is carried out. For this the cut-off energy is set to 400 eV and the electronic structure optimizations were conducted up to a convergence of 1x10⁻⁶ eV for the SCF cycle and until all forces are lower than 0.02 eV/Å per atom. Since generally, even a large number of ionic steps (~500) does not result in a converged reaction path, fulfilling the above mentioned criteria, the optimization is interrupted after 200 ionic steps. For some reactions, this approach is sufficient and the highest energy image is subsequently subjected to a quasi-Newton optimization algorithm having the same convergence criteria as the NEB calculation. For more complex reactions, where the transition state could not be found by a first NEB run a subsequent NEB with 8 images between the two structures enclosing the supposed transition state is carried out. A subsequent quasi-Newton optimization of the transition state is followed by a vibrational analysis in order to obtain only one negative frequency along the reaction coordinate. For this purpose, the same convergence criteria as for the NEB calculation have been employed with a displacement of 0.01 Å in each direction, in order to stay within the harmonic approximation. However, it is not possible to eliminate all but one imaginary
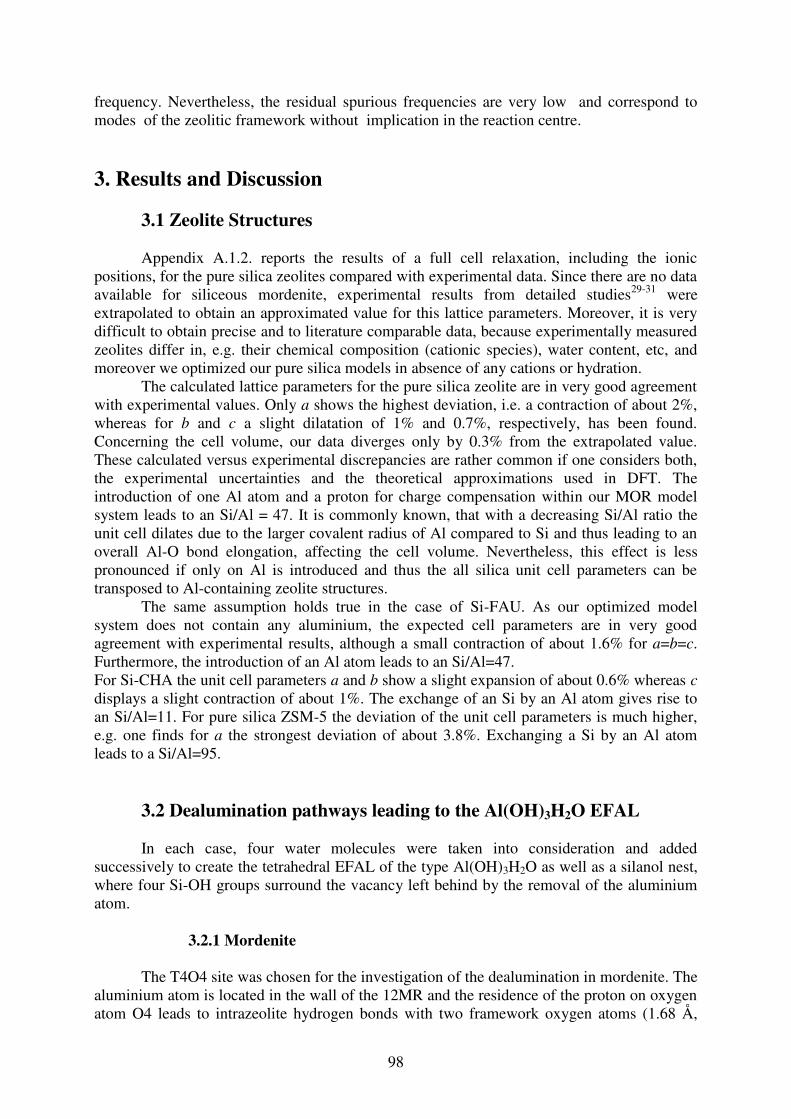
98
frequency. Nevertheless, the residual spurious frequencies are very low and correspond to modes of the zeolitic framework without implication in the reaction centre.
3. Results and Discussion
3.1 Zeolite Structures
Appendix A.1.2. reports the results of a full cell relaxation, including the ionic positions, for the pure silica zeolites compared with experimental data. Since there are no data available for siliceous mordenite, experimental results from detailed studies29-31 were extrapolated to obtain an approximated value for this lattice parameters. Moreover, it is very difficult to obtain precise and to literature comparable data, because experimentally measured zeolites differ in, e.g. their chemical composition (cationic species), water content, etc, and moreover we optimized our pure silica models in absence of any cations or hydration.
The calculated lattice parameters for the pure silica zeolite are in very good agreement with experimental values. Only a shows the highest deviation, i.e. a contraction of about 2%, whereas for b and c a slight dilatation of 1% and 0.7%, respectively, has been found. Concerning the cell volume, our data diverges only by 0.3% from the extrapolated value. These calculated versus experimental discrepancies are rather common if one considers both, the experimental uncertainties and the theoretical approximations used in DFT. The introduction of one Al atom and a proton for charge compensation within our MOR model system leads to an Si/Al = 47. It is commonly known, that with a decreasing Si/Al ratio the unit cell dilates due to the larger covalent radius of Al compared to Si and thus leading to an overall Al-O bond elongation, affecting the cell volume. Nevertheless, this effect is less pronounced if only on Al is introduced and thus the all silica unit cell parameters can be transposed to Al-containing zeolite structures.
The same assumption holds true in the case of Si-FAU. As our optimized model system does not contain any aluminium, the expected cell parameters are in very good agreement with experimental results, although a small contraction of about 1.6% for a=b=c. Furthermore, the introduction of an Al atom leads to an Si/Al=47. For Si-CHA the unit cell parameters a and b show a slight expansion of about 0.6% whereas c displays a slight contraction of about 1%. The exchange of an Si by an Al atom gives rise to an Si/Al=11. For pure silica ZSM-5 the deviation of the unit cell parameters is much higher, e.g. one finds for a the strongest deviation of about 3.8%. Exchanging a Si by an Al atom leads to a Si/Al=95.
3.2 Dealumination pathways leading to the Al(OH)3H2O EFAL
In each case, four water molecules were taken into consideration and added successively to create the tetrahedral EFAL of the type Al(OH)3H2O as well as a silanol nest, where four Si-OH groups surround the vacancy left behind by the removal of the aluminium atom.
3.2.1 Mordenite
The T4O4 site was chosen for the investigation of the dealumination in mordenite. The
aluminium atom is located in the wall of the 12MR and the residence of the proton on oxygen atom O4 leads to intrazeolite hydrogen bonds with two framework oxygen atoms (1.68 Å,
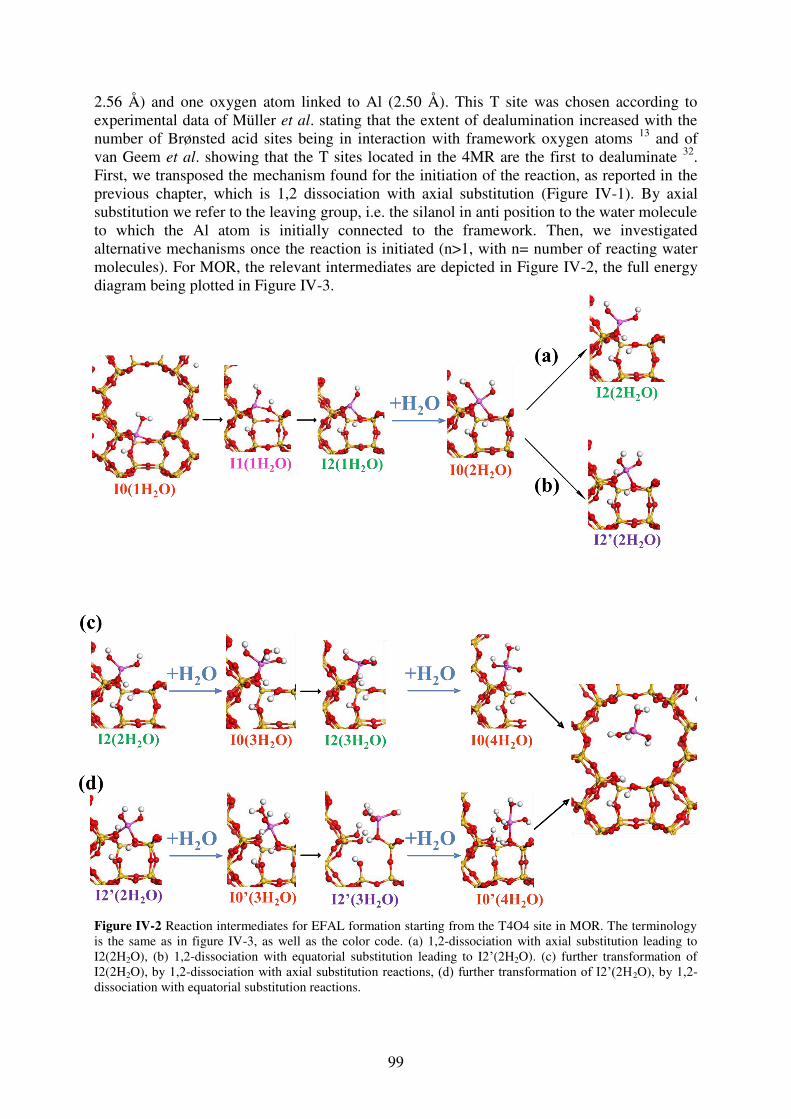
99
2.56 Å) and one oxygen atom linked to Al (2.50 Å). This T site was chosen according to experimental data of Müller et al. stating that the extent of dealumination increased with the number of Brønsted acid sites being in interaction with framework oxygen atoms 13 and of van Geem et al. showing that the T sites located in the 4MR are the first to dealuminate 32. First, we transposed the mechanism found for the initiation of the reaction, as reported in the previous chapter, which is 1,2 dissociation with axial substitution (Figure IV-1). By axial substitution we refer to the leaving group, i.e. the silanol in anti position to the water molecule to which the Al atom is initially connected to the framework. Then, we investigated alternative mechanisms once the reaction is initiated (n>1, with n= number of reacting water molecules). For MOR, the relevant intermediates are depicted in Figure IV-2, the full energy diagram being plotted in Figure IV-3.
Figure IV-2 Reaction intermediates for EFAL formation starting from the T4O4 site in MOR. The terminology is the same as in figure IV-3, as well as the color code. (a) 1,2-dissociation with axial substitution leading to I2(2H2O), (b) 1,2-dissociation with equatorial substitution leading to I2’(2H2O). (c) further transformation of I2(2H2O), by 1,2-dissociation with axial substitution reactions, (d) further transformation of I2’(2H2O), by 1,2-dissociation with equatorial substitution reactions.
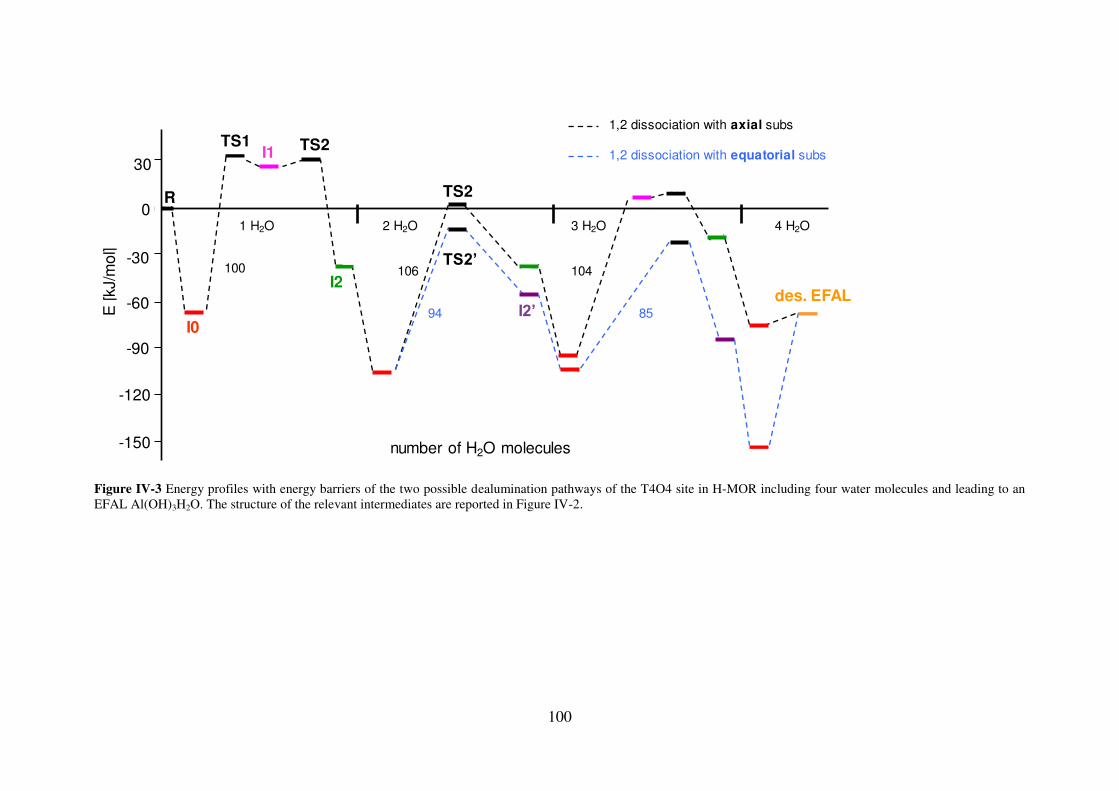
100
Figure IV-3 Energy profiles with energy barriers of the two possible dealumination pathways of the T4O4 site in H-MOR including four water molecules and leading to an EFAL Al(OH)3H2O. The structure of the relevant intermediates are reported in Figure IV-2.
E [k
J/m
ol]
number of H2O molecules
I0
I1 TS2
I2
1 H2O
30
0
-30
-60
-90
-120
TS2
TS2’
I2’
-150
2 H2O 3 H2O 4 H2O
100
94 85
R
TS11,2 dissociation with axial subs
1,2 dissociation with equatorial subs
106 104
des. EFAL
101
3.2.1.1 Pathway where 1,2 dissociation with axial substitution occurs at each step
Since the importance of the first water attack on the aluminium atom has been
described in detail in the previous chapter, we will only recall the underlying mechanism (figure IV-1) and focus more on the evaluation of complete reaction path (Figure IV-3) leading to the extraction of an Al atom from the zeolitic framework to an extraframework position. 1H2O
Water adsorption on aluminium (ΔU = - 67 kJ/mol) takes place from the 12MR and in anti position to the Brønsted acid site where the initial tetrahedral Al atom exhibits a pentahedral coordination. Upon adsorption the Al-O(H) bond increases from 1.90 Å to 2.12 Å and the oxygen-aluminium bond between the water molecule and the framework aluminium is of 2.14 Å. Experimental analyses based on 27Al MAS NMR suppose that penta-coordinated (trigonal bipyramidal) or tetra-coordinated (distorted tetrahedral) Al species are at the initiation of the aluminium dislodgement from the zeolitic framework12, 33. Subsequently the water molecule is split on an adjacent framework oxygen atom via a 1,2-dissociation with axial substitution. Surpassing a transition state (TS1(1H2O)) composed of a four membered ring (Ea = 100 kJ/mol) leads to the intermediate I1(1H2O) (ΔU = 26 kJ/mol). A proton rotation of the newly created BAS (Ea = 4 kJ/mol) gives rise to a more stable intermediate I2(1H2O) (ΔU = -38 kJ/mol) due to the presence of a hydrogen bond between the proton and the oxygen atom of the silanol group. The first Al-O bond is broken and the distance between the tetrahedrally coordinated pre-EFAL and the oxygen atom of the former BAS has increased to 3.34 Å. Moreover, the partially dislodged pre-EFAL points towards the 12MR of mordenite's main channels. Note, that with increasing amount of water, the pre-EFAL becomes more flexible due to the decreasing number of Al-O bonds binding it to the framework.
In the present section, subsequent Al-O hydrolyses are following the same pattern, i.e. water adsorption on Al in anti position to the BAS followed by a 1,2- dissociation of the water molecule with axial substitution and a rotation of the proton in order to establish a hydrogen bond with an oxygen atom of a silanol.
2H2O
Adsorption of the second water molecule on aluminium (ΔU = - 106 kJ/mol) leads to a penta-coordinated Al with an increase of the second Al-O(H) bond (to be broken) from 1.87 Å to 1.98 Å and an oxygen-aluminium bond between the water molecule and the framework aluminium of 2.13 Å. For the second Al-O hydrolysis, the analogous I1(2H2O) intermediate has not been identified while the TS2(2H2O) transition state was found: the latter TS involves the Al-O bond breaking and the proton rotation. The corresponding reaction barrier for this Al-O bond break is as high as 106 kJ/mol, thus a value slightly higher than the one of first step, and resulting in I2’(2H2O) (ΔU = -37 kJ/mol, very close to I2(1H2O)) with an Al-O bond length of 2.89 Å between the Al atom and the oxygen atom of the silanol. 3H2O
A third water molecule is needed in order to enable the last Al-O hydrolysis giving rise to the simplest hydroxylated EFAL specieswhich is an Al(OH)3 species linked to the framework by one Si-O bond. Upon water adsorption on aluminium (ΔU = - 95 kJ/mol) the Al-O(H) bond increases from 1.93 Å to 2.04 Å and leads to a trigonal bipyramidal configuration of the pre-EFAL with an Al-O bond of 2.12 Å between the oxygen atom of the

102
water molecule and the Al atom. A subsequent1,2-dissociation of the water molecule results in the intermediate I1(3H2O) (ΔU = 7 kJ/mol). Note, that no TS1(3H2O) distinct from I1(3H2O) could have been identified but only TS2(3H2O) leading to I2(3H2O) (ΔU = - 20 kJ/mol). The effective energy cost required to form I1(3H2O) is Ea = 104 kJ/mol (very close to the previous reaction barriers). The last Al-O bond is broken (3.49 Å) resulting in a trigonally planar Al(OH)3 EFAL and a silanol nest composed of 4 silanol groups establishing hydrogen bonds with each other and the framework. Note, that the EFAL is still connected to one oxygen atom (Al-Osilanol = 1.97 Å) of the silanol nest. 4H2O
Although only three water molecules are needed to displace the framework Al to a non-framework position a fourth molecule is adsorbed on Al in anti position to the BAS (ΔU = - 76 kJ/mol) leading to a trigonal bipyramidal Al(OH)3H2O, I0(3H2O) intermediate, where the EFAL is still in interaction with the framework with apical Al-Oframework and Al-Owater bond lengths of 2.13 Å and 2.13 Å, respectively. In a last step, the EFAL is desorbed (with Si-O bond breaking) giving rise to a tetrahedrally coordinated Al atom residing in the 12MR (ΔU = - 68 kJ/mol) with three Al-OH bonds of length 1.74 Å, 1.73 Å, 1.74 Å and one Al-Owater bond of 1.96 Å. For evaluating the energy cost for this last step, the position of the desorbed EFAL was constrained at the center of the 12MR channel such as interactions with the zeolitic framework are avoided. The corresponding energy cost is very modest. Note that the EFAL stability has also been envisaged in further analyses in view of a the study of confinement effect on EFAL species (see later section 3.4.).
From this analysis led on the T4O4 site of mordenite, it can be concluded that the transposition of the mechanism found as most favorable for the first Al-O bond breaking, (i.e. water molecule adsorption on Al in anti to the BAS, followed by 1,2 dissociation with axial substitution), leads to the formation of the EFAL species without significant change of activation barriers (100-106 kJ/mol) along the first 3 hydrolysis steps being thus kinetically limitating. The fourth hydrolysis step is far less energetically demanding than the others.
However, in the course of our transition state sampling, we found that an alternative pathway could be possible for n > 1, which is presented in the following paragraph.
3.2.1.2 Alternative pathway for n(H2O) > 1 :1,2 dissociation with equatorial substitution
The reaction pathway in the preceding section, i.e. water adsorption on Al in anti
position to the BAS followed by a 1,2 dissociation with axial substitution, demonstrated the feasibility and transferability of the mechanistic approach for the first Al-O bond break to subsequent Al-O hydrolysis reactions until the dislodgement of an Al from a framework to a non-framework position. However, for water amounts greater than 1 and thus once the first Al-O bond is hydrolysed an alternative reaction path is possible.
The first step for the underlying mechanism for n(H2O) > 1 is still a water adsorption on Al in anti position to the BAS. However, it is now followed by a 1,2 dissociation on an adjacent framework oxygen atom with equatorial substitution as shown in Figure IV-4. By equatorial, we refer to the bond which is broken in TS2’, starting from the bipyrimidal AlV in I0(nH2O). Note the hydrogen bond between the proton of the silanol and the oxygen atom of the partially dislodged aluminium hydroxide.
It has to be stressed out that this mechanism is not applicable to the initiation of the first Al-O bond break due to the rigidity of the aluminium atom. Since it is connected through four Al-O bonds to the framework an equatorial displacement of Al, due to adjacent structural

103
constraints, e.g. O-Si-O bond angles, is not possible and hence only an axial substitution for the first Al-O hydrolysis can be envisaged .
Figure IV-4 Anti attack of a water molecule (for n > 1) on an Al atom in anti position to the BAS (I0(nH2O)) followed by: (a) a 1,2-dissociation with axial substitution via a transition state composed of a four membered ring (TS1(nH2O)) leading to I1(2H2O), (b) a 1,2-dissociation with equatorial substitution via a transition state composed of a four membered ring (TS2'(2H2O)) leading to I'2(2H2O). The difference between the (a) and (b) routes is the nature of the Al-O bond broken, depicted in light blue in the transition states. 2H2O
The aluminium-water complex I0(2H2O) serving as starting point for the second Al-O hydrolysis is the same as for the 1,2 dissociation with axial substitution (adsorption of the water molecule in anti to the newly formed BAS). A subsequent water splitting on an adjacent framework oxygen atom with equatorial substitution via TS2'(2H2O) (Ea = 94 kJ/mol) leads to I2'(2H2O) with ΔU = -56 kJ/mol. At the same time, the involved Al-O bond increased from 1.77 Å to 3.26 Å depicting the second hydrolysis between the pre-EFAL and the framework. Comparing I2(2H2O) with I2'(2H2O), the latter product is about 20 kJ/mol more stable due to a hydrogen bond with a more polarized oxygen atom of the hydroxyl group of the pre-EFAL compared to the oxygen atom of the silanol group. Note that the activation energy for TS2 and TS2’ follows a similar shift by 22 kJ/mol, suggesting that a Brønsted-Evans-Polanyi (BEP) relationship may exist. 3H2O
Water adsorption on Al (ΔU = -109 kJ/mol) increases the Al-O(H) bond from 1.87 Å to 1.981 Å resulting in a trigonal bipyramidal aluminium complex with a second apical Al-Owater distances of 2.13 Å. By a subsequent water splitting on the last adjacent framework oxygen atom holding the pre-EFAL connected to the framework (Ea = 85 kJ/mol for TS2’(3H2O)) the Al atom is dislodged from a framework to a non-framework position in I2’(3H2O) (ΔU = -86 kJ/mol). Here again, the kinetics of this mechanism with respect to the
104
previous one seem to be driven by the thermodynamic as expected from BEP concept. However, as in the preceding mechanistic approach the Al(OH)3 species does not desorb once it is extracted from the zeolitic framework but remains chemisorbed on a silanol (Al-Osilanol = 1.93 Å). At this point two observations can be made namely (i) the reaction barriers for the 1,2 dissociation with equatorial substitution compared to a 1,2 dissociation with axial substitution decrease with increasing amount of water and (ii) a stronger stabilization of I2'(nH2O) compared to I2(nH2O). Both thermodynamic and kinetic effects are thus connected by BEP relationhip and are related to supplementary hydrogen bonds between the proton of a silanol and the oxygen atom of an hydroxyl group of the (pre-)EFAL, which are absent during the 1,2-dissociation with axial substitution. 4H2O
Due to the interaction of the EFAL species Al(OH)3 with an oxygen atom of a silanol the adsorption of a fourth water molecule (ΔU = - 154 kJ/mol) leads to a penta-coordinated hydroxy-aluminate with apical Al-Oframework and Al-Owater bond lengths of 2.06 Å and 2.13 Å, respectively. Desorption of Al(OH)3H2O leads to the same finale state as for the 1,2-dissociation with axial substitution. However, due to the significantly stronger stabilization of I0’(4H2O) induced by supplementary hydrogen bonds and stronger Al-Oframework bond, this last step is more energetically demanding than for the previous mechanism.
In the framework of this alternative pathway, barriers are lower for n > 1 than in the previous one except for the very last desorption step, and the first step remains the rate limiting step of the overall EFAL formation. At this stage, it remains difficult to conclude which one of the two mechanisms is preferentially followed in MOR. The additional energy barrier for the desorption step compensates the more favorable kinetic and thermodynamic parameters of the previous steps. As a perspective of this work, one can suggest that to undertake a full kinetic simulation of the process in order to conclude.
Because a detailed description for the 1,2 dissociation with axial or equatorial substitution was conducted in mordenite and the underlying mechanism is transposable to the other T sites of other zeolites included in our study, we will detail in the following the most favorable pathway allowing a combination of both mechanisms in the course of dealumination.
3.2.2 Chabazite
Since the chabazite structure contains only one inequivalent tetrahedral site, only four different asymmetric oxygen atoms exist giving four possible Brønsted acid site configurations. For our mechanistic investigation we chose the T1O3 site, where the proton resides on an oxygen atom being a member of two four-membered and one six-membered ring. Contrary to the other three proton positions that are all part of the 8MR window, the proton at O3 can interact via intrazeolite hydrogen bonds (2.22 Å, 2.62 Å, 3.19 Å) with oxygen atoms of a six-membered ring. This was chosen in accordance with experimental findings on other zeolites (MFI, Beta, Mordenite) and by dint of 1H-NMR spectra proposing that the extent of dealumination increased with the number of Brønsted acid sites being in interaction with framework oxygen atoms 13. Figure IV-5 reports the energy diagram discussed in the following.
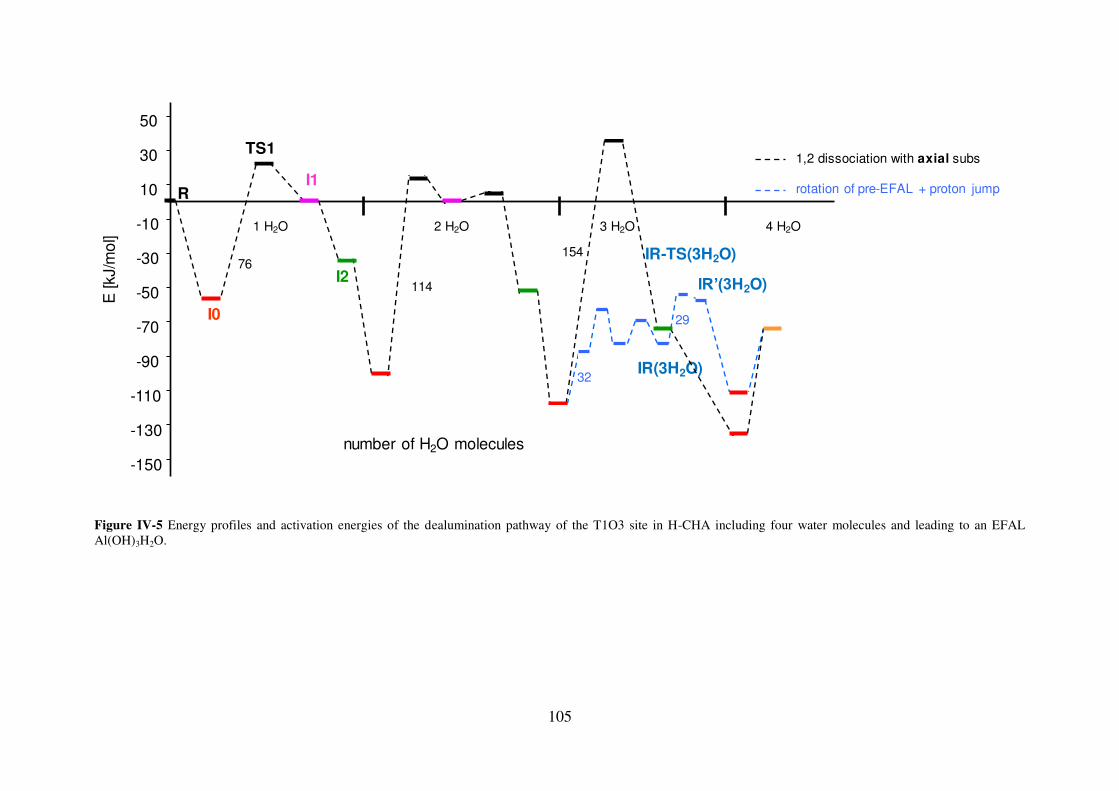
105
Figure IV-5 Energy profiles and activation energies of the dealumination pathway of the T1O3 site in H-CHA including four water molecules and leading to an EFAL Al(OH)3H2O.
IR(3H2O)
-150
-130
-110
-90
-70
-50
-30
-10
10
30
50E
[kJ/
mol
]
number of H2O molecules
RI1
1 H2O 2 H2O 3 H2O 4 H2O
I2
I0
76
114
154
1,2 dissociation with axial subs
rotation of pre-EFAL + proton jump
TS1
32
29
IR-TS(3H2O)
IR’(3H2O)
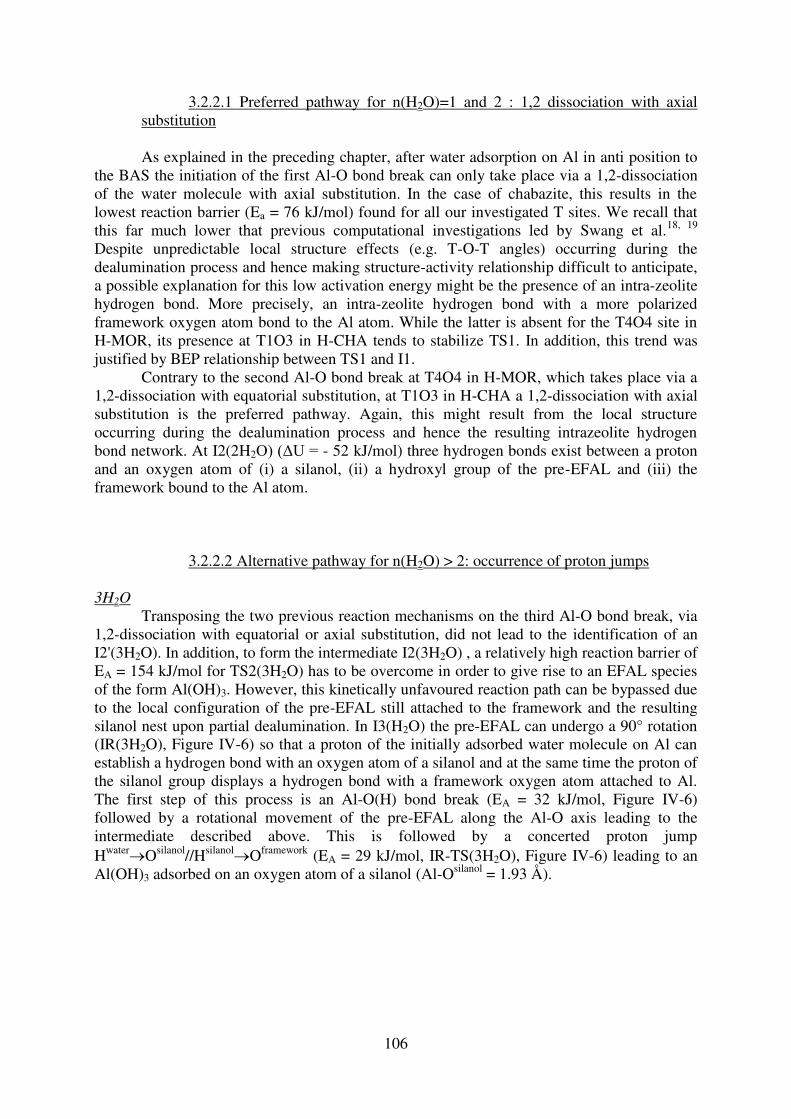
106
3.2.2.1 Preferred pathway for n(H2O)=1 and 2 : 1,2 dissociation with axial substitution
As explained in the preceding chapter, after water adsorption on Al in anti position to the BAS the initiation of the first Al-O bond break can only take place via a 1,2-dissociation of the water molecule with axial substitution. In the case of chabazite, this results in the lowest reaction barrier (Ea = 76 kJ/mol) found for all our investigated T sites. We recall that this far much lower that previous computational investigations led by Swang et al.18, 19 Despite unpredictable local structure effects (e.g. T-O-T angles) occurring during the dealumination process and hence making structure-activity relationship difficult to anticipate, a possible explanation for this low activation energy might be the presence of an intra-zeolite hydrogen bond. More precisely, an intra-zeolite hydrogen bond with a more polarized framework oxygen atom bond to the Al atom. While the latter is absent for the T4O4 site in H-MOR, its presence at T1O3 in H-CHA tends to stabilize TS1. In addition, this trend was justified by BEP relationship between TS1 and I1.
Contrary to the second Al-O bond break at T4O4 in H-MOR, which takes place via a 1,2-dissociation with equatorial substitution, at T1O3 in H-CHA a 1,2-dissociation with axial substitution is the preferred pathway. Again, this might result from the local structure occurring during the dealumination process and hence the resulting intrazeolite hydrogen bond network. At I2(2H2O) (ΔU = - 52 kJ/mol) three hydrogen bonds exist between a proton and an oxygen atom of (i) a silanol, (ii) a hydroxyl group of the pre-EFAL and (iii) the framework bound to the Al atom.
3.2.2.2 Alternative pathway for n(H2O) > 2: occurrence of proton jumps
3H2O
Transposing the two previous reaction mechanisms on the third Al-O bond break, via 1,2-dissociation with equatorial or axial substitution, did not lead to the identification of an I2'(3H2O). In addition, to form the intermediate I2(3H2O) , a relatively high reaction barrier of EA = 154 kJ/mol for TS2(3H2O) has to be overcome in order to give rise to an EFAL species of the form Al(OH)3. However, this kinetically unfavoured reaction path can be bypassed due to the local configuration of the pre-EFAL still attached to the framework and the resulting silanol nest upon partial dealumination. In I3(H2O) the pre-EFAL can undergo a 90° rotation (IR(3H2O), Figure IV-6) so that a proton of the initially adsorbed water molecule on Al can establish a hydrogen bond with an oxygen atom of a silanol and at the same time the proton of the silanol group displays a hydrogen bond with a framework oxygen atom attached to Al. The first step of this process is an Al-O(H) bond break (EA = 32 kJ/mol, Figure IV-6) followed by a rotational movement of the pre-EFAL along the Al-O axis leading to the intermediate described above. This is followed by a concerted proton jump HwaterOsilanol//HsilanolOframework (EA = 29 kJ/mol, IR-TS(3H2O), Figure IV-6) leading to an Al(OH)3 adsorbed on an oxygen atom of a silanol (Al-Osilanol = 1.93 Å).
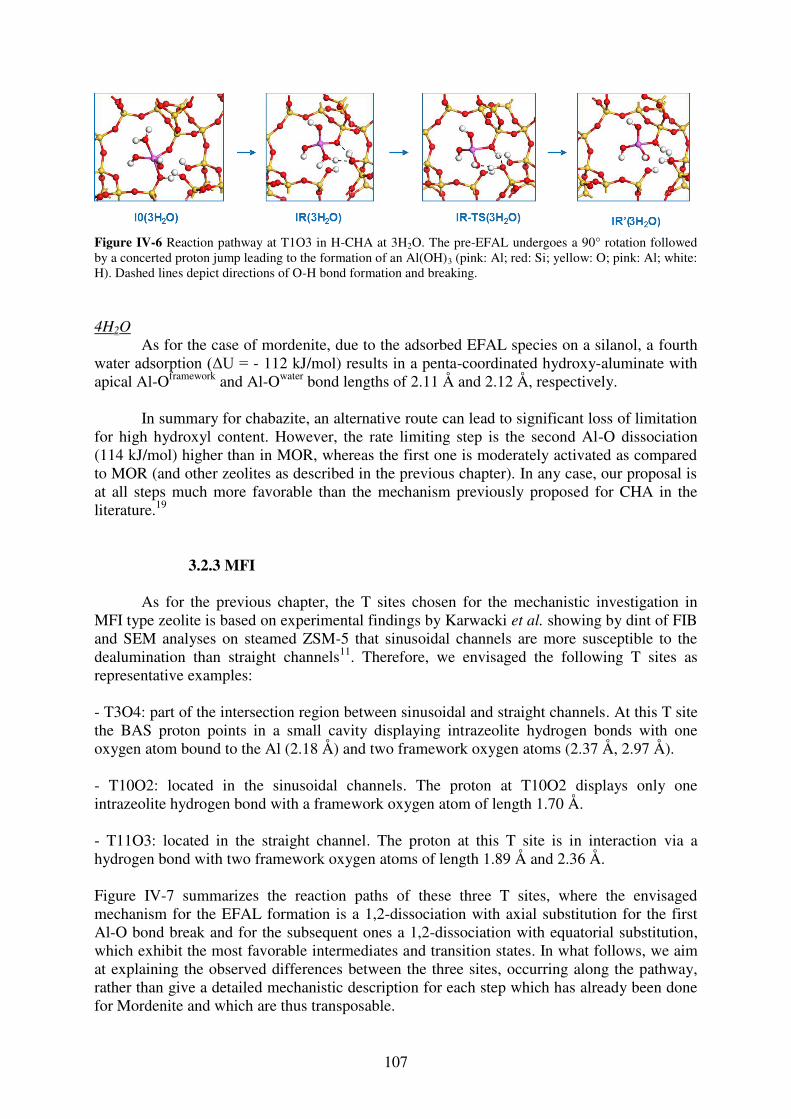
107
Figure IV-6 Reaction pathway at T1O3 in H-CHA at 3H2O. The pre-EFAL undergoes a 90° rotation followed by a concerted proton jump leading to the formation of an Al(OH)3 (pink: Al; red: Si; yellow: O; pink: Al; white: H). Dashed lines depict directions of O-H bond formation and breaking.
4H2O
As for the case of mordenite, due to the adsorbed EFAL species on a silanol, a fourth water adsorption (ΔU = - 112 kJ/mol) results in a penta-coordinated hydroxy-aluminate with apical Al-Oframework and Al-Owater bond lengths of 2.11 Å and 2.12 Å, respectively.
In summary for chabazite, an alternative route can lead to significant loss of limitation for high hydroxyl content. However, the rate limiting step is the second Al-O dissociation (114 kJ/mol) higher than in MOR, whereas the first one is moderately activated as compared to MOR (and other zeolites as described in the previous chapter). In any case, our proposal is at all steps much more favorable than the mechanism previously proposed for CHA in the literature.19
3.2.3 MFI
As for the previous chapter, the T sites chosen for the mechanistic investigation in
MFI type zeolite is based on experimental findings by Karwacki et al. showing by dint of FIB and SEM analyses on steamed ZSM-5 that sinusoidal channels are more susceptible to the dealumination than straight channels11. Therefore, we envisaged the following T sites as representative examples:
- T3O4: part of the intersection region between sinusoidal and straight channels. At this T site the BAS proton points in a small cavity displaying intrazeolite hydrogen bonds with one oxygen atom bound to the Al (2.18 Å) and two framework oxygen atoms (2.37 Å, 2.97 Å). - T10O2: located in the sinusoidal channels. The proton at T10O2 displays only one intrazeolite hydrogen bond with a framework oxygen atom of length 1.70 Å. - T11O3: located in the straight channel. The proton at this T site is in interaction via a hydrogen bond with two framework oxygen atoms of length 1.89 Å and 2.36 Å. Figure IV-7 summarizes the reaction paths of these three T sites, where the envisaged mechanism for the EFAL formation is a 1,2-dissociation with axial substitution for the first Al-O bond break and for the subsequent ones a 1,2-dissociation with equatorial substitution, which exhibit the most favorable intermediates and transition states. In what follows, we aim at explaining the observed differences between the three sites, occurring along the pathway, rather than give a detailed mechanistic description for each step which has already been done for Mordenite and which are thus transposable.
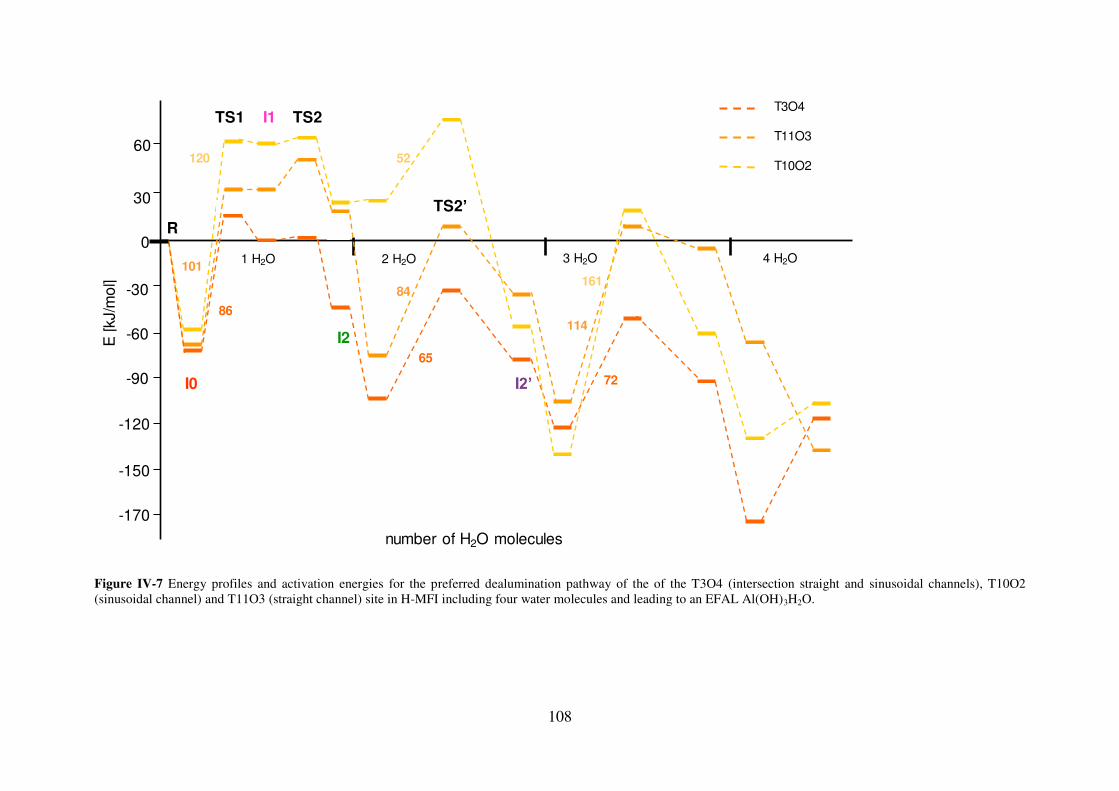
108
Figure IV-7 Energy profiles and activation energies for the preferred dealumination pathway of the of the T3O4 (intersection straight and sinusoidal channels), T10O2 (sinusoidal channel) and T11O3 (straight channel) site in H-MFI including four water molecules and leading to an EFAL Al(OH)3H2O.
E [k
J/m
ol]
number of H2O molecules
30
0
-30
-60
-90
-120
-150
3 H2O 4 H2O
R
2 H2O
60
I2
TS2’
I2’
-170
I0
1 H2O
I1 TS2TS1T3O4
T11O3
T10O2120
101
86
52
84
65
161
114
72
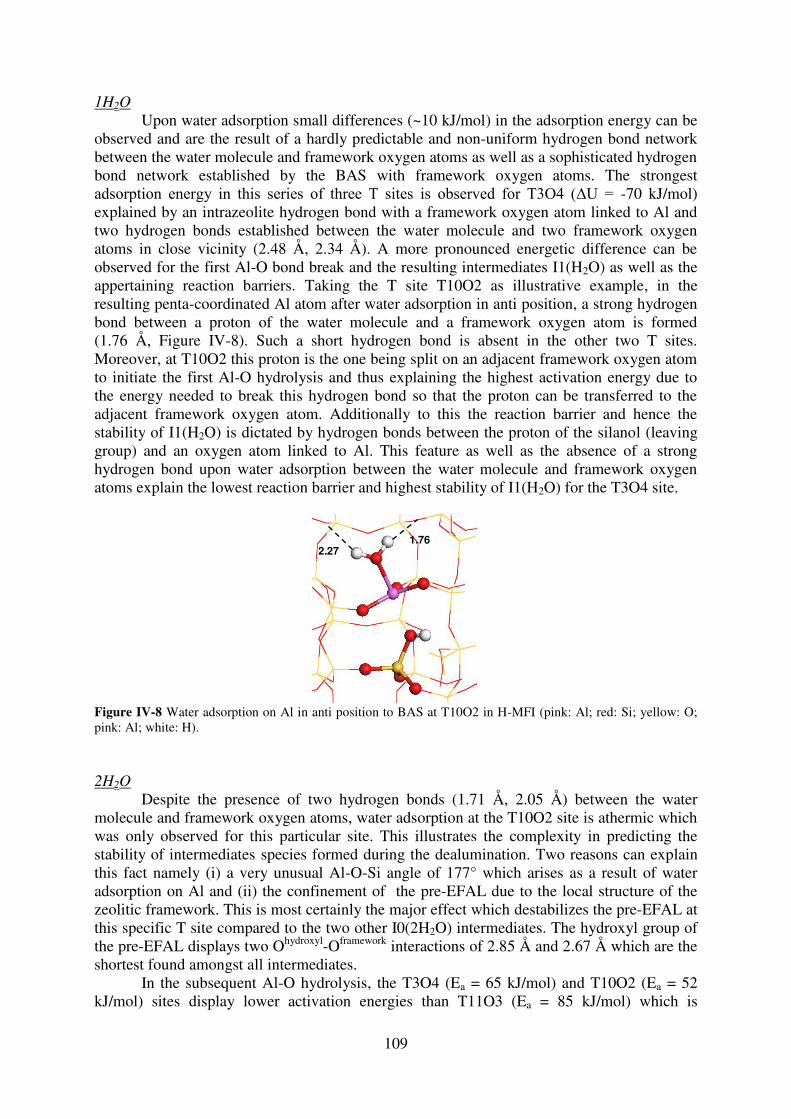
109
1H2O
Upon water adsorption small differences (~10 kJ/mol) in the adsorption energy can be observed and are the result of a hardly predictable and non-uniform hydrogen bond network between the water molecule and framework oxygen atoms as well as a sophisticated hydrogen bond network established by the BAS with framework oxygen atoms. The strongest adsorption energy in this series of three T sites is observed for T3O4 (ΔU = -70 kJ/mol) explained by an intrazeolite hydrogen bond with a framework oxygen atom linked to Al and two hydrogen bonds established between the water molecule and two framework oxygen atoms in close vicinity (2.48 Å, 2.34 Å). A more pronounced energetic difference can be observed for the first Al-O bond break and the resulting intermediates I1(H2O) as well as the appertaining reaction barriers. Taking the T site T10O2 as illustrative example, in the resulting penta-coordinated Al atom after water adsorption in anti position, a strong hydrogen bond between a proton of the water molecule and a framework oxygen atom is formed (1.76 Å, Figure IV-8). Such a short hydrogen bond is absent in the other two T sites. Moreover, at T10O2 this proton is the one being split on an adjacent framework oxygen atom to initiate the first Al-O hydrolysis and thus explaining the highest activation energy due to the energy needed to break this hydrogen bond so that the proton can be transferred to the adjacent framework oxygen atom. Additionally to this the reaction barrier and hence the stability of I1(H2O) is dictated by hydrogen bonds between the proton of the silanol (leaving group) and an oxygen atom linked to Al. This feature as well as the absence of a strong hydrogen bond upon water adsorption between the water molecule and framework oxygen atoms explain the lowest reaction barrier and highest stability of I1(H2O) for the T3O4 site.
Figure IV-8 Water adsorption on Al in anti position to BAS at T10O2 in H-MFI (pink: Al; red: Si; yellow: O; pink: Al; white: H). 2H2O
Despite the presence of two hydrogen bonds (1.71 Å, 2.05 Å) between the water molecule and framework oxygen atoms, water adsorption at the T10O2 site is athermic which was only observed for this particular site. This illustrates the complexity in predicting the stability of intermediates species formed during the dealumination. Two reasons can explain this fact namely (i) a very unusual Al-O-Si angle of 177° which arises as a result of water adsorption on Al and (ii) the confinement of the pre-EFAL due to the local structure of the zeolitic framework. This is most certainly the major effect which destabilizes the pre-EFAL at this specific T site compared to the two other I0(2H2O) intermediates. The hydroxyl group of the pre-EFAL displays two Ohydroxyl-Oframework interactions of 2.85 Å and 2.67 Å which are the shortest found amongst all intermediates.
In the subsequent Al-O hydrolysis, the T3O4 (Ea = 65 kJ/mol) and T10O2 (Ea = 52 kJ/mol) sites display lower activation energies than T11O3 (Ea = 85 kJ/mol) which is
1.762.27
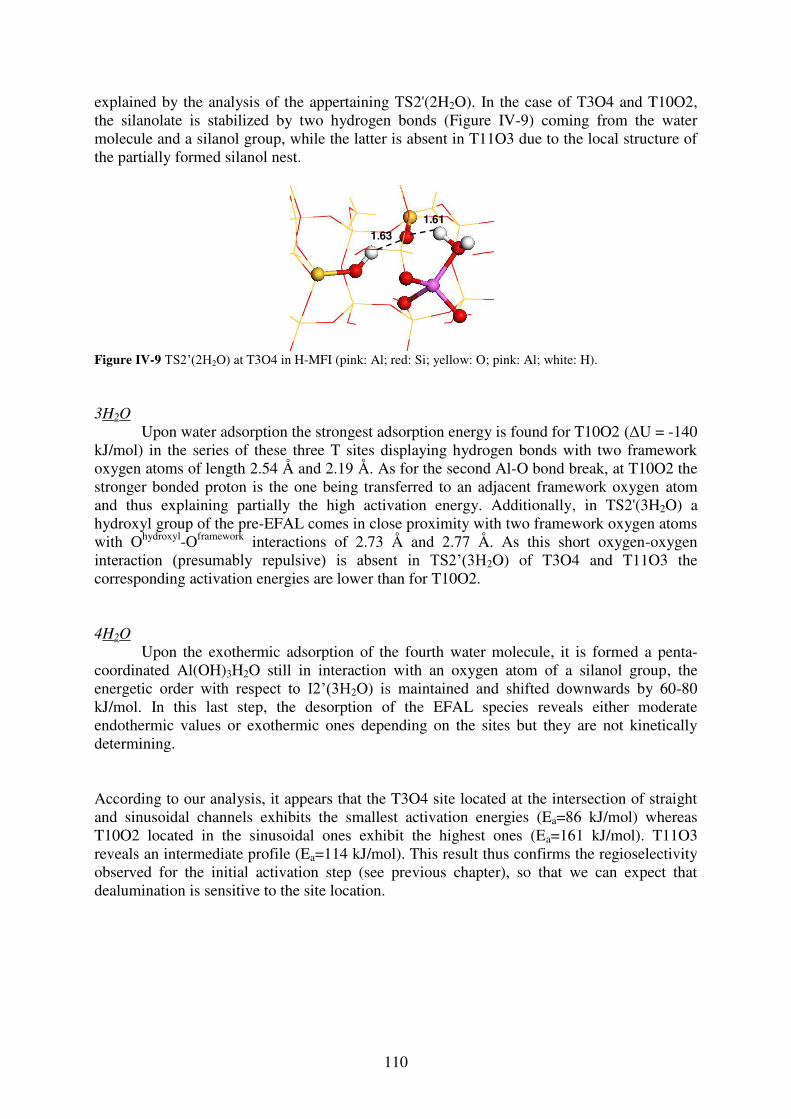
110
explained by the analysis of the appertaining TS2'(2H2O). In the case of T3O4 and T10O2, the silanolate is stabilized by two hydrogen bonds (Figure IV-9) coming from the water molecule and a silanol group, while the latter is absent in T11O3 due to the local structure of the partially formed silanol nest.
Figure IV-9 TS2’(2H2O) at T3O4 in H-MFI (pink: Al; red: Si; yellow: O; pink: Al; white: H). 3H2O
Upon water adsorption the strongest adsorption energy is found for T10O2 (ΔU = -140 kJ/mol) in the series of these three T sites displaying hydrogen bonds with two framework oxygen atoms of length 2.54 Å and 2.19 Å. As for the second Al-O bond break, at T10O2 the stronger bonded proton is the one being transferred to an adjacent framework oxygen atom and thus explaining partially the high activation energy. Additionally, in TS2'(3H2O) a hydroxyl group of the pre-EFAL comes in close proximity with two framework oxygen atoms with Ohydroxyl-Oframework interactions of 2.73 Å and 2.77 Å. As this short oxygen-oxygen interaction (presumably repulsive) is absent in TS2’(3H2O) of T3O4 and T11O3 the corresponding activation energies are lower than for T10O2.
4H2O
Upon the exothermic adsorption of the fourth water molecule, it is formed a penta-coordinated Al(OH)3H2O still in interaction with an oxygen atom of a silanol group, the energetic order with respect to I2’(3H2O) is maintained and shifted downwards by 60-80 kJ/mol. In this last step, the desorption of the EFAL species reveals either moderate endothermic values or exothermic ones depending on the sites but they are not kinetically determining. According to our analysis, it appears that the T3O4 site located at the intersection of straight and sinusoidal channels exhibits the smallest activation energies (Ea=86 kJ/mol) whereas T10O2 located in the sinusoidal ones exhibit the highest ones (Ea=161 kJ/mol). T11O3 reveals an intermediate profile (Ea=114 kJ/mol). This result thus confirms the regioselectivity observed for the initial activation step (see previous chapter), so that we can expect that dealumination is sensitive to the site location.
1.61
1.63
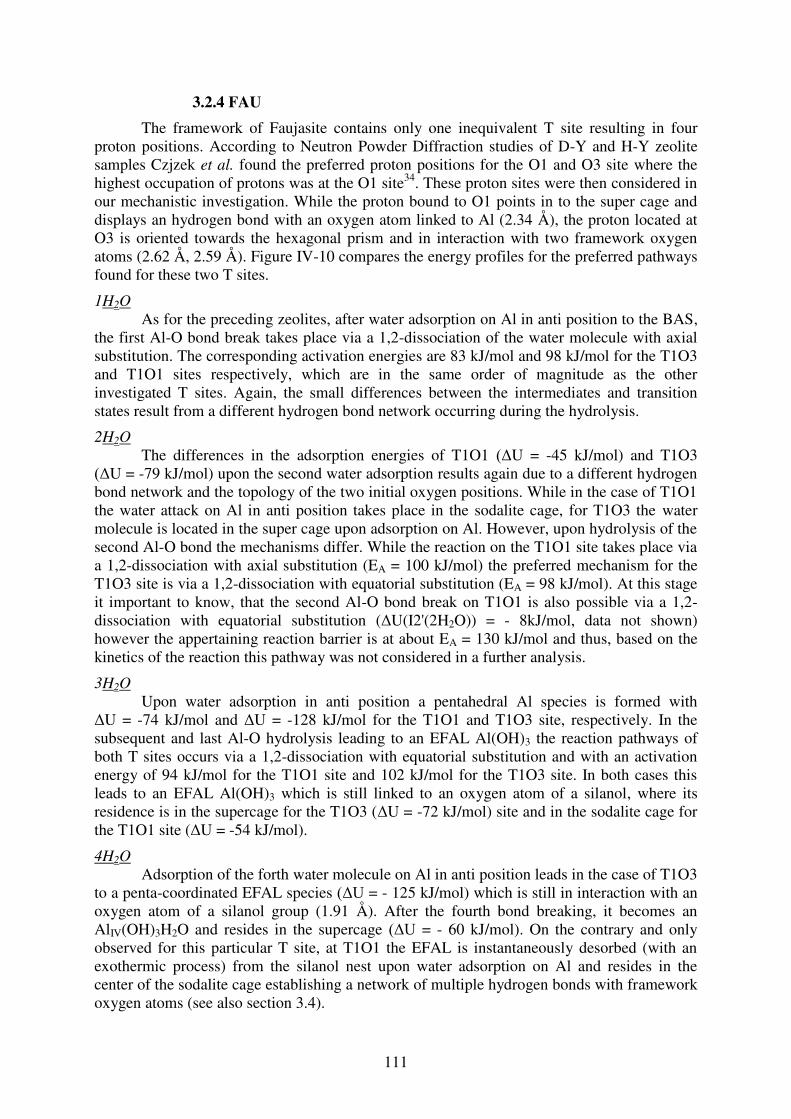
111
3.2.4 FAU
The framework of Faujasite contains only one inequivalent T site resulting in four proton positions. According to Neutron Powder Diffraction studies of D-Y and H-Y zeolite samples Czjzek et al. found the preferred proton positions for the O1 and O3 site where the highest occupation of protons was at the O1 site34. These proton sites were then considered in our mechanistic investigation. While the proton bound to O1 points in to the super cage and displays an hydrogen bond with an oxygen atom linked to Al (2.34 Å), the proton located at O3 is oriented towards the hexagonal prism and in interaction with two framework oxygen atoms (2.62 Å, 2.59 Å). Figure IV-10 compares the energy profiles for the preferred pathways found for these two T sites.
1H2O
As for the preceding zeolites, after water adsorption on Al in anti position to the BAS, the first Al-O bond break takes place via a 1,2-dissociation of the water molecule with axial substitution. The corresponding activation energies are 83 kJ/mol and 98 kJ/mol for the T1O3 and T1O1 sites respectively, which are in the same order of magnitude as the other investigated T sites. Again, the small differences between the intermediates and transition states result from a different hydrogen bond network occurring during the hydrolysis.
2H2O
The differences in the adsorption energies of T1O1 (ΔU = -45 kJ/mol) and T1O3 (ΔU = -79 kJ/mol) upon the second water adsorption results again due to a different hydrogen bond network and the topology of the two initial oxygen positions. While in the case of T1O1 the water attack on Al in anti position takes place in the sodalite cage, for T1O3 the water molecule is located in the super cage upon adsorption on Al. However, upon hydrolysis of the second Al-O bond the mechanisms differ. While the reaction on the T1O1 site takes place via a 1,2-dissociation with axial substitution (EA = 100 kJ/mol) the preferred mechanism for the T1O3 site is via a 1,2-dissociation with equatorial substitution (EA = 98 kJ/mol). At this stage it important to know, that the second Al-O bond break on T1O1 is also possible via a 1,2-dissociation with equatorial substitution (ΔU(I2'(2H2O)) = - 8kJ/mol, data not shown) however the appertaining reaction barrier is at about EA = 130 kJ/mol and thus, based on the kinetics of the reaction this pathway was not considered in a further analysis.
3H2O
Upon water adsorption in anti position a pentahedral Al species is formed with ΔU = -74 kJ/mol and ΔU = -128 kJ/mol for the T1O1 and T1O3 site, respectively. In the subsequent and last Al-O hydrolysis leading to an EFAL Al(OH)3 the reaction pathways of both T sites occurs via a 1,2-dissociation with equatorial substitution and with an activation energy of 94 kJ/mol for the T1O1 site and 102 kJ/mol for the T1O3 site. In both cases this leads to an EFAL Al(OH)3 which is still linked to an oxygen atom of a silanol, where its residence is in the supercage for the T1O3 (ΔU = -72 kJ/mol) site and in the sodalite cage for the T1O1 site (ΔU = -54 kJ/mol).
4H2O
Adsorption of the forth water molecule on Al in anti position leads in the case of T1O3 to a penta-coordinated EFAL species (ΔU = - 125 kJ/mol) which is still in interaction with an oxygen atom of a silanol group (1.91 Å). After the fourth bond breaking, it becomes an AlIV(OH)3H2O and resides in the supercage (ΔU = - 60 kJ/mol). On the contrary and only observed for this particular T site, at T1O1 the EFAL is instantaneously desorbed (with an exothermic process) from the silanol nest upon water adsorption on Al and resides in the center of the sodalite cage establishing a network of multiple hydrogen bonds with framework oxygen atoms (see also section 3.4).
112
Figure IV-10 Energy profiles and activation energies along the dealumination pathways of the T1O3 and T1O3 site in H-FAU including four water molecules and leading to an EFAL Al(OH)3H2O.
E [k
J/m
ol]
number of H2O molecules
I0
I1 TS2
I2
1 H2O
30
0
-30
-60
-90
-120
I2’
-150
2 H2O 3 H2O 4 H2O
R
60TS1
TS2’
T1O1: EFAL in sodalite cage
T1O3: EFAL in super cage
98
83
100
9894
102
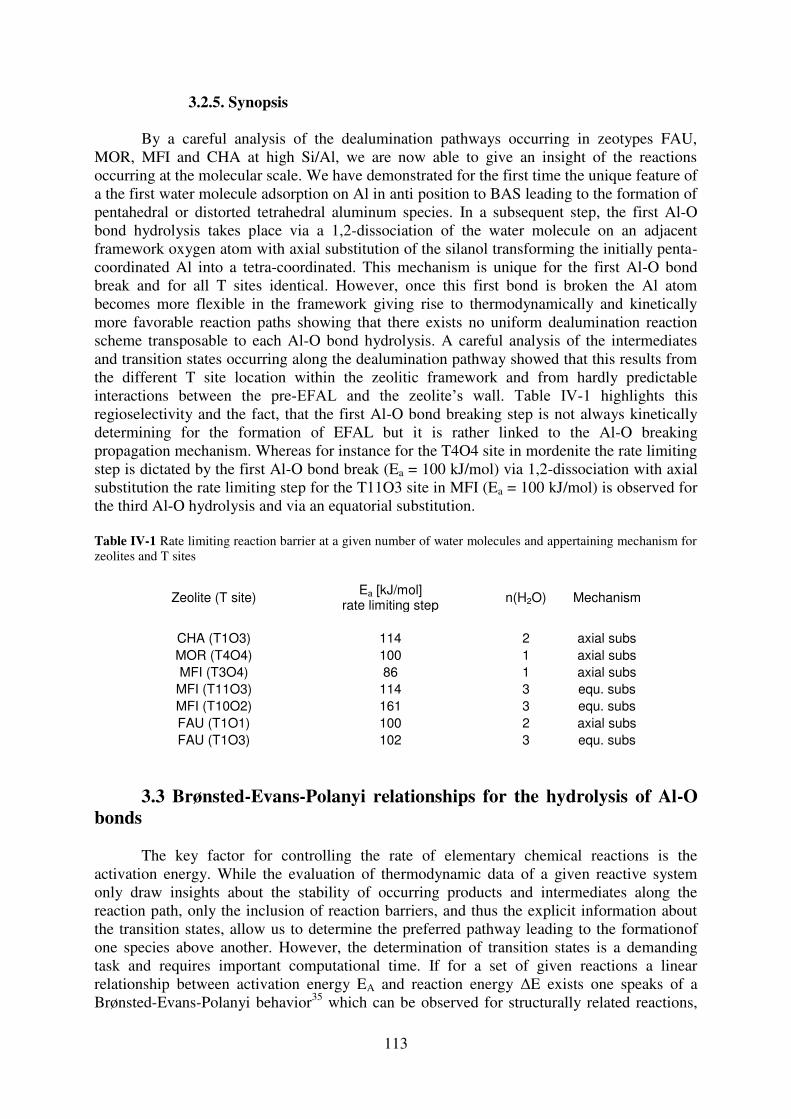
113
3.2.5. Synopsis
By a careful analysis of the dealumination pathways occurring in zeotypes FAU,
MOR, MFI and CHA at high Si/Al, we are now able to give an insight of the reactions occurring at the molecular scale. We have demonstrated for the first time the unique feature of a the first water molecule adsorption on Al in anti position to BAS leading to the formation of pentahedral or distorted tetrahedral aluminum species. In a subsequent step, the first Al-O bond hydrolysis takes place via a 1,2-dissociation of the water molecule on an adjacent framework oxygen atom with axial substitution of the silanol transforming the initially penta-coordinated Al into a tetra-coordinated. This mechanism is unique for the first Al-O bond break and for all T sites identical. However, once this first bond is broken the Al atom becomes more flexible in the framework giving rise to thermodynamically and kinetically more favorable reaction paths showing that there exists no uniform dealumination reaction scheme transposable to each Al-O bond hydrolysis. A careful analysis of the intermediates and transition states occurring along the dealumination pathway showed that this results from the different T site location within the zeolitic framework and from hardly predictable interactions between the pre-EFAL and the zeolite’s wall. Table IV-1 highlights this regioselectivity and the fact, that the first Al-O bond breaking step is not always kinetically determining for the formation of EFAL but it is rather linked to the Al-O breaking propagation mechanism. Whereas for instance for the T4O4 site in mordenite the rate limiting step is dictated by the first Al-O bond break (Ea = 100 kJ/mol) via 1,2-dissociation with axial substitution the rate limiting step for the T11O3 site in MFI (Ea = 100 kJ/mol) is observed for the third Al-O hydrolysis and via an equatorial substitution. Table IV-1 Rate limiting reaction barrier at a given number of water molecules and appertaining mechanism for zeolites and T sites
Zeolite (T site) Ea [kJ/mol] rate limiting step n(H2O) Mechanism
CHA (T1O3) 114 2 axial subs MOR (T4O4) 100 1 axial subs MFI (T3O4) 86 1 axial subs MFI (T11O3) 114 3 equ. subs MFI (T10O2) 161 3 equ. subs FAU (T1O1) 100 2 axial subs FAU (T1O3) 102 3 equ. subs
3.3 Brønsted-Evans-Polanyi relationships for the hydrolysis of Al-O
bonds
The key factor for controlling the rate of elementary chemical reactions is the activation energy. While the evaluation of thermodynamic data of a given reactive system only draw insights about the stability of occurring products and intermediates along the reaction path, only the inclusion of reaction barriers, and thus the explicit information about the transition states, allow us to determine the preferred pathway leading to the formationof one species above another. However, the determination of transition states is a demanding task and requires important computational time. If for a set of given reactions a linear relationship between activation energy EA and reaction energy ΔE exists one speaks of a Brønsted-Evans-Polanyi behavior35 which can be observed for structurally related reactions,
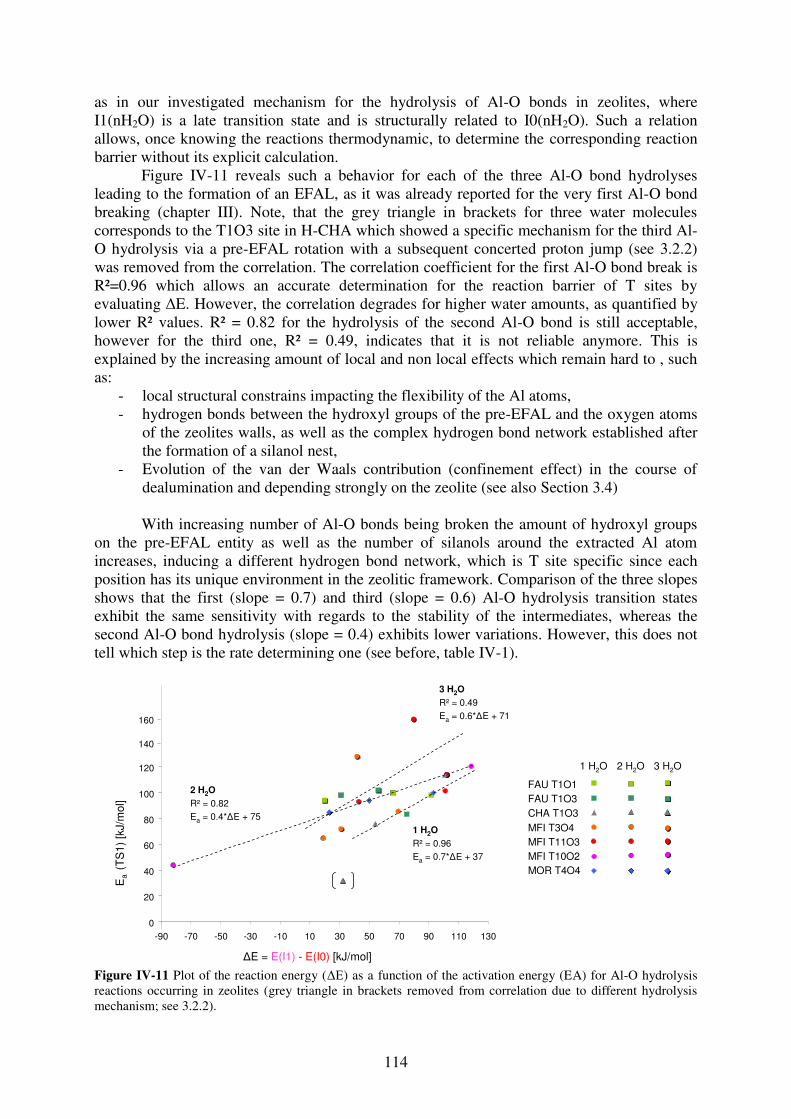
114
as in our investigated mechanism for the hydrolysis of Al-O bonds in zeolites, where I1(nH2O) is a late transition state and is structurally related to I0(nH2O). Such a relation allows, once knowing the reactions thermodynamic, to determine the corresponding reaction barrier without its explicit calculation.
Figure IV-11 reveals such a behavior for each of the three Al-O bond hydrolyses leading to the formation of an EFAL, as it was already reported for the very first Al-O bond breaking (chapter III). Note, that the grey triangle in brackets for three water molecules corresponds to the T1O3 site in H-CHA which showed a specific mechanism for the third Al-O hydrolysis via a pre-EFAL rotation with a subsequent concerted proton jump (see 3.2.2) was removed from the correlation. The correlation coefficient for the first Al-O bond break is R²=0.96 which allows an accurate determination for the reaction barrier of T sites by evaluating ΔE. However, the correlation degrades for higher water amounts, as quantified by lower R² values. R² = 0.82 for the hydrolysis of the second Al-O bond is still acceptable, however for the third one, R² = 0.49, indicates that it is not reliable anymore. This is explained by the increasing amount of local and non local effects which remain hard to , such as:
- local structural constrains impacting the flexibility of the Al atoms, - hydrogen bonds between the hydroxyl groups of the pre-EFAL and the oxygen atoms
of the zeolites walls, as well as the complex hydrogen bond network established after the formation of a silanol nest,
- Evolution of the van der Waals contribution (confinement effect) in the course of dealumination and depending strongly on the zeolite (see also Section 3.4) With increasing number of Al-O bonds being broken the amount of hydroxyl groups
on the pre-EFAL entity as well as the number of silanols around the extracted Al atom increases, inducing a different hydrogen bond network, which is T site specific since each position has its unique environment in the zeolitic framework. Comparison of the three slopes shows that the first (slope = 0.7) and third (slope = 0.6) Al-O hydrolysis transition states exhibit the same sensitivity with regards to the stability of the intermediates, whereas the second Al-O bond hydrolysis (slope = 0.4) exhibits lower variations. However, this does not tell which step is the rate determining one (see before, table IV-1).
Figure IV-11 Plot of the reaction energy (ΔE) as a function of the activation energy (EA) for Al-O hydrolysis reactions occurring in zeolites (grey triangle in brackets removed from correlation due to different hydrolysis mechanism; see 3.2.2).
0
20
40
60
80
100
120
-90 -70 -50 -30 -10 10 30 50 70 90 110 130
FAU T1O1FAU T1O3CHA T1O3MFI T3O4MFI T11O3MFI T10O2MOR T4O4
1 H2O 2 H2O 3 H2O
2 H2O
R² = 0.82Ea = 0.4*ΔE + 75
1 H2O
R² = 0.96Ea = 0.7*ΔE + 37
Ea
(TS
1) [k
J/m
ol]
ΔE = E(I1) - E(I0) [kJ/mol]
140
160
3 H2O
R² = 0.49Ea = 0.6*ΔE + 71
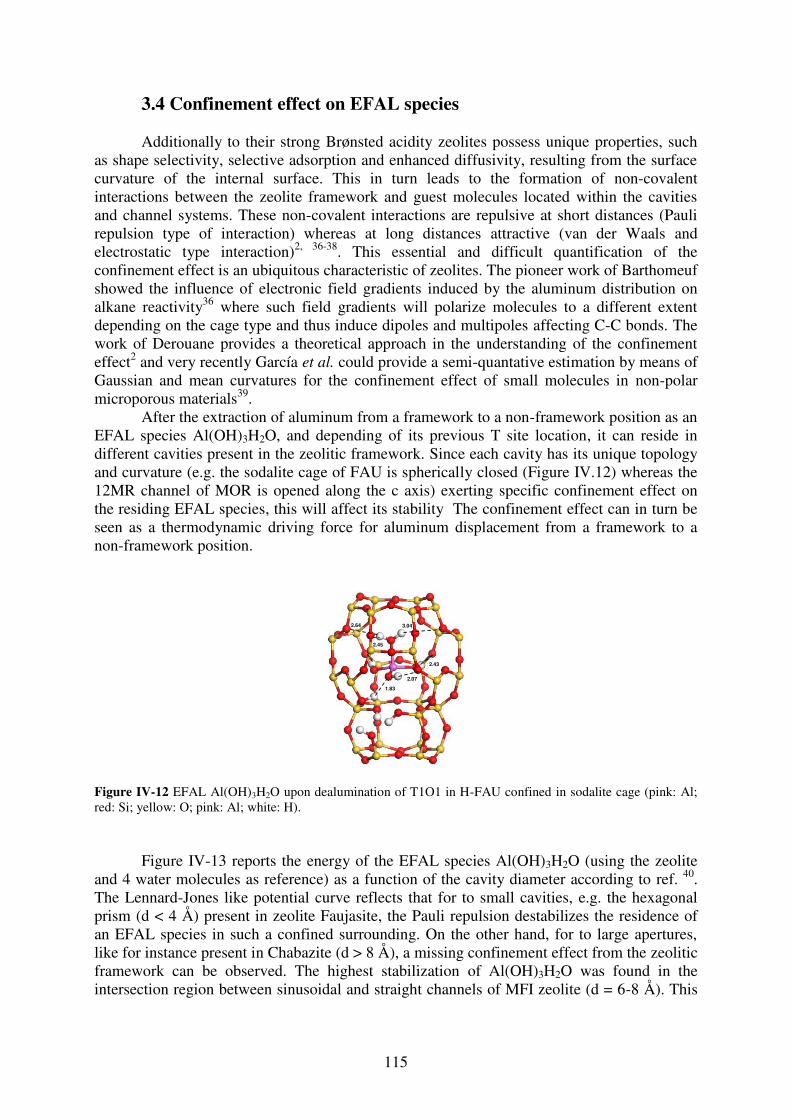
115
3.4 Confinement effect on EFAL species
Additionally to their strong Brønsted acidity zeolites possess unique properties, such as shape selectivity, selective adsorption and enhanced diffusivity, resulting from the surface curvature of the internal surface. This in turn leads to the formation of non-covalent interactions between the zeolite framework and guest molecules located within the cavities and channel systems. These non-covalent interactions are repulsive at short distances (Pauli repulsion type of interaction) whereas at long distances attractive (van der Waals and electrostatic type interaction)2, 36-38. This essential and difficult quantification of the confinement effect is an ubiquitous characteristic of zeolites. The pioneer work of Barthomeuf showed the influence of electronic field gradients induced by the aluminum distribution on alkane reactivity36 where such field gradients will polarize molecules to a different extent depending on the cage type and thus induce dipoles and multipoles affecting C-C bonds. The work of Derouane provides a theoretical approach in the understanding of the confinement effect2 and very recently García et al. could provide a semi-quantative estimation by means of Gaussian and mean curvatures for the confinement effect of small molecules in non-polar microporous materials39.
After the extraction of aluminum from a framework to a non-framework position as an EFAL species Al(OH)3H2O, and depending of its previous T site location, it can reside in different cavities present in the zeolitic framework. Since each cavity has its unique topology and curvature (e.g. the sodalite cage of FAU is spherically closed (Figure IV.12) whereas the 12MR channel of MOR is opened along the c axis) exerting specific confinement effect on the residing EFAL species, this will affect its stability The confinement effect can in turn be seen as a thermodynamic driving force for aluminum displacement from a framework to a non-framework position.
Figure IV-12 EFAL Al(OH)3H2O upon dealumination of T1O1 in H-FAU confined in sodalite cage (pink: Al; red: Si; yellow: O; pink: Al; white: H).
Figure IV-13 reports the energy of the EFAL species Al(OH)3H2O (using the zeolite
and 4 water molecules as reference) as a function of the cavity diameter according to ref. 40. The Lennard-Jones like potential curve reflects that for to small cavities, e.g. the hexagonal prism (d < 4 Å) present in zeolite Faujasite, the Pauli repulsion destabilizes the residence of an EFAL species in such a confined surrounding. On the other hand, for to large apertures, like for instance present in Chabazite (d > 8 Å), a missing confinement effect from the zeolitic framework can be observed. The highest stabilization of Al(OH)3H2O was found in the intersection region between sinusoidal and straight channels of MFI zeolite (d = 6-8 Å). This
2.64
2.45
3.04
2.43
2.07
1.83
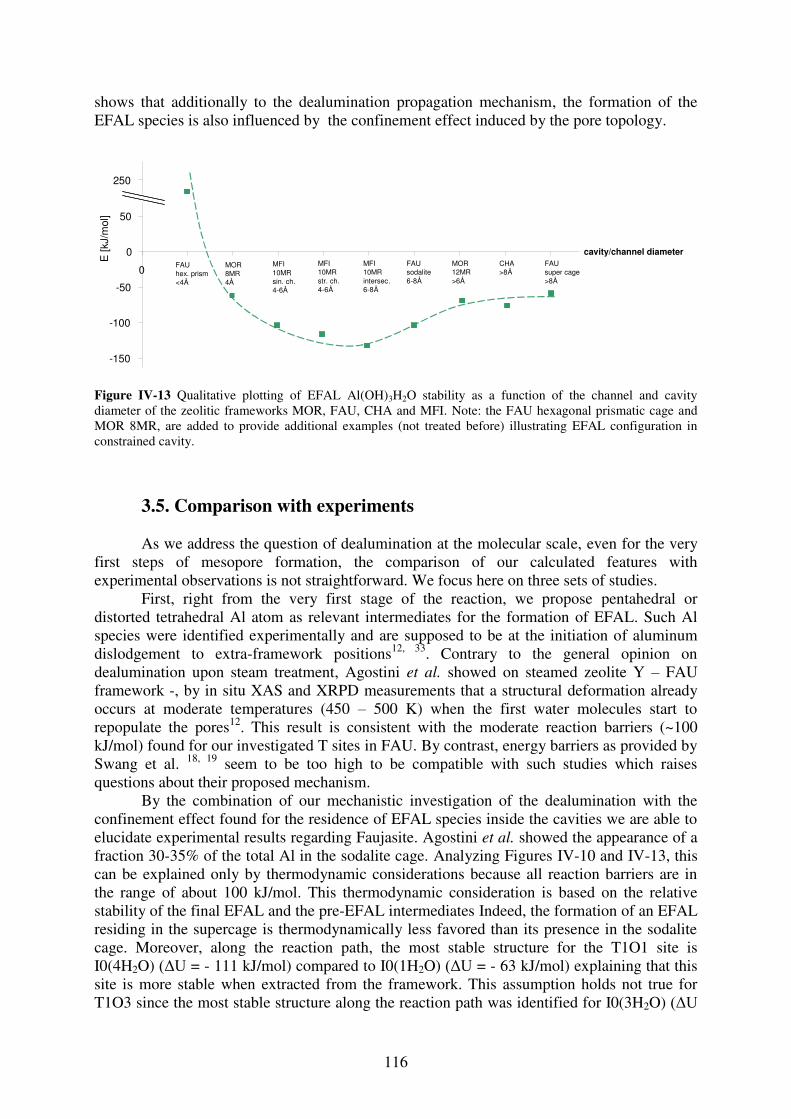
116
shows that additionally to the dealumination propagation mechanism, the formation of the EFAL species is also influenced by the confinement effect induced by the pore topology.
Figure IV-13 Qualitative plotting of EFAL Al(OH)3H2O stability as a function of the channel and cavity diameter of the zeolitic frameworks MOR, FAU, CHA and MFI. Note: the FAU hexagonal prismatic cage and MOR 8MR, are added to provide additional examples (not treated before) illustrating EFAL configuration in constrained cavity.
3.5. Comparison with experiments
As we address the question of dealumination at the molecular scale, even for the very first steps of mesopore formation, the comparison of our calculated features with experimental observations is not straightforward. We focus here on three sets of studies.
First, right from the very first stage of the reaction, we propose pentahedral or distorted tetrahedral Al atom as relevant intermediates for the formation of EFAL. Such Al species were identified experimentally and are supposed to be at the initiation of aluminum dislodgement to extra-framework positions12, 33. Contrary to the general opinion on dealumination upon steam treatment, Agostini et al. showed on steamed zeolite Y – FAU framework -, by in situ XAS and XRPD measurements that a structural deformation already occurs at moderate temperatures (450 – 500 K) when the first water molecules start to repopulate the pores12. This result is consistent with the moderate reaction barriers (~100 kJ/mol) found for our investigated T sites in FAU. By contrast, energy barriers as provided by Swang et al. 18, 19 seem to be too high to be compatible with such studies which raises questions about their proposed mechanism.
By the combination of our mechanistic investigation of the dealumination with the confinement effect found for the residence of EFAL species inside the cavities we are able to elucidate experimental results regarding Faujasite. Agostini et al. showed the appearance of a fraction 30-35% of the total Al in the sodalite cage. Analyzing Figures IV-10 and IV-13, this can be explained only by thermodynamic considerations because all reaction barriers are in the range of about 100 kJ/mol. This thermodynamic consideration is based on the relative stability of the final EFAL and the pre-EFAL intermediates Indeed, the formation of an EFAL residing in the supercage is thermodynamically less favored than its presence in the sodalite cage. Moreover, along the reaction path, the most stable structure for the T1O1 site is I0(4H2O) (ΔU = - 111 kJ/mol) compared to I0(1H2O) (ΔU = - 63 kJ/mol) explaining that this site is more stable when extracted from the framework. This assumption holds not true for T1O3 since the most stable structure along the reaction path was identified for I0(3H2O) (ΔU
E [k
J/m
ol]
cavity/channel diameter
FAUhex. prism<4Å
MFI10MRsin. ch.4-6Å
MFI10MRintersec.6-8Å
MFI10MRstr. ch.4-6Å
FAUsodalite6-8Å
MOR12MR>6Å
FAUsuper cage>8Å
-150
-100
-50
0
50
250
0MOR8MR4Å
CHA>8Å
117
= - 128 kJ/mol) showing that only partial dealumination has occurred with formation of a stable penta-coordinated Al species not being an extraframework species. So both the relative stability of intermediates and final products are driving forces for the regioselectivity of EFAL formation in FAU, rather than barriers, which are comparable for both sites.
At the mesoscale, employing FIB and SEM analyzes Karwacki et al. revealed an architecture-dependent mesopore formation upon steaming of ZSM-5 zeolite: sinusoidal channels were more affected by the dealumination than straight channels11. Upon analysis of the reaction path of T sites located in the sinusoidal channels (T10O2), straight channels (T11O3) and the intersection regions (T3O4) (Figure IV-7), we confirm this regioselectivity and we determine that the intersection region of sinusoidal and straight channels is the place wherethe dealumination of T3O4 is the most favored in terms of kinetics and thermodynamics. At this site, the tetrahedral Al atom is more stable in a non-framework position dictated by the stability of all intermediates (but one) and driven by the confinement effect of the intersection region. The T site in the sinusoidal channel shows the highest activation energies in the series of these three T sites and moreover the most stable structure along the reaction path was found for I0(3H2O) (ΔU = - 140 kJ/mol) meaning that at T10O2 Al is more stable as a framework species. The same observation holds also true for the T11O3 site where the most stable structure was I0(3H2O) (ΔU = - 106 kJ/mol). Note however that experimentally, no information is available for the initiation site for dealumination provided in the present study. Our result combined with experimental one would indicate that once the initiation occurred at the intersection the propagation of mesopores occurs along sinusoidal channels. Understanding the molecular origins of this latter result would require additional investigations, such as the simulation of the propagation of extraframework formation, up to the mesopore. A first tentative explanation can be provided looking at the results reported in figure IV-13. Indeed, EFAL is the less stabilized in the sinusoidal channel, whereas it is preferentially located at the intersection, and in the straight channel. We can thus suggest that pore blocking inside the straight channels occurs. After most initiation sites have been dealuminated, the corresponding EFAL diffuses preferentially in the straight channels, preventing their further dealumination and promoting the formation of mesopores along sinusoidal channels.
4. Conclusions
The present study reports a mechanistic investigation of dealumination reactions in MOR, MFI, FAU and CHA. We have demonstrated that the very first step in the initiation of the dealumination of a given T site is a water adsorption on Al in anti position to the Brønsted acid site, leading to the formation of a pentahedral or distorted tetrahedral Al atom. In a subsequent step, the first Al-O hydrolysis takes place via a 1,2-dissociation of the water molecule with axial substitution of the silanol. This mechanism is the same for each T site, regarding the reaction of the first water molecule. On the contrary, once the first Al-O bond is broken alternative pathways are possible due to hardly predictable local and non local effects (i.e. a hydrogen bond network between the pre-EFAL and the zeolitic walls as well as the resulting silanol nest, and van der Waals contributions also linked with confinement effects) affecting the stability of TS and intermediates along the path. Brønsted-Evans-Polanyi relationships for each Al-O hydrolysis have been established but they reveal a strong degradation for the third Al-O hydrolysis due to these complex local and non local effects.
Moreover, we were able to show, that the very first Al-O bond breaking step is not always kinetically determining for the formation of EFAL. The subsequent Al-O bond

118
breaking steps as well as the confinement effect on an EFAL species exerted by the zeolites cavities and channel systems can represent a driving force for Al dislodgement to extraframework positions, which is likely to explain some experimental features.
Open questions remains about the propagation of such demetallation reactions, starting
for a solid where a single EFAL is obtained. These aspects will be key to understand mesopore formations. To obtain molecular insights about this, knowledge about desilication reactions have also to be gathered, which is the topic of the next chapter.
119
References 1. W. Vermeiren and J. P. Gilson, Top. Catal., 2009, 52, 1131-1161. 2. E. G. Derouane, J. M. Andre and A. A. Lucas, J. Catal., 1988, 110, 58-73. 3. S. Bordiga, P. Ugliengo, A. Damin, C. Lamberti, G. Spoto, A. Zecchina, G. Spanò, R.
Buzzoni, L. Dalloro and F. Rivetti, Top. Catal., 2001, 15, 43-52. 4. J. i. D de ek, S. Sklenak, . Li, F. ao, J. i. Brus, . hu and T. Tatsumi, J. Phys.
Chem. C, 2009, 113, 14454-14466. 5. L. Benco, T. Demuth, J. Hafner, F. Hutschka and H. Toulhoat, J. Catal., 2002, 209,
480-488. 6. D. L. Bhering, A. Ramirez-Solis and C. J. A. Mota, J. Phys. Chem. B, 2003, 107,
4342-4347. 7. S. Li, A. Zheng, Y. Su, H. Fang, W. Shen, Z. Yu, L. Chen and F. Deng, Phys. Chem.
Chem. Phys., 2010, 12, 3895-3903. 8. O. Lisboa, M. Sánchez and F. Ruette, J. Mol. Catal. A: Chem., 2008, 294, 93-101. 9. W. Lutz, R. Bertram, D. Heidemann, R. Kurzhals, C. Rüscher and G. Kryukova,
Zeitschrift für anorganische und allgemeine Chemie, 2011, 637, 75-82. 10. J. M. Ruiz, M. H. McAdon and J. M. Garcés, J. Phys. Chem. B, 1997, 101, 1733-1744. 11. L. Karwacki, D. A. M. de Winter, L. R. Aramburo, M. N. Lebbink, J. A. Post, M. R.
Drury and B. M. Weckhuysen, Angew. Chem., Int. Ed., 2011, 50, 1294-1298. 12. G. Agostini, C. Lamberti, L. Palin, M. Milanesio, N. Danilina, B. Xu, M. Janousch
and J. a. van Bokhoven, J. Am. Chem. Soc., 2010, 132, 667-678. 13. M. Müller, G. Harvey and R. Prins, Microporous Mesoporous Mater., 2000, 34, 135-
147. 14. P. C. Van Geem, K. F. M. G. J. Scholle, G. P. M. Van der Velden and W. S. Veeman,
J. Phys. Chem., 1988, 92, 1585-1589. 15. M.-C. Silaghi, C. Chizallet and P. Raybaud, Microporous Mesoporous Mater., 2014,
191, 82-96. 16. S. Ban, a. N. C. van Laak, J. Landers, a. V. Neimark, P. E. de Jongh, K. P. de Jong and
T. J. H. Vlugt, J. Phys. Chem. C, 2010, 114, 2056-2065. 17. C. Marcilly, ed., Acido-Basic Catalysis - Application to Refining and Petrochemistry,
Editions TECHNIP, 2005. 18. T. Fjermestad, S. Svelle and O. Swang, J. Phys. Chem. C, 2013, 117, 13442-13451. 19. S. Malola, S. Svelle, F. L. Bleken and O. Swang, Angew. Chem., Int. Ed., 2011, 51,
652-655. 20. G. Kresse, J Non-Cryst Solids, 1995, 192–193, 222-229. 21. G. Kresse and J. Furthmüller, Computational Materials Science, 1996, 6, 15-50. 22. G. Kresse and J. Hafner, Phys Rev B, 1994, 49, 14251-14269. 23. G. Kresse and D. Joubert, Phys Rev B, 1999, 59, 1758-1775. 24. P. E. Blöchl, Phys Rev B, 1994, 50, 17953-17979. 25. J. P. Perdew, K. Burke and M. Ernzerhof, Phys. Rev. Lett., 1996, 77, 3865-3868. 26. S. Grimme, J. Comput. Chem., 2006, 27, 1787-1799. 27. J. Van der Mynsbrugge, K. Hemelsoet, M. Vandichel, M. Waroquier and V. Van
Speybroeck, J. Phys. Chem. C, 2012, 116, 5499-5508. 28. S. Grimme, J. Comput. Chem., 2004, 25, 1463-1473. 29. Y. Hong and J. J. Fripiat, Microporous Mater., 1995, 4, 323-334. 30. B. L. Meyers, T. H. Fleisch, G. J. Ray, J. T. Miller and J. B. Hall, J. Catal., 1988, 110,
82-95. 31. R. W. Olsson and L. D. Rollmann, Inorg. Chem., 1977, 16, 651-654.
120
32. P. C. Van Geem, K. F. M. G. J. Scholle, G. P. M. Van der Velden and W. S. Veeman, The Journal of Physical Chemistry, 1988, 92, 1585-1589.
33. T.-H. Chen, K. Houthoofd and P. J. Grobet, Microporous Mesoporous Mater., 2005, 86, 31-37.
34. M. Czjzek, H. Jobic, A. N. Fitch and T. Vogt, J. Phys. Chem., 1992, 96, 1535-1540. 35. J. N. Bronsted, Chem. Rev., 1928, 5, 231-338. 36. D. Barthomeuf, Mater. Chem. Phys., 1987, 17, 49-71. 37. F. Leydier, C. Chizallet, A. Chaumonnot, M. Digne, E. Soyer, A.-A. Quoineaud, D.
Costa and P. Raybaud, J. Catal., 2011, 284, 215-229. 38. X. Rozanska, R. van Santen, F. Hutschka and J. Hafner, J. Am. Chem. Soc., 2001, 123,
7655-7667. 39. E. J. Garcia, J. Perez-Pellitero, C. Jallut and G. D. Pirngruber, Phys. Chem. Chem.
Phys., 2013, 15, 5648-5657. 40. E. L. First, C. E. Gounaris, J. Wei and C. A. Floudas, Phys. Chem. Chem. Phys., 2011,
13, 17339-17358.
121
CHAPTER V:
Combined desilication and dealumination of mordenite

122
1. Introduction
The pure dealumination process as presented in the preceding chapters only explains the
formation of EFAL species and so formed atomic gaps and the creation of silanol nests.
However experimentally, the formation of mesopores upon steaming, not only isolated
defects, is well documented 1-8
. For example, Lutz et al. studied the steam dealumination
behaviour of NH4-Y and demonstrated the formation of two types of mesopores:
intracrystalline (closed bulk) and intercrystalline (surface) mesopores1. In addition to the well-
known pentahedrally and octahedrally coordinated extra-framework Al, they found the
presence of silica gel at the crystallite surface and aluminosilicate debris inside the pores,
leading to the conclusion that mesopore generation is linked to the formation of extra-
framework siliceous species. Note that synthesis conditions and the resulting chemical
composition of the zeolites framework has a drastic impact on the location of aluminium
atoms in the native zeolite 6, 9-15
, and thus on the properties of the pores generated: a gradient,
possibly aluminium zoning within zeolite particles can induce a variety of meso-structures
after dealumination 12
.
Hence, in order to correctly account for the formation of mesopores at the molecular level,
i.e. refilling of atomic holes – that the Al removal left behind – by Si atoms, the mechanism of
Marcilly8 (Figure V-1) proposed additionally to a "simple" dealumination, which would not
directly lead to mesopore formation, a silicon migration (from extra-framework siliceous-
species) to fill the atomic gaps.
Si
Al
Framework Si Framework Al
Aluminum Extraction
Atomic gaps EFAL
ASA
Silicon Migration
migrating Si
Mesoporous Zeolite
Si
Al
Framework Si Framework Al
Aluminum Extraction
Si
Al
Framework Si Framework Al
Aluminum Extraction
Atomic gaps EFAL
ASA
Silicon Migration
migrating Si
Atomic gaps EFAL
ASA
Atomic gaps EFAL
ASA
Silicon Migration
migrating Si
Mesoporous ZeoliteMesoporous Zeolite
Figure V-1 Schematic picture of the Mechanism of Marcilly showing the mesopore formation upon
dealumination (adapted from 8).
This process of "self-healing" is able to explain the post-synthetically introduced
secondary pore system, upon dealumination. Despite all these experimental results an
atomistic understanding of such phenomena is still unknown and of great interest for the
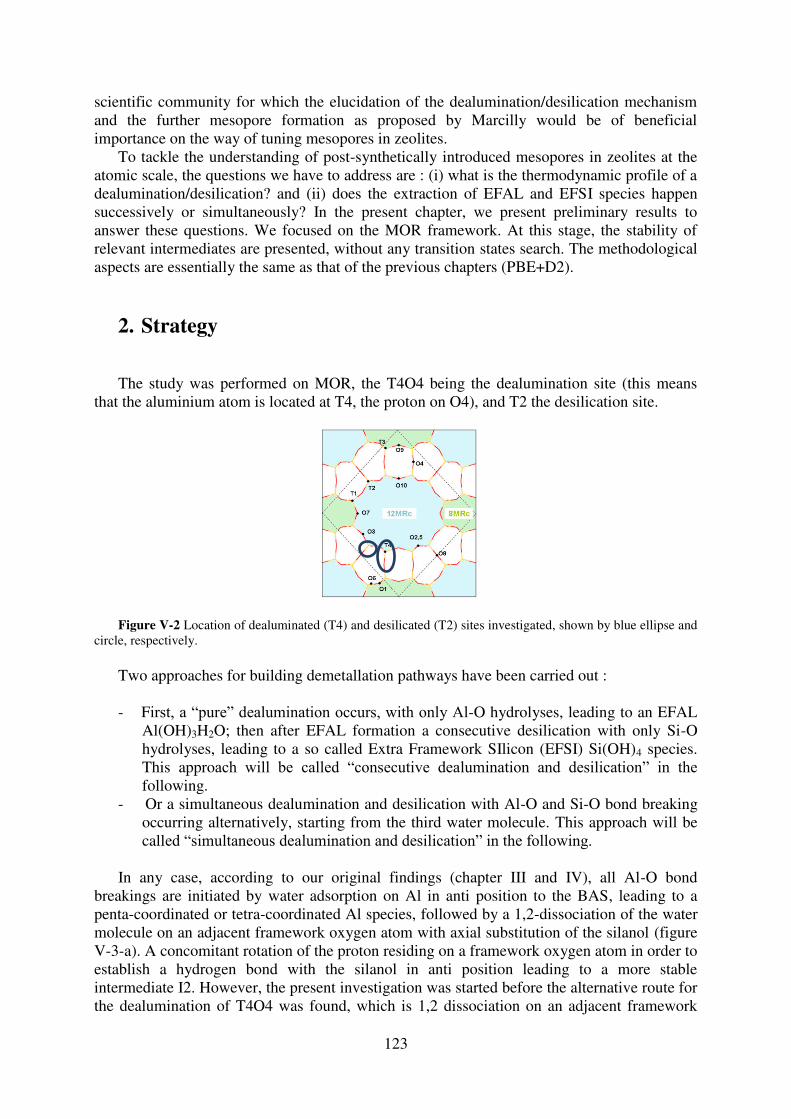
123
scientific community for which the elucidation of the dealumination/desilication mechanism
and the further mesopore formation as proposed by Marcilly would be of beneficial
importance on the way of tuning mesopores in zeolites.
To tackle the understanding of post-synthetically introduced mesopores in zeolites at the
atomic scale, the questions we have to address are : (i) what is the thermodynamic profile of a
dealumination/desilication? and (ii) does the extraction of EFAL and EFSI species happen
successively or simultaneously? In the present chapter, we present preliminary results to
answer these questions. We focused on the MOR framework. At this stage, the stability of
relevant intermediates are presented, without any transition states search. The methodological
aspects are essentially the same as that of the previous chapters (PBE+D2).
2. Strategy
The study was performed on MOR, the T4O4 being the dealumination site (this means
that the aluminium atom is located at T4, the proton on O4), and T2 the desilication site.
)
Figure V-2 Location of dealuminated (T4) and desilicated (T2) sites investigated, shown by blue ellipse and
circle, respectively.
Two approaches for building demetallation pathways have been carried out :
- First, a “pure” dealumination occurs, with only Al-O hydrolyses, leading to an EFAL
Al(OH)3H2O; then after EFAL formation a consecutive desilication with only Si-O
hydrolyses, leading to a so called Extra Framework SIlicon (EFSI) Si(OH)4 species.
This approach will be called “consecutive dealumination and desilication” in the following.
- Or a simultaneous dealumination and desilication with Al-O and Si-O bond breaking
occurring alternatively, starting from the third water molecule. This approach will be
called “simultaneous dealumination and desilication” in the following.
In any case, according to our original findings (chapter III and IV), all Al-O bond
breakings are initiated by water adsorption on Al in anti position to the BAS, leading to a
penta-coordinated or tetra-coordinated Al species, followed by a 1,2-dissociation of the water
molecule on an adjacent framework oxygen atom with axial substitution of the silanol (figure
V-3-a). A concomitant rotation of the proton residing on a framework oxygen atom in order to
establish a hydrogen bond with the silanol in anti position leading to a more stable
intermediate I2. However, the present investigation was started before the alternative route for
the dealumination of T4O4 was found, which is 1,2 dissociation on an adjacent framework
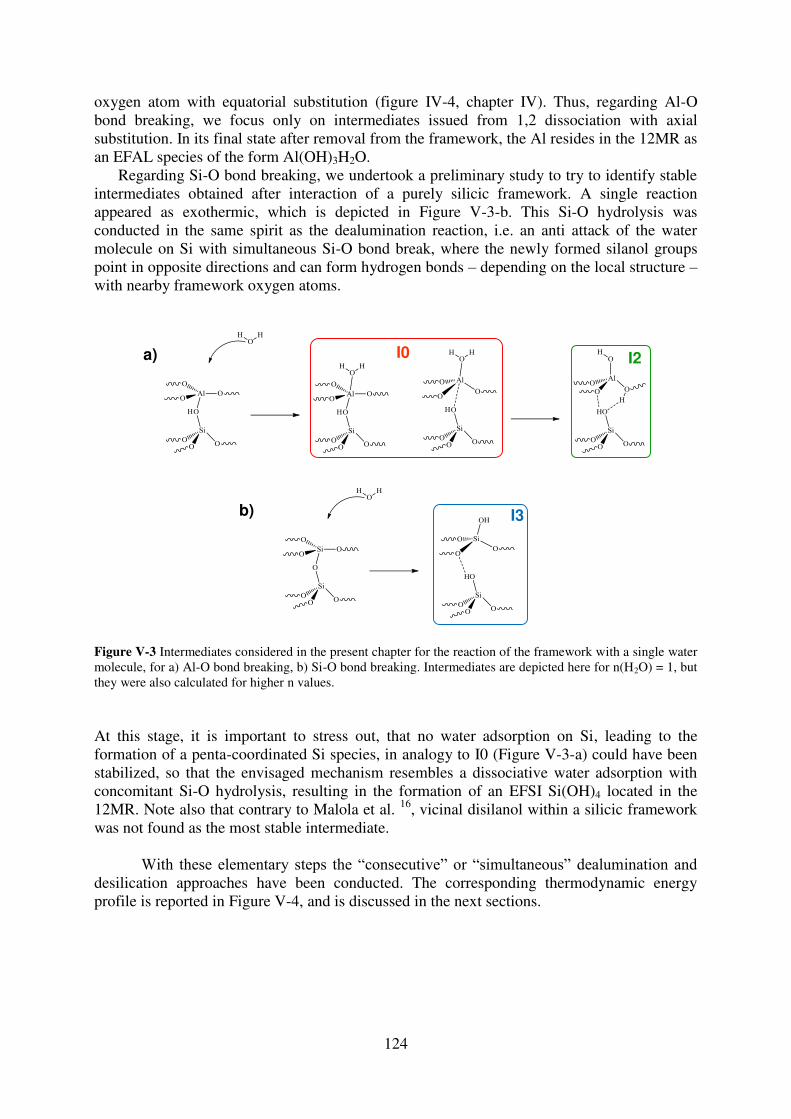
124
oxygen atom with equatorial substitution (figure IV-4, chapter IV). Thus, regarding Al-O
bond breaking, we focus only on intermediates issued from 1,2 dissociation with axial
substitution. In its final state after removal from the framework, the Al resides in the 12MR as
an EFAL species of the form Al(OH)3H2O.
Regarding Si-O bond breaking, we undertook a preliminary study to try to identify stable
intermediates obtained after interaction of a purely silicic framework. A single reaction
appeared as exothermic, which is depicted in Figure V-3-b. This Si-O hydrolysis was
conducted in the same spirit as the dealumination reaction, i.e. an anti attack of the water
molecule on Si with simultaneous Si-O bond break, where the newly formed silanol groups
point in opposite directions and can form hydrogen bonds – depending on the local structure –
with nearby framework oxygen atoms.
I2I0
I3
a)
b)
Figure V-3 Intermediates considered in the present chapter for the reaction of the framework with a single water
molecule, for a) Al-O bond breaking, b) Si-O bond breaking. Intermediates are depicted here for n(H2O) = 1, but
they were also calculated for higher n values.
At this stage, it is important to stress out, that no water adsorption on Si, leading to the
formation of a penta-coordinated Si species, in analogy to I0 (Figure V-3-a) could have been
stabilized, so that the envisaged mechanism resembles a dissociative water adsorption with
concomitant Si-O hydrolysis, resulting in the formation of an EFSI Si(OH)4 located in the
12MR. Note also that contrary to Malola et al. 16
, vicinal disilanol within a silicic framework
was not found as the most stable intermediate.
With these elementary steps the “consecutive” or “simultaneous” dealumination and desilication approaches have been conducted. The corresponding thermodynamic energy
profile is reported in Figure V-4, and is discussed in the next sections.
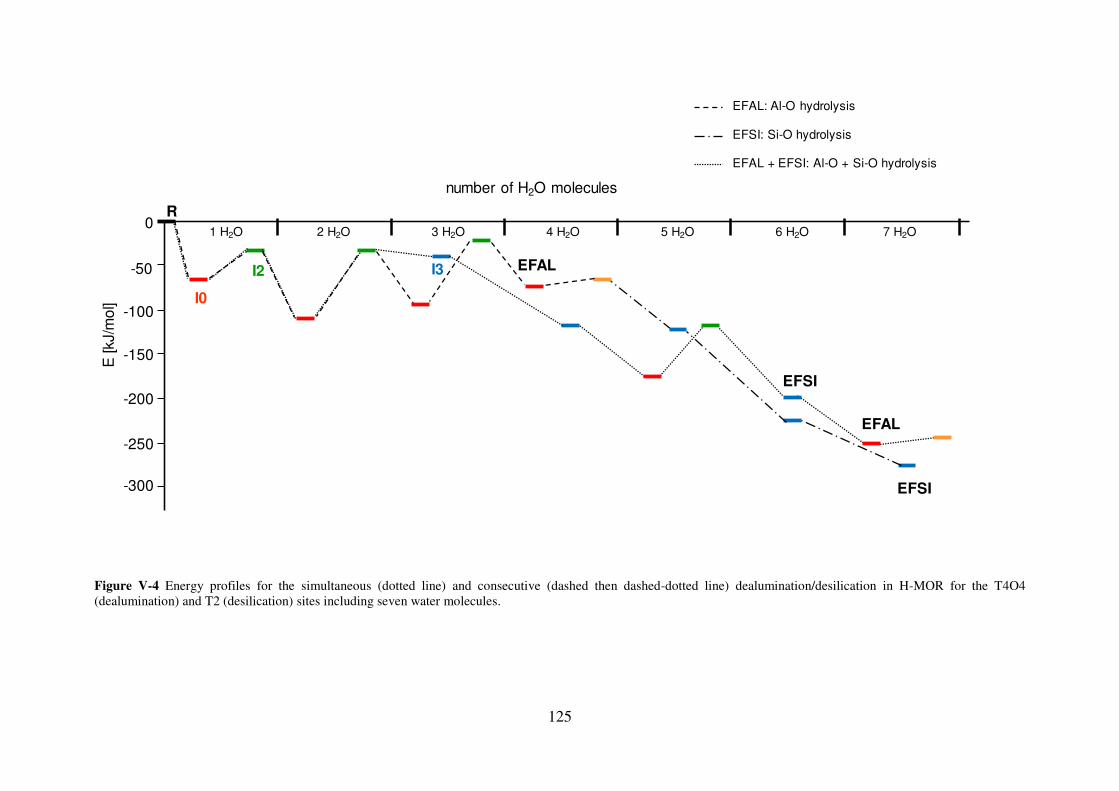
125
E [kJ/m
ol]
number of H2O molecules
I0
I2
1 H2O
-50
-100
-150
-200
-250
2 H2O 3 H2O 4 H2O
EFSI
EFAL: Al-O hydrolysis
EFSI: Si-O hydrolysis
0R
5 H2O 6 H2O 7 H2O
-300
I3 EFAL
EFAL + EFSI: Al-O + Si-O hydrolysis
EFAL
EFSI
Figure V-4 Energy profiles for the simultaneous (dotted line) and consecutive (dashed then dashed-dotted line) dealumination/desilication in H-MOR for the T4O4
(dealumination) and T2 (desilication) sites including seven water molecules.

126
3. Consecutive Dealumination and Desilication
The intermediates are depicted in Figure V-5. The pathway starts by a pure dealumination
(Figure V-4 dashed line) on the T4O4 site by hydrolysis reactions. Upon each water
adsorption on Al in anti position, which is an exothermic process (ΔU = -60 to -70 kJ/mol) a
penta-coordinated Al species I0(nH2O) is formed. Three subsequent Al-O hydrolysis reactions
via 1,2-dissociation of the water molecule on an adjacent framework oxygen atom with axial
substitution of the silanol and water adsorption of a fourth water molecule lead to a tetra-
coordinated Al, where each Al-O bond breaking is an endothermic process (ΔU = 30 to 70
kJ/mol) and leading to the formation of a tetrahedral Al(OH)3H2O EFAL, which after
desorption resides in the 12MR channel. Note, that with this mechanistic approach being a
1,2-dissociation of the water molecule with axial substitution the Al atom is slightly more
stable in a framework position I0(2H2O) comparing to a 1,2-dissociation with equatorial
substitution as presented in the preceding chapter, resulting from the missing contribution of
hydrogen bonds between silanols and hydroxyl groups of the EFAL occurring only during the
latter pathway.
Figure V-5 Intermediates for the “consecutive” dealumination and desilication pathway.
Once the Al is extracted from the zeolitic framework, in a next step we envisaged the
hydrolysis of Si-O bonds on the T2 site adjacent to the T4O4 and also located in the 12MR.
This was achieved by keeping the previous EFAL species in the vicinity in order to compare
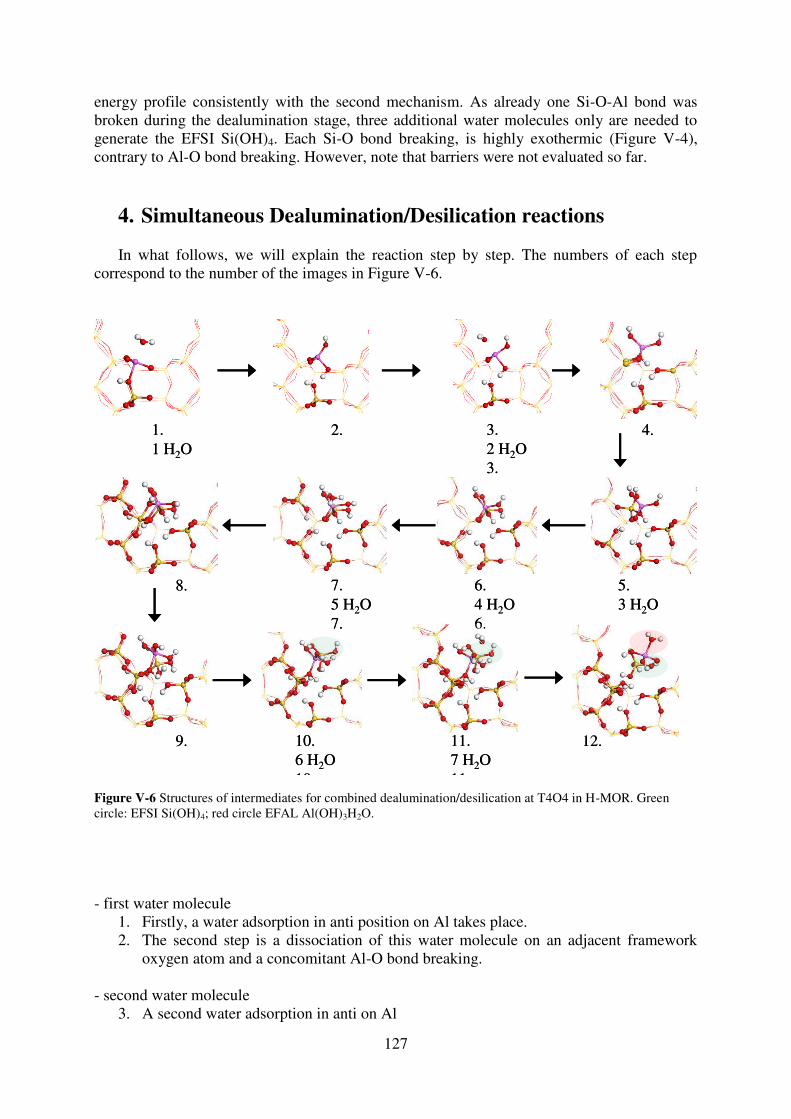
127
energy profile consistently with the second mechanism. As already one Si-O-Al bond was
broken during the dealumination stage, three additional water molecules only are needed to
generate the EFSI Si(OH)4. Each Si-O bond breaking, is highly exothermic (Figure V-4),
contrary to Al-O bond breaking. However, note that barriers were not evaluated so far.
4. Simultaneous Dealumination/Desilication reactions
In what follows, we will explain the reaction step by step. The numbers of each step
correspond to the number of the images in Figure V-6.
1.
1 H2O
2. 3.
2 H2O
3.
4.
5.
3 H2O
6.
4 H2O
6.
7.
5 H2O
7.
8.
9. 10.
6 H2O
10.
11.
7 H2O
11.
12.
1.
1 H2O
2. 3.
2 H2O
3.
4.
5.
3 H2O
6.
4 H2O
6.
7.
5 H2O
7.
8.
9. 10.
6 H2O
10.
11.
7 H2O
11.
12.
Figure V-6 Structures of intermediates for combined dealumination/desilication at T4O4 in H-MOR. Green
circle: EFSI Si(OH)4; red circle EFAL Al(OH)3H2O.
- first water molecule
1. Firstly, a water adsorption in anti position on Al takes place.
2. The second step is a dissociation of this water molecule on an adjacent framework
oxygen atom and a concomitant Al-O bond breaking.
- second water molecule
3. A second water adsorption in anti on Al
128
4. a subsequent water dissociation and an Al-O bond breaking occurs.
- third water molecule
5. The third water molecule induces a Si-O bond breaking (Si atom at T2, nearby Al) via
a dissociative water adsorption in anti on Si with a simultaneous break of this bond.
- forth water molecule:
6. At the same silicon atom, and hence the pre-EFSI, the same last mentioned reaction
took place.
- fifth water molecule
7. The fifth water molecule is adsorbed on Al (in anti position).
8. After a water dissociation on a neighbouring framework oxygen atom a vicinal
disilanol is formed, e.g. the same reaction product as for the T1O3 site in H-MOR.
Note that this step is endothermic.
9. However, due to the flexibility of this partially dislodged pre-EFAL, an inversion can
take place (i.e. Si-O and Al-O bond break) leading to the formation of an Al(OH)3.
However, this EFAL is still adsorbed on an OH-group of a silanol nest.
- sixth water molecule:
10. After a dissociative water adsorption on Si, with a simultaneous Si-O bond break, the
EFSI (Si(OH)4) is created.
- seventh water molecule:
11. A water adsorption on in anti position on Al creates the Al(OH)3H2O EFAL.
12. the desorption of the EFAL species.
5. Conclusions
The first difference between the “consecutive” versus “simultaneous” reaction paths comes by the addition of the third water molecule. For the “consecutive” path, an adsorption on Al occurred whereas for the “simultaneous” one, the first Si-O bond breaking between the
pre-EFSI and the framework took place. In the latter case, the reaction energy for the Si-O
breaking is about -10 kJ/mol and thermodynamically in the same range as a Si-O bond
breaking near an Al atom. This Si-O bond breaking took place at a non-defect site in the
zeolite. It is also worth to recall that this step involves a direct dissociation of the water
molecule with simultaneous Si-O bond breaking. In particular, no precursor of a molecular
adsorption of water occurs on the SiIV site. We suspect that the kinetic barrier should be
significantly higher than the competitive steps leading to the EFAL species.
However, once the pre-EFSI lost the first bond to the framework, a subsequent Si-O bond
break is highly exothermic (typically, -70 kJ/mol). The same can also be observed for the
“consecutive” path. This is a fundamental finding, since it shows, that the desilication
preferentially takes place at defect sites, i.e. either in the neighbouring of an Al atom, which is
partially or completely dislodged from the framework, or at defect sites created upon the
zeolite synthesis. This was inferred experimentally by Holm et al. 17
, even if desilication
conditions are very different in these experiments (desilication in aqueous alkaline medium)
and in our simulations (steaming-like).

129
At this stage it is too premature to determine which of both approaches is favoured. This
results from the fact, that a vicinal disilanol appears for the simultaneous
dealumination/desilication (figure V-6, step 8). In order to create the EFSI one has to pass
over this intermediate which is from the thermodynamic point of view less favourable. Thus,
to determine the optimal pathway, reaction barriers have to be calculated for each step.
Whatever the preferred pathway, it appears from the stability of the intermediates, that
desilication is a very favourable reaction on defect site (partially or totally dealuminated),
which supports the idea of possible extraction of EFSI in the course or during dealumination,
under steaming conditions. This supports the idea that mesopore can occur by such a
mechanism, in agreement with the earlier proposal of Marcilly.
130
References
1. W. Lutz, R. Kurzhals, G. Kryukova, D. Enke, M. Weber and D. Heidemann,
Zeitschrift für anorganische und allgemeine Chemie, 2010, 636, 1497-1505.
2. N. S. Nesterenko, F. Thibault-Starzyk, V. Montouillout, V. V. Yuschenko, C.
Fernandez, J. P. Gilson, F. Fajula and I. I. Ivanova, Microporous Mesoporous Mater.,
2004, 71, 157-166.
3. M.-C. Silaghi, C. Chizallet and P. Raybaud, Microporous Mesoporous Mater., 2014,
191, 82-96.
4. D. Verboekend, G. Vile and J. Perez-Ramirez, Adv. Funct. Mater., 2012, 22, 916-928.
5. G. Weber and M.-H. Simonot-Grange, Zeolites, 1994, 14, 433-438.
6. P. Bodart, J. B. Nagy, G. Debras, Z. Gabelica and P. a. Jacobs, J. Phys. Chem., 1986,
90, 5183-5190.
7. L. Karwacki, D. A. M. de Winter, L. R. Aramburo, M. N. Lebbink, J. A. Post, M. R.
Drury and B. M. Weckhuysen, Angew. Chem., Int. Ed., 2011, 50, 1294-1298.
8. C. Marcilly, ed., Acido-Basic Catalysis - Application to Refining and Petrochemistry,
Editions TECHNIP, 2005.
9. J. i. De dec ek, S. Sklenak, C. Li, F. Gao, J. i. Brus, Q. Zhu and T. Tatsumi, J. Phys.
Chem. C, 2009, 113, 14454-14466.
10. S. Sklenak, J. Dedecek, C. Li, B. Wichterlova, V. Gabova, M. Sierka and J. Sauer,
Phys. Chem. Chem. Phys., 2009, 11, 1237-1247.
11. S. Sklenak, J. Dedecek, C. Li, B. Wichterlová, V. Gábová, M. Sierka and J. Sauer,
Angew. Chem., Int. Ed., 2007, 46, 7286-7289.
12. N. Danilina, F. Krumeich, S. A. Castelanelli and J. A. van Bokhoven, J. Phys. Chem.
C, 2010, 114, 6640-6645.
13. J. Dedecek, D. Kaucky and B. Wichterlova, Chem. Com., 2001, 970-971.
14. B. Lu, T. Kanai, Y. Oumi and T. Sano, Journal of Porous Materials, 2006, 14, 89-96.
15. A. R. Ruiz-Salvador, R. Grau-Crespo, A. E. Gray and D. W. Lewis, J Solid State
Chem, 2013, 198, 330-336.
16. S. Malola, S. Svelle, F. L. Bleken and O. Swang, Angew. Chem., Int. Ed., 2011, 51,
652-655.
17. M. S. Holm, S. Svelle, F. Joensen, P. Beato, C. H. Christensen, S. Bordiga and M.
Bjørgen, Appl. Catal., A, 2009, 356, 23-30.
131
Conclusions and perspectives
Zeolites are crystalline microporous aluminosilicates widely used in refining,
petrochemistry and biomass conversion. However, diffusion limitation and confinement effect
can promote the formation of undesired products. The introduction of mesopores by
dealumination and/or desilication (giving birth to hierarchical zeolites) is a possible solution.
Dealumination is usually performed by steaming or leaching in acidic solution, whereas
desilication is obtained by treatment in aqueous basic media. Despite a considerable empirical
knowledge acquired over several decades regarding the optimization of synthetic procedures
leading to these mesopores, the mechanisms of the underlying reactions are poorly known at
the molecular scale. The present PhD project thus focused on the unraveling of the
mechanisms of the formation of extra-framework species, by means of periodic first-
principles periodic density functional theory (DFT corrected from dispersion contributions,
performed with the VASP code) and hybrid QM/QM (QMPOT) calculations. We focused first
and in depth on the dealumination reaction, determining relevant intermediates and transition
states for each reaction step, whereas results regarding desilication of zeolitic frameworks are
only preliminary (stability of the intermediates only were evaluated). We focused on MOR,
FAU, MFI and CHA zeotypes, and added water molecules in a step-by-step approach.
Contrary to well-admitted ideas, it appeared that promoting the first Al-O bond breaking
within a perfect zeolite framework is a non-straightforward process. Some intermediates only
can be formed with reasonable energy gain, in particular water adducts with Brønsted acid
sites (hydrogen bonding) and with Lewis acid sites (AlIV framework atoms). The latter is
favourable only when the water molecule attacks the aluminium atom in anti to the Brønsted
acid sites, which is a major finding, as this interaction mode is at the origin of the dislodgment
of Al from its framework position. A subsequent 1,2-dissociation of water on adjacent
framework oxygen with axial substitution of the silanol group leads to the first Al-O(H) bond
break. Local effects, in particular hydrogen-bonding and confinement effect, play a huge role
in the regioselectivity of the zeolite-water reaction at each stage (formation of the Al-water
bond in anti to the Brønsted acid sites, then 1,2-dissociation, then rotation of the newly
formed Al-(OH)-Si group), making reactivity prediction on structural basis rather difficult.
However, we were able to establish a Brønsted-Evans-Polanyi (BEP) relationship which will
be of great help in the future to investigate larger amounts of sites within various zeolitic
frameworks. These findings were compared to experimental features when available.
Then, full reaction pathways leading to extraframework species were established. Once
the first Al-O bond is broken and the Al atom becomes more flexible in terms of structural
changes, alternative pathways are possible. In particular, the occurrence of 1,2-dissociation of
water with equatorial substitution of Si-OH becomes competitive. Moreover, we were able to
show, that the very first Al-O bond breaking step is not always kinetically determining for the
formation of EFAL. The activation energies are within the interval of 86-114 kJ/mol for all
zeotypes studied here (excluding one MFI site), which are significantly weaker than the one
reported in the previous work by Swang et al. 1, 2
This result thus ensures the robustness of our
revised dealumination mechanisms.
In addition to the heterogeneous local effects (aforementioned), non local effects such as
confinement effects induced by van der Waals contribution are also playing a fluctuating role
in the course of demetallation till the genesis of extraframework species. So the subsequent
Al-O bond breaking steps as well as the confinement effect on an EFAL species imposed by
the zeolites cavities and channel systems represent also a driving force for Al dislodgement to
extraframework positions, which is likely to explain some experimental features. Despite a
132
strong structural heterogeneity of T sites, we attempted to build BEP relationships for the
entire dealumination pathway. The limitation of these BEP relations clearly appear from the
third water addition when local and non local effects impact differently the transition state and
its “sister” intermediates.
Finally, from the stability of intermediates obtained by this step-by-step approach, we
showed that desilication occurs preferentially near defect sites (partially or totally
dealuminated), and that dealumination/desilication pathways are more favorable than a single
dealumination, which is in good agreement with the mechanism proposal of Marcilly
regarding the genesis of mesopores by steaming.
Our work has some immediate perspectives. The BEP relationships established in the
present work could be exploited for prediction purposes, on other sites of the studied zeotypes
or on other frameworks. In particular, extending such dealumination simulation for
frameworks with higher Si/Al ratio will be of great interest. The evaluation of the impact of
the exchange cation (Na+, NH4
+, etc., instead of H
+) will also be of practical relevance.
Moreover, it will be crucial to determine transition states and activation barriers for the
desilication and dealumination/desilication pathways. Indeed, it could well be that the
thermodynamically favourable desilication intermediate are quite hard to obtain for kinetic
reasons. This is crucial also to get an atomic insight in the preliminary step of the formation of
a mesopore, linked to the propagation of the destruction of the framework.
Confinement effect on EFAL species can further be analysed by means of ab initio
molecular dynamics (AIMD) in the same spirit of Benco et al. 3 (Gmelinite) where they
analysed dynamical behaviour of EFAL Al(OH)3H2O and Al(OH)3(H2O)3 in the channel
system. They found that in the small gmelinite cage only a four coordinated Al(OH)3H2O
EFAL can be stabilized due to the small cage size whereas in the larger super cage a penta-
coordinated Al(OH)3(H2O)2 species with a loosely bond water molecule may exist. Once the
EFAL is extracted from the framework and resides adsorbed on a silanol, such an approach
might also be envisaged to study the desorption behaviour and the subsequent favoured
localisation of the EFAL in the cavity which then can be compared to experimental data on
the preferred residence of the extra-framework species in analogy to ref 4.
Also, quantifying enthalpies and entropies for each intermediate and transition state
would be an improvement to the description of the thermodynamics of the system. This will
improve the connection of our work to experimental results. In the same spirit, the calculation
of spectroscopic feature (vibration frequency, NMR chemical shifts in particular) for relevant
intermediates could be undertaken to check the relevance of our proposal with regards to
experimental observations.
Moreover, as underlined in the first chapter of the present thesis, the molecular and
step-by-step approach undertaken here will also find some limitations regarding its relevance
to the real dealumination / desilication procedure. For the steaming procedure, were water
vapour is involved, considering the effect of water pressure will require the investigation of
the presence of several water molecules at the same time, rather than a step-by-step approach.
Such collective effects will be even more crucial to take into account to simulate acid leaching
and desilication in basic aqueous media, were water plays the role of the solvent. AIMD
approaches may be compulsory to tackle these issues. Force-Field simulation tools could also
be more pragmatic for such a goal, rather than ab initio calculations, but the breaking and
formation of bonds are to be modelled accurately, which is not well rendered by usual force-
fields. Reactive force-fields on the other hand could be thought of, based on our DFT
benchmarking.
133
Concerning the mesoscale features of the final demetallated zeolite, an explicit
quantum simulation by itself is clearly out of the scope of current state-of-the-art periodic
DFT, due to the huge cell sizes required (probably several thousands of atoms). It should be
combined to mean-field or statistic approaches better designed to answer part of the questions
raised by mesopore formation. For instance, Kinetic Monte Carlo (KMC) calculations were
undertaken by Ban et al.5 assuming arbitrary rate constants for aluminium removal, silicon
migration and self-healing, according to a simplified Marcilly’s mechanism. Such an approach could be refined by including relevant barriers for each step of the reaction, such as
those estimated in the present work. Thus, the combination of KMC parameterized with
sufficient DFT data may enable to overcome the multi-scale problem and provide a complete
dynamic understanding of the formation of mesopores and possible extra-framework species
accumulation. However, for that purpose, we still need first to make our DFT database more
exhaustive on the relevant elementary steps.
Our work could also motivate new experimental research programs. Indeed, there are
very few studies focusing on the very first steps, at the molecular scale, of demetallation
reactions. This is due to the difficult characterization of Al location within zeolitic
frameworks and their in situ or operando monitoring in the course of the reaction. Taking
advantage of the location of Al atoms within the MFI framework achieved by van Bokhoven
et al. 6, the monitoring of the position of the Al atoms and of their environment could be
performed, in the spirit of ref. 4. Extracting demetallation intrinsic kinetics, in the spirit of ref.
7, would be a major advance in the field.
References
1. T. Fjermestad, S. Svelle and O. Swang, J. Phys. Chem. C, 2013, 117, 13442-13451.
2. S. Malola, S. Svelle, F. L. Bleken and O. Swang, Angew. Chem., Int. Ed., 2011, 51,
652-655.
3. L. Benco, T. Demuth, J. Hafner, F. Hutschka and H. Toulhoat, J. Catal., 2002, 209,
480-488.
4. G. Agostini, C. Lamberti, L. Palin, M. Milanesio, N. Danilina, B. Xu, M. Janousch
and J. a. van Bokhoven, J. Am. Chem. Soc., 2010, 132, 667-678.
5. S. Ban, a. N. C. van Laak, J. Landers, a. V. Neimark, P. E. de Jongh, K. P. de Jong and
T. J. H. Vlugt, J. Phys. Chem. C, 2010, 114, 2056-2065.
6. J. a. van Bokhoven, T.-L. Lee, M. Drakopoulos, C. Lamberti, S. Thiess and J.
Zegenhagen, Nat. Mater., 2008, 7, 551-555.
7. L. H. Ong, M. Dömök, R. Olindo, A. C. van Veen and J. A. Lercher, Microporous
Mesoporous Mater., 2012, 164, 9-20.

134

135
APPENDIX
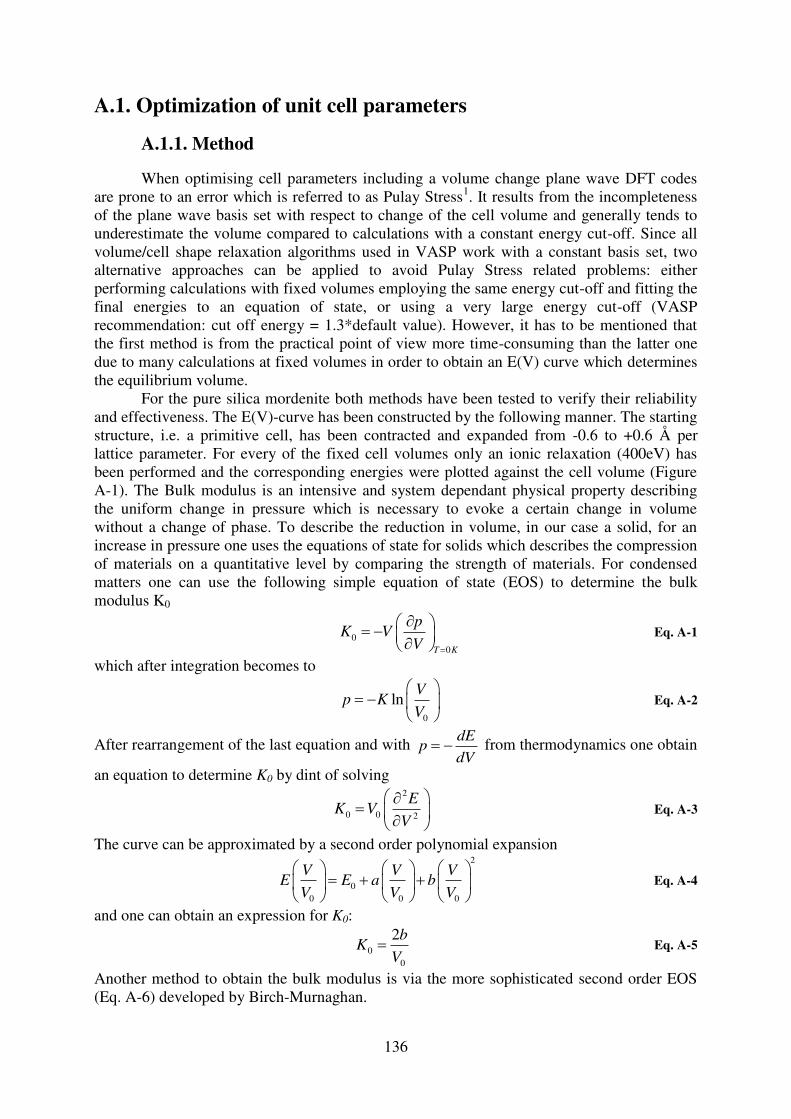
136
A.1. Optimization of unit cell parameters
A.1.1. Method
When optimising cell parameters including a volume change plane wave DFT codes are prone to an error which is referred to as Pulay Stress1. It results from the incompleteness of the plane wave basis set with respect to change of the cell volume and generally tends to underestimate the volume compared to calculations with a constant energy cut-off. Since all volume/cell shape relaxation algorithms used in VASP work with a constant basis set, two alternative approaches can be applied to avoid Pulay Stress related problems: either performing calculations with fixed volumes employing the same energy cut-off and fitting the final energies to an equation of state, or using a very large energy cut-off (VASP recommendation: cut off energy = 1.3*default value). However, it has to be mentioned that the first method is from the practical point of view more time-consuming than the latter one due to many calculations at fixed volumes in order to obtain an E(V) curve which determines the equilibrium volume.
For the pure silica mordenite both methods have been tested to verify their reliability and effectiveness. The E(V)-curve has been constructed by the following manner. The starting structure, i.e. a primitive cell, has been contracted and expanded from -0.6 to +0.6 Å per lattice parameter. For every of the fixed cell volumes only an ionic relaxation (400eV) has been performed and the corresponding energies were plotted against the cell volume (Figure A-1). The Bulk modulus is an intensive and system dependant physical property describing the uniform change in pressure which is necessary to evoke a certain change in volume without a change of phase. To describe the reduction in volume, in our case a solid, for an increase in pressure one uses the equations of state for solids which describes the compression of materials on a quantitative level by comparing the strength of materials. For condensed matters one can use the following simple equation of state (EOS) to determine the bulk modulus K0
00T K
pK V
V
Eq. A-1
which after integration becomes to
0
lnV
p KV
Eq. A-2
After rearrangement of the last equation and with dE
pdV
from thermodynamics one obtain
an equation to determine K0 by dint of solving 2
0 0 2
EK V
V
Eq. A-3
The curve can be approximated by a second order polynomial expansion 2
00 0 0
V V VE E a b
V V V
Eq. A-4
and one can obtain an expression for K0:
00
2bK
V Eq. A-5
Another method to obtain the bulk modulus is via the more sophisticated second order EOS (Eq. A-6) developed by Birch-Murnaghan.
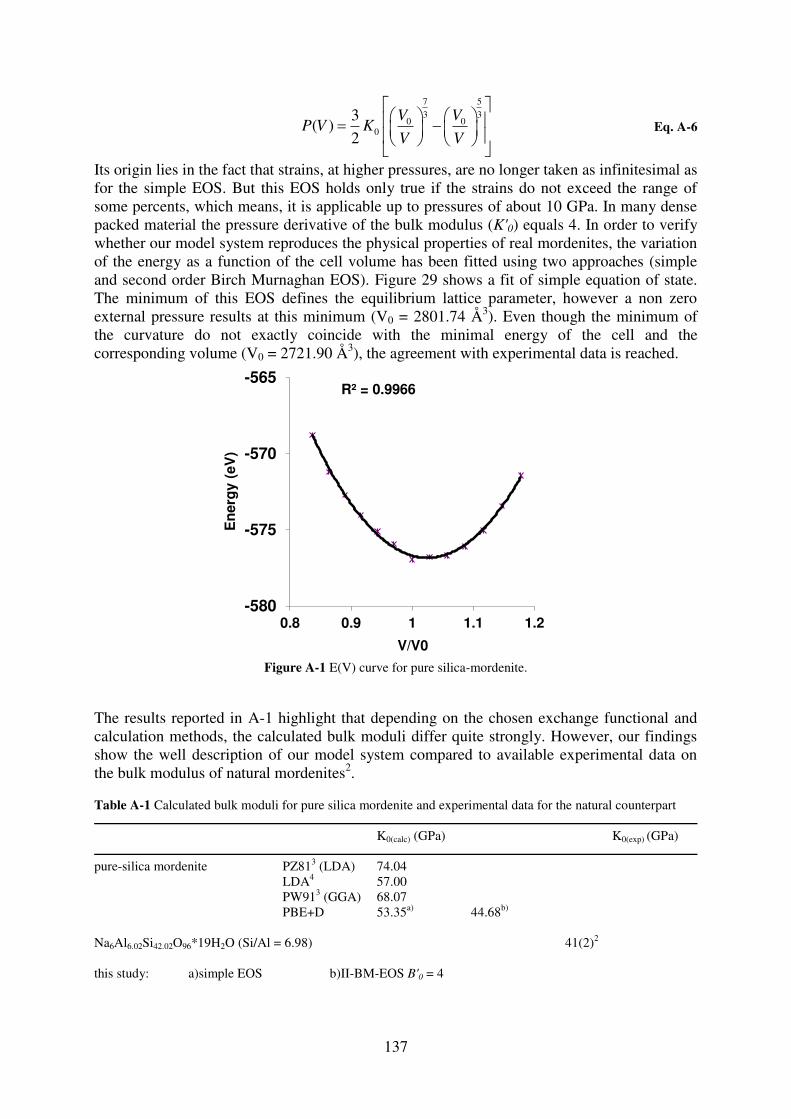
137
7 53 3
0 00
3( )
2
V VP V K
V V
Eq. A-6
Its origin lies in the fact that strains, at higher pressures, are no longer taken as infinitesimal as for the simple EOS. But this EOS holds only true if the strains do not exceed the range of some percents, which means, it is applicable up to pressures of about 10 GPa. In many dense packed material the pressure derivative of the bulk modulus (K'0) equals 4. In order to verify whether our model system reproduces the physical properties of real mordenites, the variation of the energy as a function of the cell volume has been fitted using two approaches (simple and second order Birch Murnaghan EOS). Figure 29 shows a fit of simple equation of state. The minimum of this EOS defines the equilibrium lattice parameter, however a non zero external pressure results at this minimum (V0 = 2801.74 Å3). Even though the minimum of the curvature do not exactly coincide with the minimal energy of the cell and the corresponding volume (V0 = 2721.90 Å3), the agreement with experimental data is reached.
Figure A-1 E(V) curve for pure silica-mordenite.
The results reported in A-1 highlight that depending on the chosen exchange functional and calculation methods, the calculated bulk moduli differ quite strongly. However, our findings show the well description of our model system compared to available experimental data on the bulk modulus of natural mordenites2. Table A-1 Calculated bulk moduli for pure silica mordenite and experimental data for the natural counterpart
K0(calc) (GPa) K0(exp) (GPa)
pure-silica mordenite PZ813 (LDA) 74.04 LDA4 57.00 PW913 (GGA) 68.07 PBE+D 53.35a) 44.68b)
Na6Al6.02Si42.02O96*19H2O (Si/Al = 6.98) 41(2)2 this study: a)simple EOS b)II-BM-EOS B'0 = 4
R² = 0.9966
-580
-575
-570
-565
0.8 0.9 1 1.1 1.2
En
erg
y (
eV
)
V/V0
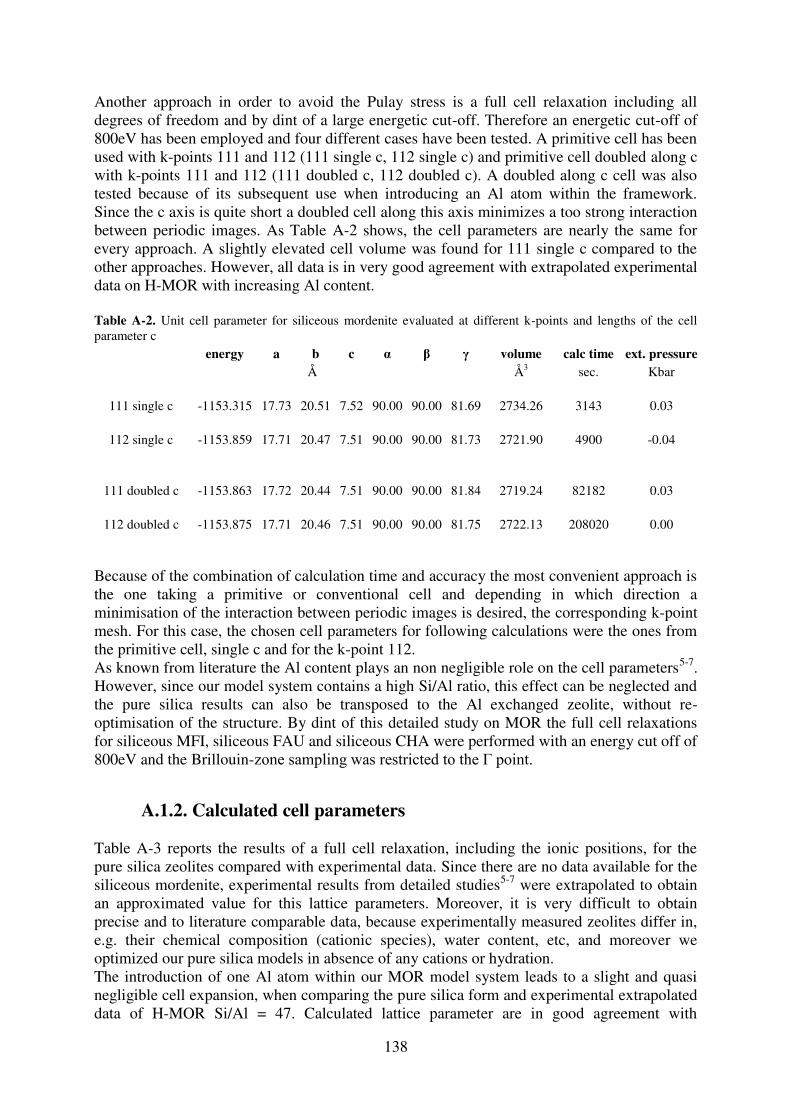
138
Another approach in order to avoid the Pulay stress is a full cell relaxation including all degrees of freedom and by dint of a large energetic cut-off. Therefore an energetic cut-off of 800eV has been employed and four different cases have been tested. A primitive cell has been used with k-points 111 and 112 (111 single c, 112 single c) and primitive cell doubled along c with k-points 111 and 112 (111 doubled c, 112 doubled c). A doubled along c cell was also tested because of its subsequent use when introducing an Al atom within the framework. Since the c axis is quite short a doubled cell along this axis minimizes a too strong interaction between periodic images. As Table A-2 shows, the cell parameters are nearly the same for every approach. A slightly elevated cell volume was found for 111 single c compared to the other approaches. However, all data is in very good agreement with extrapolated experimental data on H-MOR with increasing Al content. Table A-2. Unit cell parameter for siliceous mordenite evaluated at different k-points and lengths of the cell parameter c
energy a b c α volume calc time ext. pressure Å Å3 sec. Kbar
111 single c -1153.315 17.73 20.51 7.52 90.00 90.00 81.69 2734.26 3143 0.03
112 single c -1153.859 17.71 20.47 7.51 90.00 90.00 81.73 2721.90 4900 -0.04
111 doubled c -1153.863 17.72 20.44 7.51 90.00 90.00 81.84 2719.24 82182 0.03
112 doubled c -1153.875 17.71 20.46 7.51 90.00 90.00 81.75 2722.13 208020 0.00 Because of the combination of calculation time and accuracy the most convenient approach is the one taking a primitive or conventional cell and depending in which direction a minimisation of the interaction between periodic images is desired, the corresponding k-point mesh. For this case, the chosen cell parameters for following calculations were the ones from the primitive cell, single c and for the k-point 112. As known from literature the Al content plays an non negligible role on the cell parameters5-7. However, since our model system contains a high Si/Al ratio, this effect can be neglected and the pure silica results can also be transposed to the Al exchanged zeolite, without re-optimisation of the structure. By dint of this detailed study on MOR the full cell relaxations for siliceous MFI, siliceous FAU and siliceous CHA were performed with an energy cut off of 800eV and the Brillouin-zone sampling was restricted to the Γ point.
A.1.2. Calculated cell parameters Table A-3 reports the results of a full cell relaxation, including the ionic positions, for the pure silica zeolites compared with experimental data. Since there are no data available for the siliceous mordenite, experimental results from detailed studies5-7 were extrapolated to obtain an approximated value for this lattice parameters. Moreover, it is very difficult to obtain precise and to literature comparable data, because experimentally measured zeolites differ in, e.g. their chemical composition (cationic species), water content, etc, and moreover we optimized our pure silica models in absence of any cations or hydration. The introduction of one Al atom within our MOR model system leads to a slight and quasi negligible cell expansion, when comparing the pure silica form and experimental extrapolated data of H-MOR Si/Al = 47. Calculated lattice parameter are in good agreement with
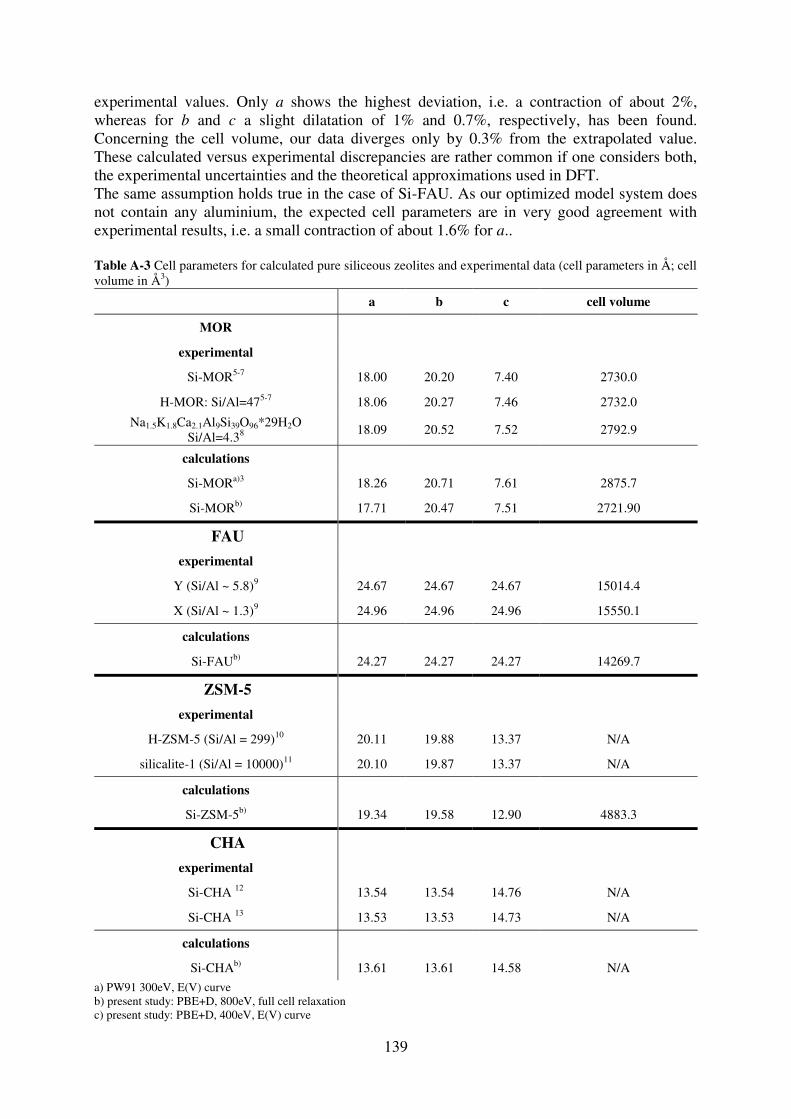
139
experimental values. Only a shows the highest deviation, i.e. a contraction of about 2%, whereas for b and c a slight dilatation of 1% and 0.7%, respectively, has been found. Concerning the cell volume, our data diverges only by 0.3% from the extrapolated value. These calculated versus experimental discrepancies are rather common if one considers both, the experimental uncertainties and the theoretical approximations used in DFT. The same assumption holds true in the case of Si-FAU. As our optimized model system does not contain any aluminium, the expected cell parameters are in very good agreement with experimental results, i.e. a small contraction of about 1.6% for a.. Table A-3 Cell parameters for calculated pure siliceous zeolites and experimental data (cell parameters in Å; cell volume in Å3)
a b c cell volume
MOR
experimental
Si-MOR5-7 18.00 20.20 7.40 2730.0
H-MOR: Si/Al=475-7 18.06 20.27 7.46 2732.0
Na1.5K1.8Ca2.1Al9Si39O96*29H2O Si/Al=4.38
18.09 20.52 7.52 2792.9
calculations
Si-MORa)3 18.26 20.71 7.61 2875.7
Si-MORb) 17.71 20.47 7.51 2721.90
FAU
experimental
Y (Si/Al ~ 5.8)9 24.67 24.67 24.67 15014.4
X (Si/Al ~ 1.3)9 24.96 24.96 24.96 15550.1
calculations
Si-FAUb) 24.27 24.27 24.27 14269.7
ZSM-5
experimental
H-ZSM-5 (Si/Al = 299)10 20.11 19.88 13.37 N/A
silicalite-1 (Si/Al = 10000)11 20.10 19.87 13.37 N/A
calculations
Si-ZSM-5b) 19.34 19.58 12.90 4883.3
CHA
experimental
Si-CHA 12 13.54 13.54 14.76 N/A
Si-CHA 13 13.53 13.53 14.73 N/A
calculations
Si-CHAb) 13.61 13.61 14.58 N/A
a) PW91 300eV, E(V) curve b) present study: PBE+D, 800eV, full cell relaxation c) present study: PBE+D, 400eV, E(V) curve
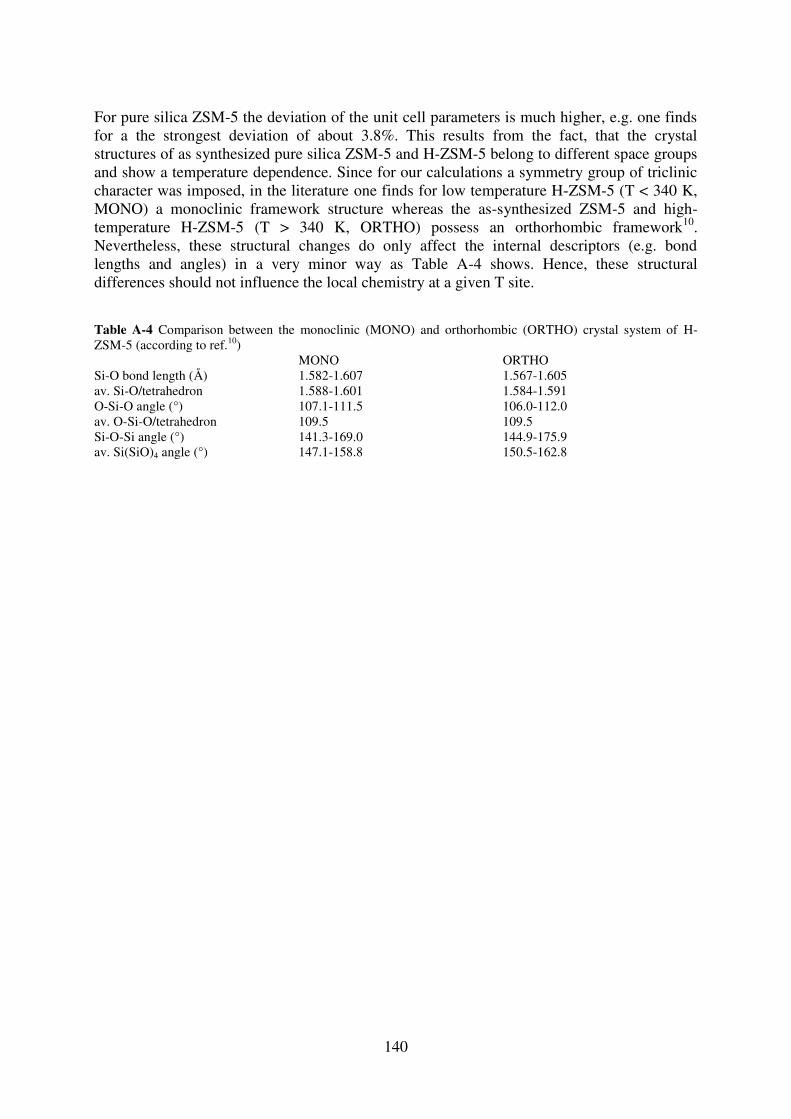
140
For pure silica ZSM-5 the deviation of the unit cell parameters is much higher, e.g. one finds for a the strongest deviation of about 3.8%. This results from the fact, that the crystal structures of as synthesized pure silica ZSM-5 and H-ZSM-5 belong to different space groups and show a temperature dependence. Since for our calculations a symmetry group of triclinic character was imposed, in the literature one finds for low temperature H-ZSM-5 (T < 340 K, MONO) a monoclinic framework structure whereas the as-synthesized ZSM-5 and high-temperature H-ZSM-5 (T > 340 K, ORTHO) possess an orthorhombic framework10. Nevertheless, these structural changes do only affect the internal descriptors (e.g. bond lengths and angles) in a very minor way as Table A-4 shows. Hence, these structural differences should not influence the local chemistry at a given T site. Table A-4 Comparison between the monoclinic (MONO) and orthorhombic (ORTHO) crystal system of H-ZSM-5 (according to ref.10) MONO ORTHO Si-O bond length (Å) 1.582-1.607 1.567-1.605 av. Si-O/tetrahedron 1.588-1.601 1.584-1.591 O-Si-O angle (°) 107.1-111.5 106.0-112.0 av. O-Si-O/tetrahedron 109.5 109.5 Si-O-Si angle (°) 141.3-169.0 144.9-175.9 av. Si(SiO)4 angle (°) 147.1-158.8 150.5-162.8
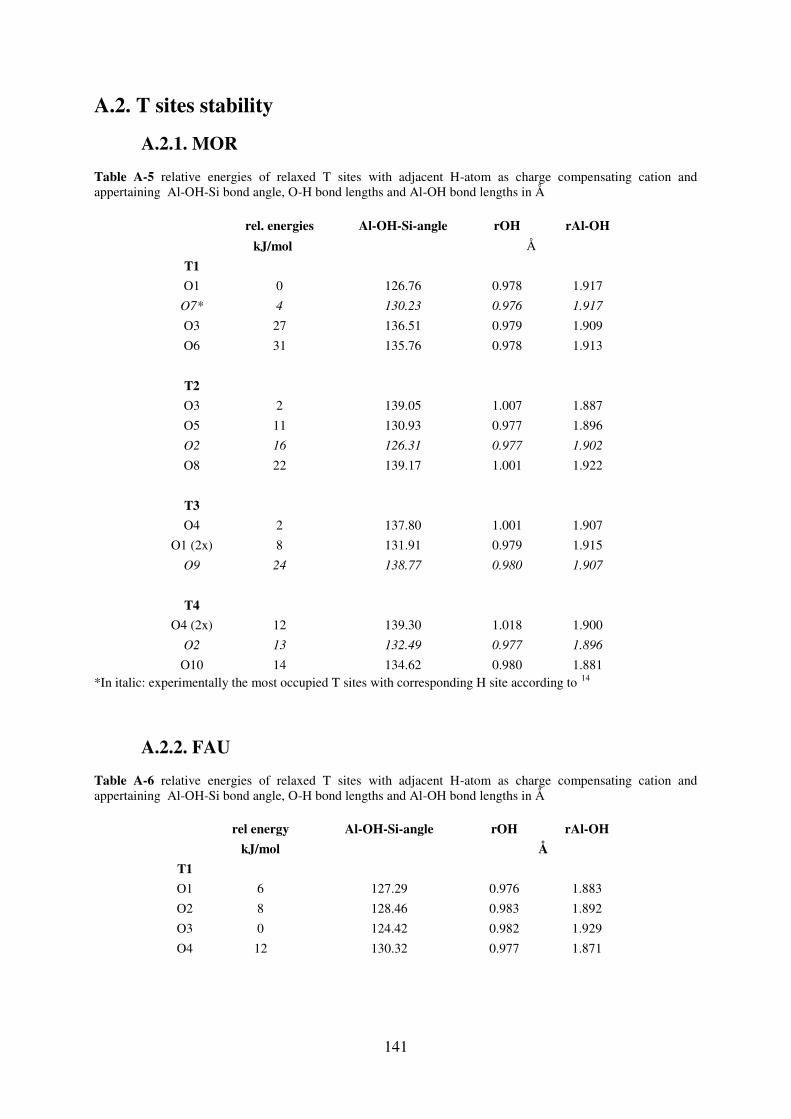
141
A.2. T sites stability
A.2.1. MOR Table A-5 relative energies of relaxed T sites with adjacent H-atom as charge compensating cation and appertaining Al-OH-Si bond angle, O-H bond lengths and Al-OH bond lengths in Å
rel. energies Al-OH-Si-angle rOH rAl-OH
kJ/mol Å
T1
O1 0 126.76 0.978 1.917
O7* 4 130.23 0.976 1.917
O3 27 136.51 0.979 1.909
O6 31 135.76 0.978 1.913
T2
O3 2 139.05 1.007 1.887
O5 11 130.93 0.977 1.896
O2 16 126.31 0.977 1.902
O8 22 139.17 1.001 1.922
T3
O4 2 137.80 1.001 1.907
O1 (2x) 8 131.91 0.979 1.915
O9 24 138.77 0.980 1.907
T4
O4 (2x) 12 139.30 1.018 1.900
O2 13 132.49 0.977 1.896
O10 14 134.62 0.980 1.881 *In italic: experimentally the most occupied T sites with corresponding H site according to 14
A.2.2. FAU Table A-6 relative energies of relaxed T sites with adjacent H-atom as charge compensating cation and appertaining Al-OH-Si bond angle, O-H bond lengths and Al-OH bond lengths in Å
rel energy Al-OH-Si-angle rOH rAl-OH
kJ/mol Å
T1
O1 6 127.29 0.976 1.883
O2 8 128.46 0.983 1.892
O3 0 124.42 0.982 1.929
O4 12 130.32 0.977 1.871
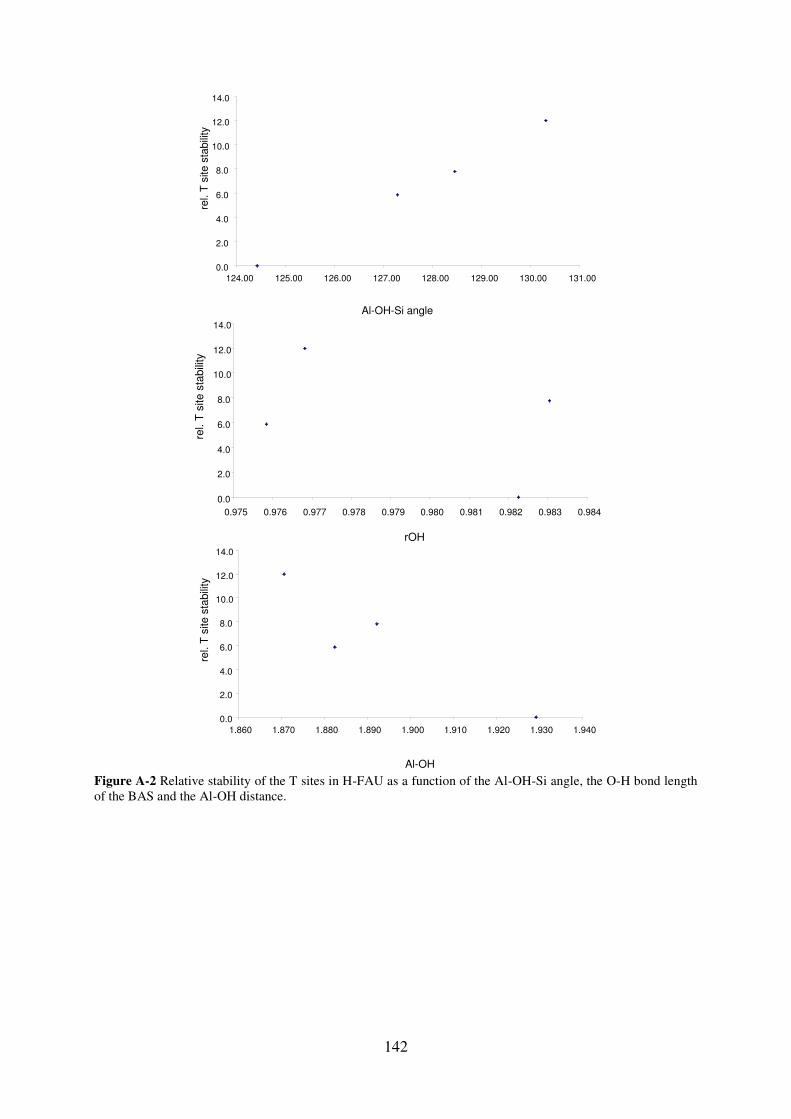
142
Figure A-2 Relative stability of the T sites in H-FAU as a function of the Al-OH-Si angle, the O-H bond length of the BAS and the Al-OH distance.
0.0
2.0
4.0
6.0
8.0
10.0
12.0
14.0
124.00 125.00 126.00 127.00 128.00 129.00 130.00 131.00
rel. T
site s
tabili
ty
Al-OH-Si angle
0.0
2.0
4.0
6.0
8.0
10.0
12.0
14.0
0.975 0.976 0.977 0.978 0.979 0.980 0.981 0.982 0.983 0.984
rel. T
site s
tabili
ty
rOH
0.0
2.0
4.0
6.0
8.0
10.0
12.0
14.0
1.860 1.870 1.880 1.890 1.900 1.910 1.920 1.930 1.940
rel. T
site s
tabili
ty
Al-OH
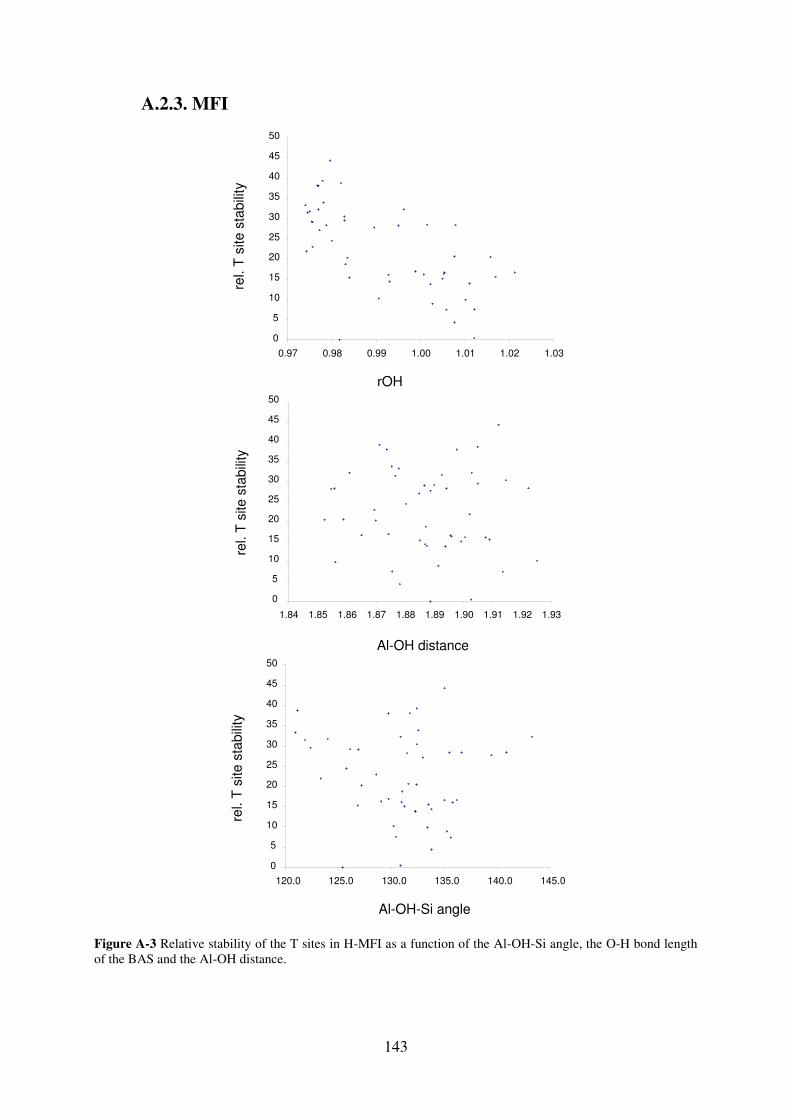
143
A.2.3. MFI
Figure A-3 Relative stability of the T sites in H-MFI as a function of the Al-OH-Si angle, the O-H bond length of the BAS and the Al-OH distance.
rel. T
site s
tabili
ty
rOH
0.97 0.98 0.99 1.00 1.01 1.02 1.03
0
5
10
15
20
25
30
35
40
45
50
rel. T
site s
tabili
ty
Al-OH distance
1.84 1.85 1.86 1.87 1.88 1.89 1.90 1.91 1.92 1.93
0
5
10
15
20
25
30
35
40
45
50
rel. T
site s
tabili
ty
Al-OH-Si angle
0
5
10
15
20
25
30
35
40
45
50
120.0 125.0 130.0 135.0 140.0 145.0
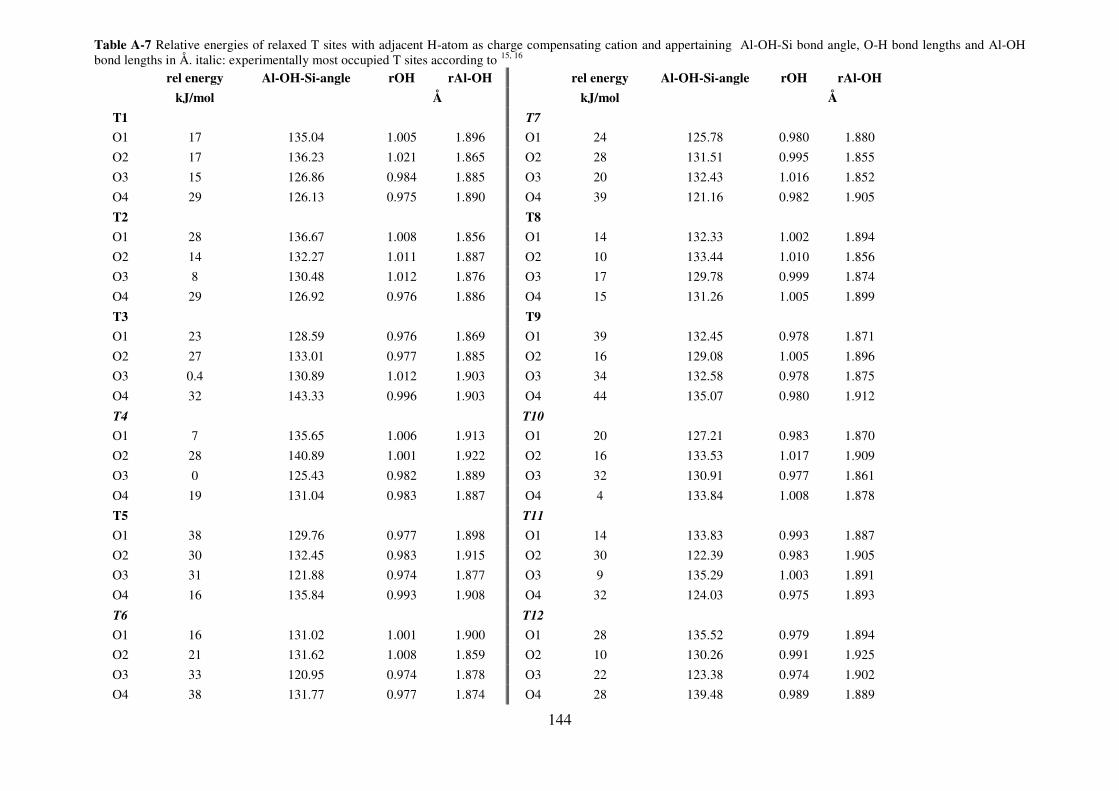
144
Table A-7 Relative energies of relaxed T sites with adjacent H-atom as charge compensating cation and appertaining Al-OH-Si bond angle, O-H bond lengths and Al-OH bond lengths in Å. italic: experimentally most occupied T sites according to 15, 16
rel energy Al-OH-Si-angle rOH rAl-OH rel energy Al-OH-Si-angle rOH rAl-OH kJ/mol Å kJ/mol Å
T1 T7 O1 17 135.04 1.005 1.896 O1 24 125.78 0.980 1.880 O2 17 136.23 1.021 1.865 O2 28 131.51 0.995 1.855 O3 15 126.86 0.984 1.885 O3 20 132.43 1.016 1.852 O4 29 126.13 0.975 1.890 O4 39 121.16 0.982 1.905 T2 T8 O1 28 136.67 1.008 1.856 O1 14 132.33 1.002 1.894 O2 14 132.27 1.011 1.887 O2 10 133.44 1.010 1.856 O3 8 130.48 1.012 1.876 O3 17 129.78 0.999 1.874 O4 29 126.92 0.976 1.886 O4 15 131.26 1.005 1.899 T3 T9 O1 23 128.59 0.976 1.869 O1 39 132.45 0.978 1.871 O2 27 133.01 0.977 1.885 O2 16 129.08 1.005 1.896 O3 0.4 130.89 1.012 1.903 O3 34 132.58 0.978 1.875 O4 32 143.33 0.996 1.903 O4 44 135.07 0.980 1.912 T4 T10 O1 7 135.65 1.006 1.913 O1 20 127.21 0.983 1.870 O2 28 140.89 1.001 1.922 O2 16 133.53 1.017 1.909 O3 0 125.43 0.982 1.889 O3 32 130.91 0.977 1.861 O4 19 131.04 0.983 1.887 O4 4 133.84 1.008 1.878 T5 T11 O1 38 129.76 0.977 1.898 O1 14 133.83 0.993 1.887 O2 30 132.45 0.983 1.915 O2 30 122.39 0.983 1.905 O3 31 121.88 0.974 1.877 O3 9 135.29 1.003 1.891 O4 16 135.84 0.993 1.908 O4 32 124.03 0.975 1.893 T6 T12 O1 16 131.02 1.001 1.900 O1 28 135.52 0.979 1.894 O2 21 131.62 1.008 1.859 O2 10 130.26 0.991 1.925 O3 33 120.95 0.974 1.878 O3 22 123.38 0.974 1.902 O4 38 131.77 0.977 1.874 O4 28 139.48 0.989 1.889

145
A.3. First Al-O/Si-O bond breaking including one water molecule: exhaustive investigation of plausible intermediates
Figure A-4 displays an exhaustive mechanistic approach for the initiation of the first Al-O/Si-O bond breaking. These interaction modes were tested on one T site within MOR (T4O4) and one T site within MFI (T10O2) which are: water molecular – non dissociative -adsorption on
a) BAS (Brønsted acid site) b) Si in the vicinity of Al; without bond breaking c) 1. on Al in non-anti and 2. in anti position to the proton; without bond breaking d) Si in the vicinity of Al; with Si-O bond breaking e) Al; with Al-O bond breaking
water dissociation on f) Si-O-Si; without bond breaking g) Si-O-Si; with bond breaking h) Si-O-Al; without bond breaking i) Si-O-Al; with bond breaking
water dissociation with formation of vicinal disilanol j) in the vicinity of the BAS k) within the BAS
Their thermodynamic stabilities are presented in Table A-8. Analysis of each result is provided hereafter.
Figure A-4 Envisaged interaction modes (red: non-dissociative water adsorption; green: dissociative water adsorption; blue: vicinal disilanol) between one water molecule and a Al/Si atom within the zeolite framework, initiating an Al-O/Si-O bond breaking.
non-dissociative water adsorptionnon-dissociative water adsorption
dissociative water adsorption (with hydrolysis)dissociative water adsorption (with hydrolysis) vicinal disilanolvicinal disilanol
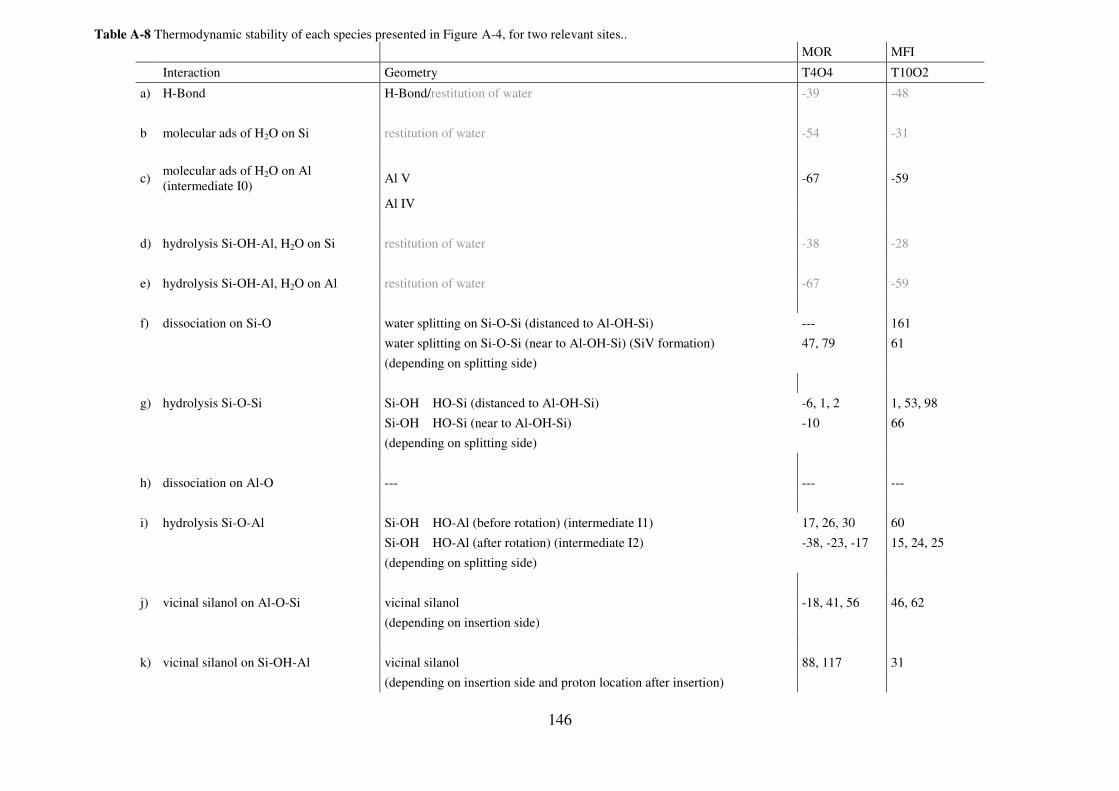
146
Table A-8 Thermodynamic stability of each species presented in Figure A-4, for two relevant sites..
MOR MFI
Interaction Geometry T4O4 T10O2
a) H-Bond H-Bond/restitution of water -39 -48
b molecular ads of H2O on Si restitution of water -54 -31
c) molecular ads of H2O on Al (intermediate I0)
Al V -67 -59
Al IV
d) hydrolysis Si-OH-Al, H2O on Si restitution of water -38 -28
e) hydrolysis Si-OH-Al, H2O on Al restitution of water -67 -59
f) dissociation on Si-O water splitting on Si-O-Si (distanced to Al-OH-Si) --- 161
water splitting on Si-O-Si (near to Al-OH-Si) (SiV formation) 47, 79 61
(depending on splitting side)
g) hydrolysis Si-O-Si Si-OH HO-Si (distanced to Al-OH-Si) -6, 1, 2 1, 53, 98
Si-OH HO-Si (near to Al-OH-Si) -10 66
(depending on splitting side)
h) dissociation on Al-O --- --- ---
i) hydrolysis Si-O-Al Si-OH HO-Al (before rotation) (intermediate I1) 17, 26, 30 60
Si-OH HO-Al (after rotation) (intermediate I2) -38, -23, -17 15, 24, 25
(depending on splitting side)
j) vicinal silanol on Al-O-Si vicinal silanol -18, 41, 56 46, 62
(depending on insertion side)
k) vicinal silanol on Si-OH-Al vicinal silanol 88, 117 31
(depending on insertion side and proton location after insertion)
147
a) If the proton is located in such a way, that it points into a small cavity (MOR: T4O4; MFI: T10O2) no water adsorption can take place on the BAS and the water is restituted in the pore in a physisorbed state. b) Although there is enough space for the stay of a water molecule on the Si atom of T4O4 in H-MOR (water pointing in the 8 MRc) the release of a water molecule is observed, for any molecular adsorption of water on Si. This observation holds also true for the other two T sites. This is an illustration of the intrinsic peculiar stability of SiIV with regards to SiV. c) 1. By adsorbing the water molecule on any other direction than anti to the Brønsted acid site, water desorbs from the Al atom and resides within the cavities being physisorbed. In fact, this observation holds true for any other T site. 2. This interaction mode is the most favourable initiation point leading to the first Al-O bond breaking. The adsorption energy can in some cases be as high as a water adsorption on a BAS (Table S1). However, the stability and existence of such an AlIV or AlV species depends on: sterical constraints, i.e. an unhindered attack on the Al atom where the water molecule does not reside in a small cavity where the interaction water-cavity becomes unfavourable hydrogen bonding; i.e. the adsorbed water molecule and the silanol moiety can be stabilised by hydrogen bonds with framework oxygen atoms d) No stable product, i.e. Si-OH2, could be observed. The water molecule was desorbed within the cavity. e) This product only occurs if "sterical constraints" and "hydrogen bonding", as explained in c) 2., are applicable. Else, no Al-O(H) bond breaking was observed. f) To analyse the water dissociation on Si-O-Si and to check whether there is an energetic correlation to the Al distance, two possibilities were analysed. First, a water dissociation at a symmetry equivalent T site (in the Si/Al exchange zeolite) distanced to the Al atom was investigated. Second, the same reaction on a Si-O-Si bond in the near proximity of the Al atom. distanced to Al-O(H)-Si: Water splitting on a Si-O-Si bond distanced to T4O4 in H-MOR is not possible but results in a water recombination within the cavities. Contrary to T4O4, a water splitting at T10O2 in H-ZSM-5 was found but appears to be highly unfavourable (Table S1). near Al-O(H)-Si: However, if the dissociation takes place at a Si-O-Si bond in the near proximity to the Al atom, the reaction energy is still endothermic but less than for a bond breaking distanced to Al-O(H)-Si. The high energy decrease compared to the dissociation distanced to the Al results from stronger hydrogen bonds with framework oxygen atoms in the proximity of the Al. g) The reaction products strongly depends on the T sites within the zeolite and the way the water molecule is split. Only a water dissociation onto an Si-O-Si in anti position (via proton jump) leads to a bond breaking with the framework (Figure S3). The water molecule is split in such as a silanol group is formed on the backside of the second one. Otherwise all other
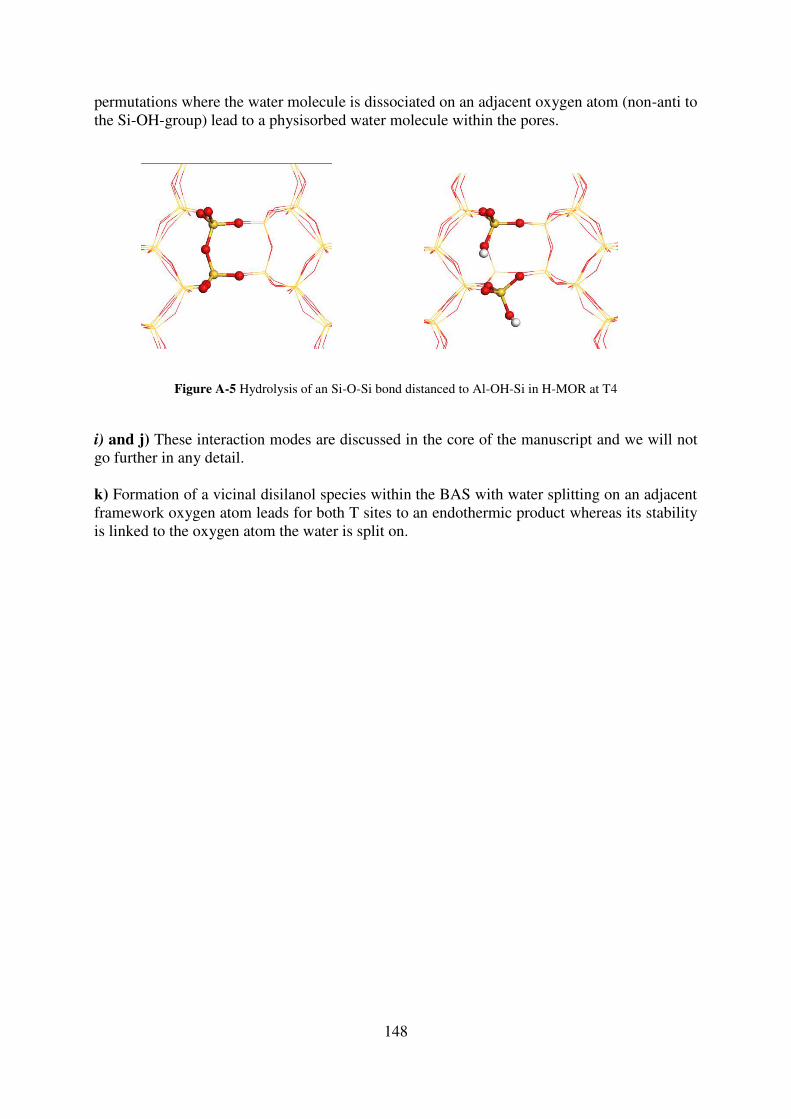
148
permutations where the water molecule is dissociated on an adjacent oxygen atom (non-anti to the Si-OH-group) lead to a physisorbed water molecule within the pores.
Figure A-5 Hydrolysis of an Si-O-Si bond distanced to Al-OH-Si in H-MOR at T4
i) and j) These interaction modes are discussed in the core of the manuscript and we will not go further in any detail. k) Formation of a vicinal disilanol species within the BAS with water splitting on an adjacent framework oxygen atom leads for both T sites to an endothermic product whereas its stability is linked to the oxygen atom the water is split on.
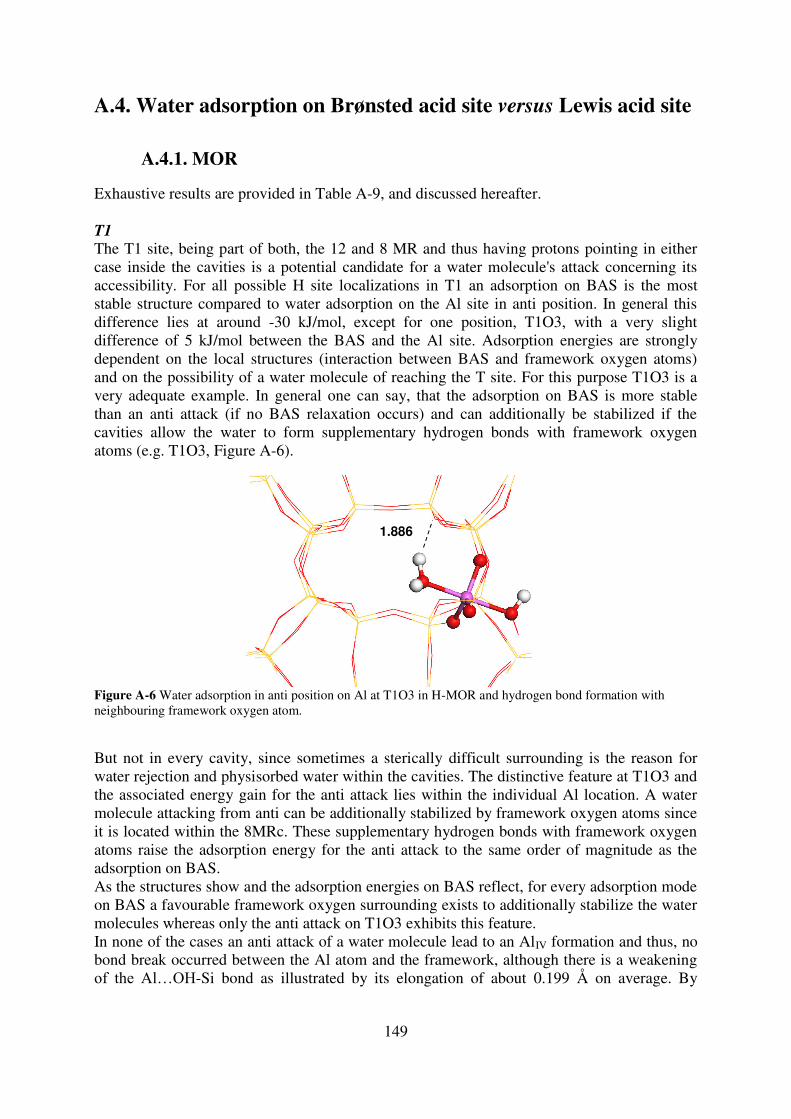
149
A.4. Water adsorption on Brønsted acid site versus Lewis acid site
A.4.1. MOR Exhaustive results are provided in Table A-9, and discussed hereafter. T1 The T1 site, being part of both, the 12 and 8 MR and thus having protons pointing in either case inside the cavities is a potential candidate for a water molecule's attack concerning its accessibility. For all possible H site localizations in T1 an adsorption on BAS is the most stable structure compared to water adsorption on the Al site in anti position. In general this difference lies at around -30 kJ/mol, except for one position, T1O3, with a very slight difference of 5 kJ/mol between the BAS and the Al site. Adsorption energies are strongly dependent on the local structures (interaction between BAS and framework oxygen atoms) and on the possibility of a water molecule of reaching the T site. For this purpose T1O3 is a very adequate example. In general one can say, that the adsorption on BAS is more stable than an anti attack (if no BAS relaxation occurs) and can additionally be stabilized if the cavities allow the water to form supplementary hydrogen bonds with framework oxygen atoms (e.g. T1O3, Figure A-6).
Figure A-6 Water adsorption in anti position on Al at T1O3 in H-MOR and hydrogen bond formation with neighbouring framework oxygen atom. But not in every cavity, since sometimes a sterically difficult surrounding is the reason for water rejection and physisorbed water within the cavities. The distinctive feature at T1O3 and the associated energy gain for the anti attack lies within the individual Al location. A water molecule attacking from anti can be additionally stabilized by framework oxygen atoms since it is located within the 8MRc. These supplementary hydrogen bonds with framework oxygen atoms raise the adsorption energy for the anti attack to the same order of magnitude as the adsorption on BAS. As the structures show and the adsorption energies on BAS reflect, for every adsorption mode on BAS a favourable framework oxygen surrounding exists to additionally stabilize the water molecules whereas only the anti attack on T1O3 exhibits this feature. In none of the cases an anti attack of a water molecule lead to an AlIV formation and thus, no bond break occurred between the Al atom and the framework, although there is a weakening of the Al…OH-Si bond as illustrated by its elongation of about 0.199 Å on average. By
1.886
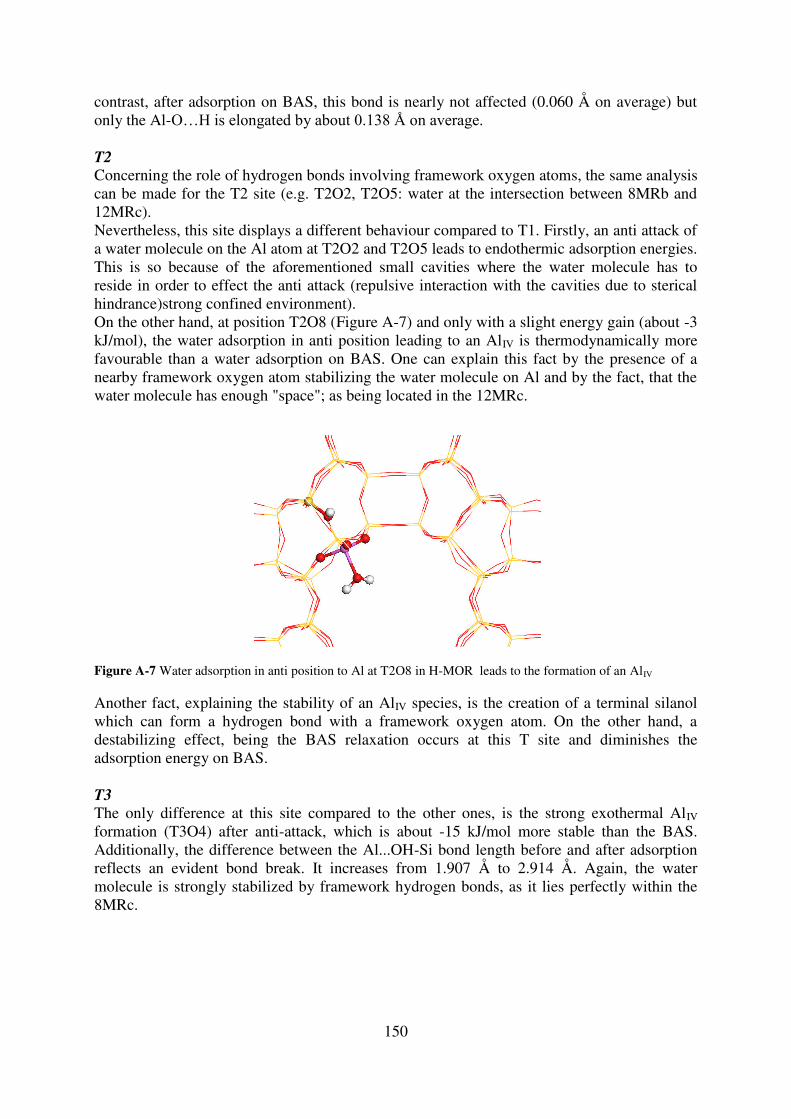
150
contrast, after adsorption on BAS, this bond is nearly not affected (0.060 Å on average) but only the Al-O…H is elongated by about 0.138 Å on average. T2 Concerning the role of hydrogen bonds involving framework oxygen atoms, the same analysis can be made for the T2 site (e.g. T2O2, T2O5: water at the intersection between 8MRb and 12MRc). Nevertheless, this site displays a different behaviour compared to T1. Firstly, an anti attack of a water molecule on the Al atom at T2O2 and T2O5 leads to endothermic adsorption energies. This is so because of the aforementioned small cavities where the water molecule has to reside in order to effect the anti attack (repulsive interaction with the cavities due to sterical hindrance)strong confined environment). On the other hand, at position T2O8 (Figure A-7) and only with a slight energy gain (about -3 kJ/mol), the water adsorption in anti position leading to an AlIV is thermodynamically more favourable than a water adsorption on BAS. One can explain this fact by the presence of a nearby framework oxygen atom stabilizing the water molecule on Al and by the fact, that the water molecule has enough "space"; as being located in the 12MRc.
Figure A-7 Water adsorption in anti position to Al at T2O8 in H-MOR leads to the formation of an AlIV Another fact, explaining the stability of an AlIV species, is the creation of a terminal silanol which can form a hydrogen bond with a framework oxygen atom. On the other hand, a destabilizing effect, being the BAS relaxation occurs at this T site and diminishes the adsorption energy on BAS. T3 The only difference at this site compared to the other ones, is the strong exothermal AlIV formation (T3O4) after anti-attack, which is about -15 kJ/mol more stable than the BAS. Additionally, the difference between the Al...OH-Si bond length before and after adsorption reflects an evident bond break. It increases from 1.907 Å to 2.914 Å. Again, the water molecule is strongly stabilized by framework hydrogen bonds, as it lies perfectly within the 8MRc.

151
Figure A-8 Water adsorption in anti position to Al at T3O4 in H-MOR leads to the formation of an AlIV This also explains the very strong adsorption on BAS at T3O9 where the water molecule resides within the 8MRc (Figure A-8). T4 This site contains all aforementioned characteristics being: - T4O2: accessible Al atom for anti attack and accessible BAS, where the adsorption on BAS is favoured since the water molecule in anti position does not reside within a cavity being able to stabilize it via hydrogen bonds by framework oxygen atoms - T4O4: inaccessible BAS as pointing toward a narrow cavity, leading to physisorbed water within the 8MRb instead of an adsorption and the preferentially formation of an AlV - T4O10: constrained accessibility for the water molecule to be adsorbed on the Al atom by an anti attack, resulting in strong endothermic adsorption energies.
2.013
1.729 2.459
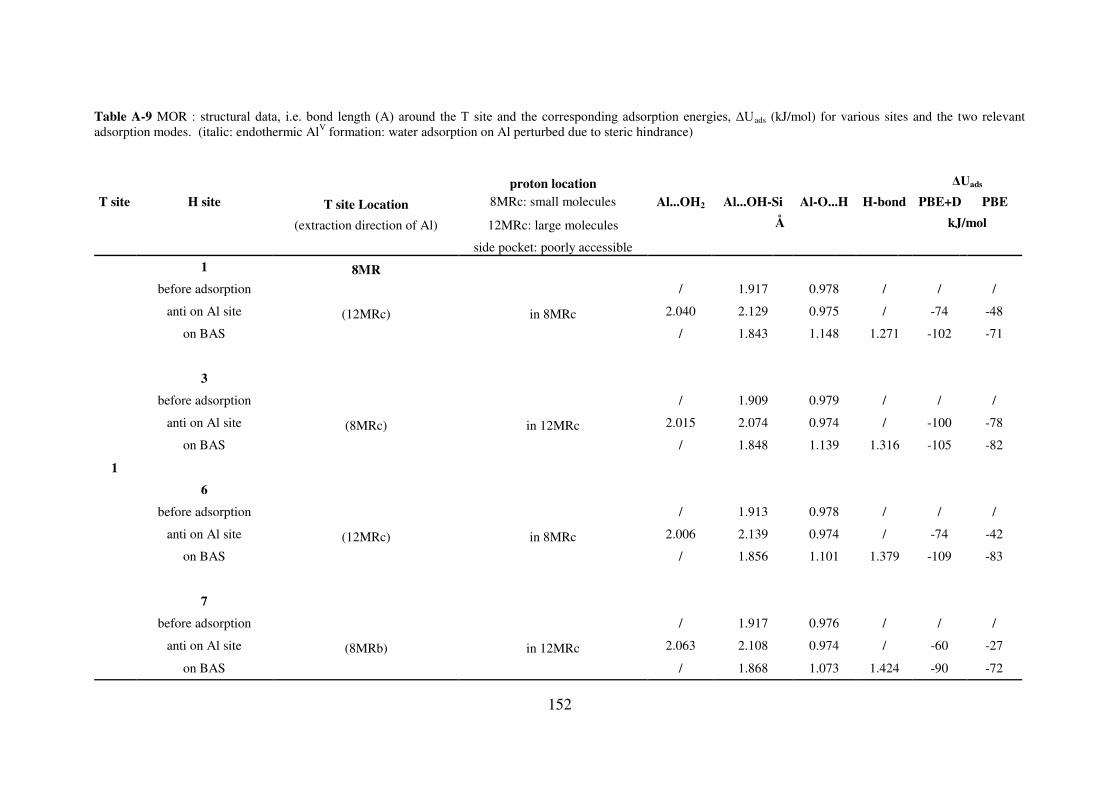
152
Table A-9 MOR : structural data, i.e. bond length (A) around the T site and the corresponding adsorption energies, ΔUads (kJ/mol) for various sites and the two relevant adsorption modes. (italic: endothermic AlV formation: water adsorption on Al perturbed due to steric hindrance)
proton location ΔUads
T site H site T site Location 8MRc: small molecules Al...OH2 Al...OH-Si Al-O...H H-bond PBE+D PBE
(extraction direction of Al) 12MRc: large molecules Å kJ/mol
side pocket: poorly accessible
1
1 8MR
before adsorption / 1.917 0.978 / / /
anti on Al site (12MRc) in 8MRc 2.040 2.129 0.975 / -74 -48
on BAS / 1.843 1.148 1.271 -102 -71
3
before adsorption / 1.909 0.979 / / /
anti on Al site (8MRc) in 12MRc 2.015 2.074 0.974 / -100 -78
on BAS / 1.848 1.139 1.316 -105 -82
6
before adsorption / 1.913 0.978 / / /
anti on Al site (12MRc) in 8MRc 2.006 2.139 0.974 / -74 -42
on BAS / 1.856 1.101 1.379 -109 -83
7
before adsorption / 1.917 0.976 / / /
anti on Al site (8MRb) in 12MRc 2.063 2.108 0.974 / -60 -27
on BAS / 1.868 1.073 1.424 -90 -72
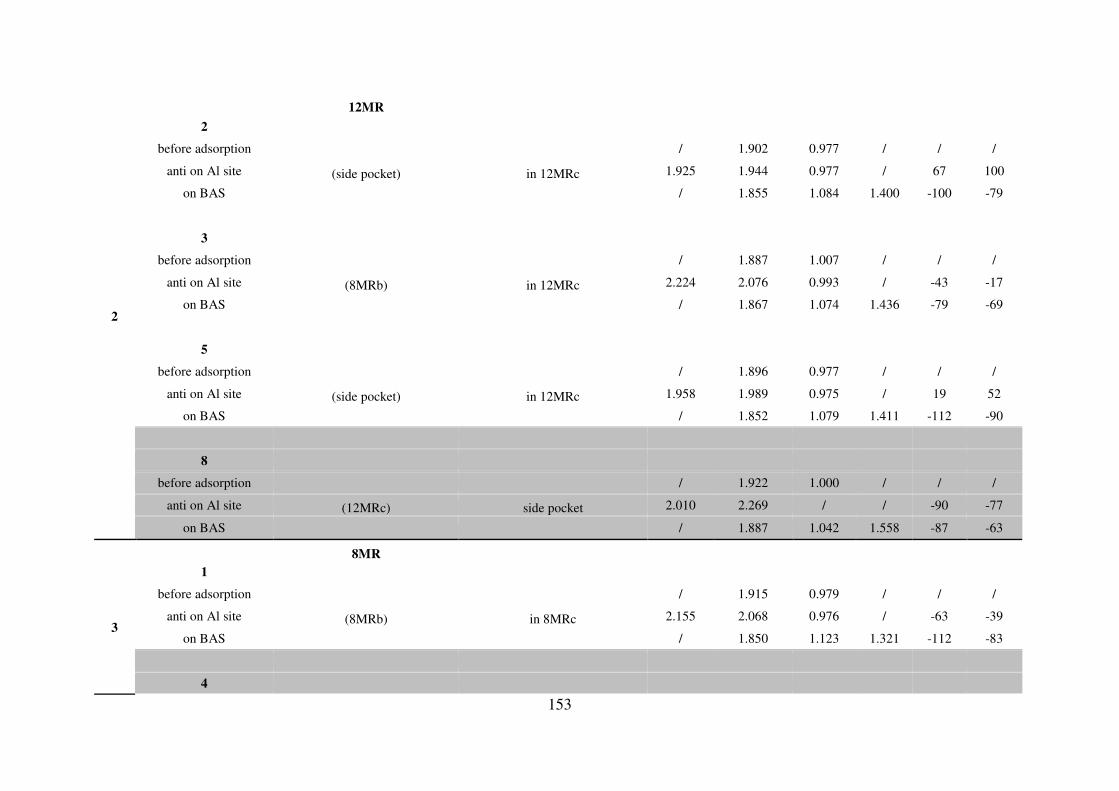
153
2
12MR
2
before adsorption / 1.902 0.977 / / /
anti on Al site (side pocket) in 12MRc 1.925 1.944 0.977 / 67 100
on BAS / 1.855 1.084 1.400 -100 -79
3
before adsorption / 1.887 1.007 / / /
anti on Al site (8MRb) in 12MRc 2.224 2.076 0.993 / -43 -17
on BAS / 1.867 1.074 1.436 -79 -69
5
before adsorption / 1.896 0.977 / / /
anti on Al site (side pocket) in 12MRc 1.958 1.989 0.975 / 19 52
on BAS / 1.852 1.079 1.411 -112 -90
8
before adsorption / 1.922 1.000 / / /
anti on Al site (12MRc) side pocket 2.010 2.269 / / -90 -77
on BAS / 1.887 1.042 1.558 -87 -63
8MR
3
1
before adsorption / 1.915 0.979 / / /
anti on Al site (8MRb) in 8MRc 2.155 2.068 0.976 / -63 -39
on BAS / 1.850 1.123 1.321 -112 -83
4
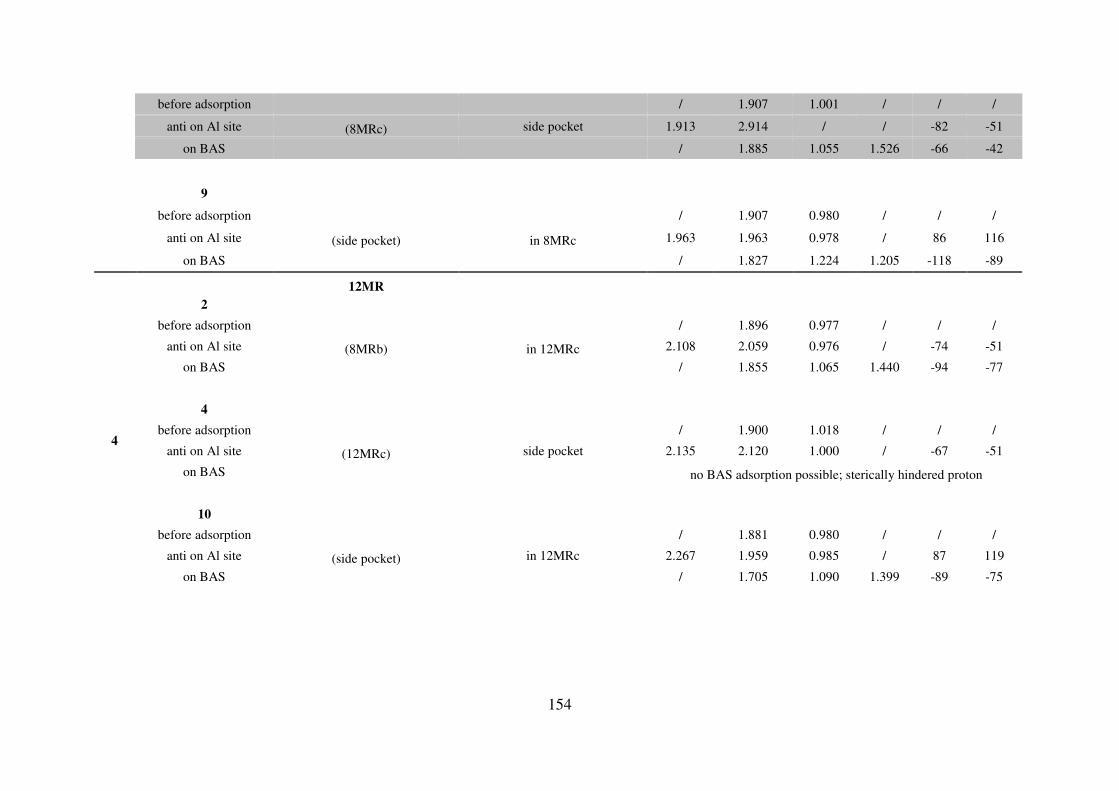
154
before adsorption / 1.907 1.001 / / /
anti on Al site (8MRc) side pocket 1.913 2.914 / / -82 -51
on BAS / 1.885 1.055 1.526 -66 -42
9
before adsorption / 1.907 0.980 / / /
anti on Al site (side pocket) in 8MRc 1.963 1.963 0.978 / 86 116
on BAS / 1.827 1.224 1.205 -118 -89
12MR
4
2
before adsorption / 1.896 0.977 / / /
anti on Al site (8MRb) in 12MRc 2.108 2.059 0.976 / -74 -51
on BAS / 1.855 1.065 1.440 -94 -77
4
before adsorption / 1.900 1.018 / / /
anti on Al site (12MRc) side pocket 2.135 2.120 1.000 / -67 -51
on BAS no BAS adsorption possible; sterically hindered proton
10
before adsorption / 1.881 0.980 / / /
anti on Al site (side pocket) in 12MRc 2.267 1.959 0.985 / 87 119
on BAS / 1.705 1.090 1.399 -89 -75

155
A.4.2. FAU Data are presented in Table A-10 (following page).
A.4.3. MFI Data are presented in Table A-11 (following pages).
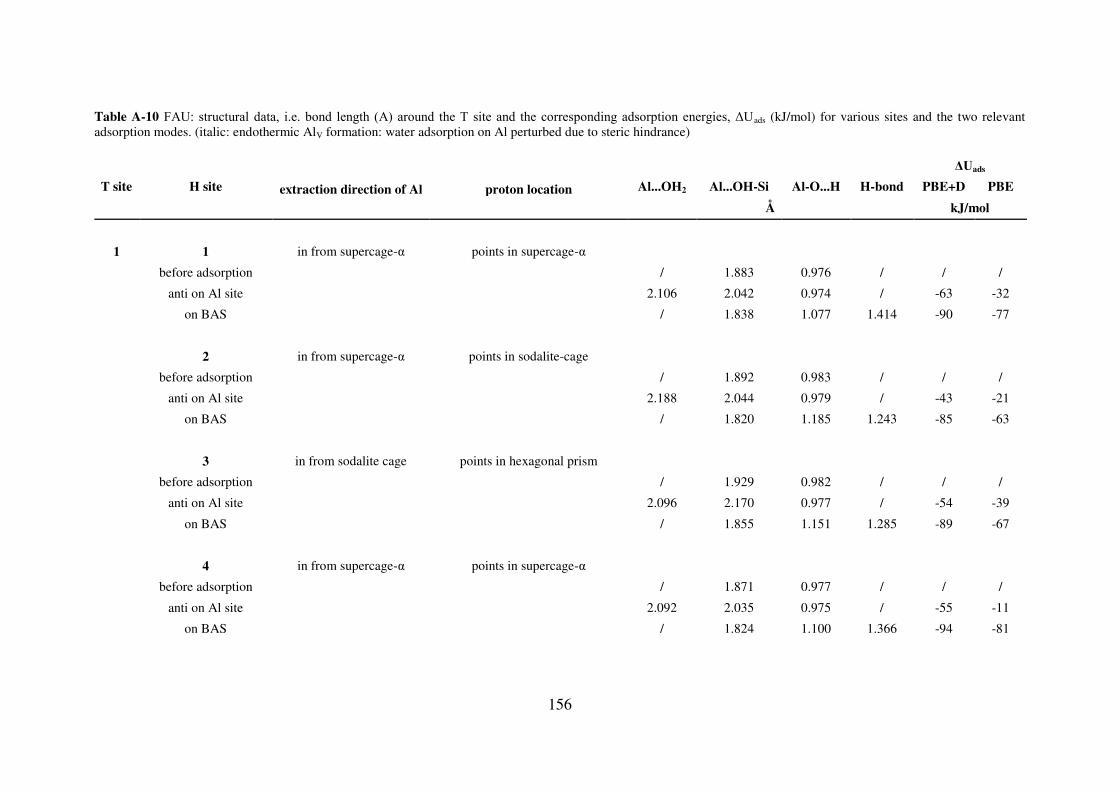
156
Table A-10 FAU: structural data, i.e. bond length (A) around the T site and the corresponding adsorption energies, ΔUads (kJ/mol) for various sites and the two relevant adsorption modes. (italic: endothermic AlV formation: water adsorption on Al perturbed due to steric hindrance)
ΔUads
T site H site extraction direction of Al proton location Al...OH2 Al...OH-Si Al-O...H H-bond PBE+D PBE
Å kJ/mol
1 1 in from supercage-α points in supercage-α
before adsorption / 1.883 0.976 / / /
anti on Al site 2.106 2.042 0.974 / -63 -32
on BAS / 1.838 1.077 1.414 -90 -77
2 in from supercage-α points in sodalite-cage
before adsorption / 1.892 0.983 / / /
anti on Al site 2.188 2.044 0.979 / -43 -21
on BAS / 1.820 1.185 1.243 -85 -63
3 in from sodalite cage points in hexagonal prism
before adsorption / 1.929 0.982 / / /
anti on Al site 2.096 2.170 0.977 / -54 -39
on BAS / 1.855 1.151 1.285 -89 -67
4 in from supercage-α points in supercage-α
before adsorption / 1.871 0.977 / / /
anti on Al site 2.092 2.035 0.975 / -55 -11
on BAS / 1.824 1.100 1.366 -94 -81
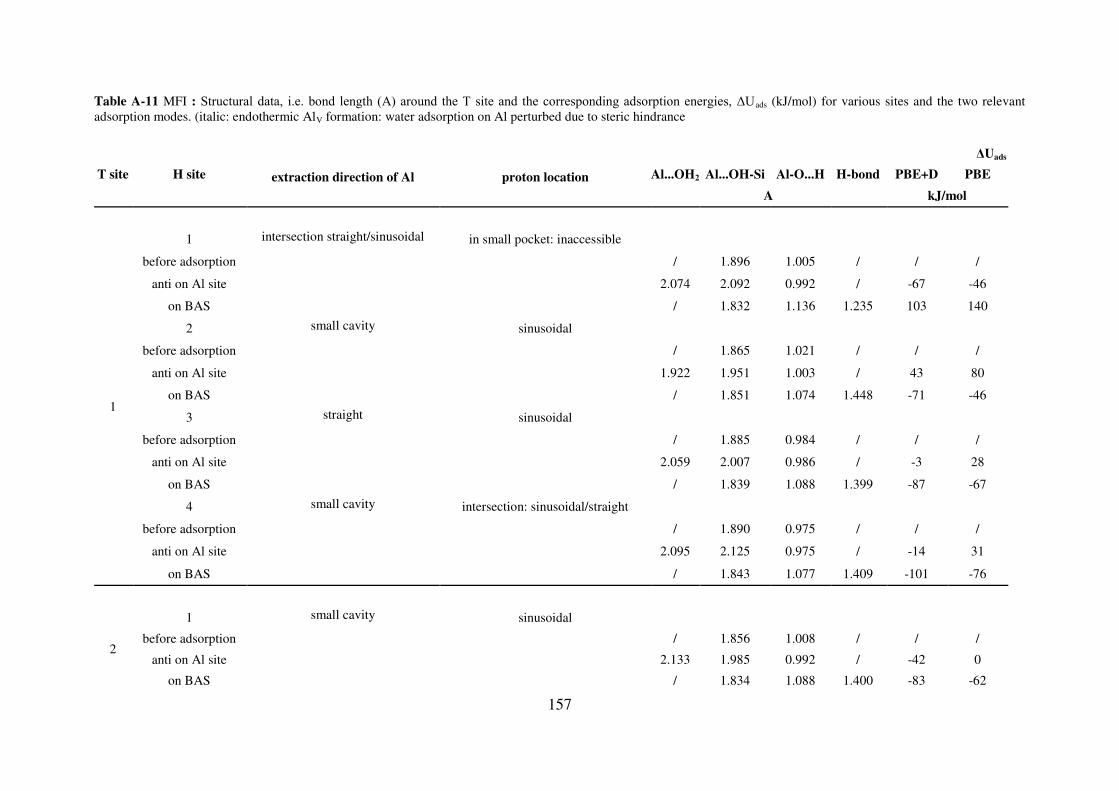
157
Table A-11 MFI : Structural data, i.e. bond length (A) around the T site and the corresponding adsorption energies, ΔUads (kJ/mol) for various sites and the two relevant adsorption modes. (italic: endothermic AlV formation: water adsorption on Al perturbed due to steric hindrance
ΔUads
T site H site extraction direction of Al proton location Al...OH2 Al...OH-Si Al-O...H H-bond PBE+D PBE
A kJ/mol
1
1 intersection straight/sinusoidal in small pocket: inaccessible
before adsorption / 1.896 1.005 / / /
anti on Al site 2.074 2.092 0.992 / -67 -46
on BAS / 1.832 1.136 1.235 103 140
2 small cavity sinusoidal
before adsorption / 1.865 1.021 / / /
anti on Al site 1.922 1.951 1.003 / 43 80
on BAS / 1.851 1.074 1.448 -71 -46
3 straight sinusoidal
before adsorption / 1.885 0.984 / / /
anti on Al site 2.059 2.007 0.986 / -3 28
on BAS / 1.839 1.088 1.399 -87 -67
4 small cavity intersection: sinusoidal/straight
before adsorption / 1.890 0.975 / / /
anti on Al site 2.095 2.125 0.975 / -14 31
on BAS / 1.843 1.077 1.409 -101 -76
2
1 small cavity sinusoidal
before adsorption / 1.856 1.008 / / /
anti on Al site 2.133 1.985 0.992 / -42 0
on BAS / 1.834 1.088 1.400 -83 -62
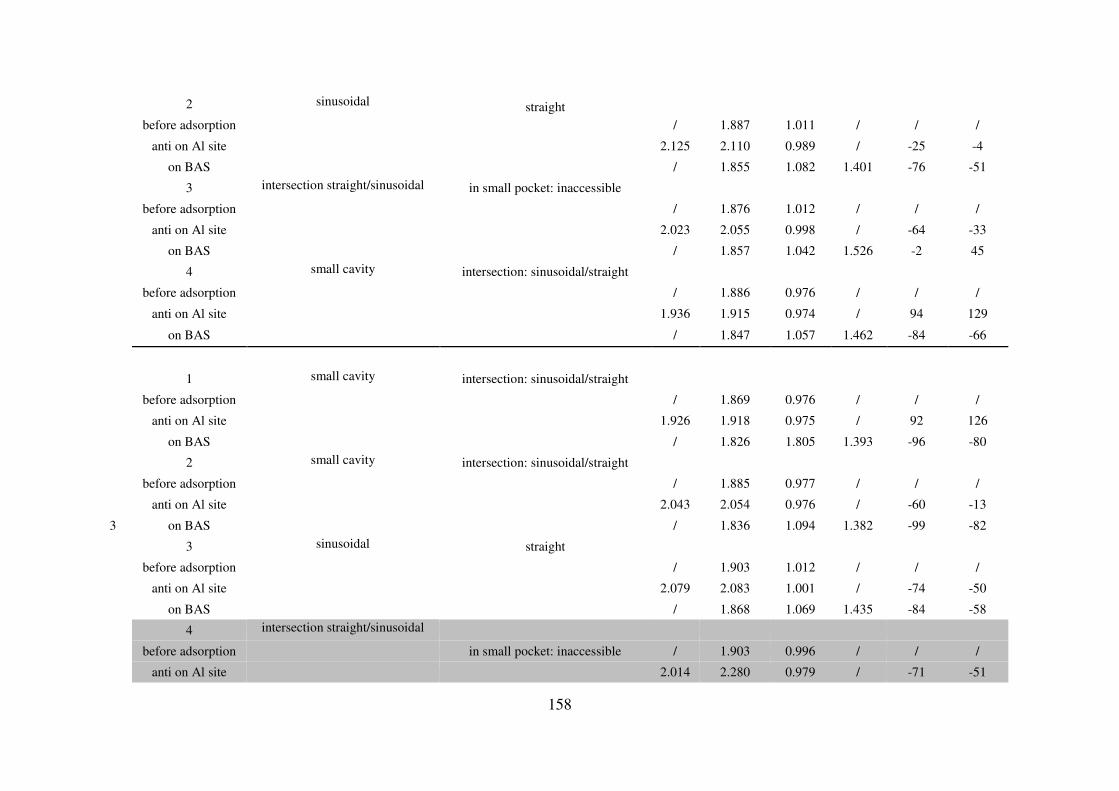
158
2 sinusoidal straight
before adsorption / 1.887 1.011 / / /
anti on Al site 2.125 2.110 0.989 / -25 -4
on BAS / 1.855 1.082 1.401 -76 -51
3 intersection straight/sinusoidal in small pocket: inaccessible
before adsorption / 1.876 1.012 / / /
anti on Al site 2.023 2.055 0.998 / -64 -33
on BAS / 1.857 1.042 1.526 -2 45
4 small cavity intersection: sinusoidal/straight
before adsorption / 1.886 0.976 / / /
anti on Al site 1.936 1.915 0.974 / 94 129
on BAS / 1.847 1.057 1.462 -84 -66
3
1 small cavity intersection: sinusoidal/straight
before adsorption / 1.869 0.976 / / /
anti on Al site 1.926 1.918 0.975 / 92 126
on BAS / 1.826 1.805 1.393 -96 -80
2 small cavity intersection: sinusoidal/straight
before adsorption / 1.885 0.977 / / /
anti on Al site 2.043 2.054 0.976 / -60 -13
on BAS / 1.836 1.094 1.382 -99 -82
3 sinusoidal straight
before adsorption / 1.903 1.012 / / /
anti on Al site 2.079 2.083 1.001 / -74 -50
on BAS / 1.868 1.069 1.435 -84 -58
4 intersection straight/sinusoidal
before adsorption in small pocket: inaccessible / 1.903 0.996 / / /
anti on Al site 2.014 2.280 0.979 / -71 -51
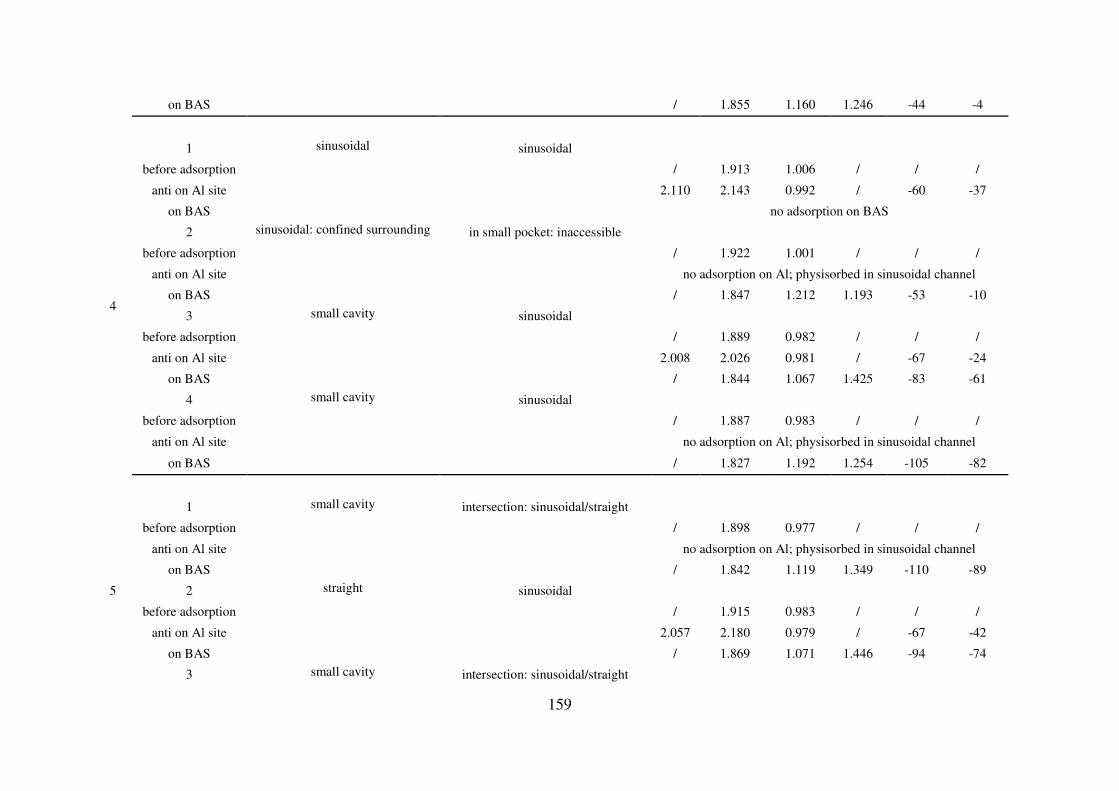
159
on BAS / 1.855 1.160 1.246 -44 -4
4
1 sinusoidal sinusoidal
before adsorption / 1.913 1.006 / / /
anti on Al site 2.110 2.143 0.992 / -60 -37
on BAS no adsorption on BAS
2 sinusoidal: confined surrounding in small pocket: inaccessible
before adsorption / 1.922 1.001 / / /
anti on Al site no adsorption on Al; physisorbed in sinusoidal channel
on BAS / 1.847 1.212 1.193 -53 -10
3 small cavity sinusoidal
before adsorption / 1.889 0.982 / / /
anti on Al site 2.008 2.026 0.981 / -67 -24
on BAS / 1.844 1.067 1.425 -83 -61
4 small cavity sinusoidal
before adsorption / 1.887 0.983 / / /
anti on Al site no adsorption on Al; physisorbed in sinusoidal channel
on BAS / 1.827 1.192 1.254 -105 -82
5
1 small cavity intersection: sinusoidal/straight
before adsorption / 1.898 0.977 / / /
anti on Al site no adsorption on Al; physisorbed in sinusoidal channel
on BAS / 1.842 1.119 1.349 -110 -89
2 straight sinusoidal
before adsorption / 1.915 0.983 / / /
anti on Al site 2.057 2.180 0.979 / -67 -42
on BAS / 1.869 1.071 1.446 -94 -74
3 small cavity intersection: sinusoidal/straight
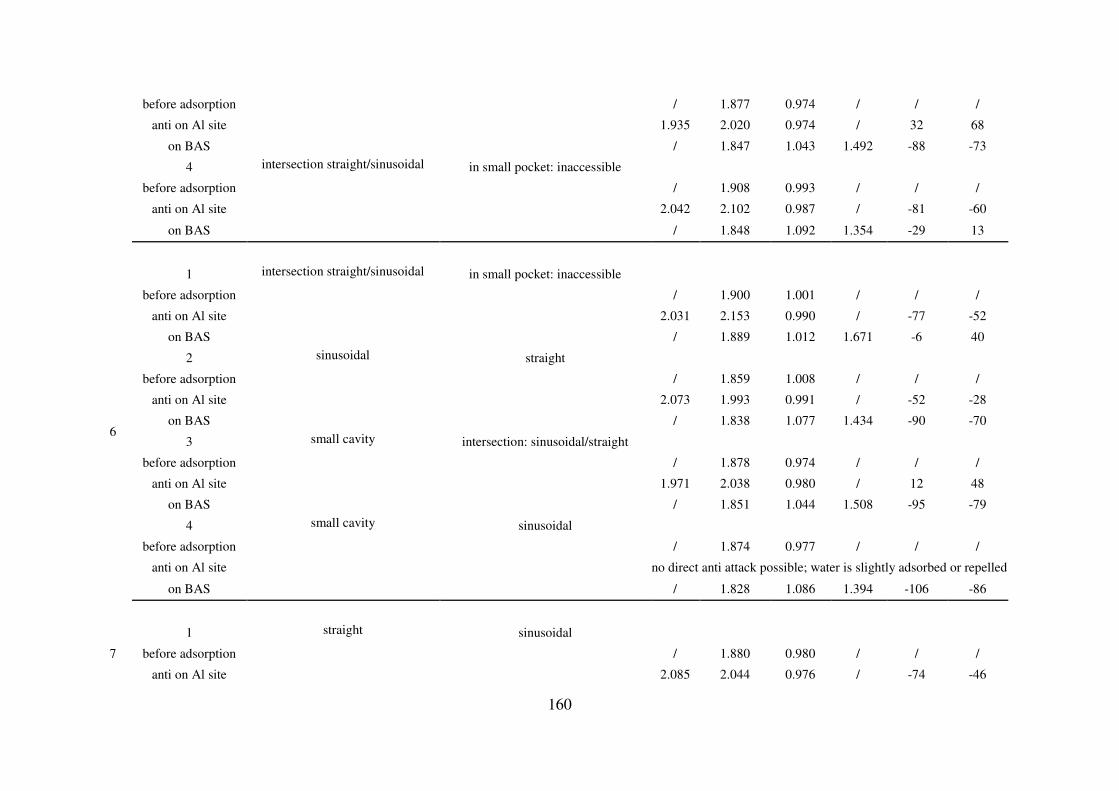
160
before adsorption / 1.877 0.974 / / /
anti on Al site 1.935 2.020 0.974 / 32 68
on BAS / 1.847 1.043 1.492 -88 -73
4 intersection straight/sinusoidal in small pocket: inaccessible
before adsorption / 1.908 0.993 / / /
anti on Al site 2.042 2.102 0.987 / -81 -60
on BAS / 1.848 1.092 1.354 -29 13
6
1 intersection straight/sinusoidal in small pocket: inaccessible
before adsorption / 1.900 1.001 / / /
anti on Al site 2.031 2.153 0.990 / -77 -52
on BAS / 1.889 1.012 1.671 -6 40
2 sinusoidal straight
before adsorption / 1.859 1.008 / / /
anti on Al site 2.073 1.993 0.991 / -52 -28
on BAS / 1.838 1.077 1.434 -90 -70
3 small cavity intersection: sinusoidal/straight
before adsorption / 1.878 0.974 / / /
anti on Al site 1.971 2.038 0.980 / 12 48
on BAS / 1.851 1.044 1.508 -95 -79
4 small cavity sinusoidal
before adsorption / 1.874 0.977 / / /
anti on Al site no direct anti attack possible; water is slightly adsorbed or repelled
on BAS / 1.828 1.086 1.394 -106 -86
7
1 straight sinusoidal
before adsorption / 1.880 0.980 / / /
anti on Al site 2.085 2.044 0.976 / -74 -46
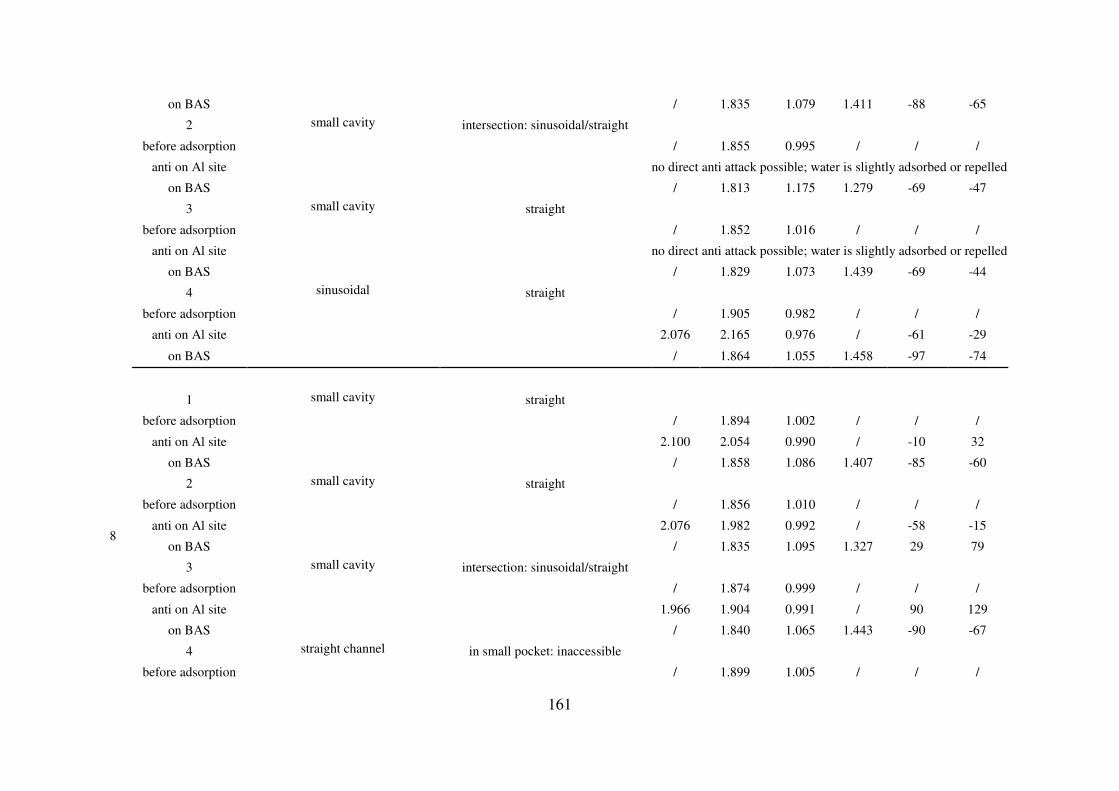
161
on BAS / 1.835 1.079 1.411 -88 -65
2 small cavity intersection: sinusoidal/straight
before adsorption / 1.855 0.995 / / /
anti on Al site no direct anti attack possible; water is slightly adsorbed or repelled
on BAS / 1.813 1.175 1.279 -69 -47
3 small cavity straight
before adsorption / 1.852 1.016 / / /
anti on Al site no direct anti attack possible; water is slightly adsorbed or repelled
on BAS / 1.829 1.073 1.439 -69 -44
4 sinusoidal straight
before adsorption / 1.905 0.982 / / /
anti on Al site 2.076 2.165 0.976 / -61 -29
on BAS / 1.864 1.055 1.458 -97 -74
8
1 small cavity straight
before adsorption / 1.894 1.002 / / /
anti on Al site 2.100 2.054 0.990 / -10 32
on BAS / 1.858 1.086 1.407 -85 -60
2 small cavity straight
before adsorption / 1.856 1.010 / / /
anti on Al site 2.076 1.982 0.992 / -58 -15
on BAS / 1.835 1.095 1.327 29 79
3 small cavity intersection: sinusoidal/straight
before adsorption / 1.874 0.999 / / /
anti on Al site 1.966 1.904 0.991 / 90 129
on BAS / 1.840 1.065 1.443 -90 -67
4 straight channel in small pocket: inaccessible
before adsorption / 1.899 1.005 / / /
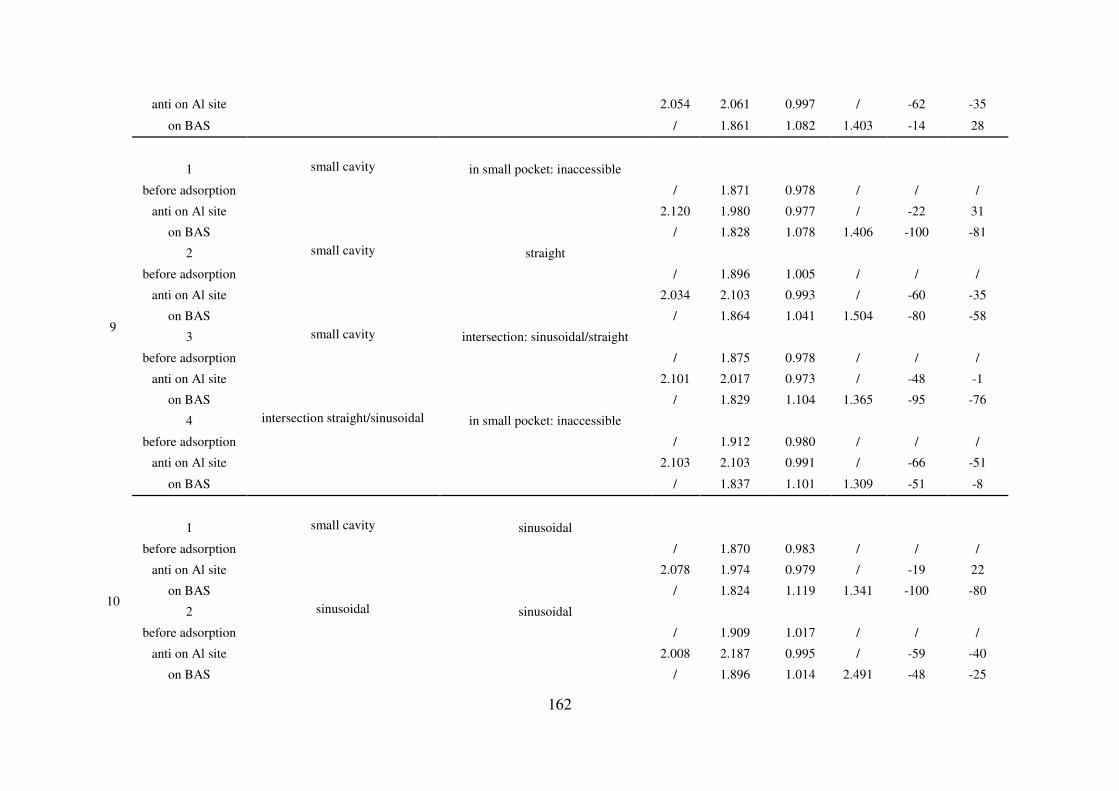
162
anti on Al site 2.054 2.061 0.997 / -62 -35
on BAS / 1.861 1.082 1.403 -14 28
9
1 small cavity in small pocket: inaccessible
before adsorption / 1.871 0.978 / / /
anti on Al site 2.120 1.980 0.977 / -22 31
on BAS / 1.828 1.078 1.406 -100 -81
2 small cavity straight
before adsorption / 1.896 1.005 / / /
anti on Al site 2.034 2.103 0.993 / -60 -35
on BAS / 1.864 1.041 1.504 -80 -58
3 small cavity intersection: sinusoidal/straight
before adsorption / 1.875 0.978 / / /
anti on Al site 2.101 2.017 0.973 / -48 -1
on BAS / 1.829 1.104 1.365 -95 -76
4 intersection straight/sinusoidal in small pocket: inaccessible
before adsorption / 1.912 0.980 / / /
anti on Al site 2.103 2.103 0.991 / -66 -51
on BAS / 1.837 1.101 1.309 -51 -8
10
1 small cavity sinusoidal
before adsorption / 1.870 0.983 / / /
anti on Al site 2.078 1.974 0.979 / -19 22
on BAS / 1.824 1.119 1.341 -100 -80
2 sinusoidal sinusoidal
before adsorption / 1.909 1.017 / / /
anti on Al site 2.008 2.187 0.995 / -59 -40
on BAS / 1.896 1.014 2.491 -48 -25
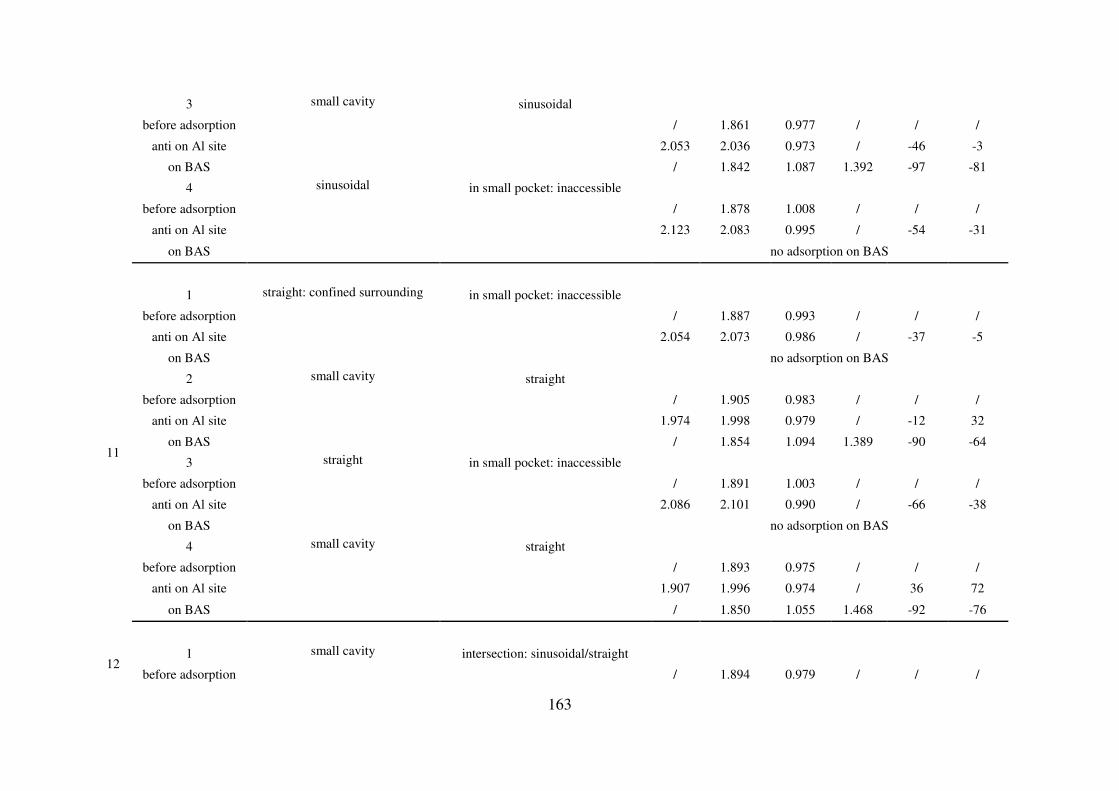
163
3 small cavity sinusoidal
before adsorption / 1.861 0.977 / / /
anti on Al site 2.053 2.036 0.973 / -46 -3
on BAS / 1.842 1.087 1.392 -97 -81
4 sinusoidal in small pocket: inaccessible
before adsorption / 1.878 1.008 / / /
anti on Al site 2.123 2.083 0.995 / -54 -31
on BAS no adsorption on BAS
11
1 straight: confined surrounding in small pocket: inaccessible
before adsorption / 1.887 0.993 / / /
anti on Al site 2.054 2.073 0.986 / -37 -5
on BAS no adsorption on BAS
2 small cavity straight
before adsorption / 1.905 0.983 / / /
anti on Al site 1.974 1.998 0.979 / -12 32
on BAS / 1.854 1.094 1.389 -90 -64
3 straight in small pocket: inaccessible
before adsorption / 1.891 1.003 / / /
anti on Al site 2.086 2.101 0.990 / -66 -38
on BAS no adsorption on BAS
4 small cavity straight
before adsorption / 1.893 0.975 / / /
anti on Al site 1.907 1.996 0.974 / 36 72
on BAS / 1.850 1.055 1.468 -92 -76
12 1 small cavity intersection: sinusoidal/straight
before adsorption / 1.894 0.979 / / /
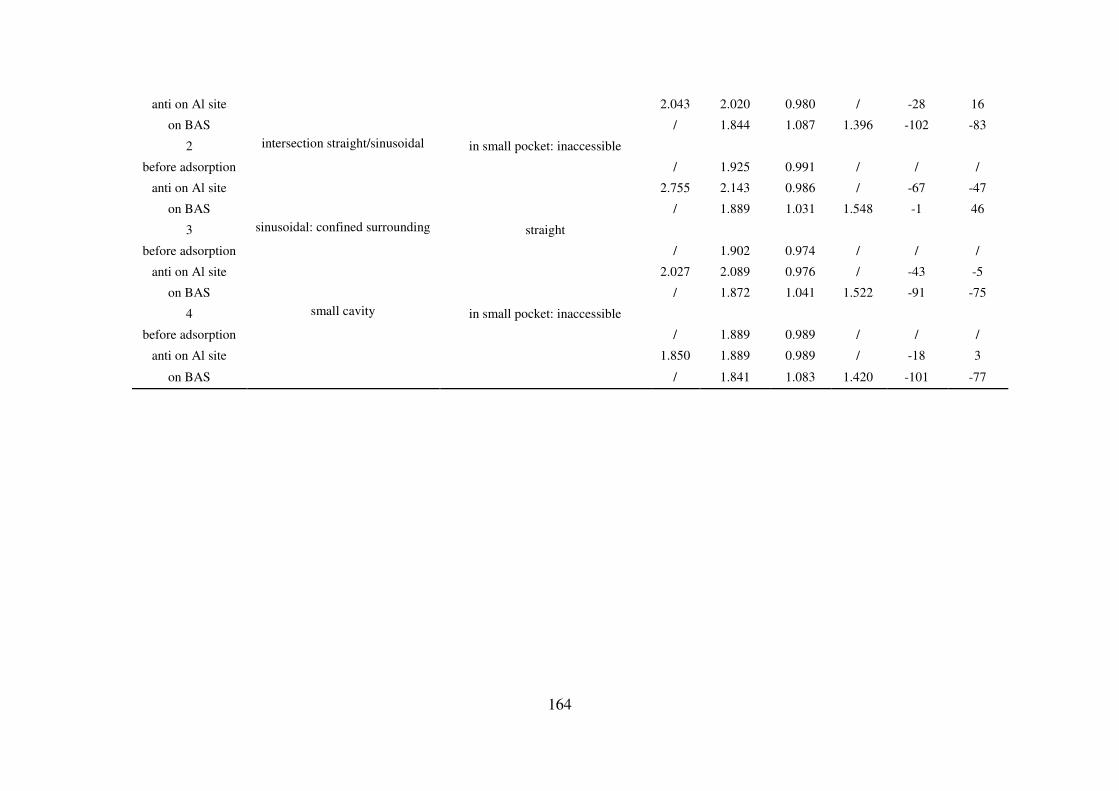
164
anti on Al site 2.043 2.020 0.980 / -28 16
on BAS / 1.844 1.087 1.396 -102 -83
2 intersection straight/sinusoidal in small pocket: inaccessible
before adsorption / 1.925 0.991 / / /
anti on Al site 2.755 2.143 0.986 / -67 -47
on BAS / 1.889 1.031 1.548 -1 46
3 sinusoidal: confined surrounding straight
before adsorption / 1.902 0.974 / / /
anti on Al site 2.027 2.089 0.976 / -43 -5
on BAS / 1.872 1.041 1.522 -91 -75
4 small cavity in small pocket: inaccessible
before adsorption / 1.889 0.989 / / /
anti on Al site 1.850 1.889 0.989 / -18 3
on BAS / 1.841 1.083 1.420 -101 -77
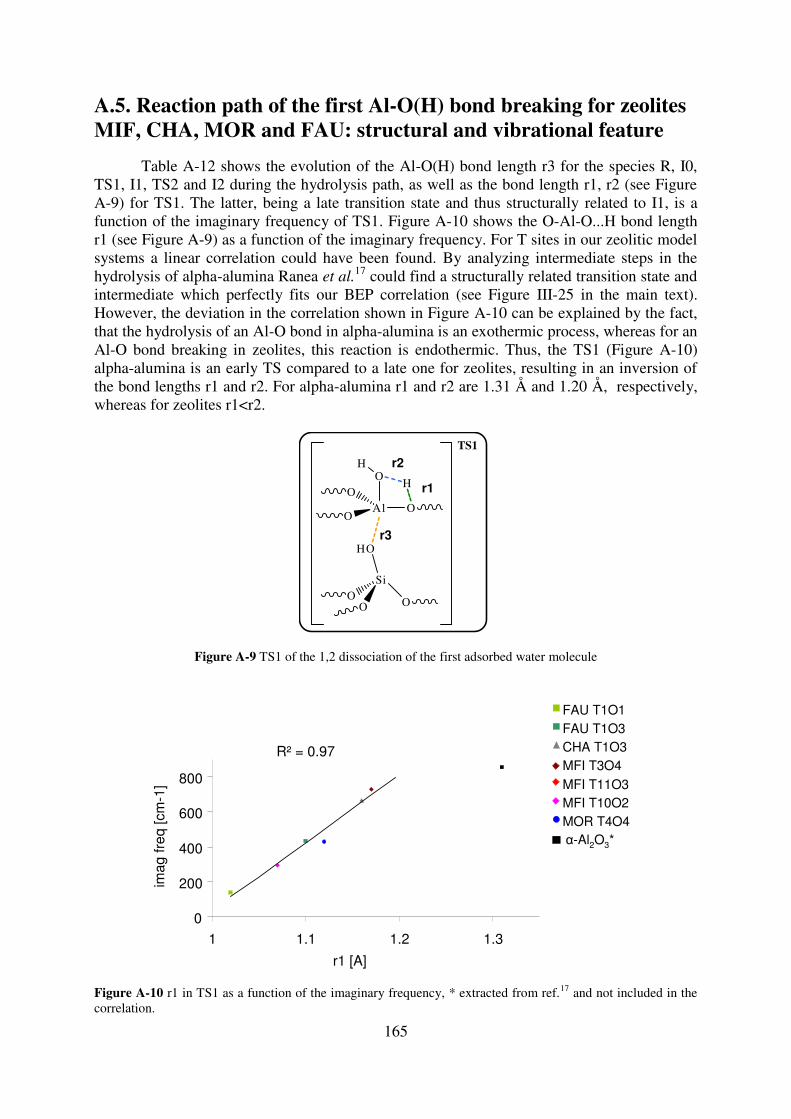
165
A.5. Reaction path of the first Al-O(H) bond breaking for zeolites MIF, CHA, MOR and FAU: structural and vibrational feature
Table A-12 shows the evolution of the Al-O(H) bond length r3 for the species R, I0, TS1, I1, TS2 and I2 during the hydrolysis path, as well as the bond length r1, r2 (see Figure A-9) for TS1. The latter, being a late transition state and thus structurally related to I1, is a function of the imaginary frequency of TS1. Figure A-10 shows the O-Al-O...H bond length r1 (see Figure A-9) as a function of the imaginary frequency. For T sites in our zeolitic model systems a linear correlation could have been found. By analyzing intermediate steps in the hydrolysis of alpha-alumina Ranea et al.
17 could find a structurally related transition state and intermediate which perfectly fits our BEP correlation (see Figure III-25 in the main text). However, the deviation in the correlation shown in Figure A-10 can be explained by the fact, that the hydrolysis of an Al-O bond in alpha-alumina is an exothermic process, whereas for an Al-O bond breaking in zeolites, this reaction is endothermic. Thus, the TS1 (Figure A-10) alpha-alumina is an early TS compared to a late one for zeolites, resulting in an inversion of the bond lengths r1 and r2. For alpha-alumina r1 and r2 are 1.31 Å and 1.20 Å, respectively, whereas for zeolites r1<r2.
Figure A-9 TS1 of the 1,2 dissociation of the first adsorbed water molecule
Figure A-10 r1 in TS1 as a function of the imaginary frequency, * extracted from ref.17 and not included in the correlation.
AlO
OO
OH
Si
OH
H
OO O
TS1
r1
r2
r3
R² = 0.97
0
200
400
600
800
1 1.1 1.2 1.3
r1 [A]
ima
gfr
eq [cm
-1]
FAU T1O1
FAU T1O3
CHA T1O3
MFI T3O4
MFI T11O3
MFI T10O2
MOR T4O4
α-Al2O3*
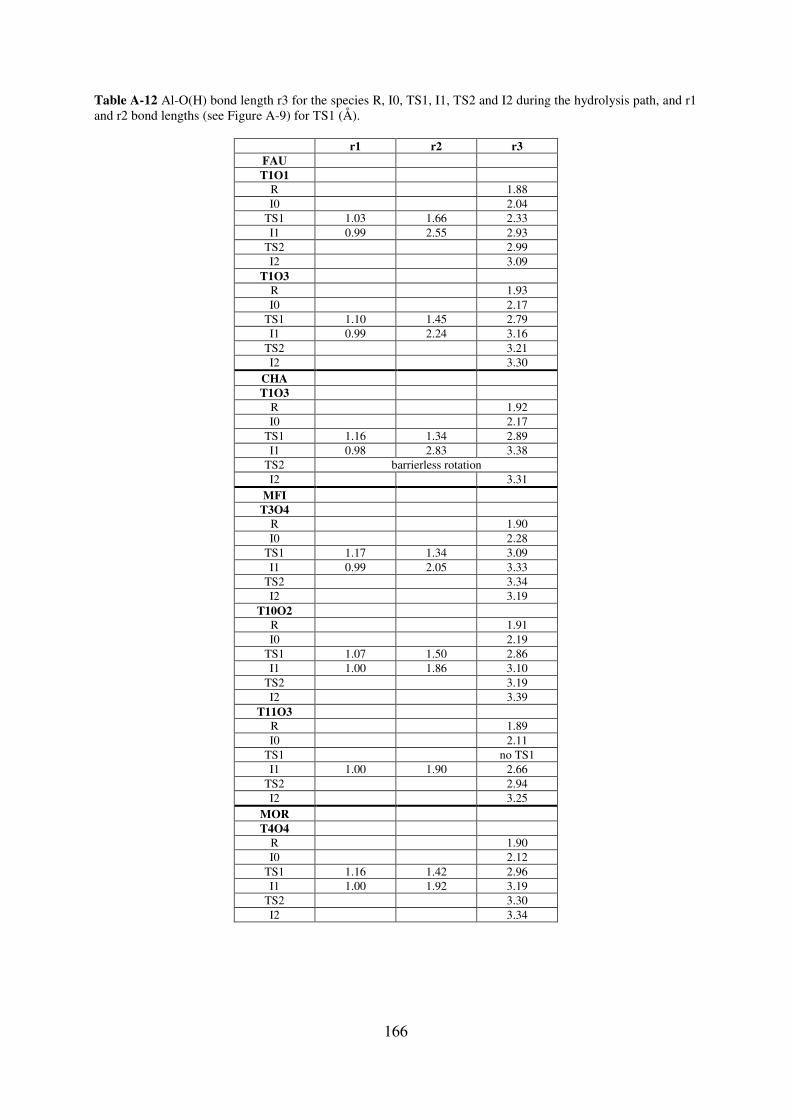
166
Table A-12 Al-O(H) bond length r3 for the species R, I0, TS1, I1, TS2 and I2 during the hydrolysis path, and r1 and r2 bond lengths (see Figure A-9) for TS1 (Å).
r1 r2 r3 FAU T1O1
R 1.88 I0 2.04
TS1 1.03 1.66 2.33 I1 0.99 2.55 2.93
TS2 2.99 I2 3.09
T1O3 R 1.93 I0 2.17
TS1 1.10 1.45 2.79 I1 0.99 2.24 3.16
TS2 3.21 I2 3.30
CHA T1O3
R 1.92 I0 2.17
TS1 1.16 1.34 2.89 I1 0.98 2.83 3.38
TS2 barrierless rotation I2 3.31
MFI T3O4
R 1.90 I0 2.28
TS1 1.17 1.34 3.09 I1 0.99 2.05 3.33
TS2 3.34 I2 3.19
T10O2 R 1.91 I0 2.19
TS1 1.07 1.50 2.86 I1 1.00 1.86 3.10
TS2 3.19 I2 3.39
T11O3 R 1.89 I0 2.11
TS1 no TS1 I1 1.00 1.90 2.66
TS2 2.94 I2 3.25
MOR T4O4
R 1.90 I0 2.12
TS1 1.16 1.42 2.96 I1 1.00 1.92 3.19
TS2 3.30 I2 3.34

167
168
References 1. G. P. Francis and M. C. Payne, J Phys-Condens Mat, 1990, 2, 4395-4404. 2. G. D. Gatta and Y. Lee, Phys Chem Miner, 2006, 32, 726-732. 3. T. Demuth, J. Hafner, L. Benco and H. Toulhoat, J. Phys. Chem. B, 2000, 104, 4593-
4607. 4. R. Astala, S. M. Auerbach and P. A. Monson, J. Phys. Chem. B, 2004, 108, 9208-
9215. 5. Y. Hong and J. J. Fripiat, Microporous Mater., 1995, 4, 323-334. 6. B. L. Meyers, T. H. Fleisch, G. J. Ray, J. T. Miller and J. B. Hall, J. Catal., 1988, 110,
82-95. 7. R. W. Olsson and L. D. Rollmann, Inorg. Chem., 1977, 16, 651-654. 8. A. Alberti, P. Davoli and G. Vezzalini, Z. Kristallogr., 1986, 175, 249-256. 9. E. Dempsey, G. H. Kuehl and D. H. Olson, J. Phys. Chem., 1969, 73, 387-390. 10. H. van Koningsveld, J. C. Jansen and H. van Bekkum, Zeolites, 1990, 10, 235-242. 11. B. F. Mentzen and F. Lefebvre, Mater Res Bull, 1997, 32, 813-820. 12. M. l. Trzpit, S. v. Rigolet, J.-L. Paillaud, C. Marichal, M. Soulard and J. l. Patarin, J.
Phys. Chem. B, 2008, 112, 7257-7266. 13. D. A. Woodcock, P. Lightfoot, L. A. Villaescusa, M.-J. Díaz-Cabañas, M. A. Camblor
and D. Engberg, Chem. Mater., 1999, 11, 2508-2514. 14. A. Alberti, Zeolites, 1997, 19, 411-415. 15. D. H. Olson, N. Khosrovani, A. W. Peters and B. H. Toby, J. Phys. Chem. B, 2000,
104, 4844-4848. 16. J. a. van Bokhoven, T.-L. Lee, M. Drakopoulos, C. Lamberti, S. Thiess and J.
Zegenhagen, Nat. Mater., 2008, 7, 551-555. 17. V. c. A. Ranea, I. Carmichael and W. F. Schneider, J. Phys. Chem. C, 2009, 113,
2149-2158.

Abstract
Zeolites are crystalline microporous aluminosilicates widely used in refining, petrochemistry
and biomass conversion. However, diffusion limitation and confinement effect can promote
the formation of undesired products. The introduction of mesopores by dealumination and/or
desilication (giving birth to hierarchical zeolites) is a possible solution widely used
experimentally. Nevertheless, the mechanisms of these demetallation reactions are poorly
described at the molecular scale. We determine the mechanisms of the formation of extra-
framework Al species (EFAL) for zeotypes MOR, FAU, MFI and CHA occurring during the
dealumination process, possibly associated with desilication. First-principles periodic density
functional theory (DFT) and hybrid QM/QM calculations have been employed in order to
analyze full reaction paths leading to extraframework species and to quantify the activation
energies of the determining steps. It has been demonstrated that the initiation of an Al-O(H)
bond break takes place via water adsorption on the Al atom in anti-position to the Brønsted
acid site, via a penta- or tetra-coordinated Al species. Such species are shown to be at the
initiation of the Al dislodgement from the zeolitic framework. A subsequent 1,2-dissociation
of water on adjacent framework oxygen with axial substitution of the silanol group leads to
the first Al-O(H) bond break. Once the first Al-O bond is broken and the Al atom becomes
more flexible in terms of structural changes, alternative pathways are possible, which were
investigated. In particular, the occurrence of 1,2-dissociation of water with equatorial
substitution of Si-OH becomes competitive. Despite a strong structural heterogeneity of T
sites, we determined of Brønsted-Evans-Polanyi (BEP) relationships for the entire
dealumination pathway. Moreover, it is shown that not only the initiation and propagation
mechanisms are primordial for the understanding of an Al extraction, but also the
confinement effect on EFAL species within the zeolites cavities. Finally, from the energy
profile of combined dealumination/desilication pathways, we show that it is
thermodynamically favored to extract EFSI in the course dealumination..