
A Simple Class-Set Based Vegetation Classification of a...
4
A Simple Class-Set Based Vegetation Classification of a South Pacific Volcanic Island (Moorea Island, French Polynesia) using Both AirSAR and MASTER Data Benoît Stoll (1) , Patrick Capolsini (2) Terre-Océan Laboratory French Polynesia University (UPF) BP 6570, FAA'A – TAHITI – French Polynesia (1) [email protected] , (2) [email protected] Abstract—This paper addresses the vegetation mapping and land use of Opunohu Valley (Moorea Island - French Polynesia) using JPL-AirSAR and MASTER (MODIS/ASTER simulator) images. We first define an original set of classes based on the relative canopy-height of vegetation, out of a well-suited RGB SAR- composite image that visually discriminates our vegetation classes. An interesting “pineapple fields” class (an important economic resource in Moorea island) proves to discriminate particularly from the height-related “Low Vegetation” class. Two supervised maximum likelihood classification maps have been processed on both the AirSAR and the MASTER images, using aerial photographs as a ground truth training set. The vegetal species included in each class as well as the classification results are discussed. Comparison of the MASTER and AirSAR based classification results leads us to propose a fusion of AirSAR and MASTER classification maps keeping the best of both worlds in order to improve the overall accuracy of the AirSAR classification. Keywords: vegetation mapping, JPL-AirSAR, MASTER, Classification, AirSAR/MASTER Fusion. I. INTRODUCTION The JPL-NASA PACRIM2 mission [1] occurred in August 2000, providing a complete set of data from both MODIS/ASTER and AirSAR sensors on the main French Polynesian islands and atolls. This study addresses the vegetation mapping [2] of South Pacific Volcanic Islands [3] using this complementary data set. Moorea Island is located in the Society Archipelago (French Polynesia), South Pacific (149°5'W, 17°32'S). We presently focus on Opunohu Valley (the main caldera of Moorea Island) (Fig. 1) because of its highly representative diversity of vegetation [4] and land cover (found in other Polynesian high islands), including different types of forests, coconut fields, grass fields, fern lands, urban zones, agricultural areas, etc. II. MATERIALS AND METHODS A. Image Data • MODIS/ASTER (MASTER) [5] is a multi-spectral imaging scanner with 50 channels distributed in the visible-shortwave infrared, mid infrared and thermal infrared. After geometric correction the pixel size is 20 meters. • JPL-AirSAR: The data set on Moorea island is made out of two scenes, in XTI1 mode: C-band single- baseline Interferometry in VV polarization (TOPSAR) and L-band Polarimetry (POLSAR), (P-band Polarimetry is lacking). The 40MHz Bandwidth was used therefore the pixel size is 5m. Figure 1. Moorea Island JPL-AirSAR image (L-band Total Power) and Opunohu Valley area 0-7803-8742-2/04/$20.00 (c) 2004 IEEE 2688
Transcript of A Simple Class-Set Based Vegetation Classification of a...

A Simple Class-Set Based Vegetation Classification of a South Pacific Volcanic Island (Moorea Island,
French Polynesia) using Both AirSAR and MASTER Data
Benoît Stoll (1), Patrick Capolsini (2) Terre-Océan Laboratory
French Polynesia University (UPF) BP 6570, FAA'A – TAHITI – French Polynesia
(1) [email protected], (2) [email protected]
Abstract—This paper addresses the vegetation mapping and land use of Opunohu Valley (Moorea Island - French Polynesia) using JPL-AirSAR and MASTER (MODIS/ASTER simulator) images. We first define an original set of classes based on the relative canopy-height of vegetation, out of a well-suited RGB SAR-composite image that visually discriminates our vegetation classes. An interesting “pineapple fields” class (an important economic resource in Moorea island) proves to discriminate particularly from the height-related “Low Vegetation” class. Two supervised maximum likelihood classification maps have been processed on both the AirSAR and the MASTER images, using aerial photographs as a ground truth training set. The vegetal species included in each class as well as the classification results are discussed. Comparison of the MASTER and AirSAR based classification results leads us to propose a fusion of AirSAR and MASTER classification maps keeping the best of both worlds in order to improve the overall accuracy of the AirSAR classification.
Keywords: vegetation mapping, JPL-AirSAR, MASTER, Classification, AirSAR/MASTER Fusion.
I. INTRODUCTION The JPL-NASA PACRIM2 mission [1] occurred in August
2000, providing a complete set of data from both MODIS/ASTER and AirSAR sensors on the main French Polynesian islands and atolls.
This study addresses the vegetation mapping [2] of South Pacific Volcanic Islands [3] using this complementary data set.
Moorea Island is located in the Society Archipelago (French Polynesia), South Pacific (149°5'W, 17°32'S).
We presently focus on Opunohu Valley (the main caldera of Moorea Island) (Fig. 1) because of its highly representative diversity of vegetation [4] and land cover (found in other Polynesian high islands), including different types of forests, coconut fields, grass fields, fern lands, urban zones, agricultural areas, etc.
II. MATERIALS AND METHODS
A. Image Data • MODIS/ASTER (MASTER) [5] is a multi-spectral
imaging scanner with 50 channels distributed in the visible-shortwave infrared, mid infrared and thermal infrared. After geometric correction the pixel size is 20 meters.
• JPL-AirSAR: The data set on Moorea island is made out of two scenes, in XTI1 mode: C-band single-baseline Interferometry in VV polarization (TOPSAR) and L-band Polarimetry (POLSAR), (P-band Polarimetry is lacking). The 40MHz Bandwidth was used therefore the pixel size is 5m.
Figure 1. Moorea Island JPL-AirSAR image (L-band Total Power) and
Opunohu Valley area
0-7803-8742-2/04/$20.00 (c) 2004 IEEE 2688

Figure 2. Opunohu Valley MASTER image (5,3,2 bands)
B. Image Processing A geometric correction of the MASTER Data (Fig. 2) has
been processed (AirSAR Data are already corrected by JPL), to match the AirSAR geometry. A geo-referencement step gives a common ground reference for both images.
A mosaic of the AirSAR data has been performed to provide a complete image of Moorea Island.
AirSAR Data mask is based on the radar shadows and water area while the MASTER Data mask includes both shadows and cloudy areas. A common mask is created including the masked areas of both images in order to compare the classification results.
The final Opunohu Valley study area is 1024*1024 pixels.
C. Classes Definition A class set has been defined on a relative vegetation density
since radar backscattering signal is representative of structural properties of the vegetation (volume, crown complexity).
We define a RGB composite (Fig. 3) with respectively C-VV, L-HV, L-HH bands used as Red, Green and Blue.
The colors in the resulting RGB composite image outline the vegetation properties (Fig. 4). For example a low vegetation area will be represented in red, and dark green will represent a high density of vegetation. We can visually discriminate 5 different classes.
TABLE I. VEGETATION CLASS SET
High Forest (HF) Low Vegetation (LV) Urban Zone (UZ)Medium Forest (MF) Pineapple Field (PF) UnClassified
(Colors and class names suitable for the following classification maps)
Figure 3. Opunohu Valley JPL-AirSAR RGB Composite
Figure 4. AirSAR Classes Mean Signature (Normalized)
TABLE II. FILTERED IMAGE ROI SEPARABILITY INDEX (JEFFRIES MATUSITAAS)
Low Vegetation Pineapple Field 1.25635474 High Forest Medium Forest 1.75250398 Medium Forest Urban Zone 1.86430262High Forest Urban Zone 1.90294545Low Vegetation Urban Zone 1.90301543Pineapple Field Urban Zone 1.91280686 Medium Forest Pineapple Field 1.98632083 Low Vegetation Medium Forest 1.98817265Low Vegetation High Forest 1.99698506 High Forest Pineapple Field 1.99796923
0-7803-8742-2/04/$20.00 (c) 2004 IEEE 2689
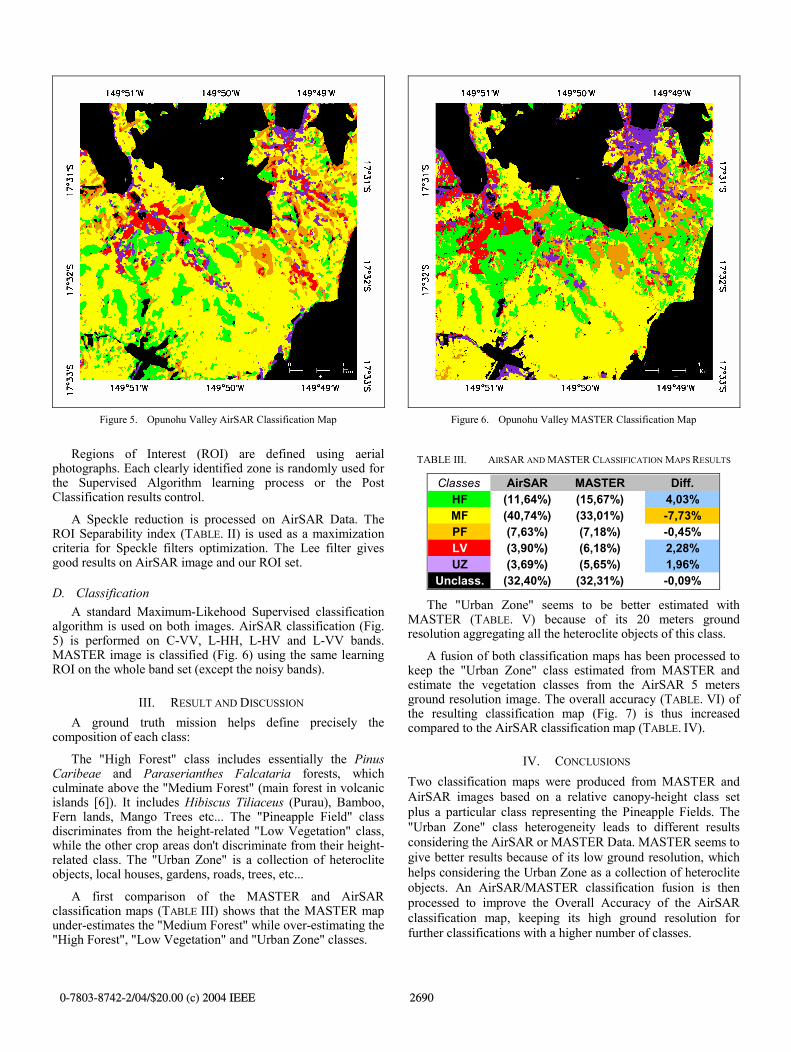
Figure 5. Opunohu Valley AirSAR Classification Map
Regions of Interest (ROI) are defined using aerial photographs. Each clearly identified zone is randomly used for the Supervised Algorithm learning process or the Post Classification results control.
A Speckle reduction is processed on AirSAR Data. The ROI Separability index (TABLE. II) is used as a maximization criteria for Speckle filters optimization. The Lee filter gives good results on AirSAR image and our ROI set.
D. Classification A standard Maximum-Likehood Supervised classification
algorithm is used on both images. AirSAR classification (Fig. 5) is performed on C-VV, L-HH, L-HV and L-VV bands. MASTER image is classified (Fig. 6) using the same learning ROI on the whole band set (except the noisy bands).
III. RESULT AND DISCUSSION A ground truth mission helps define precisely the
composition of each class:
The "High Forest" class includes essentially the Pinus Caribeae and Paraserianthes Falcataria forests, which culminate above the "Medium Forest" (main forest in volcanic islands [6]). It includes Hibiscus Tiliaceus (Purau), Bamboo, Fern lands, Mango Trees etc... The "Pineapple Field" class discriminates from the height-related "Low Vegetation" class, while the other crop areas don't discriminate from their height-related class. The "Urban Zone" is a collection of heteroclite objects, local houses, gardens, roads, trees, etc...
A first comparison of the MASTER and AirSAR classification maps (TABLE III) shows that the MASTER map under-estimates the "Medium Forest" while over-estimating the "High Forest", "Low Vegetation" and "Urban Zone" classes.
Figure 6. Opunohu Valley MASTER Classification Map
TABLE III. AIRSAR AND MASTER CLASSIFICATION MAPS RESULTS
Classes AirSAR MASTER Diff.HF (11,64%) (15,67%) 4,03%MF (40,74%) (33,01%) -7,73%PF (7,63%) (7,18%) -0,45%LV (3,90%) (6,18%) 2,28%UZ (3,69%) (5,65%) 1,96%
Unclass. (32,40%) (32,31%) -0,09% The "Urban Zone" seems to be better estimated with
MASTER (TABLE. V) because of its 20 meters ground resolution aggregating all the heteroclite objects of this class.
A fusion of both classification maps has been processed to keep the "Urban Zone" class estimated from MASTER and estimate the vegetation classes from the AirSAR 5 meters ground resolution image. The overall accuracy (TABLE. VI) of the resulting classification map (Fig. 7) is thus increased compared to the AirSAR classification map (TABLE. IV).
IV. CONCLUSIONS Two classification maps were produced from MASTER and AirSAR images based on a relative canopy-height class set plus a particular class representing the Pineapple Fields. The "Urban Zone" class heterogeneity leads to different results considering the AirSAR or MASTER Data. MASTER seems to give better results because of its low ground resolution, which helps considering the Urban Zone as a collection of heteroclite objects. An AirSAR/MASTER classification fusion is then processed to improve the Overall Accuracy of the AirSAR classification map, keeping its high ground resolution for further classifications with a higher number of classes.
0-7803-8742-2/04/$20.00 (c) 2004 IEEE 2690

Figure 7. Opunohu Valley AirSAR/MASTER Classification Fusion Map
ACKNOWLEDGMENT The Authors would like to thank the Government of French Polynesia, particularly the Urbanism Department for providing the AirSAR, MASTER and Aerial Photographs required for this study. Many thanks to the French Polynesia Research Delegation and Malardé Institute for providing vegetation skills.
REFERENCES [1] Milne, A.K. and I. Tapley, Pacrim2 Airsar Deployment to the Asia-
Pacific Region August-October 2000: Report on the Data Acquisition Phase and Early Results. 2000.
[2] Lee, K.Y., S.C. Liew, and L.K. Kwoh. Land Cover Classification and Interpretation of NASA / JPL AIRSAR Data Based on Scattering Mechanisms and Statistical Distribution. in ACRS 2002. 2002.
[3] Tapley, I.J. Benefits of Topsar Radar Interferometry in Tropical Terrains. in ACRS 2000. 2000.
[4] Kellndorfer, J.M., et al., Toward Precision Forestry: Plot-Level Parameter Retrieval for Slash Pine Plantation with JPL AIRSAR. IEEE Trans. on Geoscience and Remote Sensing, 2003.
[5] Hook, S.J., et al., The MODIS/ASTER Airborn Simulator (MASTER)-a new instrument for earth science studies. Remote Sensing of Environment, 2001. 76: p. 93-102.
[6] Mueller-Dombois and Fosberg, Vegetation of the Tropical Pacific Islands, ed. Springer. 1998.
TABLE IV. AIRSAR CLASSIFICATION MAP CONFUSION MATRIX (PRODUCER ACCURACY)
Overall Accuracy 77,86%Kappa Coefficient 0,7198
Ground TruthClasses UZ MF HF PF LVUnclass. 11,70% 0,00% 6,32% 0,00% 0,00%
UZ 51,33% 0,92% 17,12% 1,72% 15,52%MF 23,87% 91,45% 3,50% 3,97% 3,41%HF 9,83% 5,74% 72,29% 0,00% 0,27%PF 0,47% 1,88% 0,33% 86,86% 9,55%LV 2,81% 0,00% 0,43% 7,45% 71,25%
TABLE V. MASTER CLASSIFICATION MAP CONFUSION MATRIX (PRODUCER ACCURACY)
Overall Accuracy 80,20%Kappa Coefficient 0,7452
Ground TruthClasses UZ MF HF PF LVUnclass. 11,70% 0,00% 6,32% 0,00% 0,00%
UZ 81,44% 0,00% 0,16% 1,20% 10,27%MF 0,16% 75,21% 1,30% 0,00% 0,19%HF 0,00% 22,06% 70,83% 0,52% 2,43%PF 6,55% 0,00% 8,82% 98,28% 7,04%LV 0,16% 2,73% 12,56% 0,00% 80,07%
TABLE VI. AIRSAR/MASTER CLASSIFICATION FUSION MAP CONFUSION MATRIX (PRODUCER ACCURACY)
Overall Accuracy 86,64%Kappa Coefficient 0,8283
Ground TruthClasses UZ MF HF PF LVUnclass. 0,31% 0,00% 5,92% 0,00% 0,00%
UZ 83,62% 0,00% 0,08% 1,01% 11,15%MF 13,26% 95,71% 2,25% 5,43% 8,80%HF 2,81% 2,48% 90,94% 0,00% 0,93%PF 0,00% 1,81% 0,30% 89,25% 4,88%LV 0,00% 0,00% 0,52% 4,31% 74,23%
0-7803-8742-2/04/$20.00 (c) 2004 IEEE 2691


![[Vegetation and Remote Sensing] Vegetation](https://static.fdocuments.us/doc/165x107/577cdfd71a28ab9e78b21a32/vegetation-and-remote-sensing-vegetation.jpg)


