A Scientometric Analysis of Public Transport Research
31
Journal of Public Transportation, Vol. 18, No. 2, 2015 111 A Scientometric Analysis of Public Transport Research Leonard Heilig, University of Hamburg, Germany Stefan Voß, University of Hamburg and PUCV, Valparaiso, Chile Abstract Public transport research involves a lot of disciplinary and interdisciplinary research applying methods, techniques, and technologies to investigate, regulate, and advance public transport. e importance of research in this area has led to a huge amount of publications in recent years. In this study, we conducted a comprehensive scientometric analysis of related literature published in 2009–2013 to empirically explore the consistence, focus areas, and key contributors of public transport research from a meta-perspective, providing novel insights into publication patterns, major topics, research impact, and pro- ductivity by focusing on short-term developments. As such, the results of this study provide a novel perspective on public transport research and may help achieving an overview on important characteristics. Keywords: Public transport, public transport research, scientometric analysis, scientomet- rics, keyword cluster analysis. Introduction Public transport, as a mode of transportation moving people from one place to another by publicly-used forms of conveyance (Levinson et al. 2015), plays an essential role not only for providing sustainable transport forms (Krygsman et al. 2004) and serving the urban and inter-urban travel needs of those who are dependent on efficient transport means, but also for supporting social equity principles (Webster and Bly 1982). e per- formance of local public transport in terms of accessibility, safety, and efficiency not only affects inhabitants day by day, but also influences the destination satisfaction of visitors such as business travelers and tourists (ompson and Schofield 2007). Further, the qual- ity of public transport as well as the interplay between different inter-urban and urban transportation systems, including car and bike sharing systems, become increasingly important not only in our modern society, but also in developing countries (Sohail et al. 2006). Public transport demand is stimulated by social and economic conditions (e.g., city population, income, car ownership, land use) as well as by direct demand factors such as fares and service quality (Webster and Bly 1982). Against this backdrop, public transport
Transcript of A Scientometric Analysis of Public Transport Research
Journal of Public Transportation, Vol. 18, No. 2, 2015 111
A Scientometric Analysis of Public Transport Research
Leonard Heilig, University of Hamburg, Germany
Stefan Voß, University of Hamburg and PUCV, Valparaiso, Chile
Abstract
Public transport research involves a lot of disciplinary and interdisciplinary research applying methods, techniques, and technologies to investigate, regulate, and advance public transport. The importance of research in this area has led to a huge amount of publications in recent years. In this study, we conducted a comprehensive scientometric analysis of related literature published in 2009–2013 to empirically explore the consistence, focus areas, and key contributors of public transport research from a meta-perspective, providing novel insights into publication patterns, major topics, research impact, and pro-ductivity by focusing on short-term developments. As such, the results of this study provide a novel perspective on public transport research and may help achieving an overview on important characteristics.
Keywords: Public transport, public transport research, scientometric analysis, scientomet-rics, keyword cluster analysis.
IntroductionPublic transport, as a mode of transportation moving people from one place to another by publicly-used forms of conveyance (Levinson et al. 2015), plays an essential role not only for providing sustainable transport forms (Krygsman et al. 2004) and serving the urban and inter-urban travel needs of those who are dependent on efficient transport means, but also for supporting social equity principles (Webster and Bly 1982). The per-formance of local public transport in terms of accessibility, safety, and efficiency not only affects inhabitants day by day, but also influences the destination satisfaction of visitors such as business travelers and tourists (Thompson and Schofield 2007). Further, the qual-ity of public transport as well as the interplay between different inter-urban and urban transportation systems, including car and bike sharing systems, become increasingly important not only in our modern society, but also in developing countries (Sohail et al. 2006). Public transport demand is stimulated by social and economic conditions (e.g., city population, income, car ownership, land use) as well as by direct demand factors such as fares and service quality (Webster and Bly 1982). Against this backdrop, public transport
A Scientometric Analysis of Public Transport Research
Journal of Public Transportation, Vol. 18, No. 2, 2015 112
research consists of a range of research activities to understand, regulate, and advance public transport from several perspectives and under certain circumstances. Conse-quently, the field involves not only disciplinary research, but also requires interdisciplinary and even transdisciplinary research to tackle current and future challenges, meaning that scholars from different subjects and practitioners share their experiences and perspec-tives in collaborative works to study the subject in its wider context, such as the interplay with technical, economic, social, and information technology-related aspects. Challenges include those related to planning and operations, information management, regulations, traffic congestion, safety and security, energy consumption, and health issues in urban environments.
Given the considerable number of research contributions in recent years, reflecting the international scope of transport research and the growing number of people research-ing in transport (Banister 2014), it is essential to investigate the current state of public transport. The huge growth in publications require an overseeable entry point on a meta level to better explore specific aspects in greater depth in a next step, which is especially important for new researchers aiming to become experts in the field (Banister 2014). This entry point can be provided by a scientometric analysis of public transport research, which extends, on a higher level, common public transport-related reviews on specific topics.
Scientometrics refers to quantitative studies and methods to measure and analyze sci-ence from a meta-perspective (Van Raan 1996; Schwarze et al. 2012). Scientometric stud-ies can support the development and improvement of an academic discipline (Lewis et al. 2007; Straub 2006) by serving as a vital basis for defining and debating future research agendas (Serenko and Bontis 2004). Assuming that scientific activities are reflected through scientific publications, scientometric studies apply empirical measures to analyze scientific output of a specific field. A scientometric analysis can give some indication of research activities in general, such as with respect to research outlets, research impact, co-citations, influential countries/affiliations/authors, and development of key topics. For further reading, see, e.g., Hood and Wilson (2001), Leydesdorff (2002), Leydesdorff and Schank (2008), Van Raan (1996), Straub (2006), and Voß and Zhao (2005). Going fur-ther, scientometrics, as an evaluation tool of science, increasingly impacts the resource distribution of research institutions (Voß and Zhao 2005) and can be used to analyze how research is funded. While evaluating science has a long tradition in many fields, we identified an absence of scientometric studies in the area of public transport research.
In this paper, we present a comprehensive scientometric analysis that empirically explores publications related to public transport covered by Elsevier’s Scopus database from 2009 to 2013. Although it might be interesting to extend the timeframe, we intended to focus on the past five years to better reflect recent developments rather than biasing impli-cations with long-term developments. The latter may be considered in future research. For the analysis of short-term developments, we aimed to comprehensively cover publi-cations that are available in Scopus for that timeframe to provide empirical insights on public transport research in general. In total, we investigated 7,868 publications. With our study, we aimed to explore general patterns on how research is conducted and conveyed within the community as well as what key contributing and influencing forces are serving
A Scientometric Analysis of Public Transport Research
Journal of Public Transportation, Vol. 18, No. 2, 2015 113
the current and future development of public transport research. Our scientometric analysis was structured according to these research questions. By applying scientometric means to the body of publications, we provided extensive insights into publishing pat-terns (e.g., academic disciplines, contributing countries, number of authors, and distri-bution of outlets) and analyzed frequent keywords as well as keyword co-occurrences to identify widely-discussed topics and current trends. Finally, we explored the application of Lotka’s law, which describes a frequency distribution of scientific productivity widely applied in scientometric studies.
Generally, this paper presents novel insights from a meta-perspective. Due to limitations of space, this study does not intend to give an overview of public transport in general (for further reading, the reader is referred to, e.g., Larson and Odoni 1981; Ceder 2007; White 2008; Levinson et al. 2015, together with some of those contributions to the field exemplified in the appendix that follows). To the best of our knowledge, this is the first scientometric analysis in the field of public transport research.
The remainder of this paper is organized as follows. The next section briefly describes the methodology and methods being applied. Then, publishing patterns are investigated and further analyzed to understand the consistence of the research area. Key topics as well as dependencies between topics of public transport research are observed by analyzing top keywords and keyword clusters, and the impact and productivity of public transport research is examined. The results from applying Lotka’s law to our observations are also presented, and, finally, a conclusion and ideas for further research are given.
Research MethodologySeveral steps were necessary to retrieve scientometric findings from a selection of publi-cations. This scientometric analysis intended to explore a large number of peer-reviewed publications published in the years 2009–2013 in, or at least strongly related to, the field of public transport research. We chose a period of five years to focus primarily on recent publications. A comprehensive and accurate collection of corresponding publications builds a foundation to gain empirical evidence for supporting the meta-scientific findings. The methodology basically encompassed the phases of data collection, data cleansing, data processing, and proofreading, further explained in the following.
Data Collection and CleansingFor the collection of bibliographic data, we used Elsevier’s Scopus, which provides advanced functionality to export structured data, including citations and bibliographic data as well as abstracts, keywords, and references based on a search query. A compre-hensive collection of structured data on publications builds the basis for semi-automatic data processing activities and minimizes extremely cost- and labor-intensive manual pro-cessing (Heilig and Voß 2014; Serenko and Bontis 2004). The reason for choosing Scopus is that it provides decisive advantages over other bibliographic databases such as Thomas Reuter’s Web of Science (WoS). In addition to advanced export functionality and more frequent updates, Scopus covers more than twice as many publications from the area of public transport research (see Table 1). In comparison, WoS covers only 53% of the transport-related journals that are indexed by Scopus and does not provide any additional

A Scientometric Analysis of Public Transport Research
Journal of Public Transportation, Vol. 18, No. 2, 2015 114
journals that are not already covered by Scopus (see Appendix A). The numbers also indi-cate a constant increase of publications, which was recently discussed in Banister (2014). Although Google Scholar stands out in its coverage of citation counts, it does not provide means to export structured bibliographic data. Nevertheless, we manually incorporated citation counts from Google Scholar to provide a more accurate picture on top publica-tion citation patterns (see Appendix B). A limitation of using bibliography databases is, however, that it can take a while until new publications are indexed.
TABLE 1. Number of Publications
per Year
Database 2009 2010 2011 2012 2013 Overall
Scopus 1,269 1,318 1,618 1,745 1,918 7,868
ISI WoS 654 646 673 764 801 3,538
To retrieve a comprehensive amount of publications, a generic search query is used based on empirical observations during our study. We used the terms *public transport*, *public transit*, *mass transit*, and *urban transport* in the fields Title, Abstract, Keywords, and Source Title (title of the publication outlet). The asterisk represents a wildcard character so that other terms such as urban transportation also are considered. As we also obtained some non-related publications from fields such as biochemistry and medicine (mainly due to the term mass transit), we further refined the search query by specifying supe-rior research disciplines, including engineering, geography and environmental science, material science, energy, decision sciences, mathematics, computer science, business and economics, and social sciences. The search query found 8,087 data records in the period from 2009 to 2013 (as of May 19, 2014). Then, a cleansing method detected and removed inaccurate data records (e.g., unspecified authors/title, double entries, etc.). The final selection of data records represents a selection of 7,868 publications containing 160,132 references and 22,247 unique keywords. Note that one keyword refers to a complete entry in the keywords list such as that public transport, for example, is considered as one keyword, which also applies for acronyms. Only 91.85% of those publications had a non-empty bibliography, resulting in an average of 22.16 references per article (median value of 16 references). Most publications, at an average 92.18%, are written in English. A small percentage, 4.68%, are published in Chinese (i.e., Mandarin) where the metadata can be processed in English.
Data ProcessingBesides rather general classification and aggregation methods, we applied scientometric methods from the literature to measure research productivity and impact. Further, we implemented methods to analyze keywords and keyword clusters.
Research ProductivityResearch productivity is measured predominantly by the aggregated number of pub-lications of an individual author, a specific affiliation, and/or of a certain publication outlet. Different approaches are used in the literature to measure research productivity: straight count, author position, and equal credit (Holsapple et al. 1994; Serenko and Bontis 2004). The straight count method assigns a score of 1 to each of the co-authors of a publication and, thus, does not discriminate among authors. Although this might be

A Scientometric Analysis of Public Transport Research
Journal of Public Transportation, Vol. 18, No. 2, 2015 115
reasonable for alphabetically-ordered author lists, the method undervalues the produc-tivity of single-author papers and favors individual co-authors of multi-author papers in which the main contributor is the first author. In contrast, the author position method assigns higher scores to anterior authors (Howard et al. 1987). The consideration of the author’s position, however, might lead to erroneous results when author lists are ordered alphabetically. The equal credit method compensates those errors by scoring individual authors based on the reciprocal of the number of authors. Consequently, the productivity of individual authors decreases by each additional author. In this study, we focused on the equal credit method, as it involves the least tradeoff and error-proneness.
Research ImpactThe research impact was measured based on the citations of publications. We calculated the individual citations of journals, conferences, affiliations, and authors as well as the Normalized Citation Impact Index (NCII), which takes into account the longevity of pub-lications (Serenko and Bontis 2004). Note that we considered all citations for measuring impact, not only those retrieved from publications within our selection.
Keyword and Keyword Cluster AnalysisTo analyze current focus areas, trends and the interrelation of certain keywords in the field of public transport, we implemented a method for counting all occurrences and co-occurrences of keywords. While the latter involves a huge amount of comparative operations to identify and count common combinations of keywords, a simple count method as used to retrieve top keywords.
ProofreadingTo ensure the correctness of the scientometric findings, semi-automatic reviews were conducted to find and correct inconsistencies. These inconsistencies might result from a non-standard specification of certain metadata or missing identification numbers. For instance, the author’s affiliation description might occur in different forms and may require careful checking to determine if identical authors are merged correctly; otherwise, related data must be merged manually.
Analysis of Publishing PatternsTo begin, we analyzed the overall consistence of public transport research in terms of publishing patterns. First, we identified major scientific disciplines mainly responsible for the progress in this area of research. Then, we identified contributing countries and investigated publishing patterns on the document level. This involved an analysis of the co-authorship distribution, distribution of document types, referencing patterns, and the number of publications per publication outlet to partially understand how research is produced and conveyed within the community.
Academic DisciplinesTo better understand the consistence of public transport research, it is essential to ana-lyze the distribution of main contributing academic disciplines. Thereby, some implica-tions on dominant disciplines can be derived in general. Note that Scopus assigns each publication to at least one academic discipline, i.e., subject area (Scopus 2012). The range

A Scientometric Analysis of Public Transport Research
Journal of Public Transportation, Vol. 18, No. 2, 2015 116
of subject areas is limited and not specifically related to the area of public transport. Due to these limitations, we extend the analysis of subject areas by specifically analyzing key-words presented in a later section.
The results in Table 2 reveal some interesting patterns. While it is not surprising that most of the research activities stem from social sciences and engineering, the high percentage of computer science-related research demonstrates the importance of information and communication technology (ICT) and information systems in public transport nowadays. Further, the environmental impact of public transport systems increasingly is being inves-tigated, leading to research on eco-friendly fuel and vehicle alternatives, traffic control, and other measures for reducing harmful air pollution. This requires more research on the interface between public transport and other disciplines such as computer science and environmental science.
TABLE 2. Academic Disciplines Related
to Public Transport
Academic Discipline Avg. (%)
Social Sciences 32.86
Engineering 28.46
Computer Science 13.35
Environmental Science 8.07
Decision Sciences 4.94
Mathematics 3.53
Business, Management, and Accounting 3.17
Economics, Econometrics, and Finance 2.77
Energy 2.25
Materials Science 0.60
The small percentage of research from mathematics and decision sciences, which plays an essential role in the planning and operation of public transport systems and related structures (such as for route design, timetable development, and crew scheduling; see e.g., Ceder 2007; Kroon et al. 2009; Levinson et al. 2015), can be explained by the fact that more than one academic discipline can be assigned to one publication. Further note that the small share of economics-related research does not mean that research is not based on economics, but that related publications often are not, or not only, labeled as pure economics research papers. As the field involves a lot of interdisciplinary research, theories and methods from the field of mathematics and decision sciences often are combined with engineering and computer science research activities. The same applies for studies focusing on public transport aspects from a business and economics perspective—for instance, in the context of infrastructure investments, which is also related to engineering research (e.g., civil engineering). The concentration of research activities of the various aca-demic disciplines also is reflected in the results of the keyword and keyword cluster analysis described later, in which important topics and interrelations between topics are explored.
Contributing CountriesNext, we analyzed the distribution of contributing countries. To consider the impact of contributions, we separately investigated the main contributing countries of publications

A Scientometric Analysis of Public Transport Research
Journal of Public Transportation, Vol. 18, No. 2, 2015 117
that are cited at least 10 times by other publications. Table 3 lists the top contributing countries of both selections with a contribution frequency f of at least 1.00%. The num-bers indicate that most of the publications are published by scholars from China (18.82%), followed by a large portion of publications from the United States and the United King-dom. Note that we do not distinguish whether an author is a native or, for instance, a visiting scholar publishing with an affiliation in the respective country. The numbers demonstrate that most research contributions are from countries with a relatively large share of public transport. Some of them are facing serious transport problems, such as those related to traffic congestion (see, e.g., Vickerman 2000). Nevertheless, we must consider that some countries, such as the United States, United Kingdom, Germany, and China, are generally top research contributors in rather fundamental topics important for their development due to their leading role in the global economy and technological progress, as also demonstrated in other scientometric studies (see e.g., Heilig and Voß 2014). Taking into account the number of citations, we observe that authors from the United States (21.84%) have published most of widely-recognized publications.
TABLE 3. Contributing Countries
Rank Country f (%)* Rank Country f (%)**
1 China 18.82 1 United States 21.84
2 United States 14.85 2 United Kingdom 28.35
3 United Kingdom 5.66 3 China 7.07
4 Australia 4.60 4 Italy 6.42
5 Germany 3.99 5 Australia 6.00
6 Canada 3.67 6 Canada 4.93
7 Italy 3.58 6 Germany 4.93
8 Spain 3.50 8 Spain 4.50
9 France 3.43 9 Netherlands 3.64
10 Japan 2.52 10 France 3.21
11 Netherlands 2.03 10 Sweden 3.21
12 India 1.91 12 Belgium 2.36
13 Sweden 1.69 13 Greece 1.71
14 Belgium 1.67 13 Switzerland 1.71
15 Taiwan 1.40 13 Japan 1.71
16 South Korea 1.32 16 Chile 1.50
17 Portugal 1.26 17 Taiwan 1.28
18 Switzerland 1.24 17 Hong Kong 1.28
19 Austria 1.20 17 Brazil 1.28
20 Brazil 1.10 20 Portugal 1.07
Total 79.45 Total 88.01
*All publications **Publication citations ≥ 10

A Scientometric Analysis of Public Transport Research
Journal of Public Transportation, Vol. 18, No. 2, 2015 118
Co-Authorship DistributionBy analyzing the co-authorship distribution, we observed that the number of co-authors per publication ( f) lies between 1 and 3 for almost three-quarters of all publications n, as shown in the last column of Table 4. A relatively high percentage, at an average 22.06% of publications, is published by a single author. Although a high number of authors might indicate that collaboration may have some advantages over research by individual research-ers, for instance, due to the high degree of interdisciplinarity in the field, the numbers demonstrate that public transport research often is very specialized and concerns individual issues, for instance, based on certain conditions in an area of interest. The high percentage of single-authored works underlines these findings. By analyzing co-authorship distribution for multiple time-periods, however, we identified a decline of single-authored publications and a general increase of publications that are published by more than three authors. One of the main reasons is the growing demand for integrative approaches to further advance public transport, requiring interdisciplinary and transdisciplinary research collaborations.
TABLE 4. Co-Authorship Distribution
# of Authors 2009 (%) 2010 (%) 2011 (%) 2012 (%) 2013 (%) Overall (%)
1 26.48 24.45 23.99 18.31 17.08 22.06
2 27.11 30.13 27.98 27.32 27.41 27.99
3 23.72 22.94 25.46 26.87 25.70 24.94
4 13.87 13.55 13.65 16.09 16.41 14.71
5 5.28 4.39 5.29 6.39 7.68 5.81
6 1.81 2.50 2.09 2.51 3.06 2.39
7 0.95 1.21 0.80 1.37 1.40 1.15
> 7 0.79 0.83 0.74 1.14 1.25 0.95
n 1,269 1,318 1,618 1,745 1,918 7,868
Publication OutletThe conscious selection of an appropriate publication outlet often impacts the visibility and citations of publications. Therefore, we explored the distribution of publication outlets to identify the preferences of the community in terms of sharing and conveying knowledge. In Table 5, the numbers show that most of the publications, average 54.39%, are published as a journal paper. An increasing pressure to publish and the growing competition among journals and conferences further contribute to a growing number of publications per year (Banister 2014), leading to a discussion on different publishing strat-egies of authors and editors as well as on the quality impact (see, e.g., Faria and Goel 2010).
TABLE 5. Number of Publications
by Document Type
Outlet 2009 (%) 2010 (%) 2011 (%) 2012 (%) 2013 (%) Overall (%)
Article 51.22 55.39 51.55 56.68 57.14 54.39
Conference paper 42.63 38.85 40.17 38.28 36.97 39.38
Review 1.73 1.06 2.16 2.35 1.88 1.84
Short survey 2.52 1.59 1.11 0.74 0.16 1.23
Article in press - 0.08 0.06 0.46 2.50 0.62
Other 1.89 3.03 4.94 1.49 1.36 2.54
n 1,269 1,318 1,618 1,745 1,918 7,868
A Scientometric Analysis of Public Transport Research
Journal of Public Transportation, Vol. 18, No. 2, 2015 119
The numbers of journal and conference papers lie close together, and the distribution seems to be stable for the period 2009–2013. Although in some fields conference publica-tions are preferred, such as in computer science (Vardi 2009), the main reason for scholars to choose a journal is that their work naturally gains superior consideration, in particular if the journal has a high impact factor or a good reputation (Banister 2014). Apart from that, some scholars may prefer to get quick feedback and to present and discuss current prog-ress to an (international) audience of researchers in the same field for which a dedicated conference would be a better choice. In the field of public transport, we see that both alternatives are frequently used to convey knowledge and insights of research activities.
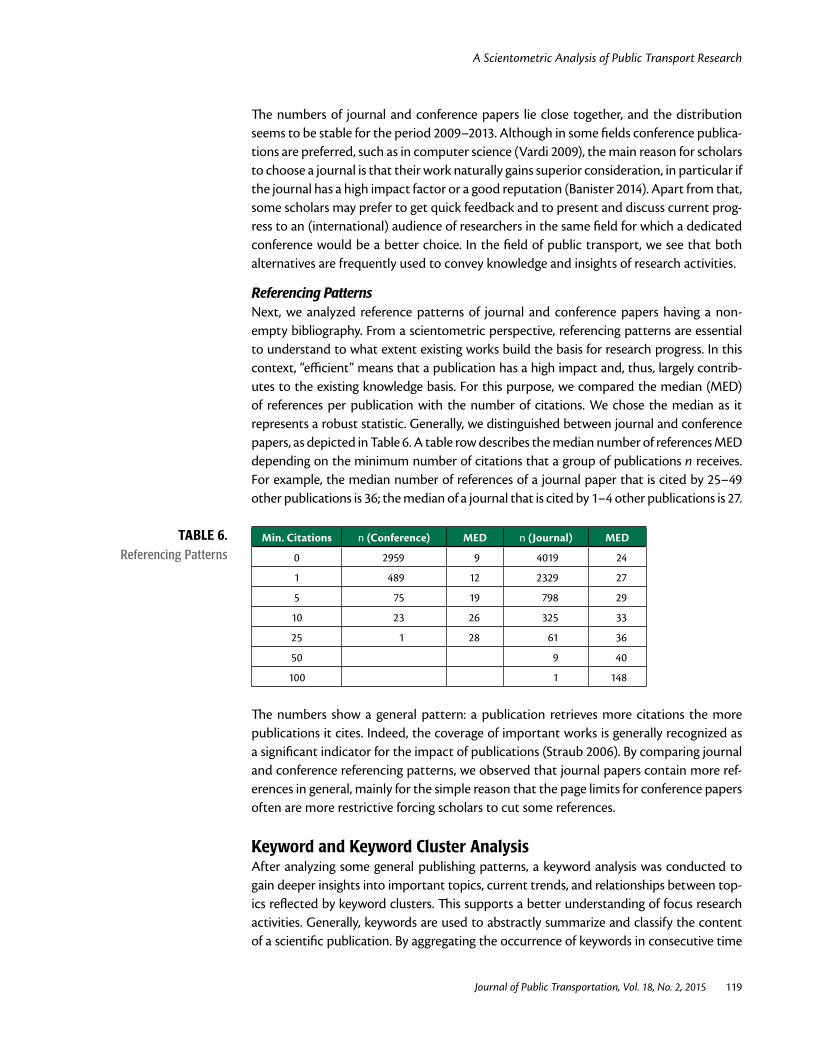
Referencing PatternsNext, we analyzed reference patterns of journal and conference papers having a non-empty bibliography. From a scientometric perspective, referencing patterns are essential to understand to what extent existing works build the basis for research progress. In this context, “efficient” means that a publication has a high impact and, thus, largely contrib-utes to the existing knowledge basis. For this purpose, we compared the median (MED) of references per publication with the number of citations. We chose the median as it represents a robust statistic. Generally, we distinguished between journal and conference papers, as depicted in Table 6. A table row describes the median number of references MED depending on the minimum number of citations that a group of publications n receives. For example, the median number of references of a journal paper that is cited by 25–49 other publications is 36; the median of a journal that is cited by 1–4 other publications is 27.
TABLE 6. Referencing Patterns
Min. Citations n (Conference) MED n (Journal) MED
0 2959 9 4019 24
1 489 12 2329 27
5 75 19 798 29
10 23 26 325 33
25 1 28 61 36
50 9 40
100 1 148
The numbers show a general pattern: a publication retrieves more citations the more publications it cites. Indeed, the coverage of important works is generally recognized as a significant indicator for the impact of publications (Straub 2006). By comparing journal and conference referencing patterns, we observed that journal papers contain more ref-erences in general, mainly for the simple reason that the page limits for conference papers often are more restrictive forcing scholars to cut some references.
Keyword and Keyword Cluster AnalysisAfter analyzing some general publishing patterns, a keyword analysis was conducted to gain deeper insights into important topics, current trends, and relationships between top-ics reflected by keyword clusters. This supports a better understanding of focus research activities. Generally, keywords are used to abstractly summarize and classify the content of a scientific publication. By aggregating the occurrence of keywords in consecutive time
A Scientometric Analysis of Public Transport Research
Journal of Public Transportation, Vol. 18, No. 2, 2015 120
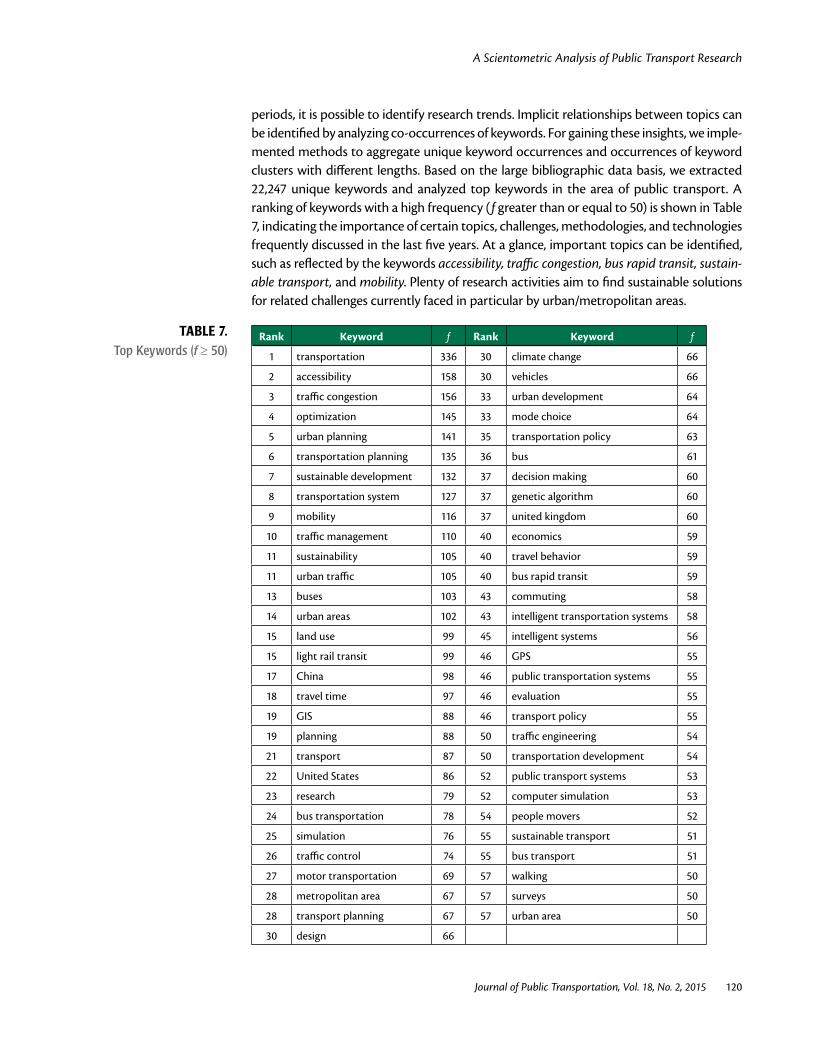
periods, it is possible to identify research trends. Implicit relationships between topics can be identified by analyzing co-occurrences of keywords. For gaining these insights, we imple-mented methods to aggregate unique keyword occurrences and occurrences of keyword clusters with different lengths. Based on the large bibliographic data basis, we extracted 22,247 unique keywords and analyzed top keywords in the area of public transport. A ranking of keywords with a high frequency ( f greater than or equal to 50) is shown in Table 7, indicating the importance of certain topics, challenges, methodologies, and technologies frequently discussed in the last five years. At a glance, important topics can be identified, such as reflected by the keywords accessibility, traffic congestion, bus rapid transit, sustain-able transport, and mobility. Plenty of research activities aim to find sustainable solutions for related challenges currently faced in particular by urban/metropolitan areas.
TABLE 7. Top Keywords (f ≥ 50)
Rank Keyword f Rank Keyword f
1 transportation 336 30 climate change 66
2 accessibility 158 30 vehicles 66
3 traffic congestion 156 33 urban development 64
4 optimization 145 33 mode choice 64
5 urban planning 141 35 transportation policy 63
6 transportation planning 135 36 bus 61
7 sustainable development 132 37 decision making 60
8 transportation system 127 37 genetic algorithm 60
9 mobility 116 37 united kingdom 60
10 traffic management 110 40 economics 59
11 sustainability 105 40 travel behavior 59
11 urban traffic 105 40 bus rapid transit 59
13 buses 103 43 commuting 58
14 urban areas 102 43 intelligent transportation systems 58
15 land use 99 45 intelligent systems 56
15 light rail transit 99 46 GPS 55
17 China 98 46 public transportation systems 55
18 travel time 97 46 evaluation 55
19 GIS 88 46 transport policy 55
19 planning 88 50 traffic engineering 54
21 transport 87 50 transportation development 54
22 United States 86 52 public transport systems 53
23 research 79 52 computer simulation 53
24 bus transportation 78 54 people movers 52
25 simulation 76 55 sustainable transport 51
26 traffic control 74 55 bus transport 51
27 motor transportation 69 57 walking 50
28 metropolitan area 67 57 surveys 50
28 transport planning 67 57 urban area 50
30 design 66

A Scientometric Analysis of Public Transport Research
Journal of Public Transportation, Vol. 18, No. 2, 2015 121
This includes activities in designing transport policies and involves urban and transport planning as well as urban development based on surveys, optimization, and simulation studies with regards to transport economics, efficiency, and environmental impacts. Moreover, the keyword ranking demonstrates a focus of research on certain transport modalities such as buses and light rail vehicles. We further see that the top three contrib-uting countries appear in the ranking of top keywords. This confirms that research on public transport often is related to certain countries with a relatively large share of public transport often facing severe challenges of implementing and advancing their public transport systems, as demonstrated by the ranking of top contributing countries. We also can see the strong influence of transportation research in general due to its implication on public transport (e.g., regarding infrastructure and safety aspects) as well as due to the impact of public transport on transportation in general (e.g., regarding sustainable transportation planning and development). Moreover, the importance of innovative technologies and information systems is confirmed, reflected by the keywords GIS (geo-graphic information system), traffic control, and intelligent transportation systems (ITS). This further explains the essential role of computer science-related research, or, in general terms, the importance of interdisciplinary research in the field of public transport. By ana-lyzing the occurrence of some particular keywords per year, it is possible to identify some current trends, for example, related to the focus on sustainability and transport vehicle technologies, expressed by the keywords sustainability, bus rapid transit, and electric vehi-cles. These exemplary research trends are depicted in Table 8.
TABLE 8. Keyword Trends
Keyword 2009 2010 2011 2012 2013
sustainability 7 11 23 21 36
bus rapid transit 6 10 10 11 18
electric vehicles 5 6 2 12 16
Topic coherence can be observed by analyzing keyword co-occurrences. We used the term keyword cluster to describe a group of a certain number of keywords that co-oc-cur frequently. As mentioned previously, a method was implemented to investigate the occurrence of all possible keyword combinations of different length by a pairwise comparison of respective keyword clusters. As some keywords refer to the superordinate area (e.g., transportation, public transportation, mass transit, urban transport, etc.), we excluded these keywords for the keyword cluster analysis to gain meaningful results. In the following, we present the results of the keyword cluster analysis for keyword cluster with two elements (Table 9) and three elements (Table 10).

A Scientometric Analysis of Public Transport Research
Journal of Public Transportation, Vol. 18, No. 2, 2015 122
Rank Keyword Cluster f
1 buses bus transportation 27
2 cost effectiveness multimodal transportation 21
2 Europe Eurasia 21
4 transportation system transportation planning 20
4 urban planning United States 20
6 traffic management traffic congestion 19
6 mass transit systems light rail transit 19
8 intelligent systems intelligent transportation systems 18
8 roads and streets motor transportation 18
8 transportation system traffic congestion 18
11 gas emissions greenhouse gases 17
11 transportation planning united states 17
11 urban planning sustainable development 17
11 automation people movers 17
11 transportation development transportation system 17
16 mobility accessibility 15
16 railroad transportation railroads 15
16 rapid transit light rail transit 15
16 transportation system transportation 15
16 urban transportation systems transportation 15
16 urban planning urban development 15
While some keyword clusters only contain word synonyms (e.g., gas emissions and green-house gases), some keyword clusters expose multiple interesting interrelations, such as between multimodal transportation and cost effectiveness, which reflects the impact of public transport as a part of transportation in general. Some keyword clusters further reveal the coherence between fundamental topics, such as that transportation planning is related to transportation infrastructure and transportation development as well as to transportation safety and road transport. Consequently, the keyword cluster analysis pro-vides the data for creating a topic network, which consists of nodes (representing topics) and edges (representing the relationship between topics). An extension of the keyword analysis would be the application of text mining methods based on the content of the publication (e.g., a simple word count). As computational time exponentially grows by increasing the number of publications to be analyzed, it would be beneficial to implement the method as a MapReduce algorithm to count words in publications in a parallel fash-ion to measure their importance (see, e.g., Akritidis and Bozanis 2012; Agrawal et al. 2011; Dean and Ghemawat 2008).
TABLE 9. Top Keyword Cluster of
Length 2 (f ≥15)

A Scientometric Analysis of Public Transport Research
Journal of Public Transportation, Vol. 18, No. 2, 2015 123
Rank Keyword Cluster f
1 buses bus transportation bus stop 10
2 bus transport transportation system railway transport 9
3 people movers light rail transit automation 8
3 gas emissions greenhouse gases global warming 8
3 bus services bus transportation buses 8
3 carbon dioxide emissions carbon dioxide global warming 8
3 people movers airports international airport 8
3 bus terminals bus stop bus transportation 8
9 traffic congestion motor transportation roads and streets 7
9 automotive engineering commercial vehicles automobiles 7
9 road network motor transportation roads and streets 7
12 traffic control motor transportation road network 6
12 highway administration motor transportation roads and streets 6
12 bus transport transportation system transportation development 6
12 emission control gas emissions greenhouse gases 6
12 buses bus transportation travel time 6
12 buses bus terminals bus stop 6
18 urban development metropolitan area urban planning 5
18 public transportation networks transportation routes algorithms 5
18 traffic management transportation system traffic congestion 5
18 highway traffic control intelligent transportation systems intelligent systems 5
18 buses bus transportation traffic congestion 5
18 bus rapid transit light rail transit rapid transit 5
18 population densities population statistics economics 5
18 railway transport transportation system transportation development 5
18 traffic management roads and streets motor transportation 5
18 transportation planning transportation infrastructure transportation development 5
18 bus stop arrival time bus transportation 5
18 road transport traffic congestion traffic management 5
18 buses bus transportation bus route 5
18 transportation safety transportation planning road transport 5
18 bus transport railway transport transportation development 5
TABLE 10. Top Keyword Cluster of Length 3 (f ≥ 5)

A Scientometric Analysis of Public Transport Research
Journal of Public Transportation, Vol. 18, No. 2, 2015 124
Citation PatternsAfter providing some insights into publishing patterns, current topics, and related trends, we evaluated the impact of contributions by applying scientometric means. A widely-ac-cepted indicator for measuring the impact in a field of research is the number of citations a contribution receives. As the time a publication is available has a significant influence on its citations, we used both aggregated citations and NCII. The NCII makes citations of publications comparable by taking into account the longevity of each publication, which refers to the number of years the publication has been in print (Heilig and Voß 2014; Serenko and Bontis 2004), as shown in equation (1). A paper published in 2009, for instance, has a publication longevity of five years. Citations of the first year fully count for the calculation.
(1)
Overall Citation PatternsFirst, we analyzed the distribution and impact of publications in general. The numbers in Table 11 reveal some important patterns. The time significance is reflected by the con-trary trend of citations concerning the number of publications. Generally, an increase of the average NCII per publication can be observed for the first two years. In contrast, the results show a declining trend of the average NCII per publication between 2011 and 2013 and a strong decrease in 2013. One of the main reasons for a lower average NCII in 2012 and 2013 is that a lot of works citing those publications still are not covered in Scopus. Nevertheless, we observed that the standard deviation of the numbers from the average NCII per publication over time between 2009 and 2012, which is 0.06 from a mean of 0.67, is not significant. Consequently, we observed that the distribution of citations is evenly distributed.
TABLE 11. Overall Citation Pattern
Year 2009 2010 2011 2012 2013
Number of publications 1,269 1,318 1,618 1,745 1,918
Number of citations 4,066 3,860 3,370 2,118 756
Longevity (in years) 5 4 3 2 1
Overall NCII 813.20 965.00 1,123.33 1,059.00 756.00
Avg. NCII/publication 0.64 0.73 0.69 0.61 0.39

A Scientometric Analysis of Public Transport Research
Journal of Public Transportation, Vol. 18, No. 2, 2015 125
Outlet Citation PatternsAs shown previously, the large number of journal papers suggests that the scientific community in the field of public transport publishes mostly in journals. By analyzing the distribution of citations with regard to different publication outlets, the reason for the superior role of journal papers becomes obvious. Although conference papers account for only 8.52% of the overall citations on average, journal papers have a huge scientific impact, accounting for 86.99% of the overall citations.
TABLE 12. Outlet Citation Patterns
Outlet 2009 (%) 2010 (%) 2011 (%) 2012 (%) 2013 (%) Overall (%)
Journal paper 85.19 87.44 84.54 87.58 90.21 86.99
Conference paper 9.99 9.79 9.26 8.55 5.03 8.52
Review 4.01 1.66 5.58 3.45 4.76 3.89
Other 0.81 1.11 0.62 0.42 - 0.59
Number of citations 4,066 3,860 3,370 2,118 756 14,170
Journal CitationsDue to the superior role of journal papers and their scientific impact, a ranking of top-cited journals (see Table 13) has been generated to reflect the impact of specific journals. While n is the number of publications related to public transport, nall reflects the num-ber of all articles published by the respective journal within the defined time period to demonstrate the concentration of public transport research in those journals. Further-more, we attached a column with the Impact Factor (IF) and 5-year IF from the 2013 Jour-nal Citation Reports (JCR). The IF and 5-year IF calculate the average number of citations per publication based on the preceding two and five years, respectively. However, some of the top cited journals are not covered by the JCR, such as Public Transport and Research in Transportation Economics.
Publication Citation PatternsAs a further step, we measured the impact of individual publications and generated a ranking of top publications in the area of public transport research (see Appendix B; note that not all articles in the ranking are referenced in the bibliography). For this purpose, the NCII and the total count of citations f for each publication is calculated. An additional column, Rf, includes the ranking by the total count of citations. Publications with a high citation number and a relatively low NCII are attached in the end of the ranking, ordered by f. Moreover, we added citation information of Google Scholar fG (as of August 26, 2014) and a respective ranking RfG. We observe that important topics, identified with the keyword analysis, are represented in the titles of top publications. The ranking further provides an overview on important literature in the area of public transport.

A Scientometric Analysis of Public Transport Research
Journal of Public Transportation, Vol. 18, No. 2, 2015 126
TABLE 13. Top Cited Journals (f ≥ 75)
Rank ISSN Journal Publisher f n nall IF (2 y) IF (5 y)
1 0965-8564 Transportation Research Part A: Policy and Practice Elsevier 978 137 522 2.525 2.855
2 0967-070X Transport Policy Elsevier 813 175 473 1.718 2.084
3 0966-6923 Journal of Transport Geography Elsevier 747 146 758 2.214 2.768
4 0968-090X Transportation Research Part C: Emerging Technologies Elsevier 530 86 591 2.006 2.433
5 0191-2615 Transportation Research Part B: Methodological Elsevier 402 67 547 3.894 4.439
6 0361-1981 Transportation Research Record TRB 380 225 4608 0.442 0.636
7 0049-4488 Transportation Springer 280 81 280 1.617 2.061
8 1361-9209 Transportation Research Part D: Transport and Environment Elsevier 265 53 469 1.626 1.626
9 1866-749X Public Transport Springer 210 65 73 - -
10 0733-9488 Journal of Urban Planning and Development ASCE 204 56 196 0.931 0.900
11 0301-4215 Energy Policy Elsevier 176 31 4257 2.696 3.402
12 1366-5545Transportation Research Part E: Logistics and Transportation Review
Elsevier 169 21 484 2.193 2.943
13 0308-518X Environment and Planning A Pion Ltd. 158 23 996 1.694 2.485
14 0733-947X Journal of Transportation Engineering ASCE 150 68 668 0.877 1.073
15 1556-8318 International Journal of Sustainable Transportation T&F 149 31 120 1.447 1.505
16 0013-936X Environmental Science & Technology ACS 133 8 - 5.481 6.277
17 0264-2751 Cities Elsevier 132 32 455 1.836 2.055
18 0739-8859 Research in Transportation Economics Elsevier 114 73 262 - -
19 0144-1647 Transport Reviews T&F 100 25 225 1.551 2.310
20 0042-0980 Urban Studies SAGE 98 20 1172 1.330 1.961
21 0360-5442 Energy Elsevier 96 8 3343 4.159 4.465
22 0048-9697 Science of the Total Environment Elsevier 94 17 5169 3.163 3.906
23 0094-1190 Journal of Urban Economics Elsevier 91 8 262 1.888 3.277
24 1570-6672Journal of Transportation Systems Engineering and Information Technology
Elsevier 84 105 274 - -
25 1567-7141 European Journal of Transport and Infrastructure Research TU Delft 77 14 118 1.023 1.132
26 0304-3894 Journal of Hazardous Materials Elsevier 75 5 7514 4.331 5.123
26 1524-9050 IEEE Transactions on Intelligent Transportation Systems IEEE 75 18 755 2.472 2.935
n = number of publicationsnall = number of all articles published by the respective journal within the defined time period IF = Impact Factor TRB = Transportation Research BoardASCE = American Society of Civil EngineersACS = American Chemical SocietyT&F = Taylor & Francis
A Scientometric Analysis of Public Transport Research
Journal of Public Transportation, Vol. 18, No. 2, 2015 127
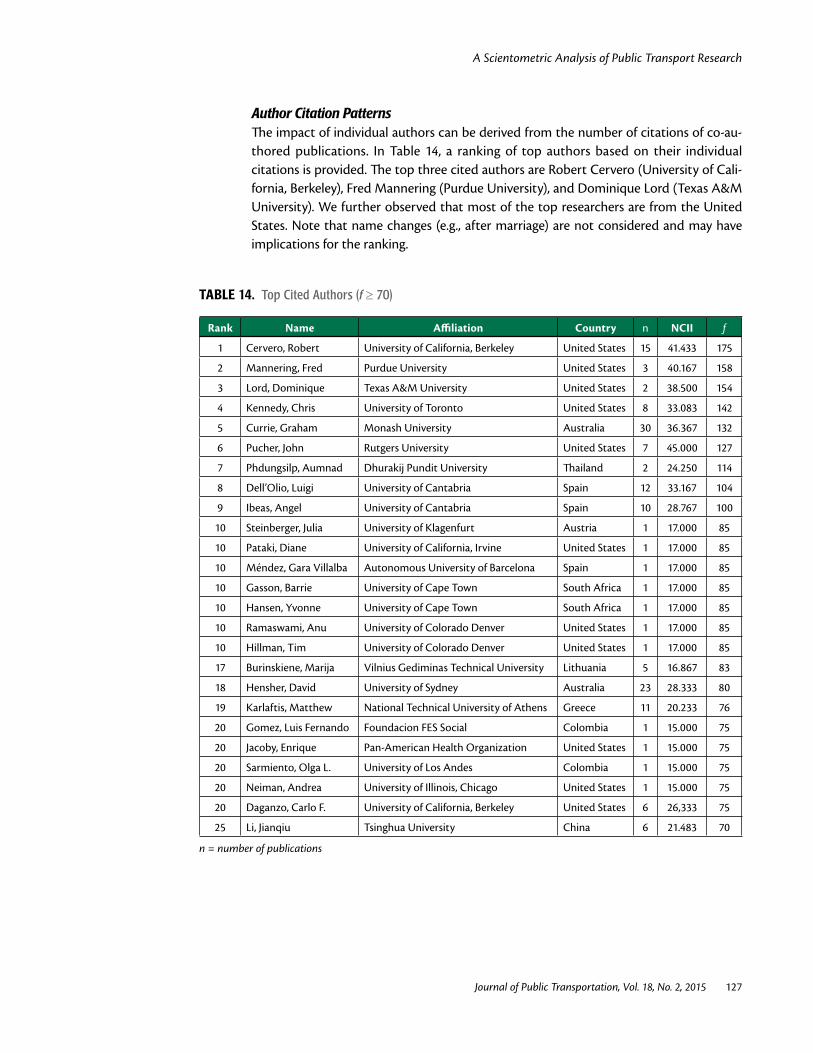
Author Citation PatternsThe impact of individual authors can be derived from the number of citations of co-au-thored publications. In Table 14, a ranking of top authors based on their individual citations is provided. The top three cited authors are Robert Cervero (University of Cali-fornia, Berkeley), Fred Mannering (Purdue University), and Dominique Lord (Texas A&M University). We further observed that most of the top researchers are from the United States. Note that name changes (e.g., after marriage) are not considered and may have implications for the ranking.
TABLE 14. Top Cited Authors (f ≥ 70)
Rank Name Affiliation Country n NCII f
1 Cervero, Robert University of California, Berkeley United States 15 41.433 175
2 Mannering, Fred Purdue University United States 3 40.167 158
3 Lord, Dominique Texas A&M University United States 2 38.500 154
4 Kennedy, Chris University of Toronto United States 8 33.083 142
5 Currie, Graham Monash University Australia 30 36.367 132
6 Pucher, John Rutgers University United States 7 45.000 127
7 Phdungsilp, Aumnad Dhurakij Pundit University Thailand 2 24.250 114
8 Dell’Olio, Luigi University of Cantabria Spain 12 33.167 104
9 Ibeas, Angel University of Cantabria Spain 10 28.767 100
10 Steinberger, Julia University of Klagenfurt Austria 1 17.000 85
10 Pataki, Diane University of California, Irvine United States 1 17.000 85
10 Méndez, Gara Villalba Autonomous University of Barcelona Spain 1 17.000 85
10 Gasson, Barrie University of Cape Town South Africa 1 17.000 85
10 Hansen, Yvonne University of Cape Town South Africa 1 17.000 85
10 Ramaswami, Anu University of Colorado Denver United States 1 17.000 85
10 Hillman, Tim University of Colorado Denver United States 1 17.000 85
17 Burinskiene, Marija Vilnius Gediminas Technical University Lithuania 5 16.867 83
18 Hensher, David University of Sydney Australia 23 28.333 80
19 Karlaftis, Matthew National Technical University of Athens Greece 11 20.233 76
20 Gomez, Luis Fernando Foundacion FES Social Colombia 1 15.000 75
20 Jacoby, Enrique Pan-American Health Organization United States 1 15.000 75
20 Sarmiento, Olga L. University of Los Andes Colombia 1 15.000 75
20 Neiman, Andrea University of Illinois, Chicago United States 1 15.000 75
20 Daganzo, Carlo F. University of California, Berkeley United States 6 26,333 75
25 Li, Jianqiu Tsinghua University China 6 21.483 70
n = number of publications

A Scientometric Analysis of Public Transport Research
Journal of Public Transportation, Vol. 18, No. 2, 2015 128
Affiliation Citation PatternsFinally, the performance of research institutions in terms of citations was evaluated. The NCII is calculated based on the citations of authors belonging to the affiliation at the time of publication. In the ranking of the top 30 affiliations in Table 15, we see that the University of Toronto, the University of California, Berkeley, and Monash University are the leading research institutions in the field of public transport. Most of the influential affiliations are from the United States confirming the results given in an earlier section.
TABLE 15. Top Research Institutions
(NCII ≥ 40.00)
Rank Affiliation Country NCII
1 University of Toronto Canada 92.45
2 University of California, Berkeley United States 87.70
3 Monash University Australia 76.23
4 University of Sydney Australia 71.18
5 Tsinghua University China 65.43
6 Rutgers University United States 56.73
7 Karlstad University Sweden 53.37
8 University of Melbourne Australia 52.83
9 University of Hong Kong China 50.85
10 Beijing Jiaotong University China 49.80
11 Texas A&M University United States 49.03
12 University of Minnesota United States 48.63
13 Delft University of Technology Netherlands 46.02
14 Purdue University United States 44.17
15 Queensland University of Technology Australia 44.00
16 University of Leeds United Kingdom 41.62
Research ProductivityThe scientometric measurement of research productivity is just as important as analyz-ing citation patterns for the evaluation of science from a meta-perspective. The overall research productivity is an important indicator for the development of a field of research. It reflects the number of publications individuals contribute to the overall knowledge base within a specific time frame.
Individual Research ProductivityFirst, we focused on the individual productivity of scholars by using the equal credit method, as discussed earlier. Table 16 provides a ranking of the top 20 scholars in terms of research productivity based on the overall number of co-authored publications, n. The top three scholars are Corrine Mulley (University of Sydney), Graham Currie (Monash University), and Avishai Ceder (University of Auckland). Graham Currie is also one of the most cited authors (Rank = 5, see Table 14). Most of the top contributors are from insti-tutions located in China, which confirms the results of the contributing countries analysis given in an earlier section. As an extension of that section, we see that mostly the high productivity of a handful of scholars located in Australia contribute to the overall pro-ductivity. Moreover, we see that only one scholar from the United Kingdom, John Nelson

A Scientometric Analysis of Public Transport Research
Journal of Public Transportation, Vol. 18, No. 2, 2015 129
(University of Aberdeen), is in the top 20 of highly-productive scholars. Consequently, the high overall productivity of institutions located in the United Kingdom (see Table 3) must be generated by a large number of scholars carrying out research in the field.
TABLE 16. Top Individual Productivity (Equal Credit Method)
Rank Author Affiliation Country n Score
1 Mulley, Corinne University of Sydney Australia 34 15.23
2 Currie, Graham Monash University Australia 30 12.43
3 Ceder, Avishai University of Auckland New Zealand 24 11.83
4 Cervero, Robert University of California, Berkeley United States 15 8.87
5 Hensher, David University of Sydney Australia 23 8.82
6 Chen, Yanyan Beijing Jiaotong University China 23 8.20
7 Zhang, Guo-wu Beijing Jiaotong University China 9 8.20
8 Kumar, Ashok University of Toledo United States 17 7.75
9 El-Geneidy, Ahmed McGill University Canada 18 7.07
10 Nelson, John University of Aberdeen United Kingdom 17 6.27
11 Delbosc, Alexa Monash University Australia 14 6.08
12 Wang, Wei Southeast University China 21 5.75
13 Kadiyala, Akhil University of Toledo United States 12 5.25
14 Yang, Xiaoguang Tongji University China 18 5.15
15 Karlaftis, Matthew G. National Technical University of Athens Greece 11 5.08
16 Chen, Xuewu Southeast University China 14 4.90
17 Gordon, Cameron University of Canberra Australia 7 4.75
18 Tirachini, Alejandro University of Sydney Australia 13 4.70
19 Chen, Yu-yi Beijing University of Technology China 12 4.37
20 Jin, Wen-zhou South China University of Technology China 11 4.25
Lotka’s LawWe extended the analysis on research productivity by exploring the overall productivity distribution patterns of all authors being active in the field of public transport. This helps not only to understand the structure of this field, but also enables a comparison with other fields and an estimation of future research productivity. For this, prior scientometric studies tested the application of Lotka’s law (Serenko and Bontis 2004), which describes a frequency distribution of scientific productivity in a certain field of research. According to Alfred J. Lotka, the proportional relationship between the number of scholars accounting for p publications is about 1/pα, where α = 2 (Coile 1977). On basis of these observations, the theoretical relationship between the number of publications p and the proportional number of all authors making p contributions f(p) is expressed by equation (2):
f(p)= C⁄pα (2)

A Scientometric Analysis of Public Transport Research
Journal of Public Transportation, Vol. 18, No. 2, 2015 130
where α and C are non-negative constants to be determined from the observations and p = 1, 2, 3, 4, etc. The constant C corresponds to the number of authors who have con-tributed to the field only once, as in Serenko and Bontis (2004). The start and end point of the time period of investigation are arbitrary as a matter of principle (Wagner-Döbler and Berg 1995).
According to Pao (1986), the Lotka distribution is independent on the period of time investigated. To test the application of Lotka’s law, an optimal value of α must be found that fits the distribution of observations. This value can be used to verify Lotka’s law and to predict an approximate number of authors contributing a certain frequency of pub-lications (Kretschmer and Rousseau 2001; Serenko and Bontis 2004). Therefore, we cal-culated the optimal value for α minimizing the sum of absolute errors. By this, we found an α value of 2.62, which is considerably higher than the theoretical α proposed by Lotka (α = 2), but not exceptional regarding other scientometric studies. As discussed in Serenko and Bontis (2004), prior scientometric studies in other fields obtained different values for α within the ranges of 1.5 to 3 (Bonnevie 2003), 1.95 to 3.26 (Chung and Cox 1990), and 2.21 to 2.46 (Cocosila et al. 2011).
The reason for the higher value of α in the area of public transport is that approximately 78.98% of contributors have published only one publication, whereas Lotka assumed that approximately 60% of contributors have a single publication (Coile 1977). This phe-nomenon can be explained by the fact that scholars often collaborate with practitioners whose primary concern is to explain and solve specific problems rather than producing extensive research on a variety of problems. Thus, those non-academics tend to publish less frequently than academics. Further, note that selecting a certain time period in the development of a scientific area has effects on the frequency distribution, as it generally depends on the individual behavior of authors and on the inflow of new authors (Wag-ner-Döbler and Berg 1995).
Furthermore, the inequality of the frequency with which scholars are able to contribute has roots in the Matthew Effect (Wagner-Döbler and Berg 1995) and the related theory of cumulative advantage proposed by Price (1976). That is, more eminent scholars are given more credit and are repeatedly rewarded by other scientists. A good reputation promotes the collection of research funds and cultivates co-authored publications with other scholars aiming to collaborate. In Appendix C, we compared the domain-specific optimal value α as well as the aggregated error with the theoretical α proposed by Lotka (α = 2). By analyzing the coefficient of determination (R2), we observe that both the predictions for α = 2 and α = 2.62 fit well to the observed number of authors (R2α=2,
α=2.62 ≥ 0.99). Of course, R2 is improved by finding the optimal value for α as the aggregated error decreases. Consequently, we demonstrated that Lotka’s law can be used to predict the number of authors that contribute p = 1, 2, 3, 4, etc. publications.
ConclusionIn this study, we conducted a scientometric analysis of public transport research based on a large bibliographic data basis of respective contributions, published in the period from 2009 to 2013. With the empirical findings of this scientometric analysis, we provide novel

A Scientometric Analysis of Public Transport Research
Journal of Public Transportation, Vol. 18, No. 2, 2015 131
insights into a range of publishing patterns. The results indicate that most contributions are produced in the United States, China, and the United Kingdom and that mostly social science, engineering, and computer science disciplines are involved. Regarding co-authorship, we see a trend towards multi-authorship contributions to better address interdisciplinary research challenges. Knowledge is conveyed primarily through journal papers, which gain superior consideration in comparison with conference papers. Further, we observe current research topics and trends as well as relationships between topics by analyzing keywords and keyword clusters.
The results demonstrate the role of research in designing public transport policies and planning based on surveys, optimization, and simulation studies that consider economic, efficiency, and environmental factors. In addition, the importance of innovative ICT solutions and information systems for public transport is reflected. The concentration of topics and trends can be compared with current and future challenges for elucidating research gaps. In general, we see a trend and major research efforts to better integrate different problems and research disciplines in the area of public transport, allowing for system-wide improvement and innovations based on interdisciplinary and even transdis-ciplinary research activities.
By applying scientometric methods, we further present valuable rankings on current driv-ing forces in terms of research productivity and impact, respectively, as well as on research outlets and topics. The intention of this study was to provide a novel meta-perspective on public transport research that extend common review papers and further helps scholars and practitioners to get a quick overview on important aspects. Consequently, our results may help steer individual projects, extend research collaborations, and select a proper publication outlet, to name a few benefits.
Finally, we conducted an experiment to verify the satisfaction of Lotka’s law, showing that the distribution of productivity can be compared to several other research areas as our results show that the theoretical distribution fits to the observed data. Methodologically, the empirical findings demonstrate the strength of a scientometric analysis to extensively investigate a field of interest. As demonstrated, the results of the scientometric analysis are not only valuable for discussing and defining future research agendas in the area of public transport. Technically, the semi-automated process of assessing a large amount of publications makes it possible to easily obtain a comprehensive overview of a particular research area. This, in contrast, cannot be achieved by a structured literature review to that degree. Therefore, the study represents a good starting point for academics and practitioners to identify the sources and concentration of the existing knowledge base.
For further research, the temporal scope of our scientometric analysis could be expanded to explore long-term developments in the area of public transport. In methodological terms, we intend to investigate network structures among authors as well as the rela-tionship between topics and authors. A respective visual representation would help to see at a glance pivotal elements and their connections to each other. By exploring those connections, we aim to measure and explain their potential impact on the structure and development of public transport research from different perspectives, for instance, by

A Scientometric Analysis of Public Transport Research
Journal of Public Transportation, Vol. 18, No. 2, 2015 132
exploring the effect of maintaining a high level of collaboration or networking in scientific circles on research productivity and citations of individual authors.
Another interesting aspect for further research is the analysis of collaboration structures between academics and professionals to explore how public transport research is influ-enced by practice. More importantly, the analysis of network structures may help to observe the lack of research or collaboration such as by identifying missing connections (e.g., between topics), as shown in Schwarze et al. (2012). Technically, we intend to further improve the applied data processing methods to further reduce manual proofreading activities by means of data mining techniques and accuracy metrics. In this regard, we aim to apply MapReduce algorithms to parallelize computations to reduce computation time.
References
Agrawal, D., S. Das, and A. El Abbadi. 2011. “Big Data and Cloud Computing: Current State and Future Opportunities.” In Proceedings of the 14th International Conference on Extending Database Technology, EDBT/ICDT ‘11: 530-533.
Akritidis, L., and P. Bozanis. 2012.” Computing Scientometrics in Large-Scale Academic Search Engines with MapReduce.” In Web Information Systems Engineering-WISE 2012. Berlin: Springer.
Banister, D. 2014. “Where to Start?” Transport Reviews, 34(1): 1-3.
Bonnevie, E. 2003. “A Multifaceted Portrait of a Library and Information Science Journal: The Case of the Journal of Information Science.” Journal of Information Science, 29(1): 11-23.
Ceder, A. 2007. Public Transit Planning and Operation: Theory, Modeling and Practice. Elsevier, Butterworth-Heinemann.
Chung, K. H., and R. A. K. Cox. 1990. “Patterns of Productivity in the Finance Literature: A Study of the Bibliometric Distributions.” Journal of Finance, 45(1): 301-309.
Cocosila, M., A. Serenko, and O. Turel. 2011. “Exploring the Management Information Systems Discipline: A Scientometric Study of ICIS, PACIS and ASAC.” Scientometrics, 87(1): 1-16.
Coile, R. C. (1977). “Lotka’s Frequency Distribution of Scientific Productivity.” Journal of the American Society for Information Science, 28(6): 366-370.
Dean, J., and S. Ghemawat. 2008. “MapReduce: Simplified Data Processing on Large Clus-ters.” Communications of the ACM, 51(1): 107-113.
Faria, J. R., and R. K. Goel. 2010. “Returns to Networking in Academia.” Netnomics, 11(2): 103-117.
Heilig, L., and S. Voß. 2014. “A Scientometric Analysis of Cloud Computing Literature.” IEEE Transactions on Cloud Computing, 2(3): 266-278.

A Scientometric Analysis of Public Transport Research
Journal of Public Transportation, Vol. 18, No. 2, 2015 133
Holsapple, C. W., L. E. Johnson, H. Manakyan, and J. Tanner. 1994. “Business Computing Research Journals: A Normalized Citation Analysis.” Journal of Management Informa-tion Systems, 11(1): 131-140.
Hood, W. W., and C. S. Wilson. 2001. “The Literature of Bibliometrics, Scientometrics, and Informetrics.” Scientometrics, 52(2): 291-314.
Howard, G. S., D. A. Cole, and S. E. Maxwell. 1987. “Research Productivity in Psychology based on Kretschmer, H., and Rousseau, R. 2001. Author Inflation Leads to a Break-down of Lotka’s Law.” Journal of the American Society for Information Science and Technology, 52(8): 610-614.
Kroon, L., D. Huisman, E. Abbink, P.-J. Fioole, M. Fischetti, G. Maróti, A. Schrijver, A. Steenbeek, and R. Ybema. 2009. “The New Dutch Timetable: The OR Revolution.” Interfaces, 39(1): 6-17.
Krygsman, S., M. Dijst, and T. Arentze. 2004. “Multimodal Public Transport: An Analysis of Travel Time Elements and the Interconnectivity Ratio.” Transport Policy, 11(3): 265-275.
Larson, R. C., and A. R. Odoni. 1981. Urban Operations Research. Prentice-Hall, Englewood Cliffs, NJ.
Levinson, D., H. Liu, W. Garrison, M. Hickman, A. Danczyk, and M. Corbett. 2015. “Funda-mentals of Transportation: Transit.” http://en.wikibooks.org/wiki/Fundamentals_of_Transportation/Transit.
Lewis, B. R., G. F. Templeton, and X. Luo. 2007. “A Scientometric Investigation into the Validity of IS Journal Quality Measures. Journal of the Association for Information Systems, 8(12): 619-633.
Leydesdorff, L. 2002. “Indicators of Structural Change in the Dynamics of Science: Entropy Statistics of the SCI Journal Citation Reports.” Scientometrics, 53(1): 131-159.
Leydesdorff, L., and R. Schank. 2008. “Dynamic Animations of Journal Maps: Indicators of Structural Changes and Interdisciplinary Developments.” Journal of the American Society for Information Science and Technology, 59(11): 1810-1818.
Pao, M. L. 1986. “An Empirical Examination of Lotka’s Law.” Journal of the American Society for Information Science, 37(1): 26-33.
Price, D. d. S. 1976. “A General Theory of Bibliometric and Other Cumulative Advantage Processes.” Journal of the American Society for Information Science, 27(5): 292-306.
Schwarze, S., S. Voß, G. Zhou, and G. Zhou. 2012. „Scientometric Analysis of Container Terminals and Ports Literature and Interaction with Publications on Distribution Networks.” In Computational Logistics LNCS 7555, 33-52. Berlin: Springer.
Scopus 2012. Content coverage guide. http://www.info.sciverse.com/UserFiles/ sciverse_scopus_content_coverage_0.pdf.
Scopus 2015. Scopus journal title list, February 2015. http://www.info.sciverse.com/User-Files/sciverse_scopus_content_coverage_0.pdf.
A Scientometric Analysis of Public Transport Research
Journal of Public Transportation, Vol. 18, No. 2, 2015 134
Serenko, A., and N. Bontis. 2004. “Meta-review of Knowledge Management and Intellec-tual Capital Literature: Citation Impact and Research Productivity Rankings.” Knowl-edge and Process Management, 11(3): 185-198.
Sohail, M., D. Maunder, and S. Cavill. 2006. “Effective Regulation for Sustainable Public Transport in Developing Countries.” Transport Policy, 13(3): 177-190.
Straub, D. 2006. “The Value of Scientometric Studies: An Introduction to a Debate on IS as a Reference Discipline.” Journal of the Association for Information Systems, 7(5): 241-246.
Thompson, K., and P. Schofield. 2007. “An Investigation of the Relationship between Public Transport Performance and Destination Satisfaction.” Journal of Transport Geogra-phy, 15(2): 136-144.
Van Raan, A. 1996. “Scientometrics: State-of-the-Art.” Scientometrics, 38(1): 208-218.
Vardi, M. Y. 2009. “Conferences vs. Journals in Computing Research.” Communications of the ACM, 52(5): 5-6.
Vickerman, R. 2000. “Evaluation Methodologies for Transport Projects in the United King-dom.” Transport Policy, 7(1): 7-16.
Voß, S., and X. Zhao. 2005. “Some Steps Towards a Scientometric Analysis of Publications in Machine Translation.” In Proceedings of the IASTED International Conference on Artificial Intelligence and Applications, Acta Press: 651-655.
Wagner-Döbler, R., and J. Berg. 1995. “The Dependence of Lotka’s law on the Selection of Time Periods in the Development of Scientific Areas and Authors.” Journal of Docu-mentation, 51(1): 28-43.
Webster, F. V., and P. H. Bly. 1982. “The Demand for Public Transport. Part II. Supply and Demand Factors of Public Transport.” Transport Reviews, 2(1): 23-46.
White, P. R. 2008. Public Transport: Its Planning, Management and Operation. London: Routledge.
WoS. 2015. Thomas Reuters Master Journal List. http://ip-science.thomsonreuters.com/cgi-bin/jrnlst/jlresults.cgi.

A Scientometric Analysis of Public Transport Research
Journal of Public Transportation, Vol. 18, No. 2, 2015 135
ISSN Journal Title WoS
18245463 Advances in Transportation Studies -
08669546 Archives of Transport (active until 2012) -
2213624X Case Studies on Transport Policy -
22120122 Economics of Transportation -
15677141 European Journal of Transport and Infrastructure Research X
18253997 European Transport - Trasporti Europei -
18670717 European Transport Research Review -
19391390 IEEE Intelligent Transportation Systems Magazine X
15249050 IEEE Transactions on Intelligent Transportation Systems X
20429738 IET Electrical Systems in Transportation -
1751956X IET Intelligent Transport Systems X
18688659 International Journal of Intelligent Transportation Systems Research -
17566517 International Journal of Shipping and Transport Logistics X
15568318 International Journal of Sustainable Transportation X
03918440 International Journal of Transport Economics -
10096744 Journal of Transportation Systems Engineering and Information Technology -
01976729 Journal of Advanced Transportation X
15472450 Journal of Intelligent Transportation Systems X
2095087X Journal of Modern Transportation -
1077291X Journal of Public Transportation X
22109706 Journal of Rail Transport Planning and Management -
09696997 Journal of Air Transport Management X
16711637 Journal of Traffic and Transportation Engineering -
22141405 Journal of Transport and Health X
19387849 Journal of Transport and Land Use -
00225258 Journal of Transport Economics and Policy X
09666923 Journal of Transport Geography X
00225266 Journal of Transport History -
0733947X Journal of Transportation Engineering X
19439962 Journal of Transportation Safety and Security -
19387741 Journal of Transportation Security -
15706672 Journal of Transportation Systems Engineering and Information Technology -
18744478 Open Transportation Journal -
03037800 Periodica Polytechnica Transportation Engineering -
16137159 Public Transport -
1016796X Public Transport International (active until 2012) -
22105395 Research in Transportation Business and Management -
07398859 Research in Transportation Economics X
10375783 Road and Transport Research X
Appendix A
TABLE 17. Comparison of Journal
Coverage of Scopus (2015) and WoS (2015)

A Scientometric Analysis of Public Transport Research
Journal of Public Transportation, Vol. 18, No. 2, 2015 136
ISSN Journal Title WoS
23275626 SAE International Journal of Transportation Safety -
0360859X Special Report - National Research Council, Transportation Research Board -
00404748 Texas Transportation Researcher -
16484142 Transport X
14076160 Transport and Telecommunication -
0967070X Transport Policy X
18960596 Transport Problems -
01441647 Transport Reviews X
00494488 Transportation X
22143912 Transportation Geotechnics -
00411612 Transportation Journal X
19427867 Transportation Letters X
03081060 Transportation Planning and Technology X
09658564 Transportation Research Part A: Policy and Practice X
01912615 Transportation Research Part B: Methodological X
13619209 Transportation Research Part D: Transport and Environment X
13665545 Transportation Research Part E: Logistics and Transportation Review X
13698478 Transportation Research Part F: Traffic Psychology and Behaviour X
03611981 Transportation Research Record X
00411655 Transportation Science X
18128602 Transportmetrica (active until 2012) X
23249935 Transportmetrica A: Transport Science X
21680566 Transportmetrica B X
17494729 World Review of Intermodal Transportation Research -
10062823 Journal of Wuhan University of Technology (Transportation Science and Engineering) -
Appendix B
TABLE 18.Top Publications (by NCII)
Rank Rf RfG Publication NCII f f G
1 1 1
Lord D., Mannering F. (2010) The statistical analysis of crash- frequency data: A review and assessment of methodological alternatives. Transportation Research Part A: Policy and Practice, 44(5): 291-305.
38.50 154 294
2 2 3
Kennedy C., Steinberger J., Gasson B., Hansen Y., Hillman T., Havranek M., Pataki D., Phdungsilp A., Ramaswami A., Mendez G.V. (2009) Greenhouse gas emissions from global cities. Environmental Science and Technology, 43(19): 7297-7302.
17.00 85 178
2 4 2Glaeser E.L., Kahn M.E. (2010) The greenness of cities: Carbon dioxide emissions and urban development. Journal of Urban Economics, 67(3): 404-418.
17.00 68 286

A Scientometric Analysis of Public Transport Research
Journal of Public Transportation, Vol. 18, No. 2, 2015 137
Rank Rf RfG Publication NCII f f G
4 9 26
Wang W., Zhang W., Guo H., Bubb H., Ikeuchi K. (2011) A safety-based approaching behavioral model with various driving characteristics. Transportation Research Part C: Emerging Technologies, 19(6): 1202-1214.
16.67 50 72
5 154 60
Giles-Corti B., Bull F., Knuiman M., McCormack G., Van Niel K., Timperio A., Christian H., Foster S., Divitini M., Middleton N., Boru B. (2013) The influence of urban design on neighborhood walking following residential relocation: Longitudinal results from the RESIDE study. Social Science and Medicine, 77(1): 20-30.
16.00 16 36
6 5 16
Rakopoulos D.C., Rakopoulos C.D., Hountalas D.T., Kakaras E.C., Giakoumis E.G., Papagiannakis R.G. (2010) Investigation of the performance and emissions of bus engine operating on butanol/diesel fuel blends. Fuel, 89(10): 2781-2790.
15.75 63 90
7 12 6
Pucher J., Buehler R., Seinen M. (2011) Bicycling renaissance in North America? An update and re-appraisal of cycling trends and policies. Transportation Research Part A: Policy and Practice, 45(6): 451-475.
15.33 51 97
8 3 4
Cervero R., Sarmiento O.L., Jacoby E., Gomez L.F., Neiman A. (2009) Influences of built environments on walking and cycling: Lessons from Bogotá. International Journal of Sustainable Transportation, 3(4): 203-226.
15.00 38 57
9 6 24
Chen X., Xia X., Zhao Y., Zhang P. (2010) Heavy metal concentrations in roadside soils and correlation with urban traffic in Beijing, China. Journal of Hazardous Materials, 181(1-3): 640-646.
14.50 34 141
9 54 29
Blocken B., Janssen W.D., van Hoo T. (2012) CFD simulation for pedestrian wind comfort and wind safety in urban areas: General decision framework and case study for the Eindhoven University campus. Environmental Modelling and Software, 30: 15-34.
14.50 29 61
11 14 20
Daganzo C.F., Gayah V.V., Gonzales E.J. (2011) Macroscopic relations of urban traffic variables: Bifurcations, multivaluedness and instability. Transportation Research Part B: Methodological, 45(1): 278-288.
13.67 16 86
11 14 19
Geroliminis N., Sun J. (2011) Properties of a well-defined macro- scopic fundamental diagram for urban traffic. Transportation Research Part B: Methodological, 45 (3): 605-617.
13.67 41 87
13 8 15
Bissell D. (2010) Passenger mobilities: Affective atmospheres and the sociality of public transport. Environment and Planning D: Society and Space, 28(2): 270-289.
12.75 51 97
14 21 30
Wu Y., Wang R., Zhou Y., Lin B., Fu L., He K., Hao J. (2011) On-road vehicle emission control in Beijing: Past, present, and future. Environmental Science and Technology, 45(1): 147-153.
12.67 38 57
15 30 8Duranton G., Turner M.A. (2011) The fundamental law of road congestion: Evidence from US cities. American Economic Review, 101(6): 2616-2652.
11.33 34 141

A Scientometric Analysis of Public Transport Research
Journal of Public Transportation, Vol. 18, No. 2, 2015 138
Rank Rf RfG Publication NCII f f G
16 32 56Dell’Olio L., Ibeas A., Cecin P. (2011) The quality of service desired by public transport users. Transport Policy, 18(1): 217-227.
11.00 33 53
16 32 56Li Z., Chen C., Wang K. (2011) Cloud computing for agent-based urban transportation systems. IEEE Intelligent Systems, 26(1): 73-79.
11.00 33 53
16 305 62Redman L., Friman M., Garling T., Hartig T. (2013) Quality attributes of public transport that attract car users: A research review. Transport Policy, 25: 119-127.
11.00 11 23
19 7 9
Eliasson J., Hultkrantz L., Nerhagen L., Rosqvist L.S. (2009) The Stockholm congestion - charging trial 2006: Overview of effects. Transportation Research Part A: Policy and Practice, 43(3): 240-250.
10.80 54 125
20 99 61
Abou-Zeid M., Witter R., Bierlaire M., Kaufmann V., Ben-Akiva M. (2012) Happiness and travel mode switching: Findings from a Swiss public transportation experiment. Transport Policy, 19(1): 93-104.
10.00 20 28
20 344 64Camacho T.D., Foth M., Rakotonirainy A. (2013) Pervasive technology and public transport: Opportunities beyond telematics. IEEE Pervasive Computing, 12(1): 18-25.
10.00 10 12
22 10 30
Jakimavicius M., Burinskiene M. (2009) A GIS and multi-criteria- based analysis and ranking of transportation zones of Vilnius city. Technological and Economic Development of Economy, 15(1): 39- 48.
9.80 49 57
22 10 13
Crainic T.G., Gendreau M., Potvin J.-Y. (2009) Intelligent freight-transportation systems: Assessment and the contribution of operations research. Transportation Research Part C: Emerging Technologies, 17(6): 541-557.
9.80 49 109
24 18 10Santos G., Behrendt H., Teytelboym A. (2010) Part II: Policy instruments for sustainable road transport. Research in Transportation Economics, 28(1): 46-91.
9.75 39 116
25 50 28
Angel S., Parent J., Civco D.L., Blei A., Potere D. (2011) The dimensions of global urban expansion: Estimates and projections for all countries, 2000-2050. Progress in Planning, 75(2): 53-107.
9.67 29 70
26 57 58
Eboli L., Mazzulla G. (2011) A methodology for evaluating transit service quality based on subjective and objective measures from the passenger’s point of view. Transport Policy, 18(1): 172-181.
9.33 28 51
27 23 6Shaheen S., Guzman S., Zhang H. (2010) Bikesharing in Europe, the Americas, and Asia. Transportation Research Record, 2143: 159-167.
9.25 37 152
27 23 12
Thiagarajan A., Biagioni J., Gerlich T., Eriksson J. (2010) Cooperative transit tracking using smart-phones. In: Proceedings of the 8th ACM Conference on Embedded Networked Sensor Systems (SenSys 2010), 85-98, ACM.
9.25 37 110
29 114 63
Yu B., Yang Z.-Z., Jin P.-H., Wu S.-H., Yao B.-Z. (2012) Transit route network design-maximizing direct and transfer demand density. Transportation Research Part C: Emerging Technologies, 22: 58-75.
9.00 18 22

A Scientometric Analysis of Public Transport Research
Journal of Public Transportation, Vol. 18, No. 2, 2015 139
Rank Rf RfG Publication NCII f f G
29 59 59
Awasthi A., Chauhan S.S. (2011) Using AHP and Dempster-Shafer theory for evaluating sustainable transport solutions. Environmental Modelling and Software, 26(6): 787-796.
9.00 27 45
29 61 16
Lin J.-R., Yang Ta-Hui T.-H. (2011) Strategic design of public bicycle sharing systems with service level constraints. Transportation Research Part E: Logistics and Transportation Review, 47(2): 284-294.
9.00 27 90
(36) 13 7Crainic T.G., Ricciardi N., Storchi G. (2009) Models for evaluating and planning city logistics systems. Transportation Science, 43(4): 432-454.
8.60 43 144
(41) 14 22Feng K., Hubacek K., Guan D. (2009) Lifestyles, technology and CO2 emissions in China: A regional comparative analysis. Ecological Economics, 69(1): 145-154.
8.20 41 78
(48) 17 30Middleton J. (2009) “Stepping in time”: Walking, time, and space in the city. Environment and Planning A, 41(8): 1943-1961.
8.00 40 57
(49) 18 23
Vandenbulcke G., Steenberghen T., Thomas I. (2009) Mapping accessibility in Belgium: a tool for land-use and transport planning? Journal of Transport Geography, 17(1): 39-53.
7.80 39 77
(49) 18 21Coveney J., O’Dwyer L.A. (2009) Effects of mobility and location on food access. Health and Place, 15(1): 45-55.
7.80 39 85
(55) 21 14
Cao X.J., Mokhtarian P.L., Handy S.L. (2009) The relationship between the built environment and non-work travel: A case study of Northern California. Transportation Research Part A: Policy and Practice, 43(5): 548-559.
7.60 38 108
(57) 23 11Ewing R., Dumbaugh E. (2009) The built environment and traffic safety: A review of empirical evidence. Journal of Planning Literature, 23(4): 347-367.
7.40 37 112
(57) 23 18Wang D., Chai Y. (2009) The jobs-housing relationship and commuting in Beijing, China: the legacy of Danwei. Journal of Transport Geography, 17(1): 30-38.
7.40 37 88
(23) 27 27Currie G. (2010) Quantifying spatial gaps in public transport supply based on social needs. Journal of Transport Geography, 18(1): 31-41.
8.75 35 71
(67) 28 25Von Ferber C., Holovatch T., Holovatch Y., Palchykov V. (2009) Public transport networks: Empirical analysis and modeling. European Physical Journal B, 68(2): 261-275.
7.00 35 73
(23) 28 32Hu X., Chang S., Li J., Qin Y. (2010) Energy for sustainable road transportation in China: Challenges, initiatives and policy implications. Energy, 35(11): 4289-4301.
8.75 35 54

A Scientometric Analysis of Public Transport Research
Journal of Public Transportation, Vol. 18, No. 2, 2015 140
Appendix C
TABLE 19. Lotka’s Law –
Frequency Distribution of Contributions by Author
No. of Publications
No. of Authors
Predicted Number of
Authors (α = 2)
Difference Observed - Predicted
(α = 2)
Predicted Number of
Authors (α = 2.62)
Difference Observed - Predicted (α = 2.62)
1 7,653 7,653.00 0.00 7,653.00 0.00
2 1,282 1,913.25 631.25 1,244.90 37.10
3 366 850.33 484.33 430.30 64.30
4 162 478.31 316.31 202.50 40.50
5 90 306.12 216.12 112.86 22.86
6 46 212.58 166.58 70.00 24.00
7 26 156.18 130.18 46.74 20.74
8 18 119.58 101.58 32.94 14.94
9 11 94.48 83.48 24.19 13.19
10 7 76.53 69.53 18.36 11.36
11 9 63.25 54.25 14.30 5.30
12 2 53.15 51.15 11.39 9.39
13 2 45.28 43.28 9.23 7.23
14 2 39.05 37.05 7.60 5.60
15 3 34.01 31.01 6.35 3.35
16 3 29.89 26.89 5.36 2.36
17 1 26.48 25.48 4.57 3.57
18 1 23.62 22.62 3.94 2.94
19 1 21.20 20.20 3.42 2.42
21 3 17.35 14.35 2.63 0.37
28 1 9.76 8.76 1.24 0.24
31 1 7.96 6.96 0.95 0.05
Total 9,690 12,231.38 2,541.38 9,906.75 291.81
R2 (α = 2.00) 0.99001
R2 (α = 2.62) 0.99987
About the Authors
Leonard Heilig ([email protected]) holds a B.Sc. from the University of Münster (Germany) and an M.Sc. from the University of Hamburg (Germany) in Informa-tion Systems. Currently, he holds a position at the Institute of Information Systems at the University of Hamburg. He spent some time at the University of St Andrews (Scotland, UK) focusing on security management, web technologies, and software engineering. Practical experiences include work at companies such as Adobe, Airbus Group Innovations, and Bei-ersdorf Shared Services. His current interest focuses on business-oriented cloud computing.

A Scientometric Analysis of Public Transport Research
Journal of Public Transportation, Vol. 18, No. 2, 2015 141
Prof. Dr. Stefan Voß ([email protected]) is director of the Institute of Infor-mation Systems at the University of Hamburg. In addition to being professor in Hamburg, he holds a visiting position at the PUCV in Valparaiso, Chile. Previous positions include full professor and head of the department of Business Administration, Information Systems and Information Management at the University of Technology Braunschweig (Germany) from 1995 to 2002. He holds degrees in Mathematics (diploma) and Economics from the University of Hamburg and a Ph.D. and the habilitation from the University of Technol-ogy Darmstadt. His current research interests are in quantitative/information systems approaches to supply chain management and logistics, including applications in maritime shipping, public mass transit, and telecommunications. He is author and co-author of several books and numerous papers in various journals and serves as editor of Netnomics and Public Transport.