Indian Science & Technology Research: A scientometric Mapping
23
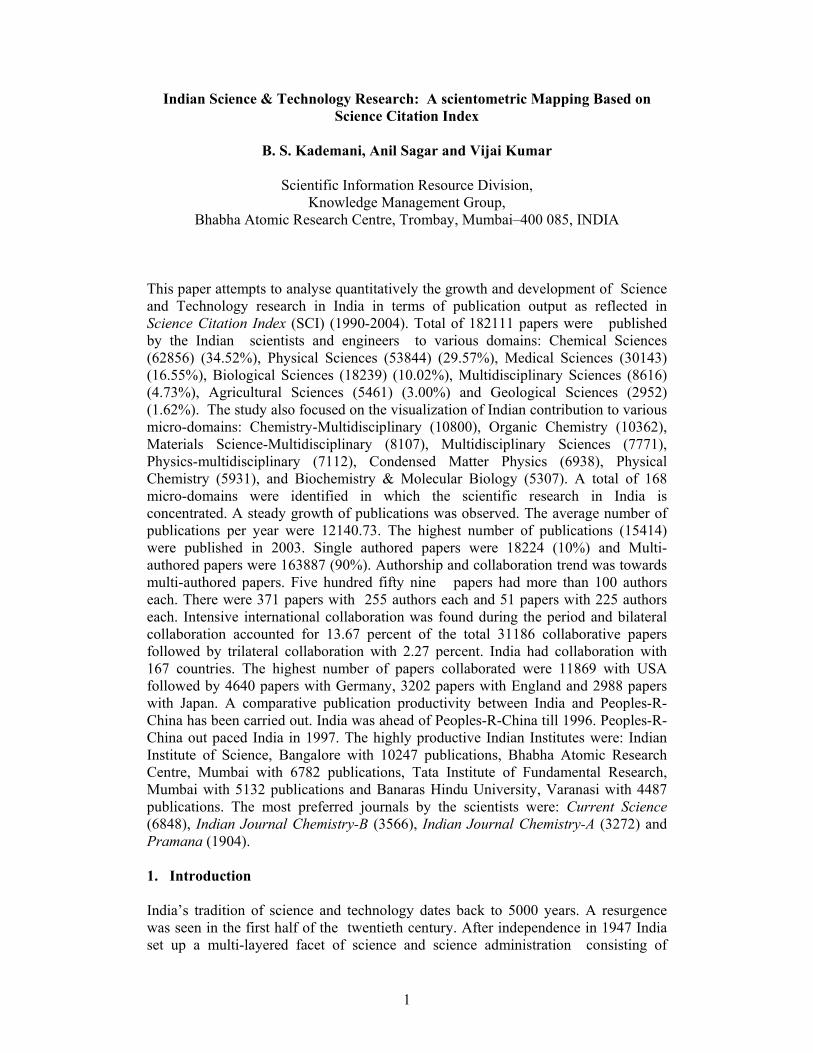
1 Indian Science & Technology Research: A scientometric Mapping Based on Science Citation Index B. S. Kademani, Anil Sagar and Vijai Kumar Scientific Information Resource Division, Knowledge Management Group, Bhabha Atomic Research Centre, Trombay, Mumbai–400 085, INDIA This paper attempts to analyse quantitatively the growth and development of Science and Technology research in India in terms of publication output as reflected in Science Citation Index (SCI) (1990-2004). Total of 182111 papers were published by the Indian scientists and engineers to various domains: Chemical Sciences (62856) (34.52%), Physical Sciences (53844) (29.57%), Medical Sciences (30143) (16.55%), Biological Sciences (18239) (10.02%), Multidisciplinary Sciences (8616) (4.73%), Agricultural Sciences (5461) (3.00%) and Geological Sciences (2952) (1.62%). The study also focused on the visualization of Indian contribution to various micro-domains: Chemistry-Multidisciplinary (10800), Organic Chemistry (10362), Materials Science-Multidisciplinary (8107), Multidisciplinary Sciences (7771), Physics-multidisciplinary (7112), Condensed Matter Physics (6938), Physical Chemistry (5931), and Biochemistry & Molecular Biology (5307). A total of 168 micro-domains were identified in which the scientific research in India is concentrated. A steady growth of publications was observed. The average number of publications per year were 12140.73. The highest number of publications (15414) were published in 2003. Single authored papers were 18224 (10%) and Multi- authored papers were 163887 (90%). Authorship and collaboration trend was towards multi-authored papers. Five hundred fifty nine papers had more than 100 authors each. There were 371 papers with 255 authors each and 51 papers with 225 authors each. Intensive international collaboration was found during the period and bilateral collaboration accounted for 13.67 percent of the total 31186 collaborative papers followed by trilateral collaboration with 2.27 percent. India had collaboration with 167 countries. The highest number of papers collaborated were 11869 with USA followed by 4640 papers with Germany, 3202 papers with England and 2988 papers with Japan. A comparative publication productivity between India and Peoples-R- China has been carried out. India was ahead of Peoples-R-China till 1996. Peoples-R- China out paced India in 1997. The highly productive Indian Institutes were: Indian Institute of Science, Bangalore with 10247 publications, Bhabha Atomic Research Centre, Mumbai with 6782 publications, Tata Institute of Fundamental Research, Mumbai with 5132 publications and Banaras Hindu University, Varanasi with 4487 publications. The most preferred journals by the scientists were: Current Science (6848), Indian Journal Chemistry-B (3566), Indian Journal Chemistry-A (3272) and Pramana (1904). 1. Introduction India’s tradition of science and technology dates back to 5000 years. A resurgence was seen in the first half of the twentieth century. After independence in 1947 India set up a multi-layered facet of science and science administration consisting of
Transcript of Indian Science & Technology Research: A scientometric Mapping
1
Indian Science & Technology Research: A scientometric Mapping Based on Science Citation Index
B. S. Kademani, Anil Sagar and Vijai Kumar
Scientific Information Resource Division,
Knowledge Management Group, Bhabha Atomic Research Centre, Trombay, Mumbai–400 085, INDIA
This paper attempts to analyse quantitatively the growth and development of Science and Technology research in India in terms of publication output as reflected in Science Citation Index (SCI) (1990-2004). Total of 182111 papers were published by the Indian scientists and engineers to various domains: Chemical Sciences (62856) (34.52%), Physical Sciences (53844) (29.57%), Medical Sciences (30143) (16.55%), Biological Sciences (18239) (10.02%), Multidisciplinary Sciences (8616) (4.73%), Agricultural Sciences (5461) (3.00%) and Geological Sciences (2952) (1.62%). The study also focused on the visualization of Indian contribution to various micro-domains: Chemistry-Multidisciplinary (10800), Organic Chemistry (10362), Materials Science-Multidisciplinary (8107), Multidisciplinary Sciences (7771), Physics-multidisciplinary (7112), Condensed Matter Physics (6938), Physical Chemistry (5931), and Biochemistry & Molecular Biology (5307). A total of 168 micro-domains were identified in which the scientific research in India is concentrated. A steady growth of publications was observed. The average number of publications per year were 12140.73. The highest number of publications (15414) were published in 2003. Single authored papers were 18224 (10%) and Multi-authored papers were 163887 (90%). Authorship and collaboration trend was towards multi-authored papers. Five hundred fifty nine papers had more than 100 authors each. There were 371 papers with 255 authors each and 51 papers with 225 authors each. Intensive international collaboration was found during the period and bilateral collaboration accounted for 13.67 percent of the total 31186 collaborative papers followed by trilateral collaboration with 2.27 percent. India had collaboration with 167 countries. The highest number of papers collaborated were 11869 with USA followed by 4640 papers with Germany, 3202 papers with England and 2988 papers with Japan. A comparative publication productivity between India and Peoples-R-China has been carried out. India was ahead of Peoples-R-China till 1996. Peoples-R-China out paced India in 1997. The highly productive Indian Institutes were: Indian Institute of Science, Bangalore with 10247 publications, Bhabha Atomic Research Centre, Mumbai with 6782 publications, Tata Institute of Fundamental Research, Mumbai with 5132 publications and Banaras Hindu University, Varanasi with 4487 publications. The most preferred journals by the scientists were: Current Science (6848), Indian Journal Chemistry-B (3566), Indian Journal Chemistry-A (3272) and Pramana (1904). 1. Introduction India’s tradition of science and technology dates back to 5000 years. A resurgence was seen in the first half of the twentieth century. After independence in 1947 India set up a multi-layered facet of science and science administration consisting of
2
Government agencies, Autonomous bodies, University system, Industrial R&D, both in the public and private sectors. The major scientific agencies like Department of Atomic energy (DAE), Department of Biotechnology (DBT), Department of Ocean Development (DOD), Department of Electronics (DOE), Department of Space (DOS), Defense Research and Development Organization (DRDO), Department of Science and Technology (DST), Council of Scientific and Industrial Research (CSIR), Indian Council of Agriculture Research (ICAR), and Indian Council of Medical Research (ICMR) account for major share of research funding. The main objectives of these agencies are to support and co-ordinate research in their respective areas. The research is carried out through a chain of research laboratories/research institutes under them as well as through research grants/sponsored projects to higher education sectors, national laboratories and establishments. Academic institutions like Indian Institute of Science, IITs have also a major role to play in carrying out R&D activities. Evaluation is one of the key components of any research and development activity. One well-known productivity indicator is the number of publications produced by the scientists, institutions and countries. Studies like this will provide some insight into the complex dynamics of research activity and enable the scientists, policy makers and science administrators to provide adequate facilities and proper guidance in which direction the research has to be conducted. Research publications are clearly one of the quantitative measures for the basic research activity in a country. It must be added, however, that what excites the common man, as well as the scientific community, are the peaks of scientific and technological achievement, not just the statistics on publications. There are also other kinds of research and technology development-mission oriented, industry-oriented, country-specific, etc., progress in these cannot be obviously measured by counting only the number of publications1. Many scientometric studies have appeared in the literature dealing with the scientific output of different countries2-10. 2. Objectives
The main objective of the study is to present the growth of literature and make the quantitative assessment of status of science and technology research in India by way of analyzing the following features of research output: Country-wise distribution of research output in Science & Technology, To find out year-wise growth of publications, To find out domain wise distribution of publications, To find out authorship and collaboration pattern in the publications, To find out publication productivity of India and Peoples-Republic of China, To find out the extent of international collaboration, To find out the highly productive international institutes with whom India had collaborated, To find out the highly productive Indian institutes, To find out language-wise distribution of publications, and To find out the channels of communications used by the scientists.
3
3. Materials and Methods Data was collected from the Science Citation Index (1990-2004) published by the Institute of Scientific Information, Philadelphia (now a division of the Thomson Corporation). Science Citation Index is one of the comprehensive databases covering all aspects of science which covers about 4000 journals with high impact factors. By using suitable search strategy (India in Address word field) records by Indian authors affiliated at least to one Indian institute were downloaded for the years 1990-2004. A total of 182111 records were downloaded and analysed as per objectives of the study. 4. Results and Discussion
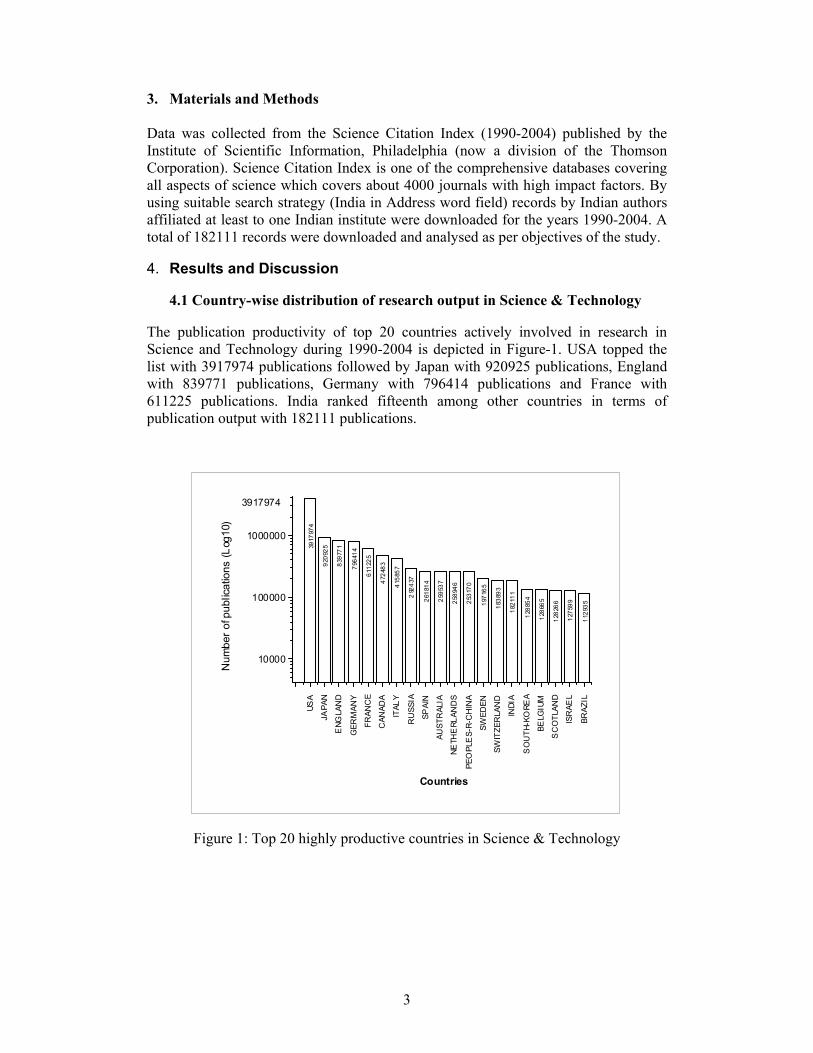
4.1 Country-wise distribution of research output in Science & Technology The publication productivity of top 20 countries actively involved in research in Science and Technology during 1990-2004 is depicted in Figure-1. USA topped the list with 3917974 publications followed by Japan with 920925 publications, England with 839771 publications, Germany with 796414 publications and France with 611225 publications. India ranked fifteenth among other countries in terms of publication output with 182111 publications.
Figure 1: Top 20 highly productive countries in Science & Technology
USA
JAPA
N
ENG
LAN
D
GER
MAN
Y
FRAN
CE
CAN
ADA
ITAL
Y
RU
SSIA
SPAI
N
AUST
RAL
IA
NETH
ERL
AND
S
PEO
PLE
S-R-
CH
INA
SWED
EN
SWIT
ZER
LAN
D
INDI
A
SO
UTH
-KO
REA
BELG
IUM
SC
OTL
AND
ISR
AEL
BRAZ
IL
10000
100000
1000000
1129
35
1275
99
1282
66
1286
65
1288
54
1821
11
1838
93
1971
65
2531
70
2589
46
2595
37
2618
14
292
437
4158
57
4724
83
6112
25
7964
14
8397
71
9209
253917
974
3917974
Num
ber o
f pub
licat
ions
(Log
10)
Countries
4
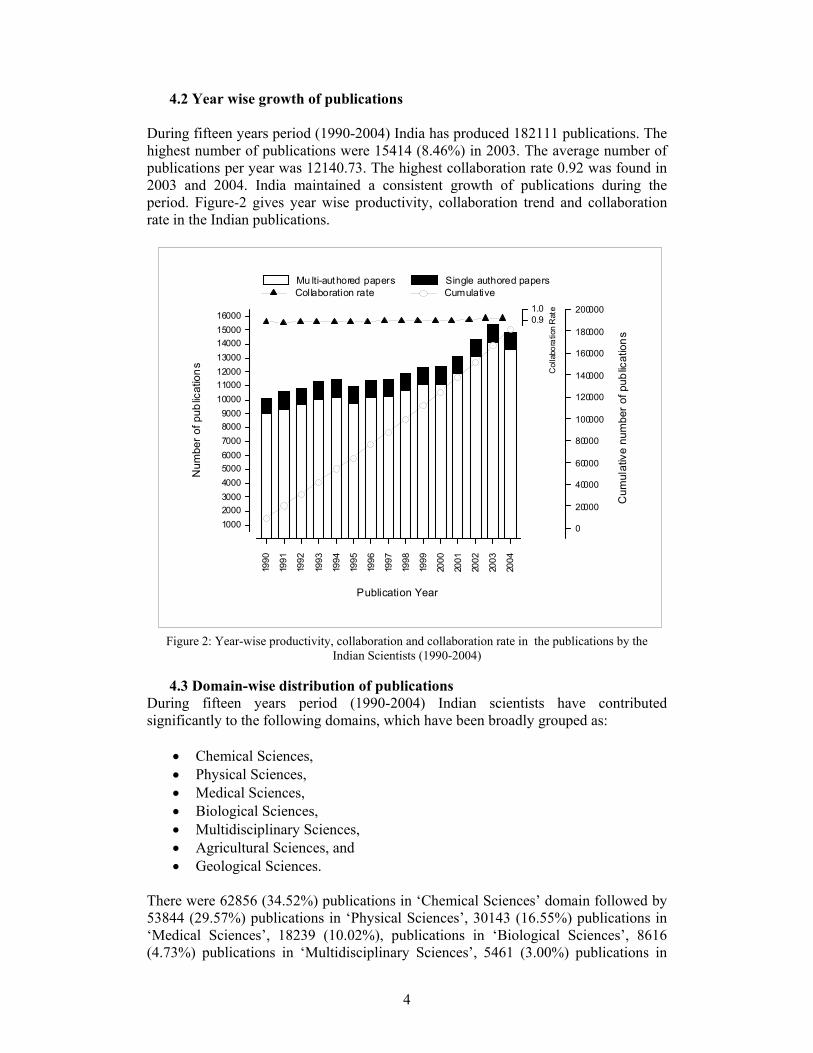
4.2 Year wise growth of publications During fifteen years period (1990-2004) India has produced 182111 publications. The highest number of publications were 15414 (8.46%) in 2003. The average number of publications per year was 12140.73. The highest collaboration rate 0.92 was found in 2003 and 2004. India maintained a consistent growth of publications during the period. Figure-2 gives year wise productivity, collaboration trend and collaboration rate in the Indian publications.
Figure 2: Year-wise productivity, collaboration and collaboration rate in the publications by the Indian Scientists (1990-2004)
4.3 Domain-wise distribution of publications
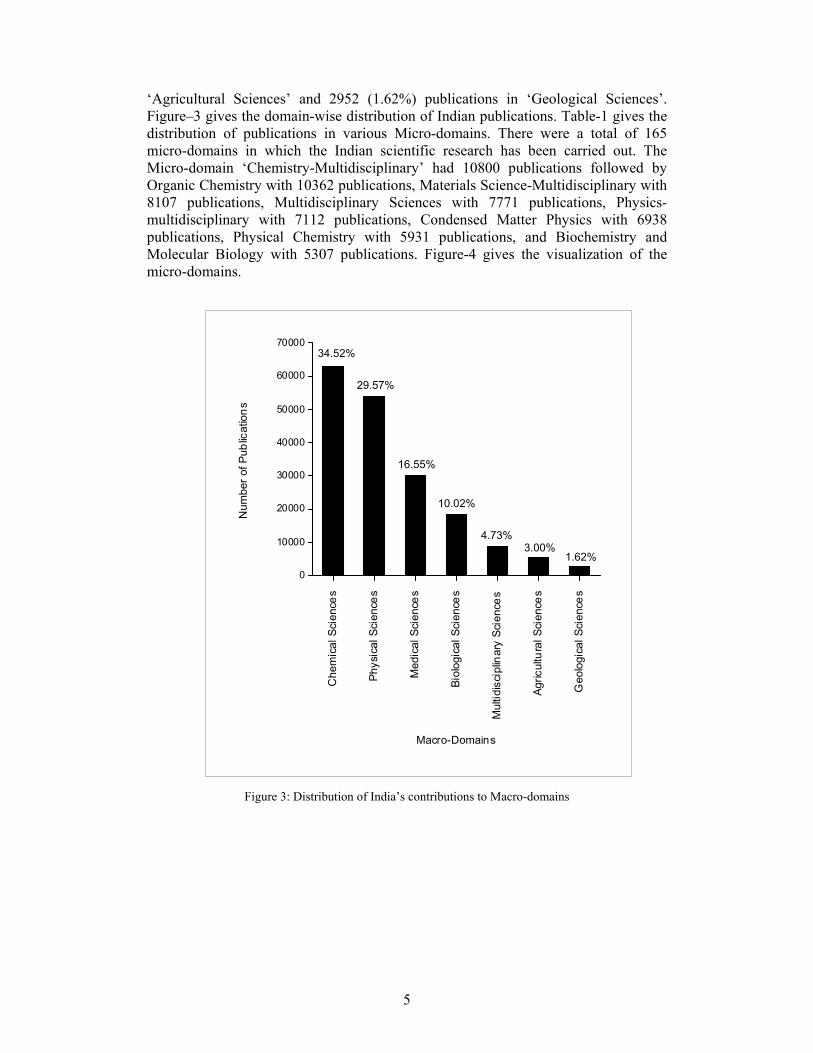
During fifteen years period (1990-2004) Indian scientists have contributed significantly to the following domains, which have been broadly grouped as:
• Chemical Sciences, • Physical Sciences, • Medical Sciences, • Biological Sciences, • Multidisciplinary Sciences, • Agricultural Sciences, and • Geological Sciences.
There were 62856 (34.52%) publications in ‘Chemical Sciences’ domain followed by 53844 (29.57%) publications in ‘Physical Sciences’, 30143 (16.55%) publications in ‘Medical Sciences’, 18239 (10.02%), publications in ‘Biological Sciences’, 8616 (4.73%) publications in ‘Multidisciplinary Sciences’, 5461 (3.00%) publications in
1989
1990
1991
1992
1993
1994
1995
1996
1997
1998
1999
2000
2001
2002
2003
2004
2005
0100020003000400050006000700080009000
10000110001200013000140001500016000
Num
ber o
f pub
licat
ions
Publication Year
Mu lti-authored papers Single authored papers
0
20000
40000
60000
80000
100000
120000
140000
160000
180000
200000
Col
labo
ratio
n R
ate
Cum
ulat
ive
num
ber o
f pub
licat
ions
Cumulative
-1.0-0.9-0.8-0.7-0.6-0.5-0.4-0.3-0.2-0.10.00.10.20.30.40.50.60.70.80.91.0
Collaboration rate
5
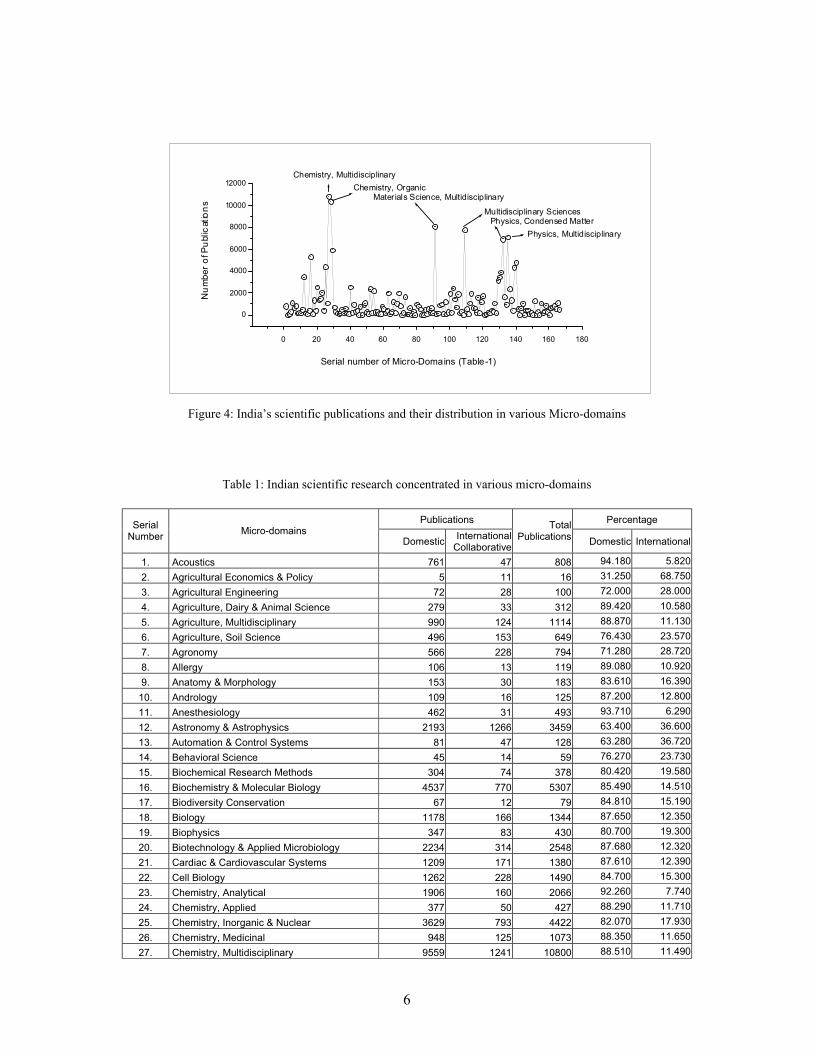
‘Agricultural Sciences’ and 2952 (1.62%) publications in ‘Geological Sciences’. Figure–3 gives the domain-wise distribution of Indian publications. Table-1 gives the distribution of publications in various Micro-domains. There were a total of 165 micro-domains in which the Indian scientific research has been carried out. The Micro-domain ‘Chemistry-Multidisciplinary’ had 10800 publications followed by Organic Chemistry with 10362 publications, Materials Science-Multidisciplinary with 8107 publications, Multidisciplinary Sciences with 7771 publications, Physics-multidisciplinary with 7112 publications, Condensed Matter Physics with 6938 publications, Physical Chemistry with 5931 publications, and Biochemistry and Molecular Biology with 5307 publications. Figure-4 gives the visualization of the micro-domains.
Figure 3: Distribution of India’s contributions to Macro-domains
Che
mic
al S
cien
ces
Phys
ical
Sci
ence
s
Med
ical
Sci
ence
s
Biol
ogic
al S
cien
ces
Mul
tidis
cipl
inar
y Sc
ienc
es
Agric
ultu
ral S
cien
ces
Geo
logi
cal S
cien
ces
0
10000
20000
30000
40000
50000
60000
70000
1.62%3.00%
4.73%
10.02%
16.55%
29.57%
34.52%
Num
ber o
f Pub
licat
ions
Macro-Domains
6
Figure 4: India’s scientific publications and their distribution in various Micro-domains
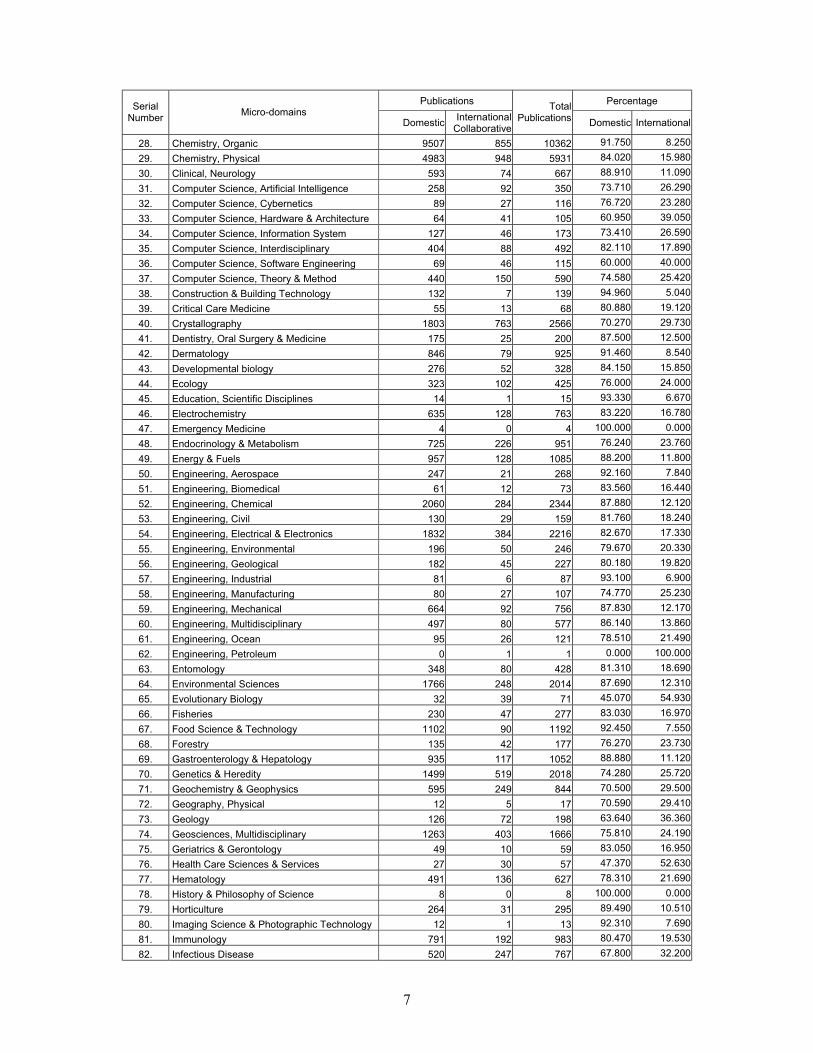
Table 1: Indian scientific research concentrated in various micro-domains
Publications Percentage Serial Number Micro-domains
Domestic International Collaborative
Total Publications Domestic International
1. Acoustics 761 47 808 94.180 5.820 2. Agricultural Economics & Policy 5 11 16 31.250 68.750 3. Agricultural Engineering 72 28 100 72.000 28.000 4. Agriculture, Dairy & Animal Science 279 33 312 89.420 10.580 5. Agriculture, Multidisciplinary 990 124 1114 88.870 11.130 6. Agriculture, Soil Science 496 153 649 76.430 23.570 7. Agronomy 566 228 794 71.280 28.720 8. Allergy 106 13 119 89.080 10.920 9. Anatomy & Morphology 153 30 183 83.610 16.390
10. Andrology 109 16 125 87.200 12.800 11. Anesthesiology 462 31 493 93.710 6.290 12. Astronomy & Astrophysics 2193 1266 3459 63.400 36.600 13. Automation & Control Systems 81 47 128 63.280 36.720 14. Behavioral Science 45 14 59 76.270 23.730 15. Biochemical Research Methods 304 74 378 80.420 19.580 16. Biochemistry & Molecular Biology 4537 770 5307 85.490 14.510 17. Biodiversity Conservation 67 12 79 84.810 15.190 18. Biology 1178 166 1344 87.650 12.350 19. Biophysics 347 83 430 80.700 19.300 20. Biotechnology & Applied Microbiology 2234 314 2548 87.680 12.320 21. Cardiac & Cardiovascular Systems 1209 171 1380 87.610 12.390 22. Cell Biology 1262 228 1490 84.700 15.300 23. Chemistry, Analytical 1906 160 2066 92.260 7.740 24. Chemistry, Applied 377 50 427 88.290 11.710 25. Chemistry, Inorganic & Nuclear 3629 793 4422 82.070 17.930 26. Chemistry, Medicinal 948 125 1073 88.350 11.650 27. Chemistry, Multidisciplinary 9559 1241 10800 88.510 11.490
0 20 40 60 80 100 120 140 160 180
0
2000
4000
6000
8000
10000
12000
Physics, MultidisciplinaryPhysics, Condensed Matter
Multidisciplinary Sciences
Materials Science, MultidisciplinaryChemistry, Organic
Chemistry, Multidisciplinary
Num
ber o
f Pub
licat
ions
Serial number of Micro-Domains (Table-1)
7
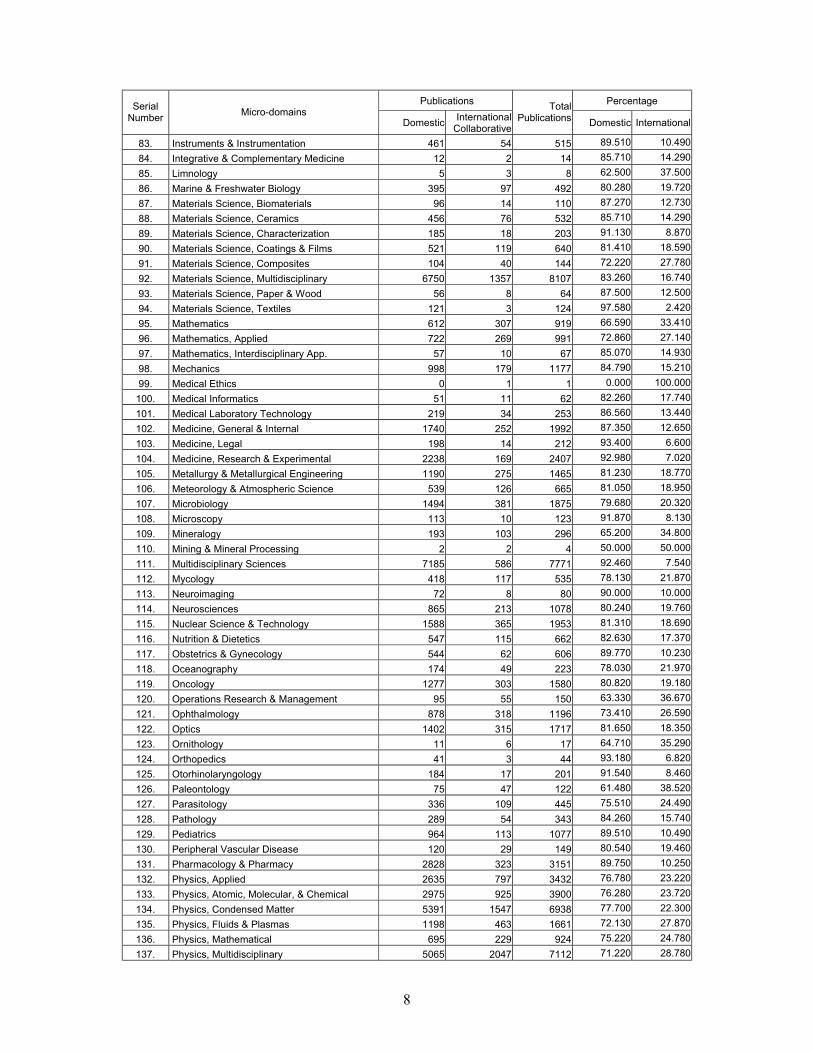
Publications Percentage Serial Number Micro-domains
Domestic International Collaborative
Total Publications Domestic International
28. Chemistry, Organic 9507 855 10362 91.750 8.250 29. Chemistry, Physical 4983 948 5931 84.020 15.980 30. Clinical, Neurology 593 74 667 88.910 11.090 31. Computer Science, Artificial Intelligence 258 92 350 73.710 26.290 32. Computer Science, Cybernetics 89 27 116 76.720 23.280 33. Computer Science, Hardware & Architecture 64 41 105 60.950 39.050 34. Computer Science, Information System 127 46 173 73.410 26.590 35. Computer Science, Interdisciplinary 404 88 492 82.110 17.890 36. Computer Science, Software Engineering 69 46 115 60.000 40.000 37. Computer Science, Theory & Method 440 150 590 74.580 25.420 38. Construction & Building Technology 132 7 139 94.960 5.040 39. Critical Care Medicine 55 13 68 80.880 19.120 40. Crystallography 1803 763 2566 70.270 29.730 41. Dentistry, Oral Surgery & Medicine 175 25 200 87.500 12.500 42. Dermatology 846 79 925 91.460 8.540 43. Developmental biology 276 52 328 84.150 15.850 44. Ecology 323 102 425 76.000 24.000 45. Education, Scientific Disciplines 14 1 15 93.330 6.670 46. Electrochemistry 635 128 763 83.220 16.780 47. Emergency Medicine 4 0 4 100.000 0.000 48. Endocrinology & Metabolism 725 226 951 76.240 23.760 49. Energy & Fuels 957 128 1085 88.200 11.800 50. Engineering, Aerospace 247 21 268 92.160 7.840 51. Engineering, Biomedical 61 12 73 83.560 16.440 52. Engineering, Chemical 2060 284 2344 87.880 12.120 53. Engineering, Civil 130 29 159 81.760 18.240 54. Engineering, Electrical & Electronics 1832 384 2216 82.670 17.330 55. Engineering, Environmental 196 50 246 79.670 20.330 56. Engineering, Geological 182 45 227 80.180 19.820 57. Engineering, Industrial 81 6 87 93.100 6.900 58. Engineering, Manufacturing 80 27 107 74.770 25.230 59. Engineering, Mechanical 664 92 756 87.830 12.170 60. Engineering, Multidisciplinary 497 80 577 86.140 13.860 61. Engineering, Ocean 95 26 121 78.510 21.490 62. Engineering, Petroleum 0 1 1 0.000 100.000 63. Entomology 348 80 428 81.310 18.690 64. Environmental Sciences 1766 248 2014 87.690 12.310 65. Evolutionary Biology 32 39 71 45.070 54.930 66. Fisheries 230 47 277 83.030 16.970 67. Food Science & Technology 1102 90 1192 92.450 7.550 68. Forestry 135 42 177 76.270 23.730 69. Gastroenterology & Hepatology 935 117 1052 88.880 11.120 70. Genetics & Heredity 1499 519 2018 74.280 25.720 71. Geochemistry & Geophysics 595 249 844 70.500 29.500 72. Geography, Physical 12 5 17 70.590 29.410 73. Geology 126 72 198 63.640 36.360 74. Geosciences, Multidisciplinary 1263 403 1666 75.810 24.190 75. Geriatrics & Gerontology 49 10 59 83.050 16.950 76. Health Care Sciences & Services 27 30 57 47.370 52.630 77. Hematology 491 136 627 78.310 21.690 78. History & Philosophy of Science 8 0 8 100.000 0.000 79. Horticulture 264 31 295 89.490 10.510 80. Imaging Science & Photographic Technology 12 1 13 92.310 7.690 81. Immunology 791 192 983 80.470 19.530 82. Infectious Disease 520 247 767 67.800 32.200
8
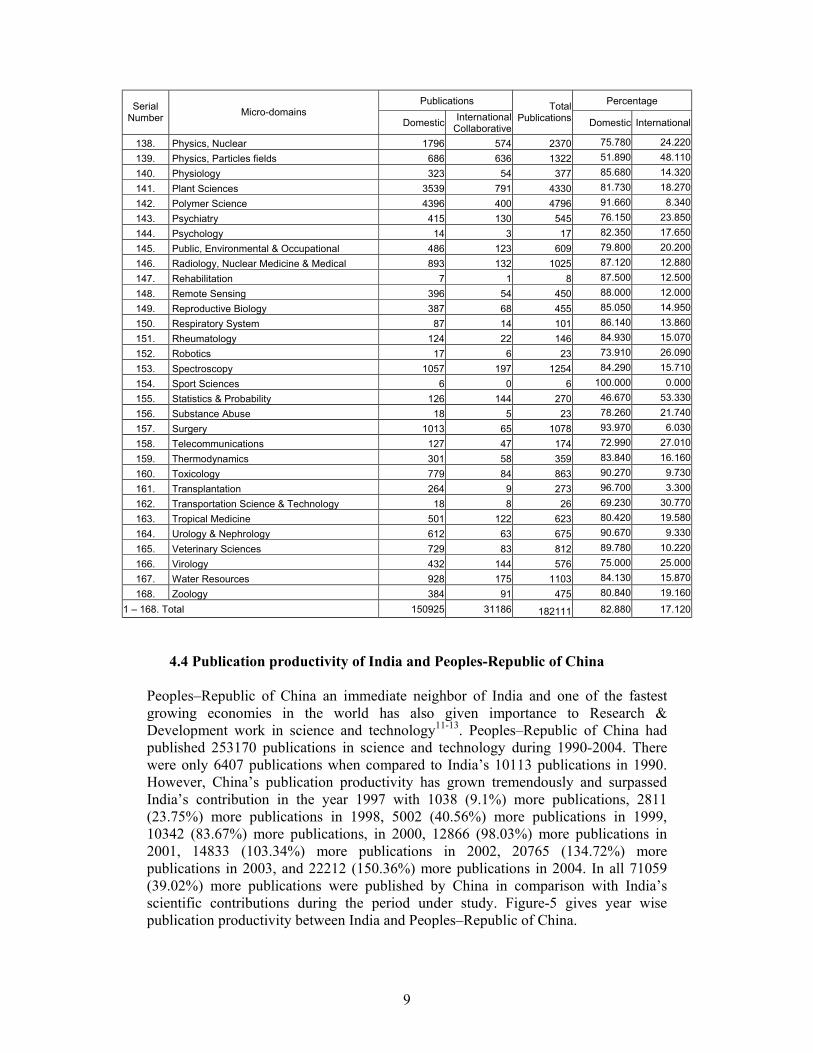
Publications Percentage Serial Number Micro-domains
Domestic International Collaborative
Total Publications Domestic International
83. Instruments & Instrumentation 461 54 515 89.510 10.490 84. Integrative & Complementary Medicine 12 2 14 85.710 14.290 85. Limnology 5 3 8 62.500 37.500 86. Marine & Freshwater Biology 395 97 492 80.280 19.720 87. Materials Science, Biomaterials 96 14 110 87.270 12.730 88. Materials Science, Ceramics 456 76 532 85.710 14.290 89. Materials Science, Characterization 185 18 203 91.130 8.870 90. Materials Science, Coatings & Films 521 119 640 81.410 18.590 91. Materials Science, Composites 104 40 144 72.220 27.780 92. Materials Science, Multidisciplinary 6750 1357 8107 83.260 16.740 93. Materials Science, Paper & Wood 56 8 64 87.500 12.500 94. Materials Science, Textiles 121 3 124 97.580 2.420 95. Mathematics 612 307 919 66.590 33.410 96. Mathematics, Applied 722 269 991 72.860 27.140 97. Mathematics, Interdisciplinary App. 57 10 67 85.070 14.930 98. Mechanics 998 179 1177 84.790 15.210 99. Medical Ethics 0 1 1 0.000 100.000
100. Medical Informatics 51 11 62 82.260 17.740 101. Medical Laboratory Technology 219 34 253 86.560 13.440 102. Medicine, General & Internal 1740 252 1992 87.350 12.650 103. Medicine, Legal 198 14 212 93.400 6.600 104. Medicine, Research & Experimental 2238 169 2407 92.980 7.020 105. Metallurgy & Metallurgical Engineering 1190 275 1465 81.230 18.770 106. Meteorology & Atmospheric Science 539 126 665 81.050 18.950 107. Microbiology 1494 381 1875 79.680 20.320 108. Microscopy 113 10 123 91.870 8.130 109. Mineralogy 193 103 296 65.200 34.800 110. Mining & Mineral Processing 2 2 4 50.000 50.000 111. Multidisciplinary Sciences 7185 586 7771 92.460 7.540 112. Mycology 418 117 535 78.130 21.870 113. Neuroimaging 72 8 80 90.000 10.000 114. Neurosciences 865 213 1078 80.240 19.760 115. Nuclear Science & Technology 1588 365 1953 81.310 18.690 116. Nutrition & Dietetics 547 115 662 82.630 17.370 117. Obstetrics & Gynecology 544 62 606 89.770 10.230 118. Oceanography 174 49 223 78.030 21.970 119. Oncology 1277 303 1580 80.820 19.180 120. Operations Research & Management 95 55 150 63.330 36.670 121. Ophthalmology 878 318 1196 73.410 26.590 122. Optics 1402 315 1717 81.650 18.350 123. Ornithology 11 6 17 64.710 35.290 124. Orthopedics 41 3 44 93.180 6.820 125. Otorhinolaryngology 184 17 201 91.540 8.460 126. Paleontology 75 47 122 61.480 38.520 127. Parasitology 336 109 445 75.510 24.490 128. Pathology 289 54 343 84.260 15.740 129. Pediatrics 964 113 1077 89.510 10.490 130. Peripheral Vascular Disease 120 29 149 80.540 19.460 131. Pharmacology & Pharmacy 2828 323 3151 89.750 10.250 132. Physics, Applied 2635 797 3432 76.780 23.220 133. Physics, Atomic, Molecular, & Chemical 2975 925 3900 76.280 23.720 134. Physics, Condensed Matter 5391 1547 6938 77.700 22.300 135. Physics, Fluids & Plasmas 1198 463 1661 72.130 27.870 136. Physics, Mathematical 695 229 924 75.220 24.780 137. Physics, Multidisciplinary 5065 2047 7112 71.220 28.780
9
Publications Percentage Serial Number Micro-domains
Domestic International Collaborative
Total Publications Domestic International
138. Physics, Nuclear 1796 574 2370 75.780 24.220 139. Physics, Particles fields 686 636 1322 51.890 48.110 140. Physiology 323 54 377 85.680 14.320 141. Plant Sciences 3539 791 4330 81.730 18.270 142. Polymer Science 4396 400 4796 91.660 8.340 143. Psychiatry 415 130 545 76.150 23.850 144. Psychology 14 3 17 82.350 17.650 145. Public, Environmental & Occupational 486 123 609 79.800 20.200 146. Radiology, Nuclear Medicine & Medical 893 132 1025 87.120 12.880 147. Rehabilitation 7 1 8 87.500 12.500 148. Remote Sensing 396 54 450 88.000 12.000 149. Reproductive Biology 387 68 455 85.050 14.950 150. Respiratory System 87 14 101 86.140 13.860 151. Rheumatology 124 22 146 84.930 15.070 152. Robotics 17 6 23 73.910 26.090 153. Spectroscopy 1057 197 1254 84.290 15.710 154. Sport Sciences 6 0 6 100.000 0.000 155. Statistics & Probability 126 144 270 46.670 53.330 156. Substance Abuse 18 5 23 78.260 21.740 157. Surgery 1013 65 1078 93.970 6.030 158. Telecommunications 127 47 174 72.990 27.010 159. Thermodynamics 301 58 359 83.840 16.160 160. Toxicology 779 84 863 90.270 9.730 161. Transplantation 264 9 273 96.700 3.300 162. Transportation Science & Technology 18 8 26 69.230 30.770 163. Tropical Medicine 501 122 623 80.420 19.580 164. Urology & Nephrology 612 63 675 90.670 9.330 165. Veterinary Sciences 729 83 812 89.780 10.220 166. Virology 432 144 576 75.000 25.000 167. Water Resources 928 175 1103 84.130 15.870 168. Zoology 384 91 475 80.840 19.160
1 – 168. Total 150925 31186 182111 82.880 17.120
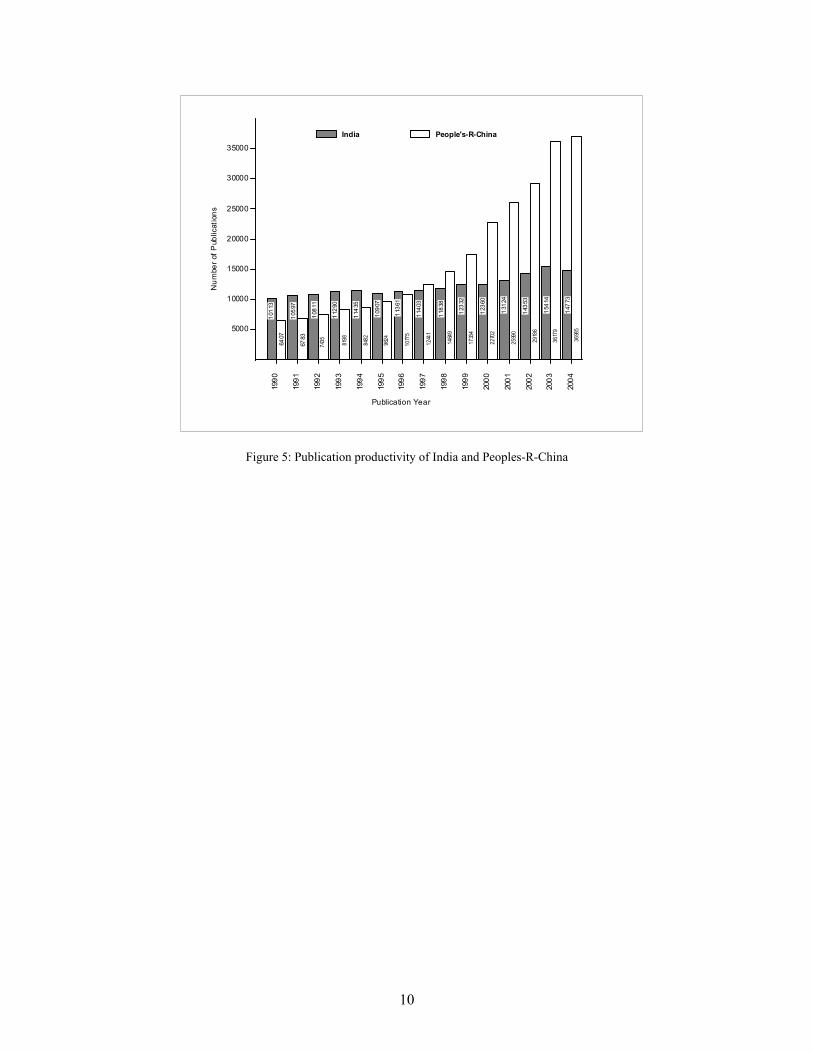
4.4 Publication productivity of India and Peoples-Republic of China Peoples–Republic of China an immediate neighbor of India and one of the fastest growing economies in the world has also given importance to Research & Development work in science and technology11-13. Peoples–Republic of China had published 253170 publications in science and technology during 1990-2004. There were only 6407 publications when compared to India’s 10113 publications in 1990. However, China’s publication productivity has grown tremendously and surpassed India’s contribution in the year 1997 with 1038 (9.1%) more publications, 2811 (23.75%) more publications in 1998, 5002 (40.56%) more publications in 1999, 10342 (83.67%) more publications, in 2000, 12866 (98.03%) more publications in 2001, 14833 (103.34%) more publications in 2002, 20765 (134.72%) more publications in 2003, and 22212 (150.36%) more publications in 2004. In all 71059 (39.02%) more publications were published by China in comparison with India’s scientific contributions during the period under study. Figure-5 gives year wise publication productivity between India and Peoples–Republic of China.
10
Figure 5: Publication productivity of India and Peoples-R-China
1989
1990
1991
1992
1993
1994
1995
1996
1997
1998
1999
2000
2001
2002
2003
2004
5000
10000
15000
20000
25000
30000
35000
3698
5
3617
9
2918
6
2599
0
2270
2
1733
4
1464
9
1244
1
1077
5
9624
8482
8198
7435
1477
3
1541
4
1435
3
1312
4
1236
0
1233
2
1183
8
1140
3
1136
1
1090
7
1143
5
1129
0
1081
1
6783
1059
7
6407
1011
3
Num
ber o
f Pub
licat
ions
Publication Year
India People's-R-China
11
.
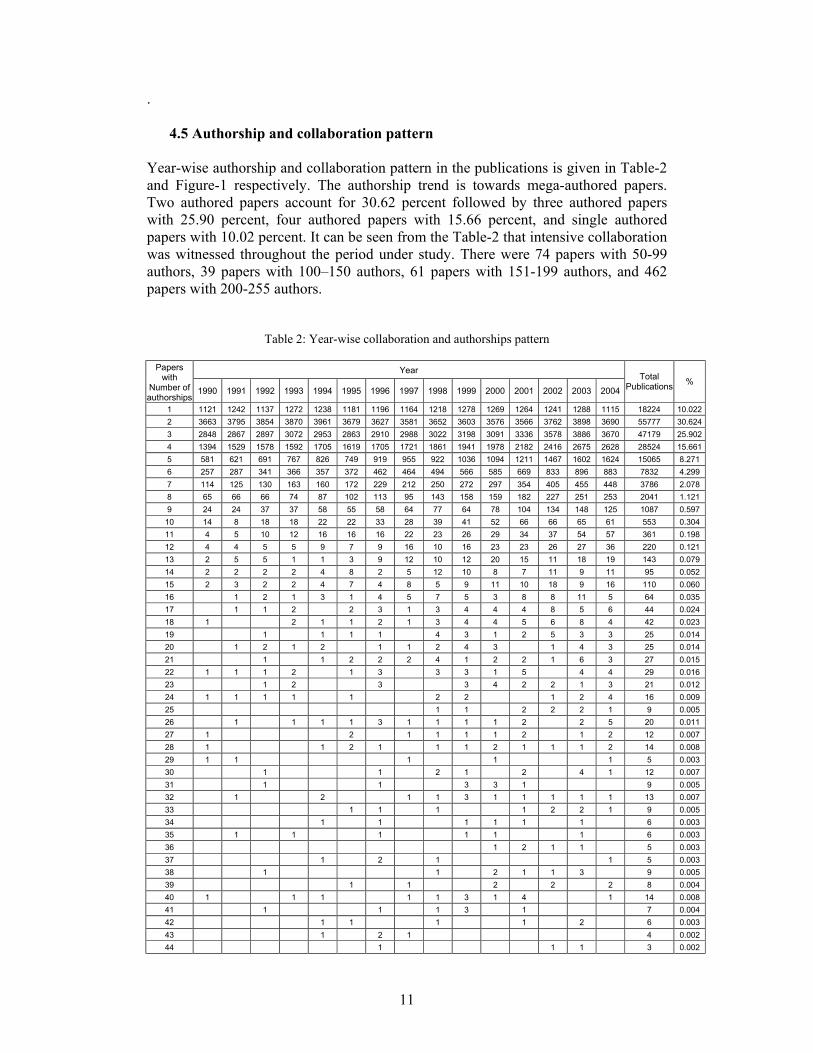
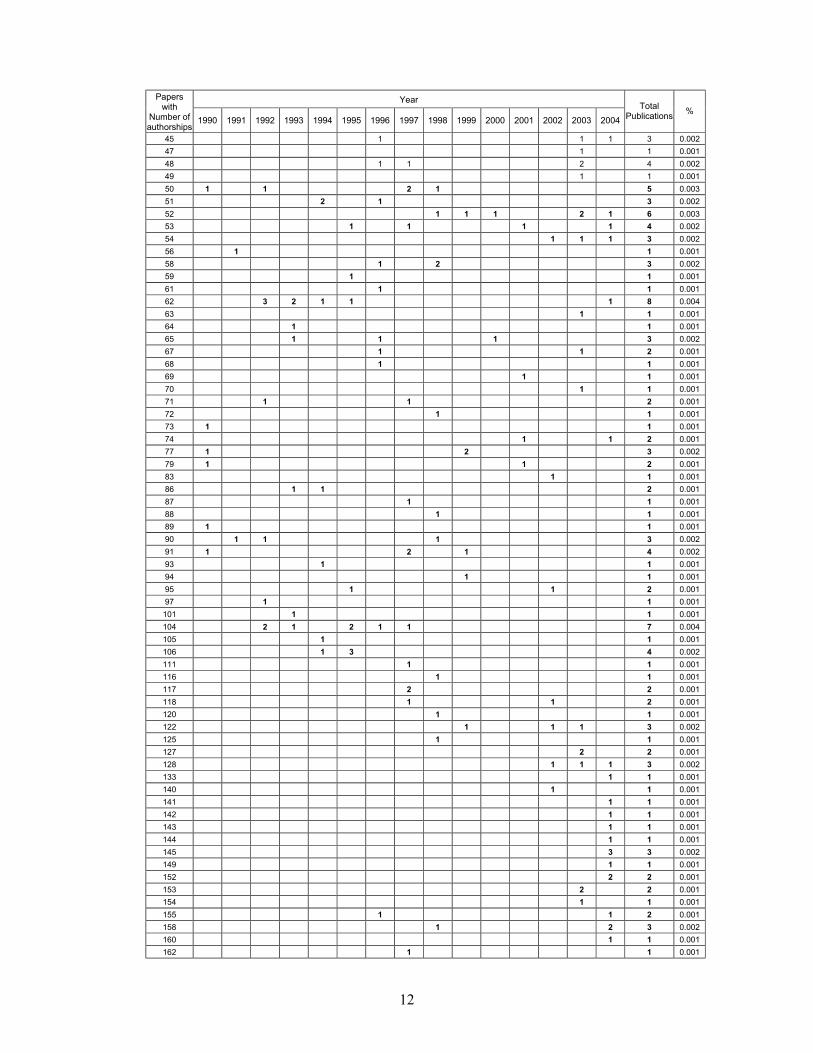
4.5 Authorship and collaboration pattern Year-wise authorship and collaboration pattern in the publications is given in Table-2 and Figure-1 respectively. The authorship trend is towards mega-authored papers. Two authored papers account for 30.62 percent followed by three authored papers with 25.90 percent, four authored papers with 15.66 percent, and single authored papers with 10.02 percent. It can be seen from the Table-2 that intensive collaboration was witnessed throughout the period under study. There were 74 papers with 50-99 authors, 39 papers with 100–150 authors, 61 papers with 151-199 authors, and 462 papers with 200-255 authors.
Table 2: Year-wise collaboration and authorships pattern
Year Papers with
Number of authorships
1990 1991 1992 1993 1994 1995 1996 1997 1998 1999 2000 2001 2002 2003 2004 Total
Publications %
1 1121 1242 1137 1272 1238 1181 1196 1164 1218 1278 1269 1264 1241 1288 1115 18224 10.022 2 3663 3795 3854 3870 3961 3679 3627 3581 3652 3603 3576 3566 3762 3898 3690 55777 30.624 3 2848 2867 2897 3072 2953 2863 2910 2988 3022 3198 3091 3336 3578 3886 3670 47179 25.902 4 1394 1529 1578 1592 1705 1619 1705 1721 1861 1941 1978 2182 2416 2675 2628 28524 15.661 5 581 621 691 767 826 749 919 955 922 1036 1094 1211 1467 1602 1624 15065 8.271 6 257 287 341 366 357 372 462 464 494 566 585 669 833 896 883 7832 4.299 7 114 125 130 163 160 172 229 212 250 272 297 354 405 455 448 3786 2.078 8 65 66 66 74 87 102 113 95 143 158 159 182 227 251 253 2041 1.121 9 24 24 37 37 58 55 58 64 77 64 78 104 134 148 125 1087 0.597 10 14 8 18 18 22 22 33 28 39 41 52 66 66 65 61 553 0.304 11 4 5 10 12 16 16 16 22 23 26 29 34 37 54 57 361 0.198 12 4 4 5 5 9 7 9 16 10 16 23 23 26 27 36 220 0.121 13 2 5 5 1 1 3 9 12 10 12 20 15 11 18 19 143 0.079 14 2 2 2 2 4 8 2 5 12 10 8 7 11 9 11 95 0.052 15 2 3 2 2 4 7 4 8 5 9 11 10 18 9 16 110 0.060 16 1 2 1 3 1 4 5 7 5 3 8 8 11 5 64 0.035 17 1 1 2 2 3 1 3 4 4 4 8 5 6 44 0.024 18 1 2 1 1 2 1 3 4 4 5 6 8 4 42 0.023 19 1 1 1 1 4 3 1 2 5 3 3 25 0.014 20 1 2 1 2 1 1 2 4 3 1 4 3 25 0.014 21 1 1 2 2 2 4 1 2 2 1 6 3 27 0.015 22 1 1 1 2 1 3 3 3 1 5 4 4 29 0.016 23 1 2 3 3 4 2 2 1 3 21 0.012 24 1 1 1 1 1 2 2 1 2 4 16 0.009 25 1 1 2 2 2 1 9 0.005 26 1 1 1 1 3 1 1 1 1 2 2 5 20 0.011 27 1 2 1 1 1 1 2 1 2 12 0.007 28 1 1 2 1 1 1 2 1 1 1 2 14 0.008 29 1 1 1 1 1 5 0.003 30 1 1 2 1 2 4 1 12 0.007 31 1 1 3 3 1 9 0.005 32 1 2 1 1 3 1 1 1 1 1 13 0.007 33 1 1 1 1 2 2 1 9 0.005 34 1 1 1 1 1 1 6 0.003 35 1 1 1 1 1 1 6 0.003 36 1 2 1 1 5 0.003 37 1 2 1 1 5 0.003 38 1 1 2 1 1 3 9 0.005 39 1 1 2 2 2 8 0.004 40 1 1 1 1 1 3 1 4 1 14 0.008 41 1 1 1 3 1 7 0.004 42 1 1 1 1 2 6 0.003 43 1 2 1 4 0.002 44 1 1 1 3 0.002
12
Year Papers with
Number of authorships
1990 1991 1992 1993 1994 1995 1996 1997 1998 1999 2000 2001 2002 2003 2004 Total
Publications %
45 1 1 1 3 0.002 47 1 1 0.001 48 1 1 2 4 0.002 49 1 1 0.001 50 1 1 2 1 5 0.003 51 2 1 3 0.002 52 1 1 1 2 1 6 0.003 53 1 1 1 1 4 0.002 54 1 1 1 3 0.002 56 1 1 0.001 58 1 2 3 0.002 59 1 1 0.001 61 1 1 0.001 62 3 2 1 1 1 8 0.004 63 1 1 0.001 64 1 1 0.001 65 1 1 1 3 0.002 67 1 1 2 0.001 68 1 1 0.001 69 1 1 0.001 70 1 1 0.001 71 1 1 2 0.001 72 1 1 0.001 73 1 1 0.001 74 1 1 2 0.001 77 1 2 3 0.002 79 1 1 2 0.001 83 1 1 0.001 86 1 1 2 0.001 87 1 1 0.001 88 1 1 0.001 89 1 1 0.001 90 1 1 1 3 0.002 91 1 2 1 4 0.002 93 1 1 0.001 94 1 1 0.001 95 1 1 2 0.001 97 1 1 0.001 101 1 1 0.001 104 2 1 2 1 1 7 0.004 105 1 1 0.001 106 1 3 4 0.002 111 1 1 0.001 116 1 1 0.001 117 2 2 0.001 118 1 1 2 0.001 120 1 1 0.001 122 1 1 1 3 0.002 125 1 1 0.001 127 2 2 0.001 128 1 1 1 3 0.002 133 1 1 0.001 140 1 1 0.001 141 1 1 0.001 142 1 1 0.001 143 1 1 0.001 144 1 1 0.001 145 3 3 0.002 149 1 1 0.001 152 2 2 0.001 153 2 2 0.001 154 1 1 0.001 155 1 1 2 0.001 158 1 2 3 0.002 160 1 1 0.001 162 1 1 0.001
13
Year Papers with
Number of authorships
1990 1991 1992 1993 1994 1995 1996 1997 1998 1999 2000 2001 2002 2003 2004 Total
Publications %
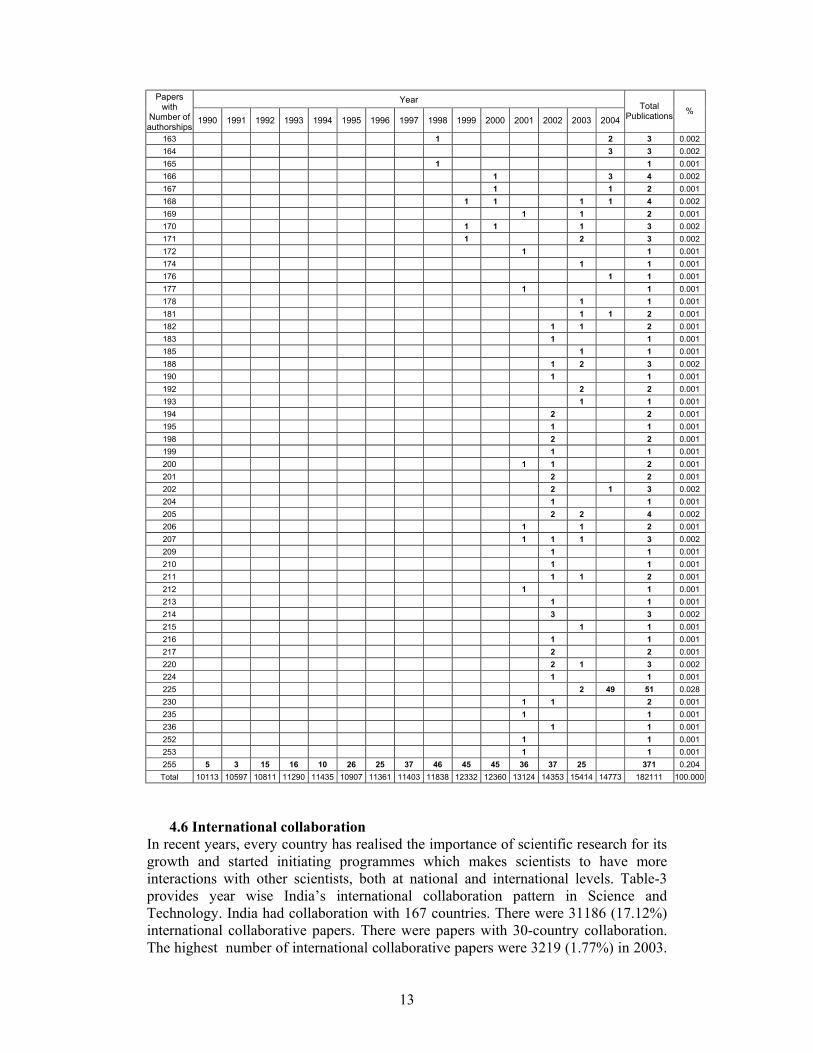
163 1 2 3 0.002 164 3 3 0.002 165 1 1 0.001 166 1 3 4 0.002 167 1 1 2 0.001 168 1 1 1 1 4 0.002 169 1 1 2 0.001 170 1 1 1 3 0.002 171 1 2 3 0.002 172 1 1 0.001 174 1 1 0.001 176 1 1 0.001 177 1 1 0.001 178 1 1 0.001 181 1 1 2 0.001 182 1 1 2 0.001 183 1 1 0.001 185 1 1 0.001 188 1 2 3 0.002 190 1 1 0.001 192 2 2 0.001 193 1 1 0.001 194 2 2 0.001 195 1 1 0.001 198 2 2 0.001 199 1 1 0.001 200 1 1 2 0.001 201 2 2 0.001 202 2 1 3 0.002 204 1 1 0.001 205 2 2 4 0.002 206 1 1 2 0.001 207 1 1 1 3 0.002 209 1 1 0.001 210 1 1 0.001 211 1 1 2 0.001 212 1 1 0.001 213 1 1 0.001 214 3 3 0.002 215 1 1 0.001 216 1 1 0.001 217 2 2 0.001 220 2 1 3 0.002 224 1 1 0.001 225 2 49 51 0.028 230 1 1 2 0.001 235 1 1 0.001 236 1 1 0.001 252 1 1 0.001 253 1 1 0.001 255 5 3 15 16 10 26 25 37 46 45 45 36 37 25 371 0.204 Total 10113 10597 10811 11290 11435 10907 11361 11403 11838 12332 12360 13124 14353 15414 14773 182111 100.000
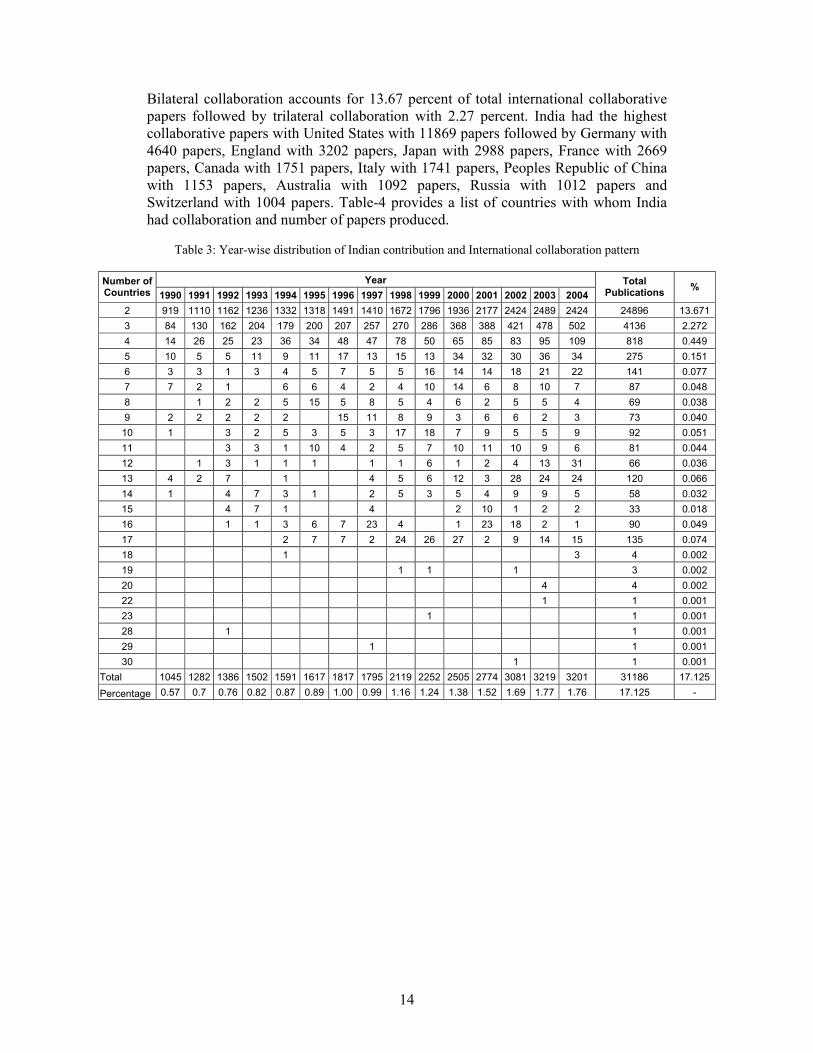
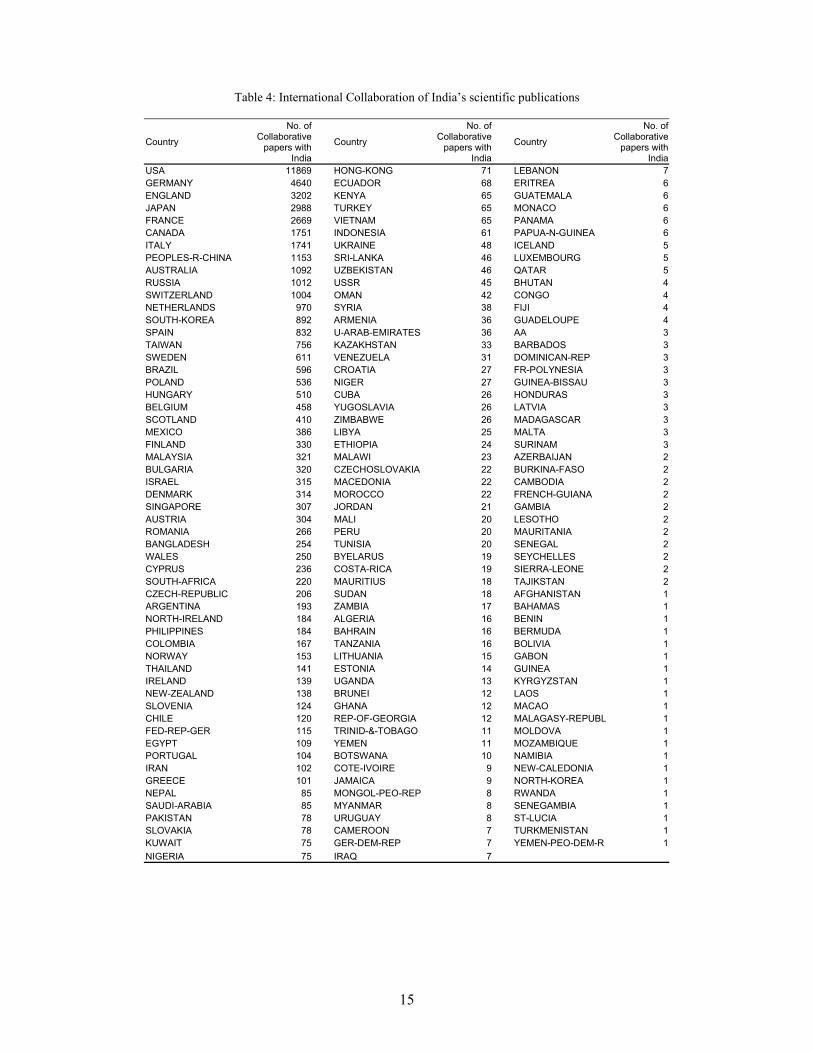
4.6 International collaboration In recent years, every country has realised the importance of scientific research for its growth and started initiating programmes which makes scientists to have more interactions with other scientists, both at national and international levels. Table-3 provides year wise India’s international collaboration pattern in Science and Technology. India had collaboration with 167 countries. There were 31186 (17.12%) international collaborative papers. There were papers with 30-country collaboration. The highest number of international collaborative papers were 3219 (1.77%) in 2003.
14
Bilateral collaboration accounts for 13.67 percent of total international collaborative papers followed by trilateral collaboration with 2.27 percent. India had the highest collaborative papers with United States with 11869 papers followed by Germany with 4640 papers, England with 3202 papers, Japan with 2988 papers, France with 2669 papers, Canada with 1751 papers, Italy with 1741 papers, Peoples Republic of China with 1153 papers, Australia with 1092 papers, Russia with 1012 papers and Switzerland with 1004 papers. Table-4 provides a list of countries with whom India had collaboration and number of papers produced.
Table 3: Year-wise distribution of Indian contribution and International collaboration pattern
Year Number of
Countries 1990 1991 1992 1993 1994 1995 1996 1997 1998 1999 2000 2001 2002 2003 2004 Total
Publications %
2 919 1110 1162 1236 1332 1318 1491 1410 1672 1796 1936 2177 2424 2489 2424 24896 13.671 3 84 130 162 204 179 200 207 257 270 286 368 388 421 478 502 4136 2.272 4 14 26 25 23 36 34 48 47 78 50 65 85 83 95 109 818 0.449 5 10 5 5 11 9 11 17 13 15 13 34 32 30 36 34 275 0.151 6 3 3 1 3 4 5 7 5 5 16 14 14 18 21 22 141 0.077 7 7 2 1 6 6 4 2 4 10 14 6 8 10 7 87 0.048 8 1 2 2 5 15 5 8 5 4 6 2 5 5 4 69 0.038 9 2 2 2 2 2 15 11 8 9 3 6 6 2 3 73 0.040
10 1 3 2 5 3 5 3 17 18 7 9 5 5 9 92 0.051 11 3 3 1 10 4 2 5 7 10 11 10 9 6 81 0.044 12 1 3 1 1 1 1 1 6 1 2 4 13 31 66 0.036 13 4 2 7 1 4 5 6 12 3 28 24 24 120 0.066 14 1 4 7 3 1 2 5 3 5 4 9 9 5 58 0.032 15 4 7 1 4 2 10 1 2 2 33 0.018 16 1 1 3 6 7 23 4 1 23 18 2 1 90 0.049 17 2 7 7 2 24 26 27 2 9 14 15 135 0.074 18 1 3 4 0.002 19 1 1 1 3 0.002 20 4 4 0.002 22 1 1 0.001 23 1 1 0.001 28 1 1 0.001 29 1 1 0.001 30 1 1 0.001
Total 1045 1282 1386 1502 1591 1617 1817 1795 2119 2252 2505 2774 3081 3219 3201 31186 17.125 Percentage 0.57 0.7 0.76 0.82 0.87 0.89 1.00 0.99 1.16 1.24 1.38 1.52 1.69 1.77 1.76 17.125 -
15
Table 4: International Collaboration of India’s scientific publications
Country
No. of Collaborative
papers with India
Country
No. of Collaborative
papers with India
Country
No. of Collaborative
papers with India
USA 11869 HONG-KONG 71 LEBANON 7 GERMANY 4640 ECUADOR 68 ERITREA 6 ENGLAND 3202 KENYA 65 GUATEMALA 6 JAPAN 2988 TURKEY 65 MONACO 6 FRANCE 2669 VIETNAM 65 PANAMA 6 CANADA 1751 INDONESIA 61 PAPUA-N-GUINEA 6 ITALY 1741 UKRAINE 48 ICELAND 5 PEOPLES-R-CHINA 1153 SRI-LANKA 46 LUXEMBOURG 5 AUSTRALIA 1092 UZBEKISTAN 46 QATAR 5 RUSSIA 1012 USSR 45 BHUTAN 4 SWITZERLAND 1004 OMAN 42 CONGO 4 NETHERLANDS 970 SYRIA 38 FIJI 4 SOUTH-KOREA 892 ARMENIA 36 GUADELOUPE 4 SPAIN 832 U-ARAB-EMIRATES 36 AA 3 TAIWAN 756 KAZAKHSTAN 33 BARBADOS 3 SWEDEN 611 VENEZUELA 31 DOMINICAN-REP 3 BRAZIL 596 CROATIA 27 FR-POLYNESIA 3 POLAND 536 NIGER 27 GUINEA-BISSAU 3 HUNGARY 510 CUBA 26 HONDURAS 3 BELGIUM 458 YUGOSLAVIA 26 LATVIA 3 SCOTLAND 410 ZIMBABWE 26 MADAGASCAR 3 MEXICO 386 LIBYA 25 MALTA 3 FINLAND 330 ETHIOPIA 24 SURINAM 3 MALAYSIA 321 MALAWI 23 AZERBAIJAN 2 BULGARIA 320 CZECHOSLOVAKIA 22 BURKINA-FASO 2 ISRAEL 315 MACEDONIA 22 CAMBODIA 2 DENMARK 314 MOROCCO 22 FRENCH-GUIANA 2 SINGAPORE 307 JORDAN 21 GAMBIA 2 AUSTRIA 304 MALI 20 LESOTHO 2 ROMANIA 266 PERU 20 MAURITANIA 2 BANGLADESH 254 TUNISIA 20 SENEGAL 2 WALES 250 BYELARUS 19 SEYCHELLES 2 CYPRUS 236 COSTA-RICA 19 SIERRA-LEONE 2 SOUTH-AFRICA 220 MAURITIUS 18 TAJIKSTAN 2 CZECH-REPUBLIC 206 SUDAN 18 AFGHANISTAN 1 ARGENTINA 193 ZAMBIA 17 BAHAMAS 1 NORTH-IRELAND 184 ALGERIA 16 BENIN 1 PHILIPPINES 184 BAHRAIN 16 BERMUDA 1 COLOMBIA 167 TANZANIA 16 BOLIVIA 1 NORWAY 153 LITHUANIA 15 GABON 1 THAILAND 141 ESTONIA 14 GUINEA 1 IRELAND 139 UGANDA 13 KYRGYZSTAN 1 NEW-ZEALAND 138 BRUNEI 12 LAOS 1 SLOVENIA 124 GHANA 12 MACAO 1 CHILE 120 REP-OF-GEORGIA 12 MALAGASY-REPUBL 1 FED-REP-GER 115 TRINID-&-TOBAGO 11 MOLDOVA 1 EGYPT 109 YEMEN 11 MOZAMBIQUE 1 PORTUGAL 104 BOTSWANA 10 NAMIBIA 1 IRAN 102 COTE-IVOIRE 9 NEW-CALEDONIA 1 GREECE 101 JAMAICA 9 NORTH-KOREA 1 NEPAL 85 MONGOL-PEO-REP 8 RWANDA 1 SAUDI-ARABIA 85 MYANMAR 8 SENEGAMBIA 1 PAKISTAN 78 URUGUAY 8 ST-LUCIA 1 SLOVAKIA 78 CAMEROON 7 TURKMENISTAN 1 KUWAIT 75 GER-DEM-REP 7 YEMEN-PEO-DEM-R 1 NIGERIA 75 IRAQ 7
16
4.7 Collaboration with international institutions India had collaboration with the important international institutions during 1990-2004 were: Istituto Nazionale di Fisica Nucleare-Italy (1909 publications) followed by University of Maryland, USA (533 publications), Rheinisch-Westfalische Technische Hochschule, Aachen, Germany (529 publications), and University of Michigan, USA (502 publications).
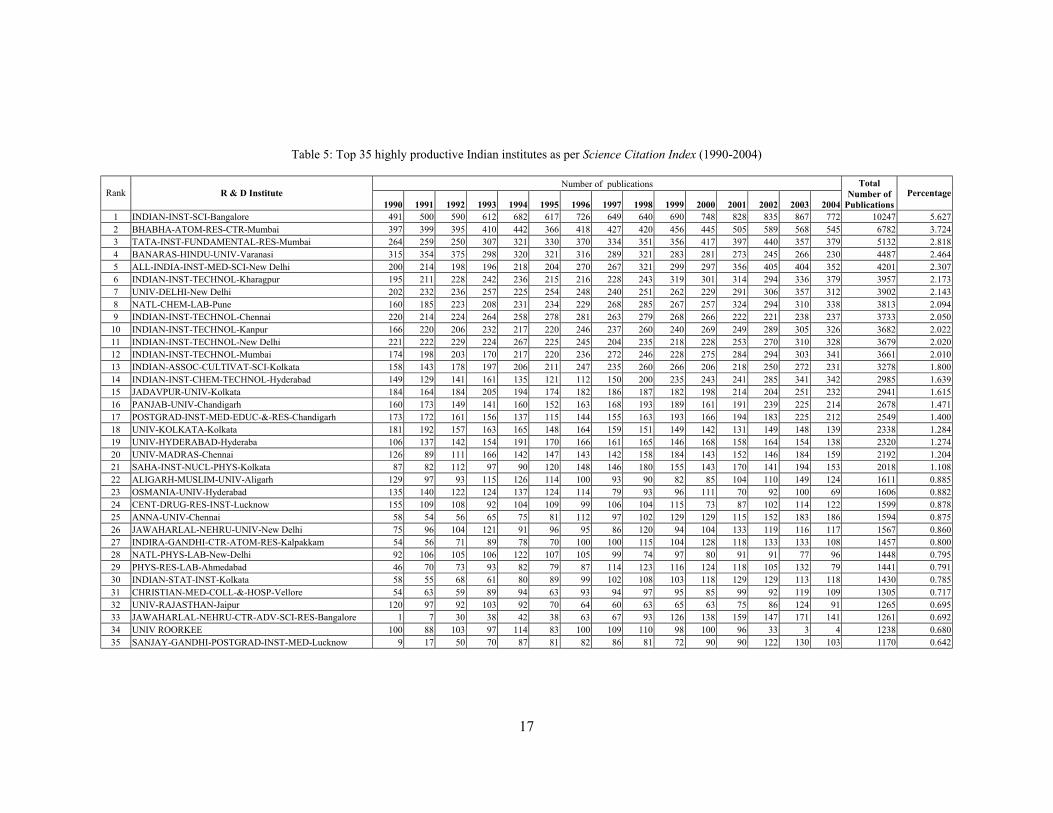
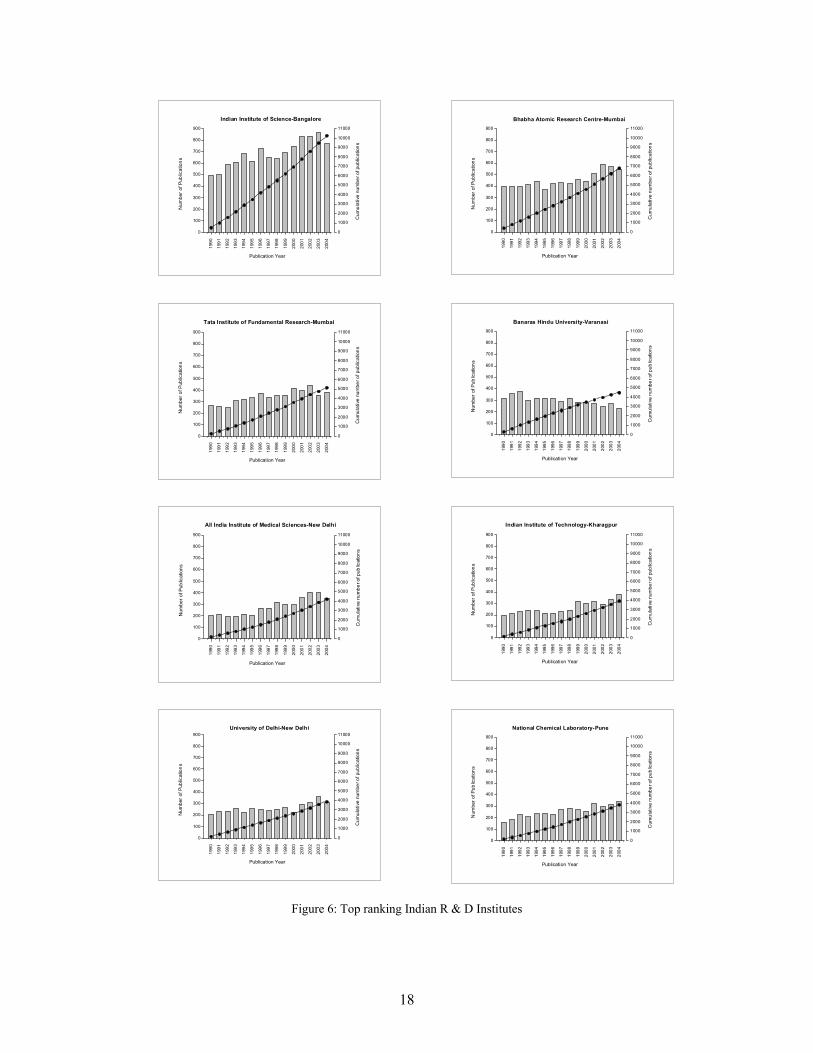
4.8 Highly productive Indian R & D institutions There were 11555 Indian research institutes, Universities and other research organizations involved in research and development activity. Table-5 shows the highly productive 35 Indian institutes publishing more than 1100 publications during 1990-2004. Indian Institute of Science, Bangalore topped the list with 10247 publications followed by Bhabha Atomic Research Centre, Mumbai with 6782 publications, Tata Institute of Fundamental Research, Mumbai with 5132 publications, Banaras Hindu University, Varanasi with 4487 publications. All India Institute of Medical Sciences, New Delhi with 4201 publications, Indian Institute of Technology, Kharagpur with 3957 publications, University of Delhi, New Delhi with 3902 and National Chemical Laboratory, Pune with 3813 publications. Figure-6 provides year-wise growth of publications of top eight Indian institutes.
17
Table 5: Top 35 highly productive Indian institutes as per Science Citation Index (1990-2004)
Number of publications Rank R & D Institute
1990 1991 1992 1993 1994 1995 1996 1997 1998 1999 2000 2001 2002 2003 2004
Total Number of
Publications Percentage
1 INDIAN-INST-SCI-Bangalore 491 500 590 612 682 617 726 649 640 690 748 828 835 867 772 10247 5.627 2 BHABHA-ATOM-RES-CTR-Mumbai 397 399 395 410 442 366 418 427 420 456 445 505 589 568 545 6782 3.724 3 TATA-INST-FUNDAMENTAL-RES-Mumbai 264 259 250 307 321 330 370 334 351 356 417 397 440 357 379 5132 2.818 4 BANARAS-HINDU-UNIV-Varanasi 315 354 375 298 320 321 316 289 321 283 281 273 245 266 230 4487 2.464 5 ALL-INDIA-INST-MED-SCI-New Delhi 200 214 198 196 218 204 270 267 321 299 297 356 405 404 352 4201 2.307 6 INDIAN-INST-TECHNOL-Kharagpur 195 211 228 242 236 215 216 228 243 319 301 314 294 336 379 3957 2.173 7 UNIV-DELHI-New Delhi 202 232 236 257 225 254 248 240 251 262 229 291 306 357 312 3902 2.143 8 NATL-CHEM-LAB-Pune 160 185 223 208 231 234 229 268 285 267 257 324 294 310 338 3813 2.094 9 INDIAN-INST-TECHNOL-Chennai 220 214 224 264 258 278 281 263 279 268 266 222 221 238 237 3733 2.050
10 INDIAN-INST-TECHNOL-Kanpur 166 220 206 232 217 220 246 237 260 240 269 249 289 305 326 3682 2.022 11 INDIAN-INST-TECHNOL-New Delhi 221 222 229 224 267 225 245 204 235 218 228 253 270 310 328 3679 2.020 12 INDIAN-INST-TECHNOL-Mumbai 174 198 203 170 217 220 236 272 246 228 275 284 294 303 341 3661 2.010 13 INDIAN-ASSOC-CULTIVAT-SCI-Kolkata 158 143 178 197 206 211 247 235 260 266 206 218 250 272 231 3278 1.800 14 INDIAN-INST-CHEM-TECHNOL-Hyderabad 149 129 141 161 135 121 112 150 200 235 243 241 285 341 342 2985 1.639 15 JADAVPUR-UNIV-Kolkata 184 164 184 205 194 174 182 186 187 182 198 214 204 251 232 2941 1.615 16 PANJAB-UNIV-Chandigarh 160 173 149 141 160 152 163 168 193 189 161 191 239 225 214 2678 1.471 17 POSTGRAD-INST-MED-EDUC-&-RES-Chandigarh 173 172 161 156 137 115 144 155 163 193 166 194 183 225 212 2549 1.400 18 UNIV-KOLKATA-Kolkata 181 192 157 163 165 148 164 159 151 149 142 131 149 148 139 2338 1.284 19 UNIV-HYDERABAD-Hyderaba 106 137 142 154 191 170 166 161 165 146 168 158 164 154 138 2320 1.274 20 UNIV-MADRAS-Chennai 126 89 111 166 142 147 143 142 158 184 143 152 146 184 159 2192 1.204 21 SAHA-INST-NUCL-PHYS-Kolkata 87 82 112 97 90 120 148 146 180 155 143 170 141 194 153 2018 1.108 22 ALIGARH-MUSLIM-UNIV-Aligarh 129 97 93 115 126 114 100 93 90 82 85 104 110 149 124 1611 0.885 23 OSMANIA-UNIV-Hyderabad 135 140 122 124 137 124 114 79 93 96 111 70 92 100 69 1606 0.882 24 CENT-DRUG-RES-INST-Lucknow 155 109 108 92 104 109 99 106 104 115 73 87 102 114 122 1599 0.878 25 ANNA-UNIV-Chennai 58 54 56 65 75 81 112 97 102 129 129 115 152 183 186 1594 0.875 26 JAWAHARLAL-NEHRU-UNIV-New Delhi 75 96 104 121 91 96 95 86 120 94 104 133 119 116 117 1567 0.860 27 INDIRA-GANDHI-CTR-ATOM-RES-Kalpakkam 54 56 71 89 78 70 100 100 115 104 128 118 133 133 108 1457 0.800 28 NATL-PHYS-LAB-New-Delhi 92 106 105 106 122 107 105 99 74 97 80 91 91 77 96 1448 0.795 29 PHYS-RES-LAB-Ahmedabad 46 70 73 93 82 79 87 114 123 116 124 118 105 132 79 1441 0.791 30 INDIAN-STAT-INST-Kolkata 58 55 68 61 80 89 99 102 108 103 118 129 129 113 118 1430 0.785 31 CHRISTIAN-MED-COLL-&-HOSP-Vellore 54 63 59 89 94 63 93 94 97 95 85 99 92 119 109 1305 0.717 32 UNIV-RAJASTHAN-Jaipur 120 97 92 103 92 70 64 60 63 65 63 75 86 124 91 1265 0.695 33 JAWAHARLAL-NEHRU-CTR-ADV-SCI-RES-Bangalore 1 7 30 38 42 38 63 67 93 126 138 159 147 171 141 1261 0.692 34 UNIV ROORKEE 100 88 103 97 114 83 100 109 110 98 100 96 33 3 4 1238 0.680 35 SANJAY-GANDHI-POSTGRAD-INST-MED-Lucknow 9 17 50 70 87 81 82 86 81 72 90 90 122 130 103 1170 0.642
18
Figure 6: Top ranking Indian R & D Institutes
1990
1991
1992
1993
1994
1995
1996
1997
1998
1999
2000
2001
2002
2003
2004
0
100
200
300
400
500
600
700
800
900
Indian Institute of Science-Bangalore
Cum
ulat
ive
num
ber o
f pub
licat
ions
Num
ber o
f Pub
licat
ions
Publication Year
0
1000
2000
3000
4000
5000
6000
7000
8000
9000
10000
11000
1990
1991
1992
1993
1994
1995
1996
1997
1998
1999
2000
2001
2002
2003
2004
0
100
200
300
400
500
600
700
800
900
Bhabha Atomic Research Centre-Mumbai
Cum
ulat
ive
num
ber o
f pub
licat
ions
Num
ber o
f Pub
licat
ions
Publication Year
0
1000
2000
3000
4000
5000
6000
7000
8000
9000
10000
11000
1990
1991
1992
1993
1994
1995
1996
1997
1998
1999
2000
2001
2002
2003
2004
0
100
200
300
400
500
600
700
800
900
All India Institute of Medical Sciences-New Delhi
Cum
ulat
ive
num
ber o
f pub
licat
ions
Num
ber o
f Pub
licat
ions
Publication Year
0
1000
2000
3000
4000
5000
6000
7000
8000
9000
10000
11000
1990
1991
1992
1993
1994
1995
1996
1997
1998
1999
2000
2001
2002
2003
2004
0
100
200
300
400
500
600
700
800
900
Tata Institute of Fundamental Research-Mumbai
Cum
ulat
ive
num
ber o
f pub
licat
ions
Num
ber o
f Pub
licat
ions
Publication Year
0
1000
2000
3000
4000
5000
6000
7000
8000
9000
10000
11000
1990
1991
1992
1993
1994
1995
1996
1997
1998
1999
2000
2001
2002
2003
2004
0
100
200
300
400
500
600
700
800
900University of Delhi-New Delhi
Cum
ulat
ive
num
ber o
f pub
licat
ions
Num
ber o
f Pub
licat
ions
Publication Year
0
1000
2000
3000
4000
5000
6000
7000
8000
9000
10000
11000
1990
1991
1992
1993
1994
1995
1996
1997
1998
1999
2000
2001
2002
2003
2004
0
100
200
300
400
500
600
700
800
900
Banaras Hindu University-Varanasi
Cum
ulat
ive
num
ber o
f pub
licat
ions
Num
ber o
f Pub
licat
ions
Publication Year
0
1000
2000
3000
4000
5000
6000
7000
8000
9000
10000
11000
1990
1991
1992
1993
1994
1995
1996
1997
1998
1999
2000
2001
2002
2003
2004
0
100
200
300
400
500
600
700
800
900
Indian Institute of Technology-Kharagpur
Cum
ulat
ive
num
ber o
f pub
licat
ions
Num
ber o
f Pub
licat
ions
Publication Year
0
1000
2000
3000
4000
5000
6000
7000
8000
9000
10000
11000
1990
1991
1992
1993
1994
1995
1996
1997
1998
1999
2000
2001
2002
2003
2004
0
100
200
300
400
500
600
700
800
900
National Chemical Laboratory-Pune
Cum
ulat
ive
num
ber o
f pub
licat
ions
Num
ber o
f Pub
licat
ions
Publication Year
0
1000
2000
3000
4000
5000
6000
7000
8000
9000
10000
11000
19
4.9 Language wise distribution of publications English has topped the list with 182017 (99.941%) publications, followed by French and Russian with 23 (0.126%) publications each, German with 21 (0.0115%) publications, and Chinese with 11 (0.0060%) publications. Indian scientists have contributed predominantly in English with a few exceptions. The publications in other foreign languages are mainly due to collaboration with respective foreign institutions.
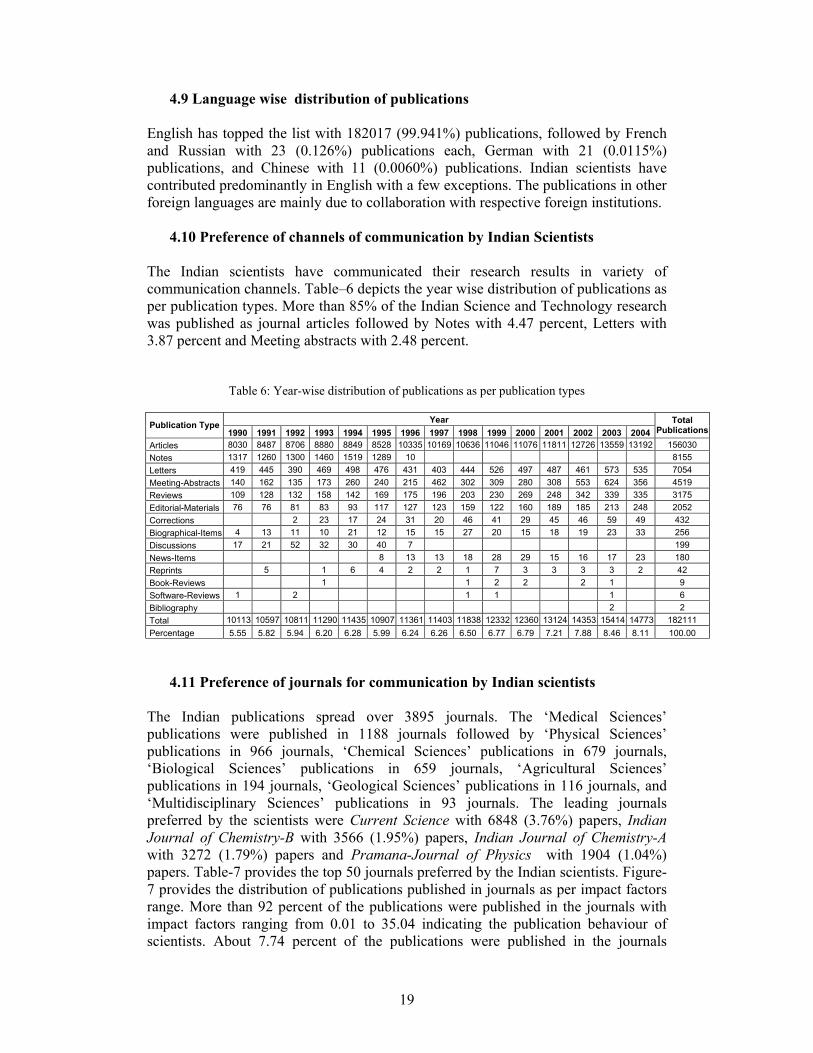
4.10 Preference of channels of communication by Indian Scientists The Indian scientists have communicated their research results in variety of communication channels. Table–6 depicts the year wise distribution of publications as per publication types. More than 85% of the Indian Science and Technology research was published as journal articles followed by Notes with 4.47 percent, Letters with 3.87 percent and Meeting abstracts with 2.48 percent.
Table 6: Year-wise distribution of publications as per publication types
Year Publication Type 1990 1991 1992 1993 1994 1995 1996 1997 1998 1999 2000 2001 2002 2003 2004
Total Publications
Articles 8030 8487 8706 8880 8849 8528 10335 10169 10636 11046 11076 11811 12726 13559 13192 156030 Notes 1317 1260 1300 1460 1519 1289 10 8155 Letters 419 445 390 469 498 476 431 403 444 526 497 487 461 573 535 7054 Meeting-Abstracts 140 162 135 173 260 240 215 462 302 309 280 308 553 624 356 4519 Reviews 109 128 132 158 142 169 175 196 203 230 269 248 342 339 335 3175 Editorial-Materials 76 76 81 83 93 117 127 123 159 122 160 189 185 213 248 2052 Corrections 2 23 17 24 31 20 46 41 29 45 46 59 49 432 Biographical-Items 4 13 11 10 21 12 15 15 27 20 15 18 19 23 33 256 Discussions 17 21 52 32 30 40 7 199 News-Items 8 13 13 18 28 29 15 16 17 23 180 Reprints 5 1 6 4 2 2 1 7 3 3 3 3 2 42 Book-Reviews 1 1 2 2 2 1 9 Software-Reviews 1 2 1 1 1 6 Bibliography 2 2 Total 10113 10597 10811 11290 11435 10907 11361 11403 11838 12332 12360 13124 14353 15414 14773 182111 Percentage 5.55 5.82 5.94 6.20 6.28 5.99 6.24 6.26 6.50 6.77 6.79 7.21 7.88 8.46 8.11 100.00
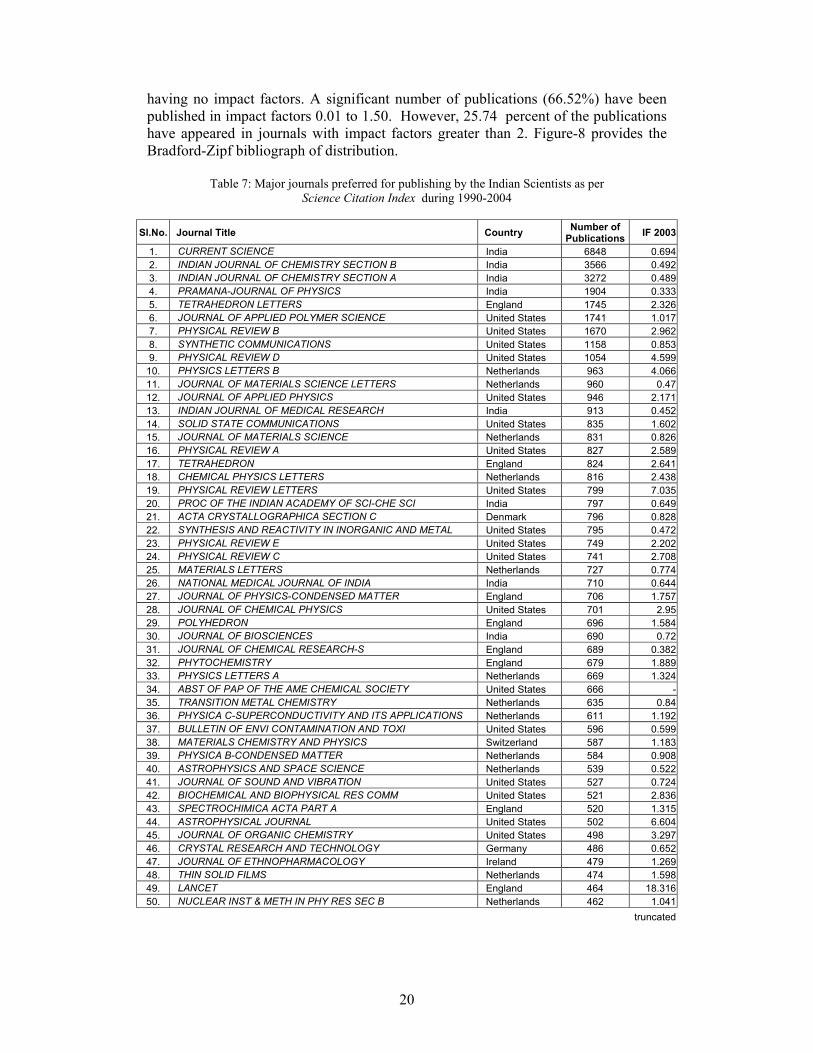
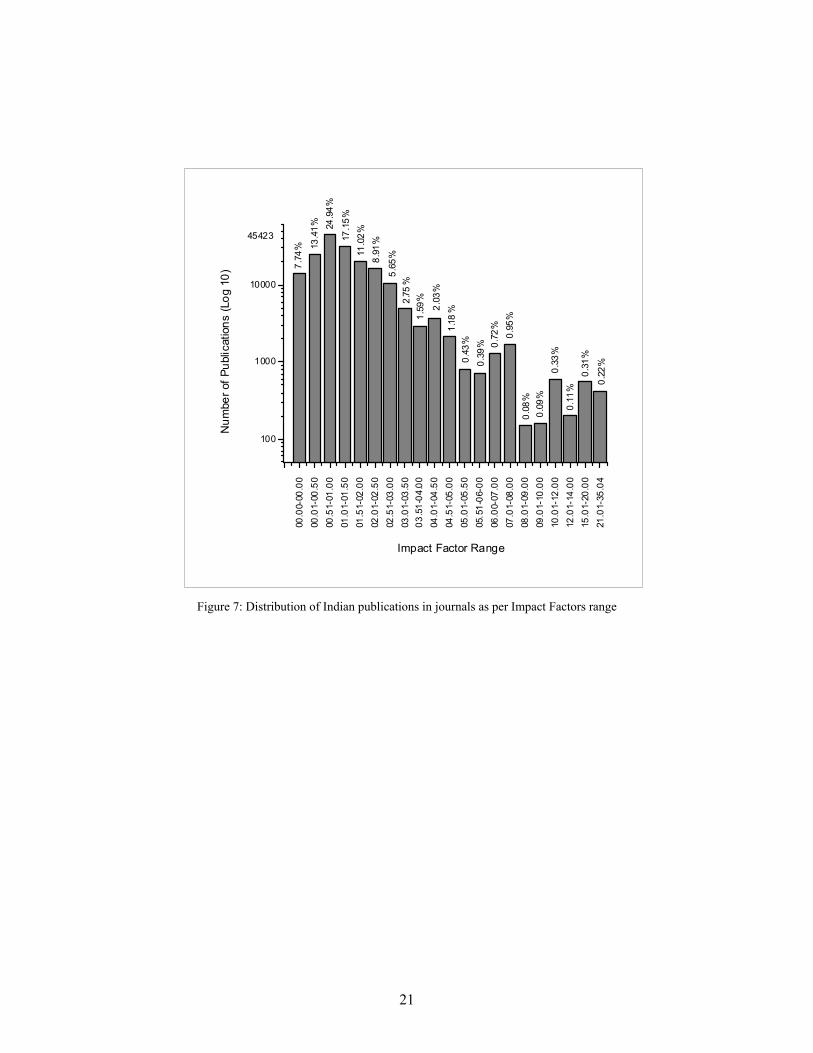
4.11 Preference of journals for communication by Indian scientists The Indian publications spread over 3895 journals. The ‘Medical Sciences’ publications were published in 1188 journals followed by ‘Physical Sciences’ publications in 966 journals, ‘Chemical Sciences’ publications in 679 journals, ‘Biological Sciences’ publications in 659 journals, ‘Agricultural Sciences’ publications in 194 journals, ‘Geological Sciences’ publications in 116 journals, and ‘Multidisciplinary Sciences’ publications in 93 journals. The leading journals preferred by the scientists were Current Science with 6848 (3.76%) papers, Indian Journal of Chemistry-B with 3566 (1.95%) papers, Indian Journal of Chemistry-A with 3272 (1.79%) papers and Pramana-Journal of Physics with 1904 (1.04%) papers. Table-7 provides the top 50 journals preferred by the Indian scientists. Figure-7 provides the distribution of publications published in journals as per impact factors range. More than 92 percent of the publications were published in the journals with impact factors ranging from 0.01 to 35.04 indicating the publication behaviour of scientists. About 7.74 percent of the publications were published in the journals
20
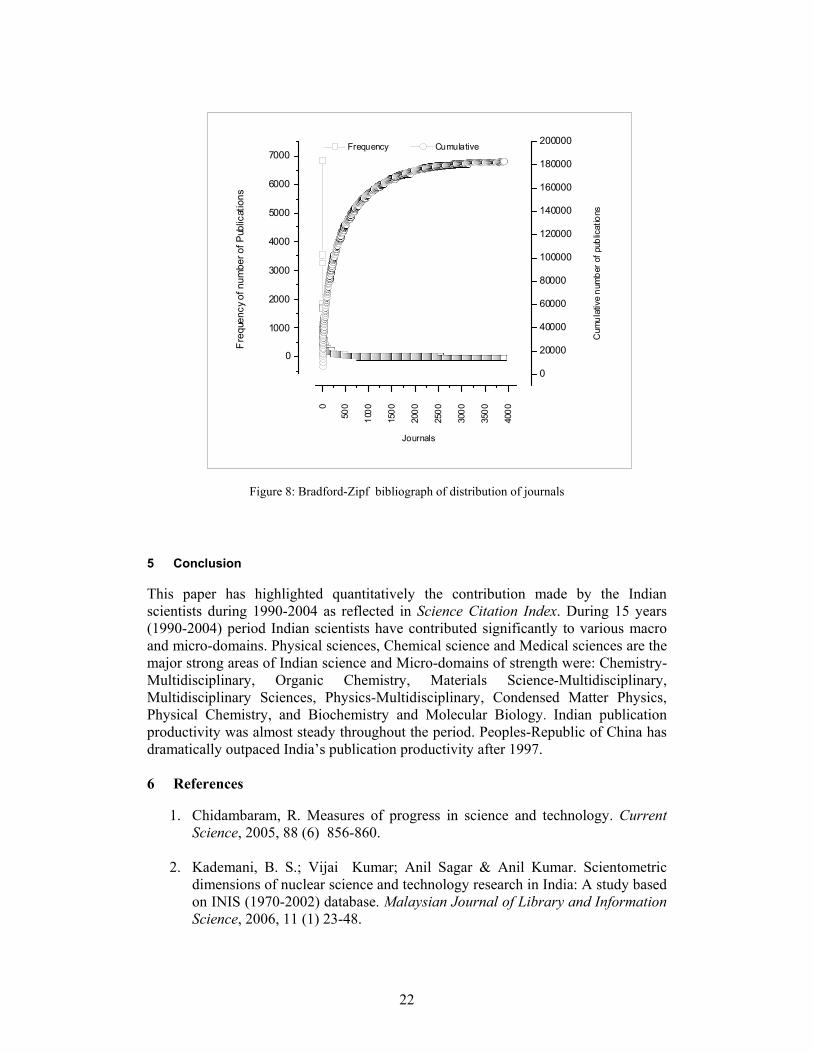
having no impact factors. A significant number of publications (66.52%) have been published in impact factors 0.01 to 1.50. However, 25.74 percent of the publications have appeared in journals with impact factors greater than 2. Figure-8 provides the Bradford-Zipf bibliograph of distribution.
Table 7: Major journals preferred for publishing by the Indian Scientists as per Science Citation Index during 1990-2004
Sl.No. Journal Title Country Number of
Publications IF 2003
1. CURRENT SCIENCE India 6848 0.694 2. INDIAN JOURNAL OF CHEMISTRY SECTION B India 3566 0.492 3. INDIAN JOURNAL OF CHEMISTRY SECTION A India 3272 0.489 4. PRAMANA-JOURNAL OF PHYSICS India 1904 0.333 5. TETRAHEDRON LETTERS England 1745 2.326 6. JOURNAL OF APPLIED POLYMER SCIENCE United States 1741 1.017 7. PHYSICAL REVIEW B United States 1670 2.962 8. SYNTHETIC COMMUNICATIONS United States 1158 0.853 9. PHYSICAL REVIEW D United States 1054 4.599
10. PHYSICS LETTERS B Netherlands 963 4.066 11. JOURNAL OF MATERIALS SCIENCE LETTERS Netherlands 960 0.47 12. JOURNAL OF APPLIED PHYSICS United States 946 2.171 13. INDIAN JOURNAL OF MEDICAL RESEARCH India 913 0.452 14. SOLID STATE COMMUNICATIONS United States 835 1.602 15. JOURNAL OF MATERIALS SCIENCE Netherlands 831 0.826 16. PHYSICAL REVIEW A United States 827 2.589 17. TETRAHEDRON England 824 2.641 18. CHEMICAL PHYSICS LETTERS Netherlands 816 2.438 19. PHYSICAL REVIEW LETTERS United States 799 7.035 20. PROC OF THE INDIAN ACADEMY OF SCI-CHE SCI India 797 0.649 21. ACTA CRYSTALLOGRAPHICA SECTION C Denmark 796 0.828 22. SYNTHESIS AND REACTIVITY IN INORGANIC AND METAL United States 795 0.472 23. PHYSICAL REVIEW E United States 749 2.202 24. PHYSICAL REVIEW C United States 741 2.708 25. MATERIALS LETTERS Netherlands 727 0.774 26. NATIONAL MEDICAL JOURNAL OF INDIA India 710 0.644 27. JOURNAL OF PHYSICS-CONDENSED MATTER England 706 1.757 28. JOURNAL OF CHEMICAL PHYSICS United States 701 2.95 29. POLYHEDRON England 696 1.584 30. JOURNAL OF BIOSCIENCES India 690 0.72 31. JOURNAL OF CHEMICAL RESEARCH-S England 689 0.382 32. PHYTOCHEMISTRY England 679 1.889 33. PHYSICS LETTERS A Netherlands 669 1.324 34. ABST OF PAP OF THE AME CHEMICAL SOCIETY United States 666 - 35. TRANSITION METAL CHEMISTRY Netherlands 635 0.84 36. PHYSICA C-SUPERCONDUCTIVITY AND ITS APPLICATIONS Netherlands 611 1.192 37. BULLETIN OF ENVI CONTAMINATION AND TOXI United States 596 0.599 38. MATERIALS CHEMISTRY AND PHYSICS Switzerland 587 1.183 39. PHYSICA B-CONDENSED MATTER Netherlands 584 0.908 40. ASTROPHYSICS AND SPACE SCIENCE Netherlands 539 0.522 41. JOURNAL OF SOUND AND VIBRATION United States 527 0.724 42. BIOCHEMICAL AND BIOPHYSICAL RES COMM United States 521 2.836 43. SPECTROCHIMICA ACTA PART A England 520 1.315 44. ASTROPHYSICAL JOURNAL United States 502 6.604 45. JOURNAL OF ORGANIC CHEMISTRY United States 498 3.297 46. CRYSTAL RESEARCH AND TECHNOLOGY Germany 486 0.652 47. JOURNAL OF ETHNOPHARMACOLOGY Ireland 479 1.269 48. THIN SOLID FILMS Netherlands 474 1.598 49. LANCET England 464 18.316 50. NUCLEAR INST & METH IN PHY RES SEC B Netherlands 462 1.041
truncated
21
Figure 7: Distribution of Indian publications in journals as per Impact Factors range
00.0
0-00
.00
00.0
1-00
.50
00.5
1-01
.00
01.0
1-01
.50
01.5
1-02
.00
02.0
1-02
.50
02.5
1-03
.00
03.0
1-03
.50
03.5
1-04
.00
04.0
1-04
.50
04.5
1-05
.00
05.0
1-05
.50
05.5
1-06
-00
06.0
0-07
.00
07.0
1-08
.00
08.0
1-09
.00
09.0
1-10
.00
10.0
1-12
.00
12.0
1-14
.00
15.0
1-20
.00
21.0
1-35
.04
100
1000
10000
0.22
%
0.31
%0.
11%
0.33
%0.
09%
0.08
%
0.95
%0.
72%
0.39
%0.
43%
1.18
%2.03
%
1.59
%2.75
%5.
65%8.91
%11
.02%17
.15%24.9
4%13
.41%
7.74
%
45423N
umbe
r of P
ublic
atio
ns (L
og 1
0)
Impact Factor Range
22
Figure 8: Bradford-Zipf bibliograph of distribution of journals 5 Conclusion This paper has highlighted quantitatively the contribution made by the Indian scientists during 1990-2004 as reflected in Science Citation Index. During 15 years (1990-2004) period Indian scientists have contributed significantly to various macro and micro-domains. Physical sciences, Chemical science and Medical sciences are the major strong areas of Indian science and Micro-domains of strength were: Chemistry-Multidisciplinary, Organic Chemistry, Materials Science-Multidisciplinary, Multidisciplinary Sciences, Physics-Multidisciplinary, Condensed Matter Physics, Physical Chemistry, and Biochemistry and Molecular Biology. Indian publication productivity was almost steady throughout the period. Peoples-Republic of China has dramatically outpaced India’s publication productivity after 1997. 6 References
1. Chidambaram, R. Measures of progress in science and technology. Current Science, 2005, 88 (6) 856-860.
2. Kademani, B. S.; Vijai Kumar; Anil Sagar & Anil Kumar. Scientometric
dimensions of nuclear science and technology research in India: A study based on INIS (1970-2002) database. Malaysian Journal of Library and Information Science, 2006, 11 (1) 23-48.
-500 0
500
1000
1500
2000
2500
3000
3500
4000
4500
-1000
0
1000
2000
3000
4000
5000
6000
7000
Cum
ulat
ive
num
ber o
f pub
licat
ions
Freq
uenc
y of n
umbe
r of P
ublic
atio
ns
Journals
Frequency
0
20000
40000
60000
80000
100000
120000
140000
160000
180000
200000 Cumulative
23
3. Kademani, B. S.; Vijai Kumar; Anil Sagar; Anil Kumar; Lalit Mohan & Surwase, G. Scientometric dimensions of thorium research in India. DESIDOC Bulletin, 2006, 26 (3) 9-25.
4. Kademani, B. S.; Vijai Kumar; Anil Sagar & Anil Kumar. World literature on
thorium research: A study based on Science Citation Index, Scientometrics, 2006, 29 (2) 347-364.
5. Garg, K. C. & Dutt, B. Bibliometrics of Indian science as reflected through
Science Ctation Index, Journal of Scientific & Industrial Research, 1992, 51 (4) 329-340.
6. Karki, M. M. S. Environmental science research in India: An analysis of
publications, Scientometrics, 1990, 18 (5-6) 363 –373. 7. Verma, R. K.; Sharma, Y. K. & Khatri, H. S. D. Trends in nuclear research
and its publications: An analysis based on five years coverage in the Indian Science Abstracts, Annals of Library Science and Documentation, 1982, 29 (2) 64-69.
8. Gupta, B.M.; Bose, P. R. & Rangarajan, K. S. Physics research in India: A
birds eye view, Physics News, 1980, 11 (2) 1-8.
9. Guay, Y. Emergence of basic research on the periphery: Organic chemistry in India, 1907-1926. Scientometrics, 1986, 10 (1-2) 77-94.
10. Mendez, A. & Gomez, I. The Spanish scientific productivity through eight
international databases. Scientometrics, 1986, 10 (3-4) 207-219. 11. Frame, J. D. & Narin, F. The growth of Chinese scientific research.
Scientometrics, 1987, 12 (1-2) 135-144.
12. Arunachalam, S.; Singh, U. N. & Sinha, R. The sleeping dragon wakes up: A scientometric analysis of the growth of science and the usage of journals in China.Current Science, 1993, 65 (11) 809-822.
13. Holmgren, M. & Schnitzer, S. A.. Science on the rise in developing countries.
PloS Biology, 2004, 2 (1) 10-13.