A REFERENCE FOR GEOPHYSICAL TECHNIQUES AND …€¦ · STATS Geophysical Porterswood House Porters...
48
A REFERENCE FOR GEOPHYSICAL TECHNIQUES AND APPLICATIONS GEOPHYSICAL
Transcript of A REFERENCE FOR GEOPHYSICAL TECHNIQUES AND …€¦ · STATS Geophysical Porterswood House Porters...

%NRENOENRENRAPPOR
A REFERENCE FOR GEOPHYSICAL
TECHNIQUES AND APPLICATIONS
GEOPHYSICAL
STATS GeophysicalPorterswood House
Porters WoodSt Albans, Herts
AL3 6PQ
CONTENTS
Introduction
Geophysical Techniques and Equipment
Geophysical Applications
Glossary
Index
Ground Penetrating Radar (GPR)
Electromagnetic (EM) Ground Conductivity
Electrical Resistivity Imaging
Induced Polarisation (IP) Imaging
Self Potential (SP) Imaging
Magnetics
Microgravity
Seismic Refraction
Seismic Surface Wave (Ground Stiffness Measurement)
Seismic Reflection
Brownfield Sites
Landfill Sites
Contaminated Land
Geology
Voids and Soft Ground
Structural
Historic Buildings
Borehole Geophysics
Services and Utility Tracing
Archaeology
Page
2
6
8
10
12
14
16
17
18
20
22
24
26
28
30
32
34
36
38
40
42
44
46
Page 1
GEOPHYSICAL
STATS GeophysicalPorterswood House
Porters WoodSt Albans, Herts
AL3 6PQ
INTRODUCTION
To discuss the benefits of a well designed and executed geophysical survey contact STATS Geophysical.We can discuss in We are happy to advise on principles and
techniques, and provide courses and seminars on geophysical theory and applications.general terms, or for a specific site.
Page 2
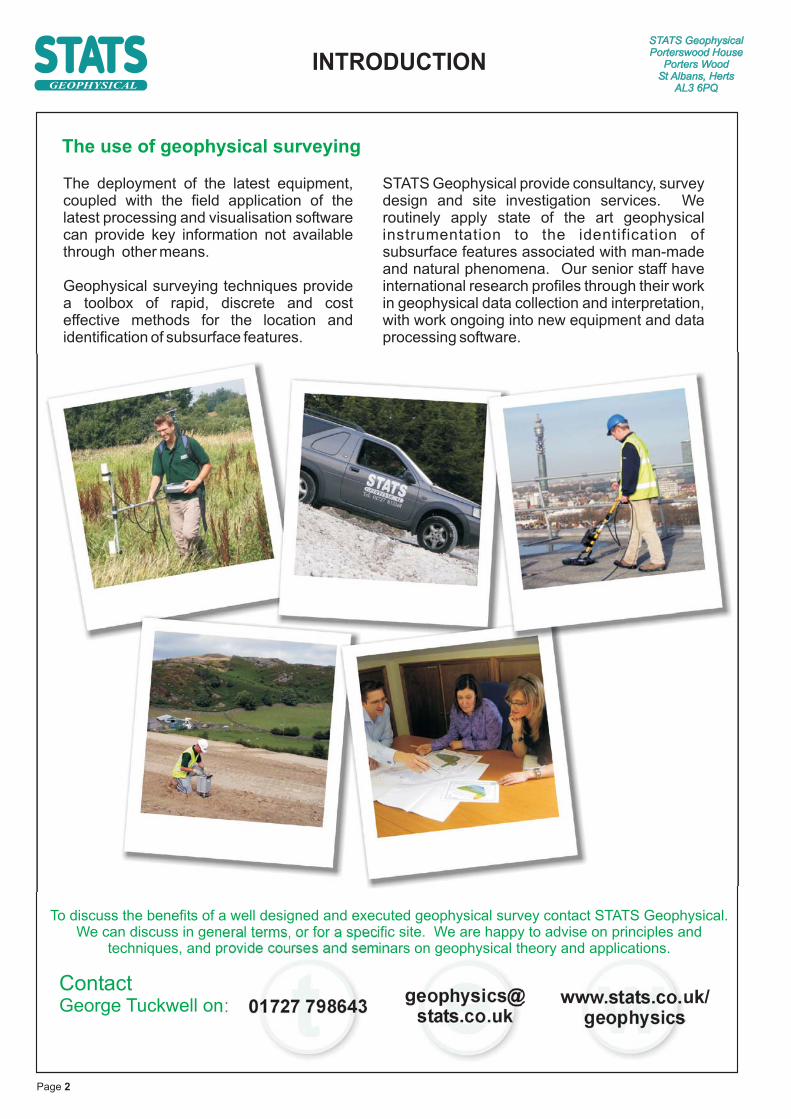
The deployment of the latest equipment,coupled with the field application of thelatest processing and visualisation softwarecan provide key information not availablethrough other means.
Geophysical surveying techniques providea toolbox of rapid, discrete and costeffective methods for the location andidentification of subsurface features.
STATS Geophysical provide consultancy, surveydesign and site investigation services. Weroutinely apply state of the art geophysicalinstrumentation to the identification ofsubsurface features associated with man-madeand natural phenomena. Our senior staff haveinternational research profiles through their workin geophysical data collection and interpretation,with work ongoing into new equipment and dataprocessing software.
The use of geophysical surveying
GEOPHYSICAL
ContactGeorge Tuckwell on: www.stats.co.uk/
geophysics01727 798643

STATS GeophysicalPorterswood House
Porters WoodSt Albans, Herts
AL3 6PQ
Page 3
Geophysical techniques
Geophysical surveying may be used to pinpoint locations within a site totarget with conventional intrusive investigation, but by the same tokenmay be deployed to eliminate the need for the disruption caused byboreholes, trial pits, cores or breakouts.
In each case the appropriate geophysical technique must be used in thecorrect survey manner in order to maximise the ability of the survey toyield clear results. Surveys should be designed and undertaken byqualified and experienced geophysical professionals, and should makefull use of available instrumentation and software to provide the bestpossible interpretation in a timely and efficient manner.
Rapid data collection
Deploying the latest survey equipment and software tosite can minimise the time from arrival on site to thevisualisation of survey data. Careful survey design,tailored to the target and to the environment, can avoidthe collection of unnecessary data, and can alsoprevent inconclusive or misleading interpretations.
Data processing and reporting
Data should be quality checked on site as part of the datacollection methodology, and also checked at the end ofeach site visit by the lead geophysicist. Often initialindications from the raw un-processed data can inform theongoing data collection phase of the project. In somecases data can be transmitted back to the office to providethe client with early interpretations.
The collection of good field data is only half of the picture.Careful processing of the data must be undertaken by anexperienced geophysicist in order to produce accurateinterpretations, and in order to avoid the misinterpretationof spurious signals in the data. It can take several days toprocess the data collected during one day in the field.
In every case the objective is to integrate the geophysicaldata intelligently with all other relevant site information, andproduce an accurate interpretation that providesinformation that the client needs.
GEOPHYSICAL
Data Collection and Visualisation
The latest data interpretation and visualisationsoftware can be used in real time in the field. Whencoupled with the use of differential GPS for datalocation, delivering positional accuracy better than0.25m, the software can eliminate the need to breakthe survey down into a number of rectilinear sub-areas, further improving the efficiency of data
Integrated Surveys
Multiple geophysical data types can all be collected inthis manner at walking pace, or at greater speeds iftowed on a mobile instrument platform. In many casesthe collection of more than one type of geophysicaldata provides significantly more information than asingle survey, therefore the rapid and efficientcollection of data is imperative.
Read more about the various geophysicaltechniques in the following chapter.
INTRODUCTION
STATS staff possess both commercial and researchexperience in geophysical data processing

Page 4

Page 5
GEOPHYSICAL
GEOPHYSICAL
TECHNIQUES AND
EQUIPMENT

GROUND PENETRATING RADAR
STATS GeophysicalPorterswood House
Porters WoodSt Albans, Herts
AL3 6PQ
In this GPR study of contaminated land ( ), the location of aburied underground storage tank (UST) is clearly identified by acharacteristic high amplitude reflection (top of which is labelled ).The strong negative amplitude suggests that the tank is air-filled.
above
A
In Ground Penetrating Radar (GPR) surveys,electromagnetic waves of frequencies between50MHz and 2.5GHz are transmitted into the ground ora structure. This energy is reflected back to thesurface when it encounters significant contrasts indielectric properties.
The receiver measures the variation in the strength ofthe reflected signals with time. The resulting profile iscalled a 'scan' and is a one-dimensionalrepresentation of the subsurface beneath theantenna. To build up a two dimensional section of thesubsurface (a radargram), the antenna is traversedacross the surface to collect a number of adjacentscans. Conversions to depth sections may be madeproviding there is sufficient information regarding thedielectric properties of the material(s) surveyed.
A radio wave transmitter (T ) located at the surface is
used to generate a short (<20ns) pulse of radio waveswhich penetrate into the subsurface. Some of theenergy carried by these waves is transmitted togreater and greater depths, while some of the energyis reflected back towards the surface receiver (R )
whenever a contrast in dielectric properties isencountered. The amount of energy reflected isdependent on the contrast in electrical propertiesencountered by the radio waves.
Data can be processed and presented as individualradargrams (see ). These are essentially two-dimensional cross sections of the sub surface. Modernsoftware now enables stacking of adjacent radargramsand the construction of three-dimensional data cubes.Horizontal slices (or “time slices”) through the data atthe desired depth enables visualisation of the reflectionstrength across the survey area. This is an invaluableapproach in the detection and tracing of linear targets(e.g pipes and walls) and complex three dimensionalburied structures.
X
Xbelow
Basic Theory
Applications�
�
�
�
�
�
�
�
Construction details (e.g., location of buried foundations and basements, slab thickness, rebarplacement, void detection, locating beams, bridge deck surveys, floor surveys)Depth to bedrockDepth to water tableLocating fractures, sinkholes or cave systemsLocating underground storage tanks and buried drumsArchaeology (e.g., location of graves and artifacts)Mapping and monitoring groundwater pollutionLocating below ground services
Reflected signalTransmitted signal
GEOPHYSICAL
STATS Geophysical own a range of GPR antennae of differentfrequencies ( ). The versatility of GPR means that theradar antennae can be handheld, pushed on a cart or pulledacross the ground. The type of GPR equipment is selecteddepending on the target object and site conditions.
above
Page 6
2m
Depth
(m)
Direction of Data Collection
Groundsurface
A
Tx Rx
Radar antennae
STATS GeophysicalPorterswood House
Porters WoodSt Albans, Herts
AL3 6PQ
GROUND PENETRATING RADAR
Data Examples
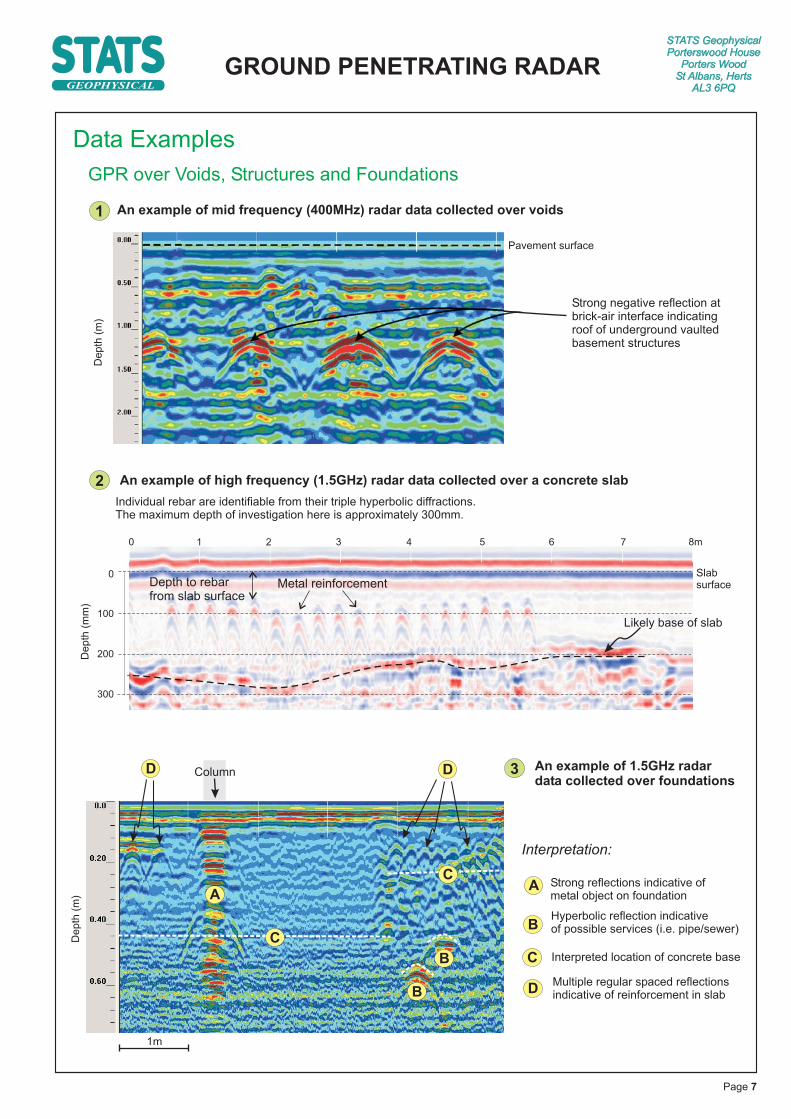
An example of 1.5GHz radardata collected over foundations
An example of high frequency (1.5GHz) radar data collected over a concrete slab
Individual rebar are identifiable from their triple hyperbolic diffractions.The maximum depth of investigation here is approximately 300mm.
9
0 1 2 3 4 5 6 7 8m
0
100
200
300
Metal reinforcementDepth to rebarfrom slab surface
Depth
(mm
)
1m
Multiple regular spaced reflectionsindicative of reinforcement in slab
Interpreted location of concrete base
Hyperbolic reflection indicativeof possible services (i.e. pipe/sewer)
GPR over Voids, Structures and Foundations
An example of mid frequency (400MHz) radar data collected over voids
GEOPHYSICAL
Depth
(m)
Depth
(m)
Likely base of slab
Page 7
Pavement surface
Strong negative reflection atbrick-air interface indicatingroof of underground vaultedbasement structures
A
1
2
Slabsurface
3
Interpretation:
C
B
B
B
C
DD
C
D
AStrong reflections indicative ofmetal object on foundation
Column

STATS GeophysicalPorterswood House
Porters WoodSt Albans, Herts
AL3 6PQ
EM GROUND CONDUCTIVITY
�
�
�
�
�
�
Mapping leachate migrationDetermination of layer thickness andconductivitiesMapping buried utilitiesMapping water filled fractures and fissuresMapping near surface chemical contaminationAssessment of ground remediation
Conductor
Receiver
Eddy currents
Groundsurface
Primary field
Secondary field
Transmitter
Basic Theory
Applications
�
�
�
�
�
�
Locating sinkholes and sub-surface voidsMapping and monitoring groundwater pollutionMapping saline intrusionsLocating underground storage tanks & buried drumsMapping buried foundationsLocating the boundaries of landfills
GEOPHYSICAL
In electromagnetic (EM) surveying, the electricalconductivity of the ground is measured as a functionof depth and/or horizontal distance. Different rocks(and buried structures/objects) exhibit differentvalues of electrical conductivity. Mapping variationsin electrical conductivity can identify anomalousareas worthy of further geophysical or intrusiveinvestigation.
The electromagnetic method is based on theinduction of electric currents in the ground by themagnetic component of electromagnetic wavesgenerated at the surface.
An alternating current, of variable frequency, ispassed through a coil of wire (a transmitter coil). Thisprocess generates an alternating primary magneticfield which, in turn, induces very small eddy currentsin the earth, the magnitude of which is directlyproportional to the ground conductivity in the vicinityof the coil. These eddy currents then generate asecondary magnetic field, a part of which isintercepted by a receiver coil. The interactionbetween the primary and secondary magnetic fluxand the receiver coil generates a voltage that isrelated to the electrical conductivity of the subsurface,expressed as milliSiemen/metre (mS/m).
The EM-31 instrument shown uses transmitterand receiver coils at either end of the boom.No electrodes or ground contact is necessary.
above
Page 8
As shown , for the collection of data over largersites the Geophysical Equipment Exploration Platform(GEEP), developed at the University of Leicester inpartnership with Geomatrix Ltd can be deployed bySTATS. The platform provides a means of quickly andefficiently collecting densely sampled high quality datafrom EM and magnetic instruments simultaneously.
below
Rapid data collection
STATS GeophysicalPorterswood House
Porters WoodSt Albans, Herts
AL3 6PQ
Data Examples
EM GROUND CONDUCTIVITY
Delineating Landfill Boundaries
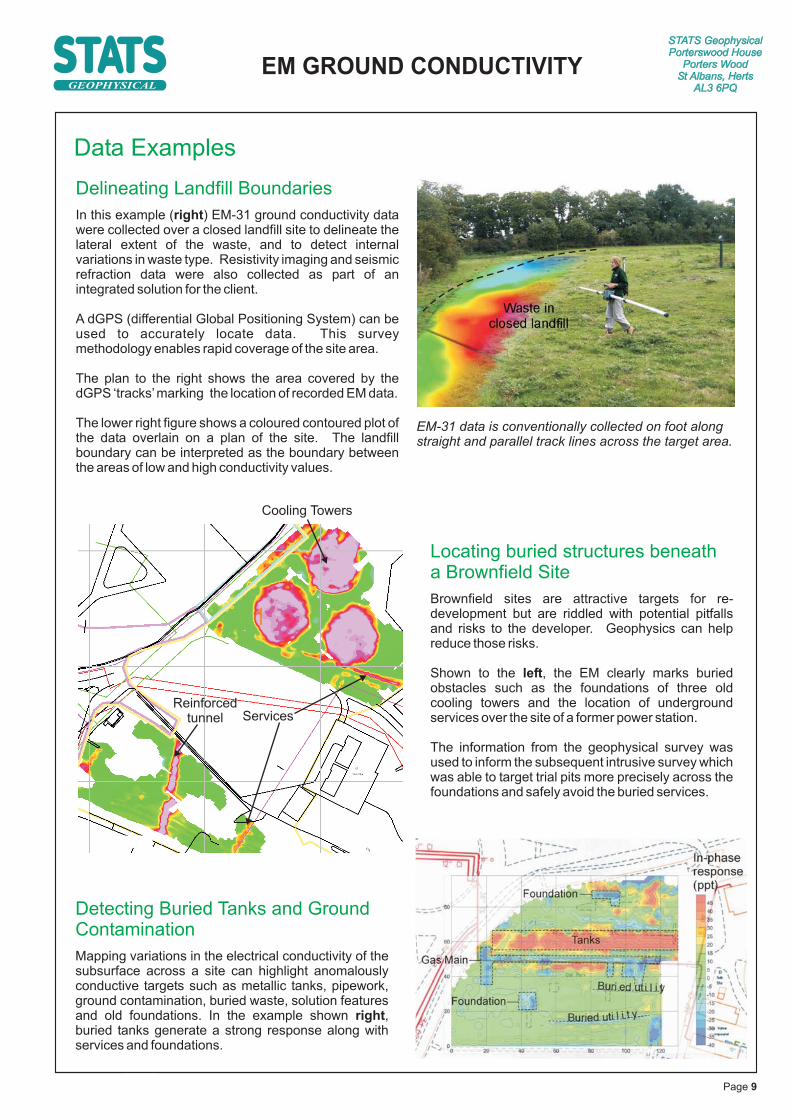
In this example ( ) EM-31 ground conductivity datawere collected over a closed landfill site to delineate thelateral extent of the waste, and to detect internalvariations in waste type. Resistivity imaging and seismicrefraction data were also collected as part of anintegrated solution for the client.
A dGPS (differential Global Positioning System) can beused to accurately locate data. This surveymethodology enables rapid coverage of the site area.
The plan to the right shows the area covered by thedGPS ‘tracks’marking the location of recorded EM data.
The lower right figure shows a coloured contoured plot ofthe data overlain on a plan of the site. The landfillboundary can be interpreted as the boundary betweenthe areas of low and high conductivity values.
right
Locating buried structures beneatha Brownfield Site
Brownfield sites are attractive targets for re-development but are riddled with potential pitfallsand risks to the developer. Geophysics can helpreduce those risks.
Shown to the , the EM clearly marks buriedobstacles such as the foundations of three oldcooling towers and the location of undergroundservices over the site of a former power station.
The information from the geophysical survey wasused to inform the subsequent intrusive survey whichwas able to target trial pits more precisely across thefoundations and safely avoid the buried services.
left
EM-31 data is conventionally collected on foot alongstraight and parallel track lines across the target area.
Services
Cooling Towers
GEOPHYSICAL
Reinforcedtunnel
Waste inclosed landfill
Page 9
Detecting Buried Tanks and GroundContamination
Mapping variations in the electricalacross a site can highlight anomalously
conductive targets such as metallic tanks, pipework,ground contamination, buried waste, solution featuresand old foundations. In the example shown ,buried tanks generate a strong response along withservices and foundations.
conductivity of thesubsurface
right
STATS GeophysicalPorterswood House
Porters WoodSt Albans, Herts
AL3 6PQ
ELECTRICAL RESISTIVITY IMAGING
�
�
�
�
�
�
�
�
Mapping buried dykes and other ore bodiesLocating fissures, faults and mineshaftsLandslide assessmentsBuried foundation mappingTime-lapse infiltration studiesCross-borehole tomographyAssessment of aquifer heterogeneitySoil corrosivity assessment
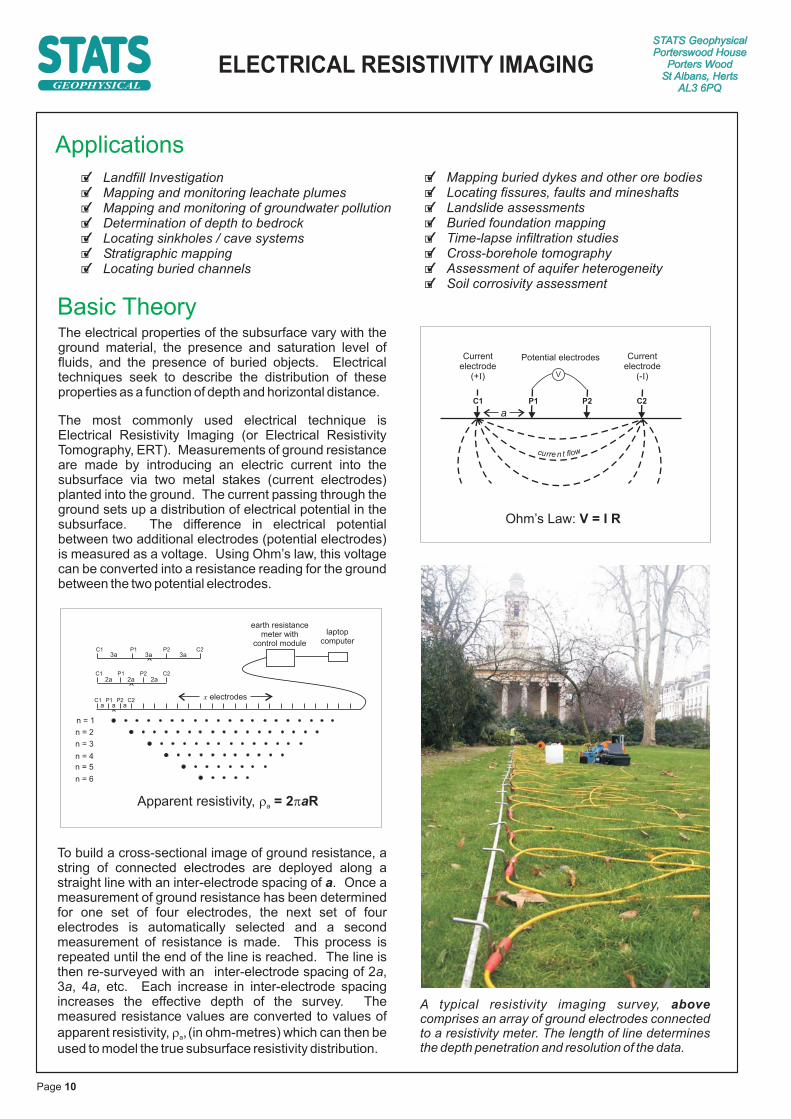
To build a cross-sectional image of ground resistance, astring of connected electrodes are deployed along astraight line with an inter-electrode spacing of . Once ameasurement of ground resistance has been determinedfor one set of four electrodes, the next set of fourelectrodes is automatically selected and a secondmeasurement of resistance is made. This process isrepeated until the end of the line is reached. The line isthen re-surveyed with an inter-electrode spacing of 2 ,3 , 4 , etc. Each increase in inter-electrode spacingincreases the effective depth of the survey. Themeasured resistance values are converted to valu of
apparent resistivity, (in ohm-metres) which can then be
used to model the true subsurface resistivity distribution.
a
aa a
�a,
es
The electrical properties of the subsurface vary with theground material, the presence and saturation level offluids, and the presence of buried objects. Electricaltechniques seek to describe the distribution of theseproperties as a function of depth and horizontal distance.
The most commonly used electrical technique isElectrical Resistivity Imaging (or Electrical ResistivityTomography, ERT). Measurements of ground resistanceare made by introducing an electric current into thesubsurface via two metal stakes (current electrodes)planted into the ground. The current passing through theground sets up a distribution of electrical potential in thesubsurface. The difference in electrical potentialbetween two additional electrodes (potential electrodes)is measured as a voltage. Using Ohm’s law, this voltagecan be converted into a resistance reading for the groundbetween the two potential electrodes.
Currentelectrode
(+ )I
Potential electrodes Currentelectrode
(- )IV
C1 P1 P2 C2
a
curre n t flow
Ohm’s Law: V = I R
n = 1
n = 2
n = 3
n = 4
n = 5
n = 6
x electrodes
earth resistancemeter with
control module
laptopcomputer
aC1
C1
C1
P1
P1
P1
P2
P2
P2
C2
C2
C2
2a 2a 2a
3a 3a 3a
a a
Apparent resistivity, � �a = 2 Ra
Basic Theory
Applications
�
�
�
�
�
�
�
Landfill InvestigationMapping and monitoring leachate plumesMapping and monitoring of groundwater pollutionDetermination of depth to bedrockLocating sinkholes / cave systemsStratigraphic mappingLocating buried channels
GEOPHYSICAL
Page 10
A typical resistivity imaging survey,comprises an array of ground electrodes connectedto a resistivity meter. The length of line determinesthe depth penetration and resolution of the data.
above

STATS GeophysicalPorterswood House
Porters WoodSt Albans, Herts
AL3 6PQ
ELECTRICAL RESISTIVITY IMAGING
A
B
C
12
3
4
6
7
5
Collation and integration of resistivity imaging data
Paral le l res is t iv i ty l inescollected with a minimumelectrode spacing of 2m.
Collation of all resistivity lines overlainby a colour contour plot of conductivity(collected using an EM31 instrument)draped over accurately surveyedtopography data.
Data Examples
GEOPHYSICAL
A
B
C
Areas of fill
Page 11
Below is an example of a survey carried out over alarge waste site. A number of resistivity lines werecollected in two orientations. During processing theyhave been corrected to allow for the topography of thesurface, and have been combined in 3D fencediagrams to aid interpretation.
Within the same workflow it is possible to integrate othergeophysical data sets and site observations, and overlaythem to scale on a base map of the survey area. Thisintegrated approach produces the best interpretation ofa multi-method geophysical survey, and provides high-quality interpretative drawings for the client.
Para l le l res is t i v i ty l inescollected with a minimumelectrode spacing of 5m.
Clay
Depth
(m)
Below is an example of a survey undertaken across aclosed landfill site. The data provided information to theclient on the thickness and extent of waste in the landfill.
London Clay
Undisturbed groundDomestic waste
LOW RESISTIVITY
MODERATE RESISTIVITYHIGH RESISTIVITY
London Clay
Undisturbed ground(sand and gravel)
Domestic waste
Delineating landfill extent and geometry
STATS GeophysicalPorterswood House
Porters WoodSt Albans, Herts
AL3 6PQ
INDUCED POLARISATION IMAGING
Clay
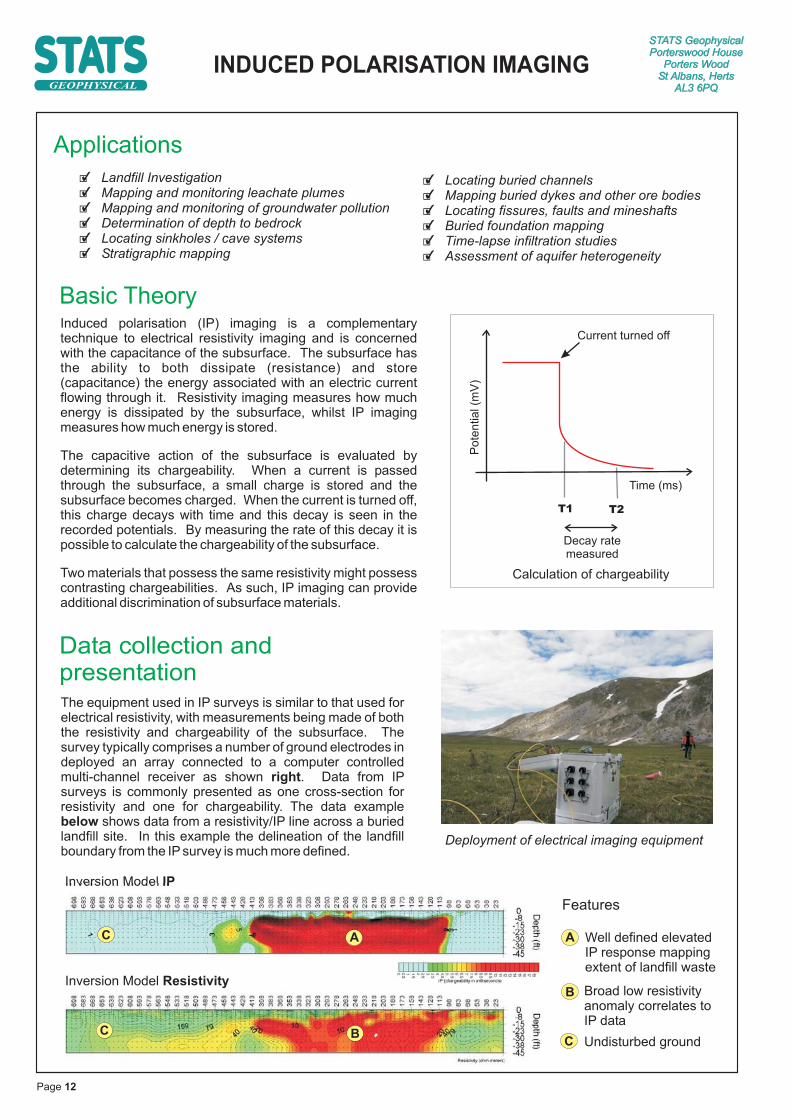
Time (ms)P
ote
ntia
l(m
V)
T1 T2
Decay ratemeasured
Current turned off
Calculation of chargeability
The equipment used in IP surveys is similar to that used forelectrical resistivity, with measurements being made of boththe resistivity and chargeability of the subsurface. Thesurvey typically comprises a number of ground electrodes indeployed an array connected to a computer controlledmulti-channel receiver as shown . Data from IPsurveys is commonly presented as one cross-section forresistivity and one for chargeability. The data example
shows data from a resistivity/IP line across a buriedlandfill site. In this example the delineation of the landfillboundary from the IP survey is much more defined.
right
below
Data collection andpresentation
Induced polarisation (IP) imaging is a complementarytechnique to electrical resistivity imaging and is concernedwith the capacitance of the subsurface. The subsurface hasthe ability to both dissipate (resistance) and store(capacitance) the energy associated with an electric currentflowing through it. Resistivity imaging measures how muchenergy is dissipated by the subsurface, whilst IP imagingmeasures how much energy is stored.
Two materials that possess the same resistivity might possesscontrasting chargeabilities. As such, IP imaging can provideadditional discrimination of subsurface materials.
The capacitive action of the subsurface is evaluated bydetermining its chargeability. When a current is passedthrough the subsurface, a small charge is stored and thesubsurface becomes charged. When the current is turned off,this charge decays with time and this decay is seen in therecorded potentials. By measuring the rate of this decay it ispossible to calculate the chargeability of the subsurface.
Basic Theory
GEOPHYSICAL
�
�
�
�
�
�
Locating buried channelsMapping buried dykes and other ore bodiesLocating fissures, faults and mineshaftsBuried foundation mappingTime-lapse infiltration studiesAssessment of aquifer heterogeneity
Applications
�
�
�
�
�
�
Landfill InvestigationMapping and monitoring leachate plumesMapping and monitoring of groundwater pollutionDetermination of depth to bedrockLocating sinkholes / cave systemsStratigraphic mapping
Page 12
Inversion Model IP
Features
A
B
C
Deployment of electrical imaging equipment
Well defined elevatedIP response mappingextent of landfill waste
Broad low resistivityanomaly correlates toIP data
Undisturbed ground
Inversion Model Resistivity
A
B
C
C
STATS GeophysicalPorterswood House
Porters WoodSt Albans, Herts
AL3 6PQ
SELF POTENTIAL IMAGING
mV
Self potentials (SP) are measurements of thedifference in natural electrical potentials betweentwo points on the ground surface. The naturalelectric currents responsible for these potentialsmay be generated by a number of different sourcesincluding groundwater flow, mineral deposits andchemical diffusion.
The magnitude of self potentials can vary from lessthan a millivolt to over one volt, and the polarity ofthe potential is a diagnostic factor in theinterpretation of SP anomalies. Although there aremany sources of self potentials, the common factoramong them is groundwater. The potentials aretypically generated by the flow of water, or by theinvolvement of water in natural chemical reactions.
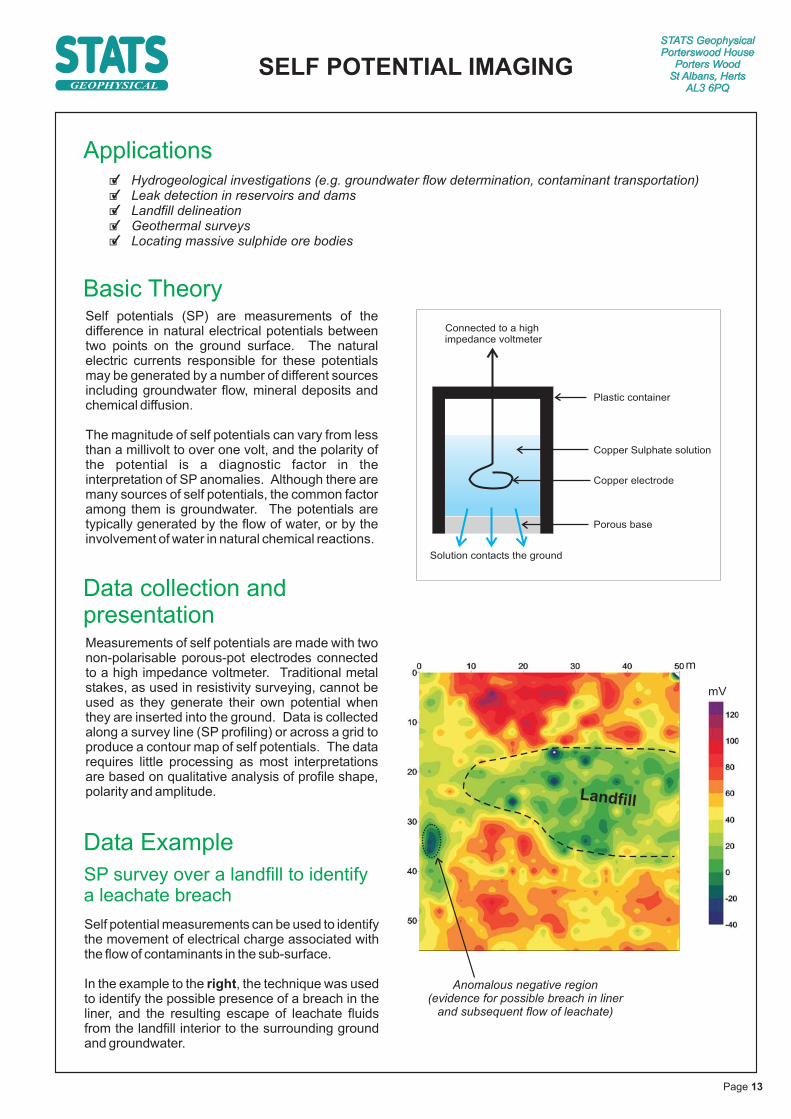
Measurements of self potentials are made with twonon-polarisable porous-pot electrodes connectedto a high impedance voltmeter. Traditional metalstakes, as used in resistivity surveying, cannot beused as they generate their own potential whenthey are inserted into the ground. Data is collectedalong a survey line (SP profiling) or across a grid toproduce a contour map of self potentials. The datarequires little processing as most interpretationsare based on qualitative analysis of profile shape,polarity and amplitude.
Basic Theory
SP survey over a landfill to identifya leachate breach
Applications�
�
�
�
�
Hydrogeological investigations (e.g. groundwater flow determination, contaminant transportation)Leak detection in reservoirs and damsLandfill delineationGeothermal surveysLocating massive sulphide ore bodies
Self potential measurements can be used to identifythe movement of electrical charge associated withthe flow of contaminants in the sub-surface.
In the example to the , the technique was usedto identify the possible presence of a breach in theliner, and the resulting escape of leachate fluidsfrom the landfill interior to the surrounding groundand groundwater.
right
Connected to a highimpedance voltmeter
Plastic container
Copper Sulphate solution
Copper electrode
Porous base
Solution contacts the ground
GEOPHYSICAL
Anomalous negative region(evidence for possible breach in liner
and subsequent flow of leachate)
Data collection andpresentation
Data Example
Landfill
Page 13
m

STATS GeophysicalPorterswood House
Porters WoodSt Albans, Herts
AL3 6PQ
MAGNETICS SURVEYING
�
�
�
�
Detection of buried infillMineral exploration (mapping buried dykes andore bodies etc.)Locating landfillsDetection of underground pipes and other utilities
Magnetic surveying is a passive method based on themeasurement of localised perturbations to the Earth'smagnetic field caused by the presence of buried ferroustargets (e.g., pipes, cables, drums, military ordnance etc).
Magneticsurveys can be conducted with a wide range ofmagnetometers, which can measure the amplitude of thefield to within 0.01nT.
Typically, data is collected in a systematic manner acrossa field site and then presented as a contoured map (nT ornT/m) which can be interpreted to produce a map of thesubsurface. The amplitude and shape of an individualanomaly will reflect the dimensions, orientation andmagnetic susceptibility of the buried target.
Gradiometry surveys, which determine the verticalgradient of the magnetic field, are increasingly common inenvironmental/engineering site investigations as they areparticularly sensitive to the near-surface.
Basic Theory
Data Example
Mapping undergroundair raid shelters
Magnetic surveying is useful inmany situations, in particular todetect buried manmade metallicobjects. In this example to the
, the survey has revealed thelocation of air raid shelters buriedbeneath the surface. The darkblue colours reflect the position ofthe shelters which also correlatesto their position on the historicmap.
right
Groundsurface
+++
+
____
+
Earth'smagnetic field
Anomalousmagnetic
field strength
A
A
B
B
Magnetised body
Induced magnetic field
Total field anomalyprofile
+
_
Pole Equator
Dark blue anomalies in magnetic data correlate withthe location of buried air raid shelters on the historic map.
Applications
�
�
�
�
Mapping underground storage tanks, burieddrums, piles, reinforced concrete etc.Archaeological studiesMapping UneXploded Ordinance (UXO)Pile detection
GEOPHYSICAL
Data Presentation
The collection of magnetic gradiometrydata with dGPS location is an accurate
and rapid means of data collection.
Page 14

STATS GeophysicalPorterswood House
Porters WoodSt Albans, Herts
AL3 6PQ
MAGNETICS SURVEYING
Data Examples
Magnetic anomalies locating buriedfoundations of former structures
Magnetic Gradiometry
In the example , the data shows linear features such asburied ditches and walls together with isolated anomaliesindicative of traces of human activity.
Magnetic anomaly locating historic ruins
right
GEOPHYSICAL
Magnetic anomalies locating buried obstructionsand possible Unexploded Ordnance (UXOs)
1
2
3
metres
A
Key features
B
C
D
A
A
A
A
B
B
B
C
CD
Building foundation outline marked by highamplitude instrument response(dark blue and red colours)
Circular foundations of former cooling towers
Anomalies with regular geometric shapesindicative of buried manmade structuresand other objects such as tanks
Small and discrete metal containing objectsindicative of possible UXOs
metres
50 50
Page 15

STATS GeophysicalPorterswood House
Porters WoodSt Albans, Herts
AL3 6PQ
MICROGRAVITY
The diagram to the shows a negative gravityanomaly arising from an air-filled void (sphere) with aradius of 2m and a depth to centre of 3m.
The density of the host rock = 2.5 Mg/m
left
3f
Basic Theory
Data recorded on site should include accurateposition and height measurements for eachrecording station, and number of readings at eachstation from which to evaluate data quality, and anumber of repeated recording stations at knowntime intervals from which to determine therepeatability of the results, and to correct for factorssuch as earth tides, instrument drift, and other timevariant effects. Corrections are made for variations
in latitude elevation, local terrain and large length-scale influences from regional geology. The result isa from which bothqualitative and quantitative interpretations may bederived.
An accurate micro-gravity anomaly map can be usedto calculate the location, depth density contrast andtherefore volume of the subsurface feature.
residual microgravity map
Different subsurface materials have different bulkdensities. Microgravity surveys seek to detect areasof contrasting or anomalous density by collectingsurface measurements of the Earth’s gravitationalfield.
A gravity meter is a highly sensitive instrument thatmeasures the due to gravity. Whenpositioned above a dense material it records theacceleration ( ) as a relative high (a
). When positioned above a low densityfeature (e.g. an air filled cavity) a relative gravity low(or ) is recorded.
acceleration
g positive gravityanomaly
negative gravity anomaly
Air-filled void
Host rock
Scintrex CG-5 Gravimeter
Gravity anomalies arising from natural or manmadesubsurface features such as voids and cavities aresuperimposed on much larger variations due toheight, latitude and regional geological variations. Inorder to isolate the subtle signal of interest, carefuldata acquisition and processing is required.
For a successful survey it is imperative that thehighest quality of data is collected. Micro-gravitysurveys are particularly sensitive to the datacollection methodology which must be carefullytailored to the site and environmental conditions, aswell as being appropriate to the survey target.
Applications�
�
�
�
Cavity detection (e.g., bomb shelters, collapsed tunnels, old mineworkings,
natural cave systems, sinkholes and other solution features etc)Density determinationMineral explorationLocating buried tanks and reservoirs
GEOPHYSICAL
Data Acquisition
Data Processing and Presentation
Page 16

STATS GeophysicalPorterswood House
Porters WoodSt Albans, Herts
AL3 6PQ
MICROGRAVITY
Data ExamplesMicrogravity survey along the proposed route of a bypass to detect voids & poorly consolidated ground
GEOPHYSICAL
Microgravity survey over voids caused by solution features in the grounds of a school
Rela
tive
scale
(mG
al)
A Bouguer anomaly map of the survey area.Regions of poorly consolidated ground
are outlined in black.
The geology of the site comprised approximately 14m of glacial tilloverlying limestone bedrock. The general area is known to besusceptible to poor ground conditions and voids associated withnatural cavities in the limestone.
The microgravity survey (see ) identified areas of low subsurfacedensity, which were subsequently targeted by a conventionalborehole investigation. These areas are outlined in black on the map.
A detailed ground model constructed from borehole dataallowed a synthetic gravity map to be calculated forcomparison with the measured gravity. Poorly consolidatedground, depth to bedrock and surface topographic effectscould be isolated and a clear interpretation of subsurfaceconditions presented to the project engineer.
left
The detailed borehole investigation of oneof the major anomalies identified in this dataset allowed, through some simple and quickcalculations, a cause and effect link to be
proven between ground conditionsand the microgravity survey results.
Voids
Void
The trigger event for the investigation was theformation of a small 1.3m deep hole in one corner of aschool playground (see photo ). The hole hadthe characteristics of a small doline. The site is withinan area known to be affected by natural voids withinthe chalk bedrock, which lies at about 7m depth.
The results of the microgravity survey (below )show a number of areas of low density ground. Asubsequent intrusive survey comprising dynamicprobing confirmed very weak or voided ground atthese locations therefore successfully pinpointing allthe problem areas needed for remedial works.
below
right
Data is collected acrossa grid at ground surface level
School building
Lessdense
Moredense
50m
1
2
Page 17

STATS GeophysicalPorterswood House
Porters WoodSt Albans, Herts
AL3 6PQ
The seismic refraction technique is based on therefraction of seismic energy at the interfaces betweensubsurface/geological layers of different velocity.
uses very similarequipment to seismic reflection, typically utilisinggeophones in an array, and a seismic source (shot).
By picking the time of the first arrival of seismic energyat each geophone, a plot of travel-time againstdistance along the survey line can be generated. Thistype of graph is shown in the schematic to the .The gradients of the lines in this type of plot are relatedto the seismic velocity of the subsurface layers. Thefinal output is a velocity/depth profile for the refractorsas shown .
right
below
Theseismic refraction method
The schematic diagram to the illustrates the pathof seismic waves propagating from a source at thesurface. Some of the seismic energy travels along thesurface in the form of a However, when aseismic wave encounters an interface between twodifferent soil or rock layers a portion of the energy is
and the remainder will propagate throughthe layer boundary at a angle.
At a of incidence the wave isand will travel parallel to the interface at the
speed of the underlying layer. Energy from thiscritically refracted wave returns to the surface in theform of a , which may arrive at the moredistant geophones before the direct wave.
right
direct wave.
reflectedrefracted
critical angle criticallyrefracted
head wave
Basic Theory
SEISMIC REFRACTION
Seismic velocity cross-section showing the bedrockprofile beneath a route of a proposed pipeline.
Applications
�
�
�
�
�
�
�
Stratigraphic mappingEstimation of depth to bedrockEstimation of depth to water tablePredicting the rippability of specific rock typesLocating sinkholesLandfill investigationsGeotechnical investigations
GEOPHYSICAL
Another approach avai lable for theinterpretation of refraction data is the modellingand inversion of the acquired seismicvelocities. By modelling the paths takenthrough the subsurface by the seismic energy,or ‘ray tracing’, the thickness of each layer inthe model can be adjusted in an iterativemanner until a solution is achieved. Thisproduces a cross-sectional velocity model ofthe subsurface. Borehole records can furthercalibrate the data to provide levels of thesubsurface layers across the survey line.
Equipment is computer controlled, portable andoffers rapid data collection at relatively low cost.
Ele
vation
(mA
OD
)
(m)
Low velocitychannel infill material Possible tunnel
Groundsurface
V1
V2
V3
Direct wave
Critically refracted wave
Critically refracted wave
Source
Slope = 1/V1
Slope = 1/V2
Slope = 1/V3
Tim
e
Distance
Headwave
Headwave
Geophones
Page 18

STATS GeophysicalPorterswood House
Porters WoodSt Albans, Herts
AL3 6PQ
SEISMIC REFRACTION
Data Examples
310.00
315.00
320.00
325.00
330.00
335.00
340.00
0 10 20 30 40 50 60 70 80 90
Topography
Top of gravel
Top of sandstoneor siltstone
Defining Geological Boundaries
Competent bedrock
Page 19
This seismic refraction survey locates the geologicalboundaries between layers. shows the typicalequipment used in this type of survey.
Figure 1Figure 2
displays a colour cross section of the ground along thesurvey line reflecting the associated velocities.
A 4-layer model is suggested by the travel time data,with layer velocities of 0.3km/s, 0.6km/s, 1.4km/s and2.1km/s. shows the interpreted boundaries.Figure 3
GEOPHYSICAL
Data acquisition stage
Here an accelerated weight-drop seismic source wasdeployed as part of a winter-time survey in Georgia.
A
B
3
1
2 Data processing
(m)
(m)
Velocity (km/s)
Data analysis
Interpretation:
Buried channelstructure
A
B

IMPROVEDINTERPRETATIONTHROUGHMODELLING
STATS Geophysical have developed uniqueforward modelling software to aid interpretation ofsurface wave data. The implementation of thisadvanced technique provides significantimprovements in the delineation and location ofmajor boundaries in the subsurface, and also theaccurate determination of ground stiffnessvariations with depth.
Currently STATS Geophysical offer forwardmodelling and interpretation of surface wave dataas a service, either as part of a complete siteinvestigation by STATS, or as a stand-alone servicefor site data collected by others. This
The software is an implementation of ourGeoDEM3D discrete element code. Theadvantages of this numerical scheme overtraditional finite difference or finite elementschemes is its ability to accurately model the motionof the ground surface, cope with large contrasts ine las t ic proper t ies , and inc lude vo ids ,disaggregated zones, delamination and fractures.
methodologyfor the accurate interpretation of seismic data isunique to STATS Geophysical, and is part of ourongoing research and development activities.
STATS GeophysicalPorterswood House
Porters WoodSt Albans, Herts
AL3 6PQ
� Stratigraphic mappingEstimation of depth to bedrock including landfill base locationSoil stiffness and ground improvement verification
�
�
� In-situ ground stiffness for geotechnical and civil engineering projects
SEISMIC SURFACE WAVE
GROUND STIFFNESS MEASUREMENT
Applications
Surface waves allow the measurement of thevariation in soil stiffness with depth. A Surfacewave (Rayleigh wave) has the property that groundmotion becomes insignificant below a depth of onewavelength. By recording Rayleigh waves ofdifferent frequencies, and therefore wavelengths,the properties of the subsurface can be determinedat different depths.
The characteristic velocity of the surface wavescan be determined by measuring the signalsreceived at a series of geophones. The datacollected can be processed to produce values ofmaximum shear modulus (G )at different depths.max
A stiffness profile can be generated for eachadjacent pair of geophones. Profiles can becombined to produce cross-sectional images ofthe properties of the subsurface. Similarly, anumber of adjacent cross-sections can becombined to produce a 3D image.
Basic Theory
Page 20
GEOPHYSICAL
Two different methods of acquisition are availablefor the collection of surface wave data.
The Surface Wave Ground Stiffness ( )system operates with either an active source (fromvibration or hammer blow) or by utilising theseismic noise already present. This allows thetechnique to be used in active and noisy sites thatwould be unsuitable for other geophysicalinvestigation techniques.
The Continuous Surface Wave ( ) system
SWGS
CSWemploys a frequency controlled vibrator andgeophones. The vibrator generates a Rayleighwave at a specific frequency, within a range ofstepped harmonic frequencies between 5 - 700 Hz.By collecting data over a range of frequencies, theeffective depth of investigation can be varied.
Data Acquisition
Example model of Rayleigh surface waves propagating througha homogeneous subsurface. Colours indicate displacement
l
f1
f2
Geophone array d
Propagating
Rayleigh Wave
Phase difference between geophones
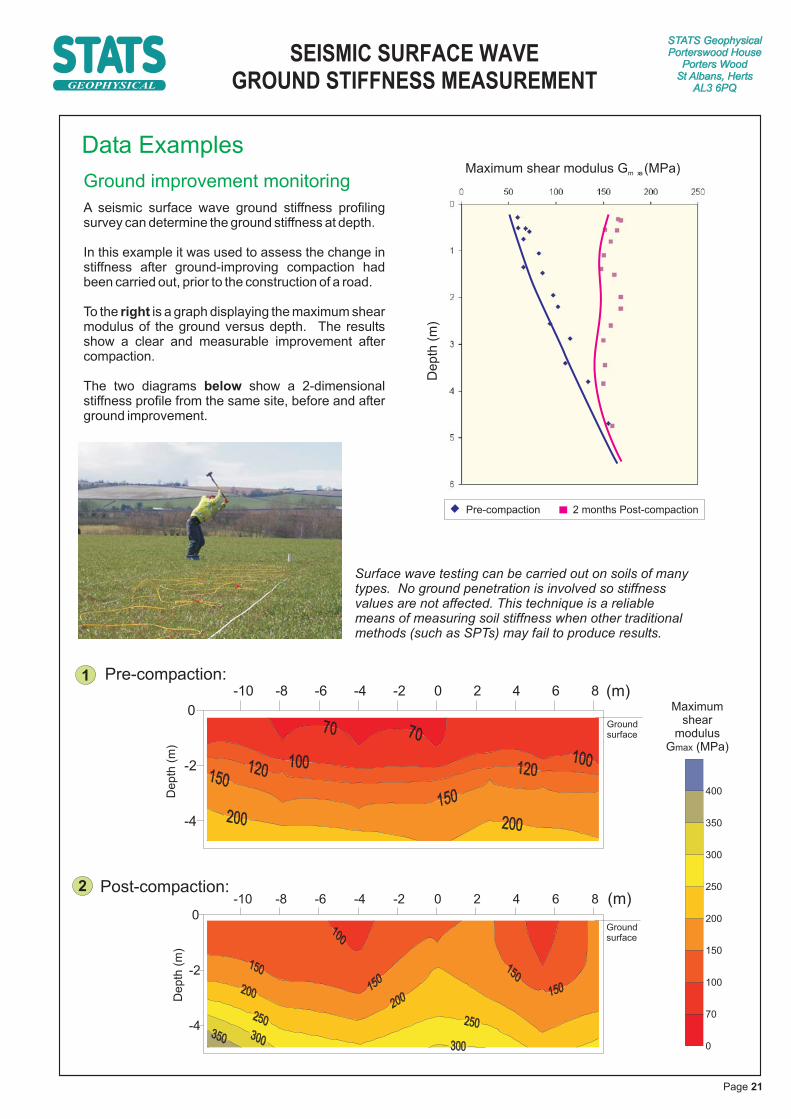
Surface wave testing can be carried out on soils of manytypes. No ground penetration is involved so stiffnessvalues are not affected. This technique is a reliablemeans of measuring soil stiffness when other traditionalmethods (such as SPTs) may fail to produce results.
Maximum shear modulus G (MPa)m ax
Depth
(m)
(m)
(m)
Pre-compaction 2 months Post-compaction
De
pth
(m)
De
pth
(m)
Groundsurface
STATS GeophysicalPorterswood House
Porters WoodSt Albans, Herts
AL3 6PQ
SEISMIC SURFACE WAVE
GROUND STIFFNESS MEASUREMENT
Data Examples
Ground improvement monitoring
A seismic surface wave ground stiffness profilingsurvey can determine the ground stiffness at depth.
In this example it was used to assess the change instiffness after ground-improving compaction hadbeen carried out, prior to the construction of a road.
To the is a graph displaying the maximum shearmodulus of the ground versus depth. The resultsshow a clear and measurable improvement aftercompaction.
The two diagrams show a 2-dimensionalstiffness profile from the same site, before and afterground improvement.
right
below
GEOPHYSICAL
1
2
Groundsurface
Maximumshear
modulusG (MPa)max
Page 21

Groundsurface
V1
V2
Source Geophones
(V > V )2 1
Depth
Horizontal distance
Basic Theory
Seismic reflection surveys are primarily used to mapsubsurface geological boundaries and stratigraphicvariations. Akey advantage of the technique is that, afterprocessing, it can provide a cross-sectional image of thesubsurface.
The image shows stratigraphically interpreteddata. The different colours have been used to delineatethe different geological units. Each of the coloured linesindicates a geological boundary. The high resolution ofthe cross-sectional data allows details of the internalstructure of this alluvial channel deposit to be mapped.
above
Seismic energy is provided by a shot on the ground surface. Forshallow seismic surveys this typically involves a hammer and plate(shown ), a weight drop or an explosive charge. The greater theenergy that the seismic source imparts, the deeper below the surfacethe survey will image.
left
Applications
�
�
�
Stratigraphic mappingGeological mappingEstimation of depth to bedrock
Seismic reflection can identify variations in materialtype with depth and horizontal position. Thetechnique images the interfaces between materialswith contrasting acoustic/seismic velocities. Thistranslates to differences in the elastic propertiesand/or density of the material. Mapping thesecontrasts across an area can identify the extent anddepth to specific layers or interfaces of interest.
The seismic reflection method is based on thepropagation of seismic waves through thesubsurface, and their reflection at interfaces acrosswhich there is a sufficient contrast in velocity. This isillustrated by the schematic diagram to the . Theseismic energy is generated
Seismic waves arriving at positions along the surveyline are recorded by geophones. Modern geophonesconsist of a coil wound on a magnetic core, springsuspended in the field of a permanent magnet. If thecoils move relative to the magnet, a voltage is inducedin an external circuit. The this voltage isrelated to the strength of the oscillation. Eachgeophone is connected to the seismometer whichrecords the arrival time and magnitude of the inducedvoltages (oscillations) at each geophone.
rightat the surface by an
impact or an explosion.
strength of
SEISMIC REFLECTION
STATS GeophysicalPorterswood House
Porters WoodSt Albans, Herts
AL3 6PQGEOPHYSICAL
Page 22

Page 23
GEOPHYSICAL
GEOPHYSICAL
APPLICATIONS
GEOPHYSICAL

GEOPHYSICAL
ARCHAEOLOGY
STATS GeophysicalPorterswood House
Porters WoodSt Albans, Herts
AL3 6PQ
Page 24
Geophys ics can a id a rchaeo log ica linvestigations immensely. The use of the abovetechniques can provide rapid coverage of a sitewhere archaeological remains are believed toexist. STATS has qualified and experiencedgeophysical professionals who use the latestinstrumentation and software to provide a rapidand reliable interpretation. Our surveys areconducted with the appropriate methods andpractices in accordance with guidance set out bythe Institute of Field Archaeologists and EnglishHeritage. Our data can aid greatly in targetingarchaeological digs by supplying accurate dataf rom wh ich in i t ia l interpre ta t ions ofarchaeological remains can be made.
Survey examples
Geophysical Techniques Available�
�
�
�
Magnetic Gradiometry
Electrical ResistivityGround Penetrating Radar (GPR)
Electromagnetic Mapping (EM)
Locating Historic Ruins
In the example an integrated geophysical surveycomprising earth resistance (photo above) and EM(coloured map above) was conducted on the site of aMediaeval Abbey to determine the presence of buriedfoundations, walls or other remains of former standingstructures of archaeological interest at the site.
This information was used by the client to target anarchaeological dig. As a result of the geophysicalinvestigation the time and expense of a large system ofexploratory trenches was avoided.
aboveArchaeological Evaluation
In the example , a magnetometer survey wasconducted over a large proposed wind farm site.The survey was undertaken so that the mostsensitive archaeological areas could be avoided.Due to the scale of the site, preliminary detailedsurveys were conducted around each turbineposition and along each construction route. Areasof particular archaeological potential were identifiedfor targeted follow-up surveys.
below
Magnetometer survey data recorded alongone of the tracks at the site showing circular
anomalies to right (note: width of track is 25m)
Large areas such as at this sitecan be rapidly covered with non-intrusive, mobile data collectionsuch as the GEEP with twinmounted G858 sensors coupledwith integral GPS for positioning.
Geophysics can also play an importantrole in the detection of human remainsand other buried objects as part offorensic investigations.
GEOPHYSICAL
ARCHAEOLOGY
STATS GeophysicalPorterswood House
Porters WoodSt Albans, Herts
AL3 6PQ
Reflection anomalies consistentwith the presence of graves
Locating Graves over a Historic Burial Ground
Ground Penetrating Radar (GPR) was used over a historicburial ground. The technique offers a quick and reliablemeans of detecting buried objects such as unmarkedclandestine graves. The use of GPR is ideal becauseit is non-destructive therefore preserving thecemetery and the graves. As shownthe reflection anomalies recorded in thedata are interpreted to provide depthand location.
below
Image courtesy of niversity of Leicester GRAMS ProjectDepartment of Geology, U
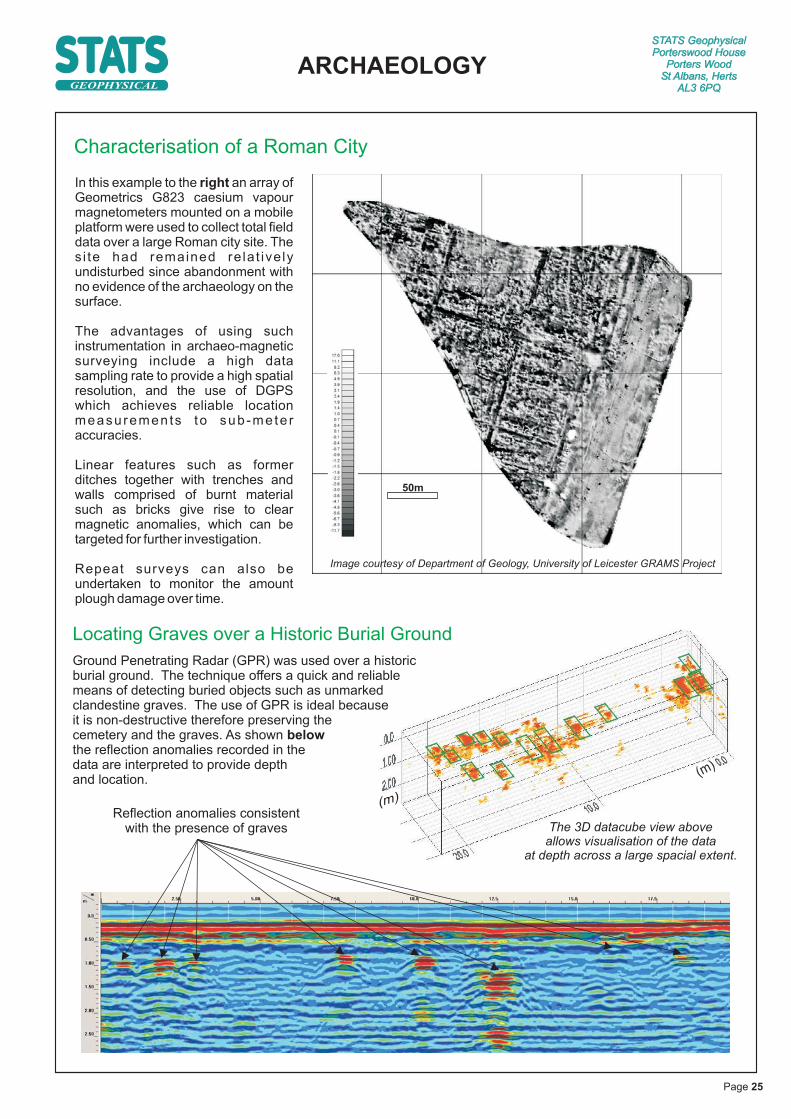
Characterisation of a Roman City
In this example to the an array ofGeometrics G823 caesium vapourmagnetometers mounted on a mobileplatform were used to collect total fielddata over a large Roman city site. Thes i te had rema ined re lat ive lyundisturbed since abandonment withno evidence of the archaeology on thesurface.
The advantages of using suchinstrumentation in archaeo-magneticsurveying include a high datasampling rate to provide a high spatialresolution, and the use of DGPSwhich achieves reliable locationmeasurements to sub -mete raccuracies.
Linear features such as formerditches together with trenches andwalls comprised of burnt materialsuch as bricks give rise to clearmagnetic anomalies, which can betargeted for further investigation.
Repeat surveys can a lso beundertaken to monitor the amountplough damage over time.
right
(m)
(m)
The 3D datacube view aboveallows visualisation of the data
at depth across a large spacial extent.
50m
Page 25

EM
data
record
ed
on
a2m
x2m
grid
acro
ss
an
are
a(~
100m
x120m
)
STATS GeophysicalPorterswood House
Porters WoodSt Albans, Herts
AL3 6PQ
BROWNFIELD SITES
�
�
�
�
Seismic Refraction and ReflectionSeismic Surface WaveSelf Potential (SP)Induced Polarisation
Geophysical Techniques Available�
�
�
�
Ground Penetrating Radar (GPR)EM Ground Conductivity
� Electrical Resistivity ImagingMagnetics SurveyingMicrogravity
EM data recorded on a 2m x 2mgrid across an area (60m x 120m)
Historical map (circa 1850’s) showinglayout of former hospital
The example data presents a survey conducted on anartificial sports pitch that suffered from drainage problems. AnEM survey was employed, and successfully located brick andmasonry foundations from a former central London hospital.Although the hospital was demolished in the mid 1900’s, it isthought that the poor drainage is a result of the in-situfoundations.
above
The UK Government has set a target of 60% for all newdevelopments to be built on brownfield sites. Thesesites frequency contain poor ground conditions and aplethora of unknown underground obstacles which maycause costly engineering and environmental issues anddelays to the developer.
Geophysical techniques can play an important role inreducing costs and risks by providing useful tools for thepreliminary investigation of brownfield sites, with rapidsite reconnaissance surveys being utilised tocharacterise subsurface features prior to any intrusiveinvestigation. Rapid data collection rates (up to 2hectares per day), and specialist data processingtechniques, mean that preliminary results can usuallybe offered soon after the completion of a survey,providing an invaluable tool in the engineer’s armoury.
Pip
e
Gas
Main
Foundations
In the example , electromagnetic mapping wasemployed to locate underground storage tanks, a largegas main and other obstacles prior to intrusive geo-environmental investigation of a former gas works,now used as a car park.
above
The data was recorded over a formerindustrial site that was proposed for residentialdevelopment. A Phase 1 desk study of the siterevealed the possibility of buried infrastructure,and hence possible sources of contamination.However, there was no logical distribution of thefeatures that remain in-situ and those that havebeen excavated.
The resulting electromagnetic survey of the siteand correlation with historical maps has clearlyidentified which structures remain in-situ, andwhich structures have been removed. Thisprovided invaluable information for theredevelopment of the site, from both anenvironmental and geotechnical viewpoint.
above
Page 26
GEOPHYSICAL

STATS GeophysicalPorterswood House
Porters WoodSt Albans, Herts
AL3 6PQ
BROWNFIELD SITESGEOPHYSICAL
Former Land Use Determination
As part of geoenvironmental site investigations,determining the former landuse of a site canprovide a useful base for determining the likelysources and locations of contamination and/orobstructions prior to re-development of a site.Historical maps can provide an insight into this,but do not reveal any information on whether thestructures are still present or not.
Locating metal pipes usingMagnetic Gradiometry
In this example to the , the client wasunaware of the location of two deep metalpipelines running beneath a supermarket carpark. Geophysics was used to locate thepipelines so the proposed building extensioncould be built around them.
right
Scale (metres)
0 5 10 15
Locating buried services and obstructions
In this example to the left, EM mapping was used to offer a quickscreening tool producing site-wide rapid characterisation of aderelict engineering works for the purpose of detectingunderground hydrocarbon tanks for further investigation.
The EM map ( ) clearly highlights problematic groundconditions and areas containing buried foundations,
utilities and storage tanks .
The data also shows how surface featuressuch as metal fences and metal objects
such as benches and vehicles canstrongly affect the data. In sites
with too much ‘interference’,anoma l ies from sub-
surface features maybe masked and not
be detected.
left
A
Key features
B
C
D
E
Piled foundations
Underground tanks
Large underground gas mains
Other buried services
Metal surface features
B
B
A
C
DE
E
Data Examples
A
B
A
High amplitude linear magnetic anomaliesindicative of buried metal services
High amplitude discrete anomalies causedby surface trolley parks
B
INFERRED PIPELINE ROUTE
Reds and pinks showareas of highestconductivity
Page 27

Geophysical Techniques Available�
�
�
�
�
Electrical ResistivityElectromagnetic Mapping (EM)Ground Penetrating Radar (GPR)Magnetic GradiometrySeismic Refraction
Landfill waste
Position of Resistivity Line
Undisturbed ground
Base of the waste
Survey examples
Change in conductivity values indicates adifferent capping material or a variation inthe composition of shallow waste
Large conductivity gradientdelineates the landfill boundary.
A
B
A B
Defining Landfill Boundary and Depth of Waste
Figure shows the results from the EM-31 marking the Landfill boundaries.Figure shows a resistivity line marking the depth of the waste.
The UK has around 8,000 existing and closed landfillsites, many of which are not engineered and areunprotected to the environment. Even new landfillsites based on the principal of engineeredcontainment are at risk of leachate leaking through thelandfill base and sides to cause contamination ofsurrounding land and groundwater pollution, withpotentially serious consequences to drinking waterresources.
Geophysical surveys are often the only practical method ofinvestigation on landfills as they do not involve penetrationof the cap or liner and exposure of any wastes.
Geophysics can be used in a wide range of landfillapplications from determining the location and geometryof old landfills, through to aiding the investigation ofgroundwater pollution and migration pathways in thesubsurface, essential for demonstrating compliance withIPPC requirements.
ConductiveResistive
12
1
2
Page 28
STATS GeophysicalPorterswood House
Porters WoodSt Albans, Herts
AL3 6PQ
LANDFILL SITESGEOPHYSICAL

Defining Landfill Boundarieswith Integrated Data Sets
By integrating data sets from differenttechniques a more accurate determinationof landfill characteristics can be achievedthan from a single technique alone:
Seismic refraction identifies theboundary between the waste and bedrock.
Surface mapping of subsurfaceconductivity defines the landfill periphery.
Electrical resistivity imaging providesa cross section of the landfill defining thevertical extent of the waste and it can alsoidentify any leachate beneath the landfillliner and in the surrounding ground.
Extent of low resistivity (conductive) zoneassociated with location of quarry fill material
Electrical resistivity cross section
EM Conductivity Data
line 3 layered pc.vs
57
67
77
87
97
107
(m)
0 10 20 30 40 50 60 70 80 90 100
Distance (m)
0.2 km/s1.1 km/s
Extent of low velocity fill material
Seismic refraction results
387320
443470
443490
443510
443530
443550
443570
443590
443610
443630
387240
387260
387280
387300
0
0.5
1
1.5
2
2.5
3
3.5
4
4.5
5
5.5
6
6.5
7
7.5
8
8.5
9
9.5
10
0m 40m
A
B
C
Undisturbed ground
A
B
C
This shows an area of high conductivitydelineating the lateral extent of the infill material.
In-p
hase
com
ponent(%
)
High resistivitybedrockHigh resistivity
bedrock
X
X
Y
Y
Page 29
STATS GeophysicalPorterswood House
Porters WoodSt Albans, Herts
AL3 6PQ
LANDFILL SITESGEOPHYSICAL

Key features
Geophysical Techniques Available�
�
�
�
�
Electrical ResistivityElectromagnetic Mapping (EM)Ground Penetrating Radar (GPR)Self PotentialMagnetic Gradiometry
As part of the Part IIA regime, all potentiallycontaminated sites in the UK need to be investigated.
The use of geophysical techniques is an invaluabletool in the investigation of contaminated sites and canbe used as rapid site reconnaissance tool without theexposure of site personnel to the hazards ofcontaminated sites.
Geophysical techniques can form an integral part of thesite investigation at all stages, from the
investigation to highlight areas of potentialcontamination to target conventional intrusives; to themain Phase 2 investigation to augment and confirmborehole information to improve the Conceptual SiteModel; through to the latter phases such as themonitoring and validation of remedial measures.
preliminary
Phase 1
GPGP
IC
EJB
WM
WM
IC
SF h 2.5
SFh
2.5
SF
h2.5
IC
IC
SF
h2.
5
IC
IC
SF
h2.5
SF
h2.5
SF
h2.5
SF
h2.5
SF
h2.5
BW
h2.8
LP
G
IC
LP
G
IC
LP
IC
IC
B
B
LP
G
G
IC
G
SF
h2.
5
LP
LP
LPIC
IC
SFh
2.5
SFh
2.5
LP IC
EJB
SPP
P
IC
IC
HR h 1.1
IC
IC
GSP
IC
CTVIC
IC
IC
CTV
CTV
G
SP
LP
LP
G
G
G
G
IC
G
G
G
G
SB
SP SB
SP
SP
G
G
G
IC
G
G
G
G
G
SP
G
GSB
G
IC
IC
SB
G
G
G
G
G
g 0.8s 8h 12
g 0.8s 8h 12
g 1.8s 9h 17
SB
GP
GP
Tarmac
FB
71.8
2
71.7
971.8
171.8
2
71.6
0
71.5
9
71.5
5
71.5
8
Tac
Grass
74.05
74.26
GP
G
Tarmac
Tarmac
Tarmac
Tarmac
Tarmac
Tarmac
Tarmac
Tarmac
Foundation
MU
ND
E L L S
M U N D E L L S
MU
ND
EL
LS
MU
ND
EL
LS
MU
ND
EL
LS
MU
ND
EL
LS
M U N D E L L S
HE
RN
SW
AY
WA
TE
RS
I DE
Underpass
Beneath Road
Grass
Gravel
Canopy Line Avera
geHeight 15m
SFh
2.5
Canopy
Lin
eA
vera
ge
Heig
ht5m
BW
h2.8
BW
h2.8
G
G
Shrubs
Shrubs
Grass
Grass
Grass
Grass
Tarm
ac
Path
&C
ycle
Lane
Tarm
ac
Path
&C
ycle
Lane
(Brick)
Unidentified
Unidentified
Unidentified
A
B
C
D D
D
E
A
B
C
D
E
Buried foundations, including pile locations
Underground metal tank
Other buried obstructions
Buried services and sewers
Potential pollution plume
Reds andpinks
show
areas of
highestappare
nt conducti
vity.
Site characterisation
Site characterisation is the first and mostimportant step in contaminated landinvest igat ion . Features m issed byconventional site investigation techniques canbe identified in the initial stages bygeophysics. A comprehensive understandingof the ground conditions and contaminationissues at a site is vital to the process ofproducing an accurate and cost-effectiveremedial strategy. Where risk assessmentrequires total site coverage to trace allposs ib le sources and pathways ofcontamination the use of geophysics has to beconsidered.
In this example to the , EM groundconductivity was used to offer a quickscreening tool producing site-wide rapidcharacterisation of a site which had beendemolished entirely to ground level.
The results clearly highlight potential sourcesof contamination such as tanks and utilities,subsurface pathways like buried foundationsof former structures and also an area ofpossible contamination where a broken pipehad leaked to the surrounding ground. Thisinformation was used to inform thesubsequent intrusive investigation and dictatethe best location for targeted trail pits andboreholes.
left
Scale (metres)
0 10 20 30
Survey examples
Identifying land use with electromagnetics
Page 30
STATS GeophysicalPorterswood House
Porters WoodSt Albans, Herts
AL3 6PQ
CONTAMINATED LANDGEOPHYSICAL
Locating pollution plumes withintegrated geophysical techniques
In this example to the , EM conductivity andresistivity imaging were used to detect thepresence of possible buried tanks andcontamination present in the ground at a formerchemical works. Prior to the geophysicalsurvey, high concentrations of DNAPL carbondisuphide were recorded in soil samples takenfrom the ground. The EM and resistivity bothsuccessfully located a buried reinforcedstructure which has likely led to the pooling ofthe DNAPL in the vicinity. The results of thegeophysics aided the subsequent riskassessment and remediation of the site in orderto render it fit for purpose.
left
Hut Hut
WC
Meta
lF
encin
gM
eta
lF
encin
g
KnownManholeCovers
Response (mV)
Conductive
targ
ets
Resis
tive
targ
ets
Distance (m)
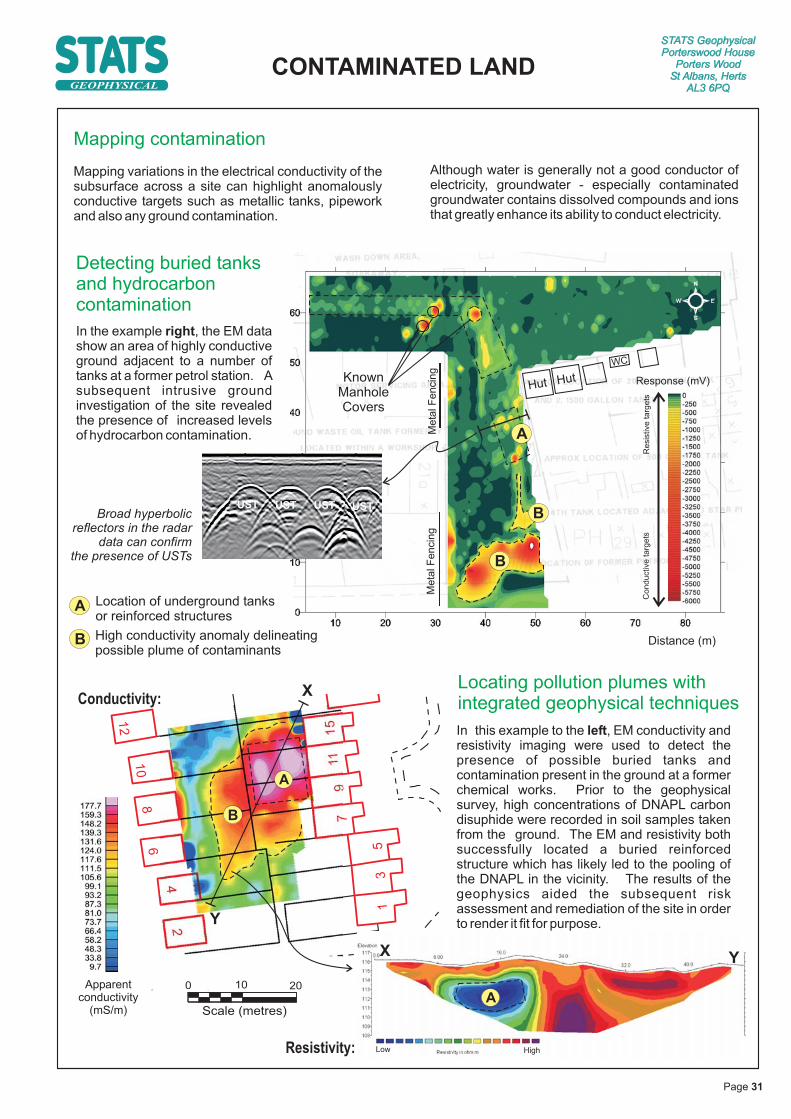
Mapping contamination
Mapping variations in the electricalacross a site can highlight anomalously
conductive targets such as metallic tanks, pipeworkand also any ground contamination.
Although water is generally not a good conductor ofelectricity, groundwater - especially contaminatedgroundwater contains dissolved compounds and ionsthat greatly enhance its ability to conduct electricity.
conductivity of thesubsurface
A
B
Location of underground tanksor reinforced structures
High conductivity anomaly delineatingpossible plume of contaminants
Detecting buried tanksand hydrocarboncontamination
In the example , the EM datashow an area of highly conductiveground adjacent to a number oftanks at a former petrol station. Asubsequent intrusive groundinvestigation of the site revealedthe presence of increased levelsof hydrocarbon contamination.
right
Broad hyperbolicreflectors in the radar
data can confirmthe presence of USTs
UST UST UST UST
STATS GeophysicalPorterswood House
Porters WoodSt Albans, Herts
AL3 6PQ
CONTAMINATED LANDGEOPHYSICAL
CR
OM
ER
GA
RD
EN
S
UE
2
1
1115
46
810
12
35
79
Scale (metres)
0 10 20Apparentconductivity
(mS/m)
B
A
B
Resistivity:
Conductivity:
Low High
X
X
Y
Y
B
A
A
Page 31
Some of the earliest applications of geophysics wereto determine the geological structure of thesubsurface. Changes in subsurface lithology oftenrepresent variations in physical properties. Thesevariations can be detected by geophysical methods.Our experienced staff are then able to interpret theseresults in terms of the local geology, allowing maps ofthe survey area to be produced.
In situations where the geology or depth to bedrock ispoorly constrained, geophysics can provide valuableinformation. Natural voids, sedimentary structures, orfractures and faults can cause significant engineeringproblems if they remain undetected.
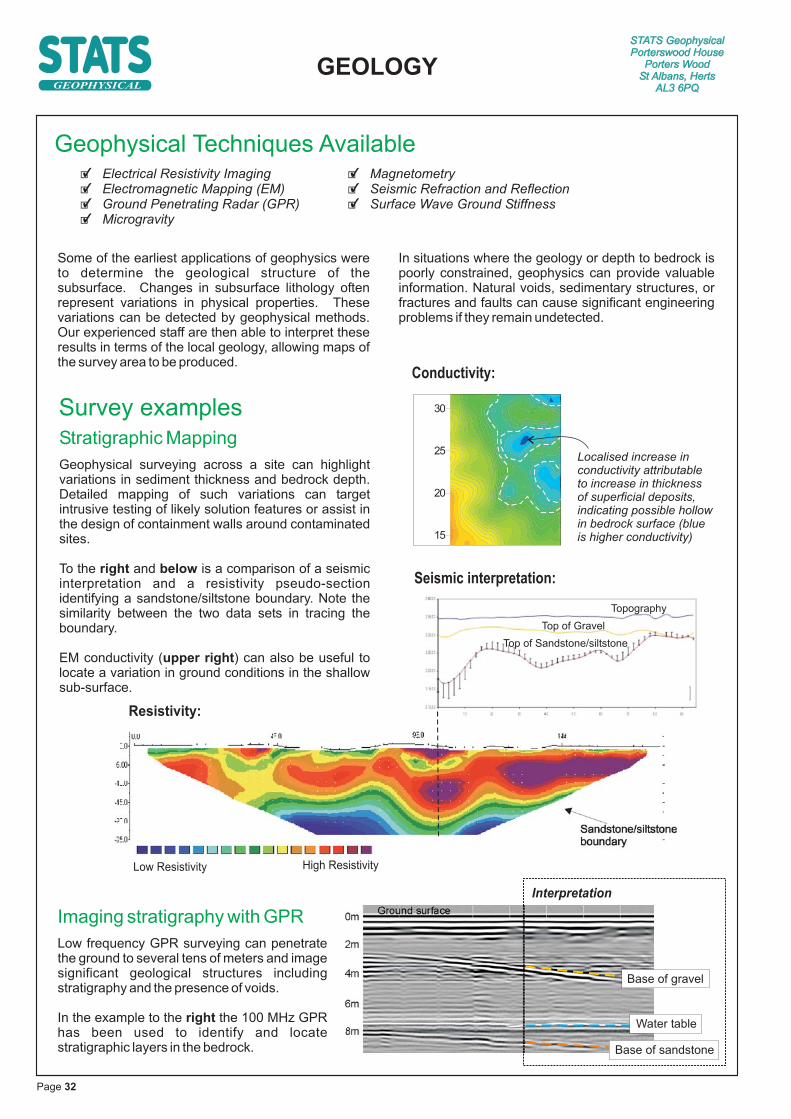
Stratigraphic Mapping
Geophysical surveying across a site can highlightvariations in sediment thickness and bedrock depth.Detailed mapping of such variations can targetintrusive testing of likely solution features or assist inthe design of containment walls around contaminatedsites.
To the and is a comparison of a seismicinterpretation and a resistivity pseudo-sectionidentifying a sandstone/siltstone boundary. Note thesimilarity between the two data sets in tracing theboundary.
EM conductivity ( ) can also be useful tolocate a variation in ground conditions in the shallowsub-surface.
right below
upper right
0m
2m
4m
6m
8m
Survey examples
Imaging stratigraphy with GPR
Low frequency GPR surveying can penetratethe ground to several tens of meters and imagesignificant geological structures includingstratigraphy and the presence of voids.
In the example to the the 100 MHz GPRhas been used to identify and locatestratigraphic layers in the bedrock.
right
� MagnetometrySeismic Refraction and ReflectionSurface Wave Ground Stiffness
�
�
Topography
Top of Gravel
Top of Sandstone/siltstone
Geophysical Techniques Available�
�
�
�
Electrical Resistivity ImagingElectromagnetic Mapping (EM)Ground Penetrating Radar (GPR)Microgravity
Localised increase inconductivity attributableto increase in thicknessof superficial deposits,indicating possible hollowin bedrock surface (blueis higher conductivity)15
20
25
30
Conductivity:
Seismic interpretation:
Ground surface
Base of gravel
Water table
Base of sandstone
Page 32
STATS GeophysicalPorterswood House
Porters WoodSt Albans, Herts
AL3 6PQ
GEOLOGYGEOPHYSICAL
Resistivity:
Low Resistivity High Resistivity
Interpretation

Clay
Chalk
Chalk
Clay
Chalk
Clay
Mapping Depth to Bedrock with Resistivity Imaging
3 adjacent lines conducted across a siteapproximately 100m long and 50m apart.From the data, the interface between the
Chalk and overlying clay is clearly apparent.
Nort
heast
Southw
est
In the example , a series of electrical resistivityimaging surveys were conducted across a 4Ha siteproposed for a housing development. Combined withcalibration data provided by a window sampler
investigation, the survey successfully defined thedepth to the Chalk and the nature of the geologicalcontact across the entire site. The geophysical surveywas able to be completed in just two days.
below
Higher resistivity Chalk
Locating Mineworkings using Integrated Geophysical Techniques
ResidualBouguer
microgravityanomaly map
(Blue representslow density ground)
Bedrock
Linear gravity low showinghistoric mine workings at depth
A microgravity survey was conducted over the route ofa proposed road to locate former tin mine workings.The gravity data ( ) clearly shows a linearanomaly indicating low density ground. A resistivitysurvey ( ) was carried out across theanomaly and shows an area of high resistivity at 6mbglindicative of a void. A follow up intrusive investigationconfirmed the presence of the voided mine working.Further gravity surveys ( ) revealed thepresence of additional mine workingsacross the site.
below left
below right
right
1
8
23
45
67
0m
24m
72m
48m
96m
Drained pond
Concrete
Bund
Fence
Fence
Residual BouguerGravity Anomaly (mGal)
Resistivity survey
line - see right
Exploratory hole
locations
STATS GeophysicalPorterswood House
Porters WoodSt Albans, Herts
AL3 6PQ
GEOLOGYGEOPHYSICAL
S
N
0m 10m 20m
S
Interpreted cross-section from intrusive investigation
A
Key features
B
C
Location of stope (voided working)
Conductive mineralized ground
Pondwall
Bedrock near surfaceA
A
AB
C
C
C
N
Made Ground
Concrete/metal(possible cap)
Solid Bedrock
VOID
Page 33
Geophysical Techniques Available�
�
�
Ground Penetrating Radar (GPR)Electromagnetic Mapping (EM)Electrical Resistivity Imaging (ERI)
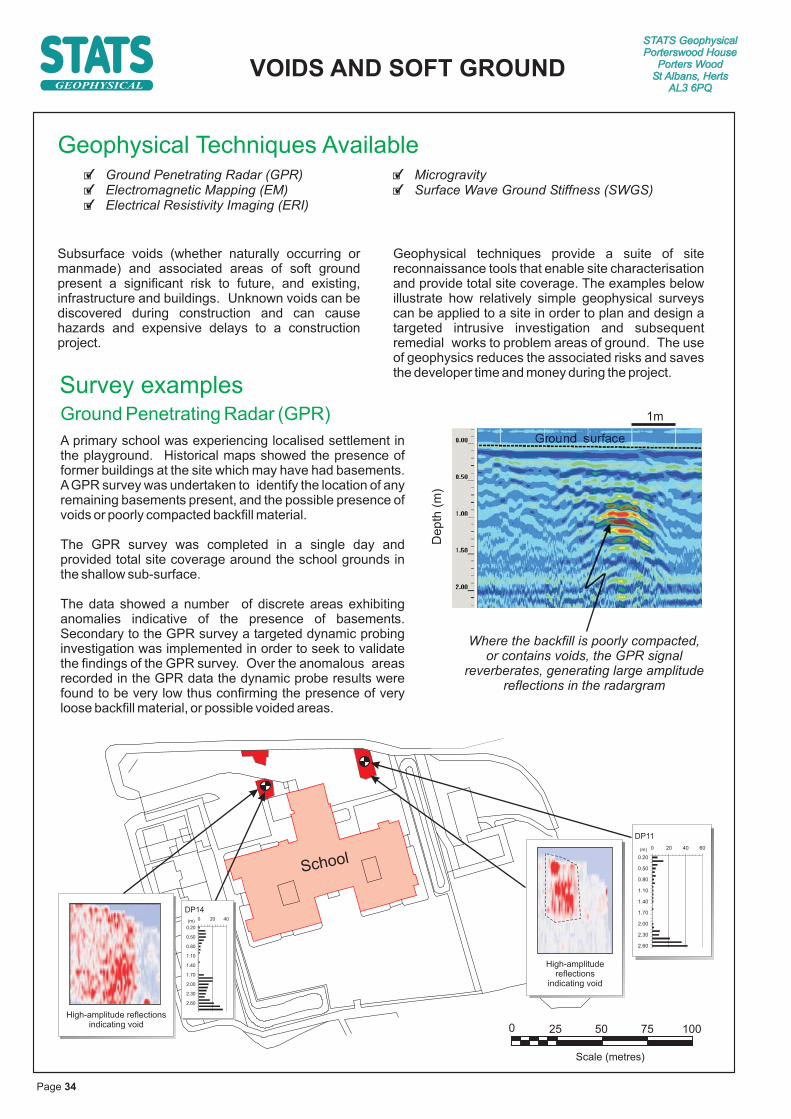
Subsurface voids (whether naturally occurring ormanmade) and associated areas of soft groundpresent a significant risk to future, and existing,infrastructure and buildings. Unknown voids can bediscovered during construction and can causehazards and expensive delays to a constructionproject.
Geophysical techniques provide a suite of sitereconnaissance tools that enable site characterisationand provide total site coverage. The examples belowillustrate how relatively simple geophysical surveyscan be applied to a site in order to plan and design atargeted intrusive investigation and subsequentremedial works to problem areas of ground. The useof geophysics reduces the associated risks and savesthe developer time and money during the project.
� Microgravity� Surface Wave Ground Stiffness (SWGS)
School
High-amplitude reflectionsindicating void
0 20 40
0.20
0.50
0.80
1.10
1.40
1.70
2.00
2.30
2.60
DP14
(m)
High-amplitudereflections
indicating void
0 20 40 60
0.20
0.50
0.80
1.10
1.40
1.70
2.00
2.30
2.60
DP11
(m)
STATS GeophysicalPorterswood House
Porters WoodSt Albans, Herts
AL3 6PQ
VOIDS AND SOFT GROUNDGEOPHYSICAL
Survey examplesGround Penetrating Radar (GPR)
A primary school was experiencing localised settlement inthe playground. Historical maps showed the presence offormer buildings at the site which may have had basements.AGPR survey was undertaken to identify the location of anyremaining basements present, and the possible presence ofvoids or poorly compacted backfill material.
The GPR survey was completed in a single day andprovided total site coverage around the school grounds inthe shallow sub-surface.
The data showed a number of discrete areas exhibitinganomalies indicative of the presence of basements.Secondary to the GPR survey a targeted dynamic probinginvestigation was implemented in order to seek to validatethe findings of the GPR survey. Over the anomalous areasrecorded in the GPR data the dynamic probe results werefound to be very low thus confirming the presence of veryloose backfill material, or possible voided areas.
1m
De
pth
(m)
Where the backfill is poorly compacted,or contains voids, the GPR signal
reverberates, generating large amplitudereflections in the radargram
Ground surface
Scale (metres)
0 25 50 75 100
Page 34

STATS GeophysicalPorterswood House
Porters WoodSt Albans, Herts
AL3 6PQGEOPHYSICAL
VOIDS AND SOFT GROUND
Microgravity Mapping
Solution features were identified within chalk bedrockduring drilling of a site prior to redevelopment of asports centre . A m icrograv i ty survey wascommissioned to seek to determine the lateral extent ofsolution features and voids within the chalk bedrock inorder to provide a reliable interpretation of the sub-surface at the site. The gravity survey was conductedon a 5x5m staggered grid over the proposed footprint ofthe building, ensuring comprehensive cover.
Yew
Hedge
Ht=
1.7
0
CLF
h2.9
Flo
odlig
ht
Flo
odlig
ht
Barrie
rh1.0
Grass
Grass
POLYTUNNEL
POLYTUNNEL
Blue areas in the gravity mapdelineate areas of low densityor possibly voided ground
The anomalies are interpreted torepresent possible solution features
in the chalk bedrock (above).
Corrections were applied to the observed gravity toproduce a final microgravity map ( ). Thecorrections applied included drift, latitude, free-air, andthe Bouger correction. The residual gravity mapdisplays three areas of broad gravity lows (colouredblue) across the survey area. The results were used totarget further boreholes to prove the anomalies. Veryweak to weak low denisty chalk or voided ground wasfound present in the gravity low areas.
Based on the findings of the investigation,important changes were made to the designand location of the development
below left
EM Ground Conductivity and Resistivity Imaging
Exploratory holes across a derelict site earmarked forredevelopment identified the presence of solution featuresand voids in the underlying chalk bedrock. An integratedgeophysical survey including EM31&34 groundconductivity, and resistivity imaging was undertaken todetermine whether further voiding was present. Due to thelarge size of the site, and the presence of chalk at shallow(<5m) depth, the EM technique was chosen to rapidlyimage the variation in ground conductivity to a depth of~10m across the entire site. Chalk solution features arelikely to manifest themselves as conductivity highs due anincreased thickness of overburden or a change in groundconditions such as increased groundwater saturation. Anumber of resistivity lines ( ) and targeted dynamicprobing were deployed over the EM anomalies to confirmthe presence of soft/loose ground in the subsurfaceassociated with potential voids at depth.
right
Top of chalkbedrock
ROAD.
Anomaly indicative of apossible solution featurepresent in both datasets
50m
10
m
EM-31 data.Oranges andreds showhigher groundconductivity.
Resistivity data showing blues as areasof lower resistivity (more conductive).
N
= high number of dynamic probeblow counts indicating competent ground.
= low dynamic probe blow countsindicating poorly consolidated ground.
Scale (metres)
0 25 50 75
S
Page 35

55
00m
m6000m
m3500mm
B
A
A
A
Structural Investigationsusing Ground Penetrating Radar (GPR)
Summary of findings from aCar Park in Central London
Beam strips
150mm
Column
5ns
(=
8,~
250m
m)
�
Beam strips
A typical radargram recorded in the investigtion with annotated interpretations
Additional reinforcementaround columns
slab base underlainby synthetic membrane
20m 21m 22m 23m 24m 25m 26m
rebar at 200mm separations rebar at 100mm separations
Ground surface 19m0mm
300mm
150mm
sagging
Whereas traditional covermeters are somewhatlimited in their penetration depth, a 900 to 1500MHzGPR system can provide high resolution data todepths of 1000mm and provide a permanent record ofreinforcing mesh ( ).
The resulting radargrams can highlight variations inbar spacing and areas of poor mesh placement(sagging). In the example below, a reflection from theslab base is also clearly in evidence providingimportant data on the slab thickness.see example below and next page
Ground Penetrating Radar (GPR) has enormouspotential for use on engineered structures. Over thepast ten years many structural investigations havebeen conducted by STATS Geophysical which hasresulted in a large knowledge base of reflection typesobtained from various structural features.
In conjunction with our Structures and Materialsdivisions we have conducted numerous investigationsaimed at determining construction detail and internalmetalwork in a variety of modern and historicbuildings.
Using GPR allows rapid non-destructive coverage,with a depth penetration of up to 2m. The approachallows us to image multiple layers of constructiondetail, the calculation of thicknesses, and the locationof internal metalwork including multiple layers ofreinforcement.
Beam strips
Rebar ~150mm centres
Rebar ~240mm centres
Areas of additional rebararound columns
1m
Page 36
STATS GeophysicalPorterswood House
Porters WoodSt Albans, Herts
AL3 6PQ
STRUCTURALGEOPHYSICAL

Survey examples
Here a GPR survey was used to determine thenature of the internal structure of walls at a universitybuilding. The survey (see photo ) wasundertaken using a high frequency 1.5GHz antennaat a 25cm line spacing to provide high resolutionimages of the wall interiors.
The survey was highly effective in showing areas ofwall that contain internal metalwork ( ).GPR has also been used very effectively in locatingcavities and voids within structures. The radar timeslice ( ) shows a metal flue which runs upthe interior of the wall.
below leftbelow centre
below right
Screed is the top finishing layer on a concrete slab.GPR can be used as a reliable, rapid, non-destructive means of testing the thickness andoffers total coverage. Here a contour map ( )of calculated depth to the base of the screed layerhas been produced based on the reflection time ofthe radar pulse over the survey area. The screedlayer is clearly defined in the radar data by a highamplitude reflection. The results show a generalvariation as well as some sharp changes in thedepth to screed.
right
Detection of voidsinternal metalwork and
Defining the depth of screed in building flooring
Blue indicates thicker screed (>75mm)whilstpinksshow less than 45mm
Defining the depth to rebar in a slab
In this example, GPR was used to determine thepresence and location of metal reinforcement withina concrete floor slab of a former industrial building.Information on the orientation, depth to re-bar andre-bar spacing was also gathered. Usinginformation from cored slab samples it was possibleto calibrate the GPR data very accurately. The map( ) shows the location of the rebar picked from thedata together with the depth within the floor slab.Sagging of the rebar is clearly visible in the data.The survey was completed in a single day andcovered the entire floor slab of the building.
left
Change in reinforcing mesh immediatelyabove air raid shelter
Portacabin
Area of apparentabsence of rebar mesh
250mm
Primary beam
Primary beam
Primary beam
Secondary
beam
s
Secondary
beam
s
Inferred location ofsecondary beams
180mm
150m
m
70m
m
140m
m150m
m
250mm
Rebar saggingbetween beams
Columns
(30x30mm)
(30x30mm)(20x20mm)
(20x20mm)
100mm
Depth to rebar meshfrom surface of slab
(in metres)
5m0m
GPR data collection by hand High amplitude reflections (coloured red)at 60mm cover depth indicate metal bracing in wall
Time slice at 140mm depthshows vertical air duct in wall
Vent
Air duct
0.5m 0.5m
up up
Plan view mapof floor slab
Page 37
STATS GeophysicalPorterswood House
Porters WoodSt Albans, Herts
AL3 6PQ
STRUCTURALGEOPHYSICAL
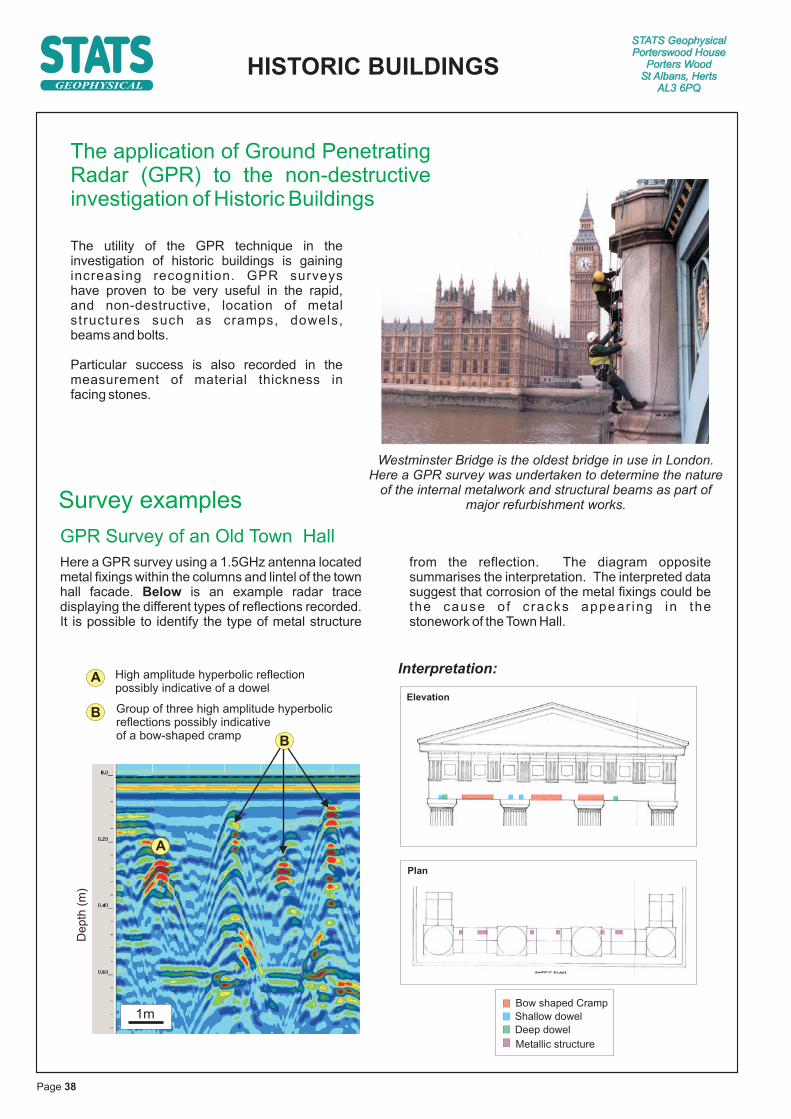
Survey examples
The application of Ground PenetratingRadar (GPR) to the non-destructiveinvestigation of Historic Buildings
Group of three high amplitude hyperbolicreflections possibly indicativeof a bow-shaped cramp
High amplitude hyperbolic reflectionpossibly indicative of a dowel
Bow shaped Cramp
Shallow dowel
Deep dowel
Metallic structure
Elevation
Plan
GPR Survey of an Old Town Hall
Here a GPR survey using a 1.5GHz antenna locatedmetal fixings within the columns and lintel of the townhall facade. is an example radar tracedisplaying the different types of reflections recorded.It is possible to identify the type of metal structure
from the reflection. The diagram oppositesummarises the interpretation. The interpreted datasuggest that corrosion of the metal fixings could bethe cause of cracks appear ing in thestonework of the Town Hall.
Below
De
pth
(m)
The utility of the GPR technique in theinvestigation of historic buildings is gainingincreas ing recogn i t ion . GPR surveyshave proven to be very useful in the rapid,and non-destructive, location of metalstructures such as cramps, dowe ls,beams and bolts.
Particular success is also recorded in themeasurement of material thickness infacing stones.
A
B
B
AInterpretation:
Westminster Bridge is the oldest bridge in use in London.Here a GPR survey was undertaken to determine the nature
of the internal metalwork and structural beams as part ofmajor refurbishment works.
1m
Page 38
STATS GeophysicalPorterswood House
Porters WoodSt Albans, Herts
AL3 6PQ
HISTORIC BUILDINGSGEOPHYSICAL

0
1
2
3
4
5
6
Tw
oW
ay
Tim
e(n
s)
0
1
2
3
4
5
6
7
8
9
10
Start of line End of line
Tw
oW
ay
Tim
e(n
s)
Bedding planes instone facing blocks
High amplitude anomaly indicative of abolt or rod running through buttress
0
1
2
3
4
5
6
7
8
9
10
Tw
oW
ay
Tim
e(n
s)
Start of lineEnd ofline
GPR Survey of Middlesborough Town HallClock Tower
The GPR survey was undertaken in partnership withMiddlesbrough Council. The principal purpose of the surveywas to identify the presence, depth and dimensions of metalcramps within the spire and the clock tower ( ). Visualinspection had revealed that bed joints between some of thelarge stone facing blocks in the spire had begun to open up. Itwas suspected that this was due to weathering processescausing corrosion and expansion of the metal fixings.
right
As shown in the radargram , the large contrastin dielectric properties between iron cramps and thesurrounding stonework produced strong reflections inthe radar data.
below
There was a number of other features ofinterest to the engineers designing andundertaking the remediation work whichwere also clearly discernable in thecollected data. In particular, beddingstructures within the stone facing blocksproduced clear reflections. It is unlikelythat each peak in the data represents anindividual bedding plane, however thedata suggest planar variation in theproperties of the material running parallelwith the surface. Also clearly visible in thedata was a reflection from the back face ofthe fac ing b locks (see examp leradargram to ).right
Correlation of this reflector acrossadjacent lines gave valuable informationon the thickness of individual facingblocks, and also the distribution of facingblocks of differing sizes.
B
STATS GeophysicalPorterswood House
Porters WoodSt Albans, Herts
AL3 6PQ
HISTORIC BUILDINGSGEOPHYSICAL
Data from the GPR survey provided importantinsight for the external repair works to this
Grade II listed building.
A A
C A
B
C Back face of stone facing block andfront face of internal brickwork
Interpretation:
0.5m D Likely iron cramps
C
D D
0.5m
A A A A
A A
D
Page 39
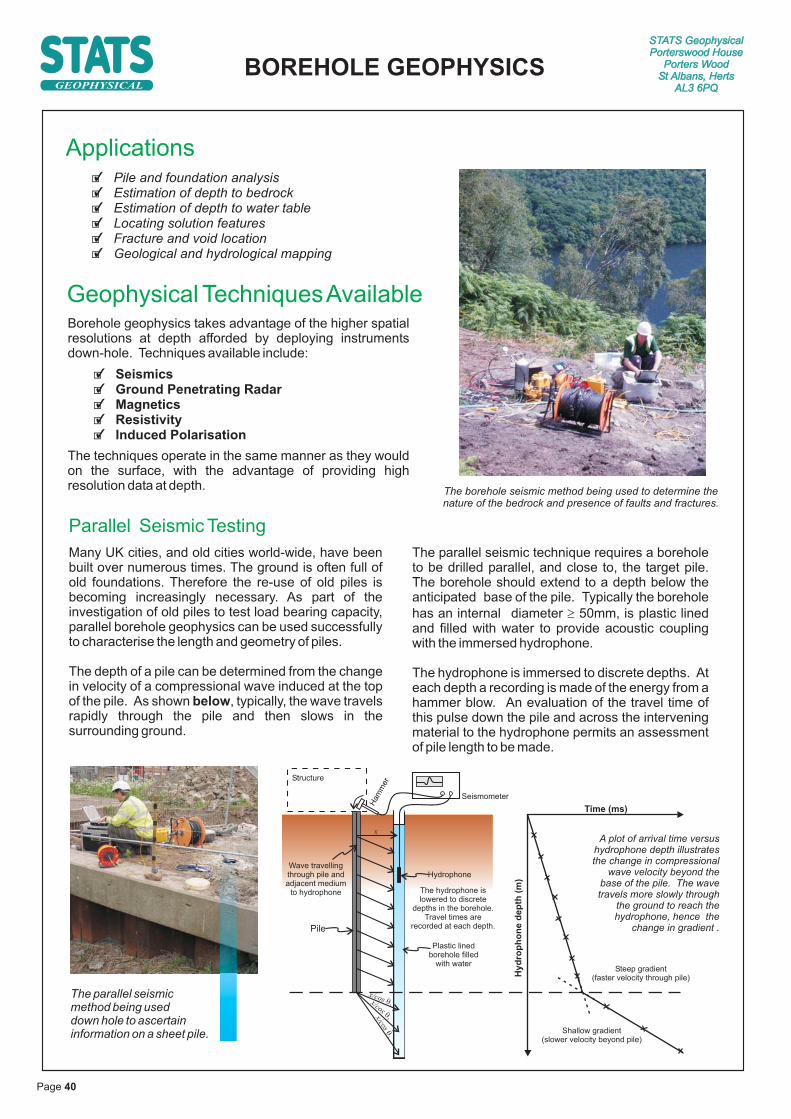
STATS GeophysicalPorterswood House
Porters WoodSt Albans, Herts
AL3 6PQ
BOREHOLE GEOPHYSICS
Applications�
�
�
�
�
�
Pile and foundation analysisEstimation of depth to bedrockEstimation of depth to water tableLocating solution featuresFracture and void locationGeological and hydrological mapping
Geophysical TechniquesAvailableBorehole geophysics takes advantage of the higher spatialresolutions at depth afforded by deploying instrumentsdown-hole. Techniques available include:
The techniques operate in the same manner as they wouldon the surface, with the advantage of providing highresolution data at depth.
�
�
�
�
�
SeismicsGround Penetrating RadarMagneticsResistivityInduced Polarisation
GEOPHYSICAL
Time (ms)
Hyd
rop
ho
ne
dep
th(m
)
Steep gradient(faster velocity through pile)
Shallow gradient(slower velocity beyond pile)
Structure
Ham
mer
Seismometer
Pile
Wave travellingthrough pile andadjacent medium
to hydrophone
Hydrophone
The hydrophone islowered to discrete
depths in the borehole.Travel times are
recorded at each depth.
Plastic linedborehole filled
with water
x
x/cos �1
x/c
os�
�
x/cos
��
The parallel seismicmethod being useddown hole to ascertaininformation on a sheet pile.
Parallel Seismic Testing
Many UK cities, and old cities world-wide, have beenbuilt over numerous times. The ground is often full ofold foundations. Therefore the re-use of old piles isbecoming increasingly necessary. As part of theinvestigation of old piles to test load bearing capacity,parallel borehole geophysics can be used successfullyto characterise the length and geometry of piles.
50mm, is�
The depth of a pile can be determined from the changein velocity of a compressional wave induced at the topof the pile. As shown , typically, the wave travelsrapidly through the pile and then slows in thesurrounding ground.
The parallel seismic technique requires a boreholeto be drilled parallel, and close to, the target pile.The borehole should extend to a depth below theanticipated base of the pile. Typically the borehole
has an internal diameter plastic linedand filled with water to provide acoustic couplingwith the immersed hydrophone.
The hydrophone is immersed to discrete depths. Ateach depth a recording is made of the energy from ahammer blow. An evaluation of the travel time ofthis pulse down the pile and across the interveningmaterial to the hydrophone permits an assessmentof pile length to be made.
below
A plot of arrival time versushydrophone depth illustratesthe change in compressional
wave velocity beyond thebase of the pile. The wavetravels more slowly through
the ground to reach thehydrophone, hence the
change in gradient .
The borehole seismic method being used to determine thenature of the bedrock and presence of faults and fractures.
Page 40
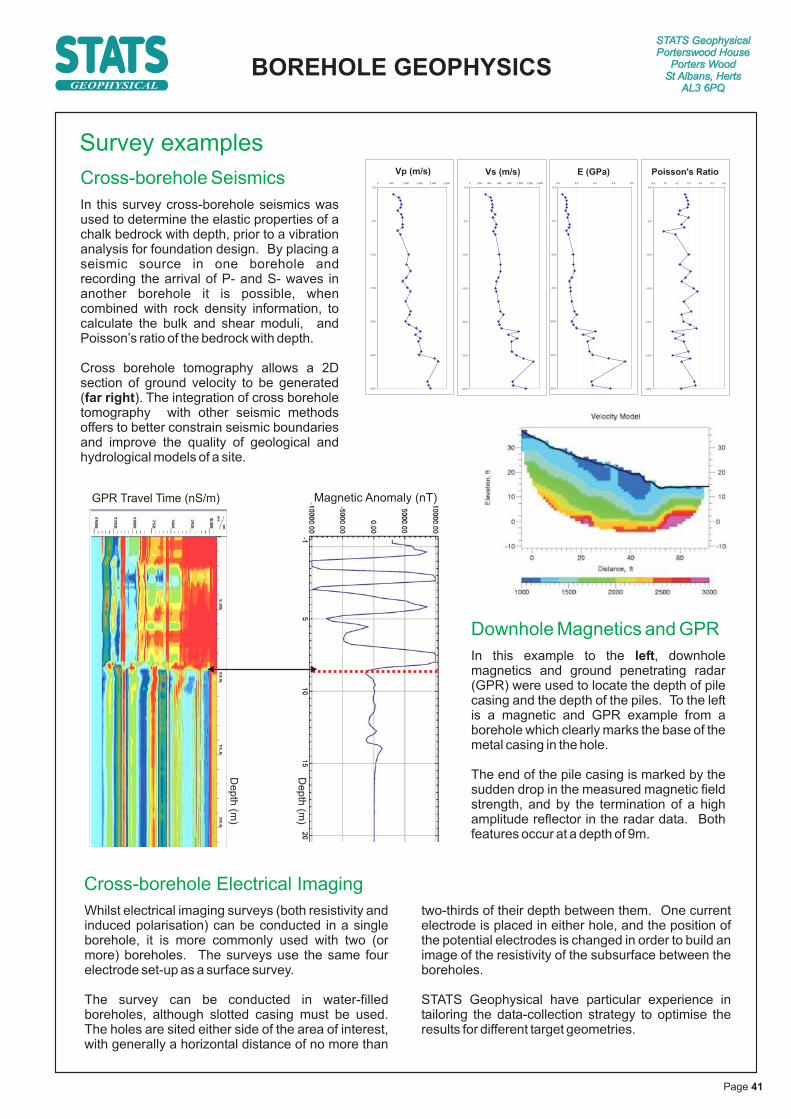
STATS GeophysicalPorterswood House
Porters WoodSt Albans, Herts
AL3 6PQ
BOREHOLE GEOPHYSICSGEOPHYSICAL
Whilst electrical imaging surveys (both resistivity andinduced polarisation) can be conducted in a singleborehole, it is more commonly used with two (ormore) boreholes. The surveys use the same fourelectrode set-up as a surface survey.
The survey can be conducted in water-filledboreholes, although slotted casing must be used.The holes are sited either side of the area of interest,with generally a horizontal distance of no more than
two-thirds of their depth between them. One currentelectrode is placed in either hole, and the position ofthe potential electrodes is changed in order to build animage of the resistivity of the subsurface between theboreholes.
STATS Geophysical have particular experience intailoring the data-collection strategy to optimise theresults for different target geometries.
Cross-borehole Electrical Imaging
E (GPa)
-30.0
-25.0
-20.0
-15.0
-10.0
-5.0
0.0
0.0 2.0 4.0 6.0 8.0
Poisson's Ratio
-30.0
-25.0
-20.0
-15.0
-10.0
-5.0
0.0
0.0 0.1 0.2 0.3 0.4 0.5 0.6
Vp (m/s)
-30.0
-25.0
-20.0
-15.0
-10.0
-5.0
0.0
0 500 1,000 1,500 2,000 2,500
Vs (m/s)
-30.0
-25.0
-20.0
-15.0
-10.0
-5.0
0.0
0 200 400 600 800 1,000 1,200 1,400
Survey examples
Cross-borehole Seismics
In this survey cross-borehole seismics wasused to determine the elastic properties of achalk bedrock with depth, prior to a vibrationanalysis for foundation design. By placing aseismic source in one borehole andrecording the arrival of P- and S- waves inanother borehole it is possible, whencombined with rock density information, tocalculate the bulk and shear moduli, andPoisson’s ratio of the bedrock with depth.
Cross borehole tomography allows a 2Dsection of ground velocity to be generated( ). The integration of cross boreholetomography with other seismic methodsoffers to better constrain seismic boundariesand improve the quality of geological andhydrological models of a site.
far right
Magnetic Anomaly (nT)GPR Travel Time (nS/m)D
epth
(m)
Depth
(m)
Downhole Magnetics and GPR
In this example to the , downholemagnetics and ground penetrating radar(GPR) were used to locate the depth of pilecasing and the depth of the piles. To the leftis a magnetic and GPR example from aborehole which clearly marks the base of themetal casing in the hole.
The end of the pile casing is marked by thesudden drop in the measured magnetic fieldstrength, and by the termination of a highamplitude reflector in the radar data. Bothfeatures occur at a depth of 9m.
left
Page 41

Linear anomaly in plan viewtracing the location of aburied service or drain
along the road
Depth
(m)
Individual hyperbolicreflections indicative of a
pipe or duct in the subsurface
Survey examples
Mapping anomalies acrossradar traces
By conducting GPR over a grid in twodirections, the data can be merged to formaccurate three dimensional volumes - evenin a crowded urban environments. The 3Dvolume can be manipulated to show slicesthrough the data. It is then possible to mapthe presence of spatially persistentanomalies across multiple survey lines.This is shown in this example tolocate buried services.
right
Geophysical Techniques Available�
�
�
Ground Penetrating RadarElectromagnetic Mapping (EM)Magnetic Gradiometry
Failure to identify accurately the location of buried servicesmay result in damage to property, cost to the client/developer,and at worst, result in death or injury to workers.
Geophysical techniques are capable of locating anddetermining the depth to services and hazards that can notbe traced by traditional radiodetection or surveyingapproaches. Accurate location and depth information can bedetermined for non-metallic services such as cable ducts orplastic or clay pipes and sewers.
Electromagnetic Mapping (EM)displaying a buried service
Low conductivities associatedwith low piles of rubble
Linear anomaly indicative ofa buried service or services
Successful determination of the location of utilitiesby radar is confirmed by subsequent ground-truthing.
ROAD
Due to their metallic content, buried servicesare often detectable by electromagneticmapping as shown in the example .below Interpreted results plan
STATS GeophysicalPorterswood House
Porters WoodSt Albans, Herts
AL3 6PQ
SERVICES AND UTILITY TRACINGGEOPHYSICAL
Our service search results can be lain overexisting site plans, with the different serviceshighlighted and depths given. These canthen used in conjunction with existingstatutory plans and visual inspection toidentify the service type.
Page 42

Page 43
GEOPHYSICAL
GLOSSARY
AND
INDEX

Apparent resistivity
Aquifer
Base station
Bedrock
Bouguer anomaly
Bouguer correction
CSW
Critical angle
Cultural noise
Data artefact
Data processing
DGPS
DNAPL
EM
ERT
Fourier analysis
Free air correction
The resistivity calculated from electrical resistances measured inthe field. Varies from true resistivity due to subsurfaceheterogeneity. true resistivity.
An active vibratingsource is used which provides a range of source frequencies.
A representation of data to aid analysis of its variation over differentfrequencies. time domain.
Sensor for detecting seismic waves in the subsurface. It works byproducing an electrical response proportional to the velocity of theground motion.
Subsurface water in the zone of saturation, including water below thewater table and water occupying pores and openings in underlyingrocks.
Ground Penetrating Radar.
A sensor for detecting seismic waves in water. It works bygenerating an electrical response proportional to changes inpressure.
The variation of an instrument’s response to the same input overtime; e.g. the change in repeat readings at the same base station.
c.f.
c.f.
A rock formation or soil zone that is saturated with groundwater andhas adequate permeability to produce water from wells or springs.
An arbitrary point in the survey area where repeat readings aretaken throughout the duration of the survey to allow correction ofinstrument drift and correlation between different surveys.
Consolidated mechanically competent rock underlying any loosesuperficial material such as soil, alluvium or marine sediments.
The resulting gravity values after tidal, latitude, free air, and Bouguercorrections have been applied to the data. It is commonly the finalpresented result, which is then interpreted, for a microgravitysurvey.
A correction applied to gravity data to account for the additionalmass of rock between the survey point and the datum level.
Continuous Surface Wave. This technique uses the propagationproperties of Surface Waves and their depth of penetration, whichvaries due to wavelength and hence frequency.
Surface Wave velocity is dependant on the soil stiffness with depth.
The least angle at which total reflection of an electromagnetic orseismic wave occurs.At the critical angle the wave is refracted alongthe interface between media.
This can affect any geophysical instrument, particularly in urbanareas, and includes the effects of man made objects, treemovements, or any other activity which can affect the geophysicalsignal.
An object in the data which, although looks real, is a product ofdistortion from an extrinsic agent.
Consists of filtering the raw data to remove or reduce backgroundnoise, outliers and to enhance signals. Various algorithms, gainsand data shifts can be applied to account for sensor position andother real world offsets and adjustments.
Differential Global Positioning System. An enhanced version ofGPS that allows greater accuracy.
Dense Non-Aqueous Phase Liquid. A liquid that is more dense thanwater and does not dissolve in water. (e.g. chlorinated solvents).Can be detected by electrical resistivity imaging, EM groundconductivity, and GPR techniques. LNAPL.
Electromagnetic.
Electrical Resistivity Tomography. Alternative name for ElectricalResistivity Imaging. Amethod of producing 2D and 3D models of thesubsurface resistivity distribution.
The mathematical decomposition of a waveform into its constituentfrequencies. Often used in the process of converting time domain(TD) data to the frequency domain (FD) and vice versa.
A correction applied to gravity data to account for the change indistance from the centre of the Earth between the survey point andthe datum level.
cf.
Frequency domain (FD)
Geophone
Groundwater
GPR
Hydrophone
Instrument drift
Dielectric constant
Eddy current
EM Ground Conductivity
Geophysics
Head wave
Hyperbolic reflection
Induced Polarisation
Inversion
The function of different materials within a medium. Determines thevelocity an EM wave through a medium. Changes in the constantbetween two media result in wave reflections. The larger thecontrast, the stronger the reflection (i.e. metal in concrete generatesa strong reflection signal in GPR data).
Induced when a conductor moves through a non-uniform EM field.This generates a circular flow of electrons (the current) within theconductor, and thus opposes the change of the EM field.
Electromagnetic waves are transmitted from the surface, and inducecurrents in conductive bodies in the subsurface. These eddy currentsare then recorded at the surface. Variations in the electromagneticfield thus indicate contrasts in the ground conductivity.
Uses the principles of physics to measure the properties of the Earth.These include local variations in the Earth's gravitational andmagnetic fields, elastic wave analysis through seismology andelectromagnetic pulses to determine contrasts in subsurfaceproperties.
The basis for seismic refraction surveys, the head wave travelsupward from an interface when incident waves strike it at the criticalangle.
Energy from a GPR antenna is transmitted conically. Due to thisbroad energy pattern, when the antenna crosses a target (i.e. buriedpipes or reinforcement) the shape of the reflection is hyperbolic innature.
The subsurface can both dissipate and store energy generated by anelectrical current. IP measures this ability to store energy, whilstresistivity measures the amount of dissipation.
This process is used in resistivity surveys and uses an algorithm orcode in order to generate a true resistivity model from the measuredapparent resistivity in the raw data.
Page 44
STATS GeophysicalPorterswood House
Porters WoodSt Albans, Herts
AL3 6PQ
GLOSSARYGEOPHYSICAL

STATS GeophysicalPorterswood House
Porters WoodSt Albans, Herts
AL3 6PQ
GLOSSARYGEOPHYSICAL
Latitude correction
Leachate
LNAPL
MEC
NAPL
NDT
P-wave
Penetration depth
Plume
Pseudosection
Resistivity
S-wave
Saturated zone
Tidal correction
Time domain (TD)
True resistivity
UST
UXB
UXO
Vadose zone
Water table
Acorrection applied to gravity data to account for the global variationof gravitational attraction with latitude.
The liquid that accumulates in a landfill mostly as a result ofprecipitation percolating through the waste. The presence ofleachate (whether contained in a landfill or leakage beyond thelandfill) can be detected by electrical resistivity and EM conductivity.
Light Non-Aqueous Phase Liquid. A liquid that is less dense thanwater and does not dissolve in water (e.g. petroleum hydrocarbons).Can be detected by electrical resistivity imaging, EM groundconductivity, and GPR techniques. DNAPL.
Munitions and Explosives of Concern.Another term for UXO.
Non-Aqueous Phase Liquid. A liquid that does not dissolve in water.Can be sub-divided into LNAPLand DNAPL.
Non-Destructive Testing.
A seismic wave in which particle motion is in the direction ofpropagation. Usually the first type of seismic wave to reach areceiver. S-wave.
The maximum depth at which a geophysical technique providesuseful information about the subsurface. Dependant on thetechnique being used, the local conditions, and the type of target.
Contaminant plume - a mixture of waste chemicals, or leachate, andgroundwater usually in solution form.
A 2D graphical representation of how a measured parameter varieswith location and depth. Requires inversion of the data to beconverted into a 2D model (cross-section).
An intrinsic property of a material which resists the flow of anelectrical current within the material. Typically calculated from theinversion of apparent resistivity data collected in the field.apparent resistivity
A seismic wave in which particle motion is perpendicular to thedirection of propagation. Usually the second type of seismic wave toreach a receiver. P-wave.
The saturated region of the subsurface beneath the water table.
Acorrection applied to gravity data to account for the diurnal variationin gravitational attraction due to the relative positions of the sun andmoon.
A representation of data to aid analysis of its variation over time. cfrequency domain.
See resistivity.
Underground Storage Tank. Often found on former industrial sites,particularly petrol stations. Can be detected using GPR and EMground conductivity techniques.
UneXploded Bomb. Explosive weapons dropped by aircraft that didnot explode. Can be detected by magnetic, EM ground conductivityand radar techniques. . UXO.
UneXploded Ordnance. Explosive weapons that have not exploded.Includes artillery shells and UXBs. Can be detected by magnetic,EM ground conductivity and radar techniques.
Also termed the unsaturated zone. The region of the subsurfacebetween the ground surface and the water table.
The boundary between the vadose zone and the saturated zone.The form of the boundary is a function of the local topography,geology, and seasonal climatic variations.
cf.
cf.
c.f.
cf.
f.
cf
Magnetic Gradiometry
Microgravity
Raw Data
Residual gravity anomaly
Self Potential
Stacking
Surface Wave
Surface Wave Ground Stiffness
Travel Time
Wavelet analysis
A Magnetic Gradiomater can determine the local gradient of amagnetic field by employing two magnetometers that are separatedby a fixed distance, and measure simultaneously the gradient in thedirection of the line of the detectors.
A technique that measures relative variations in the Earth'sgravitational field, once subjected to a number of processes. freeair correction, latitude correction, Bouguer correction, Residualgravity anomaly, Base station.
When data is collected in the field before any processing is applied,the data is termed raw.
The resulting gravity data once all corrections have been made (c.f.microgravity) is termed the residual gravity anomaly. It indicateswhere there is a density contrast in the subsurface - eg a negativeanomaly may indicate a void.
The difference in natural electrical properties between two points onthe ground surface is termed Self Potential. The potentials aretypically generated by groundwater flow, mineral deposits andchemical diffusion.
By adding together signals which have essentially the same content,one can improve the signal to noise ration, thus enhancing signals inthe radar or seismic dataset.
The term for a seismic wave that travels along the surface of theEarth, such as a Rayleigh Wave.
Although the theory is similar to CSW, SWGS uses a combination ofmicrotremor surveys - a low frequency passive source - and a highfrequency active source, such as a hammer blow.
The arrival time of a wave from a source. Used in GPR and Seismicsurveys.
A wavelet is a waveform within a waveform, thus analysing its shapecan indicate potential features within the data.
c.f.
Page 45
We are happy to advice on principals andtechniques. Feel free to contact us on:
01727 [email protected]/geophysics
0
TEW
Need further help or advice?
STATS GeophysicalPorterswood House
Porters WoodSt Albans, Herts
AL3 6PQ
INDEX
Archaeology
Borehole Geophysics
Brownfield Sites
Contaminated Land
EM Ground Conductivity
Geology
Ground Penetrating Radar
Historic Buildings
Induced Polarisation
Landfill Sites
Magnetics
Microgravity
Resistivity
Seismic
Self Potential
Services and Utility Tracing
Structures
Voids and Soft Ground
RefractionReflectionSurface Wave
24, 25,
40, 41
26, 27,
30, 31
8, 9,
32, 33,
6, 7,
38, 39
12
28, 29,
14, 15,
16, 17,
10, 11,
18, 19,2220, 21
13
42,
36, 37,
34, 35,
15
6, 9, 14, 15
24, 26, 27, 28, 29, 30, 31
18, 19, 21, 22
25, 31, 32, 34, 36, 37, 38, 39, 41
9, 11, 12, 13
24, 25, 27, 41
33, 35
28, 29, 30, 32, 33, 35, 41
29, 32, 40
7, 9, 26, 27
7
7, 17
Page 46
Page numbers in denote principal section.Page numbers in standard text denote examples.
bold
GEOPHYSICAL
A member of the RSK Group, STATS is a leading consultancy practice with allied technical resources providingspecialist support services to the property, infrastructure, land development, construction and constructionmaterials sectors. The skills and abilities of our team of over 130 professional and technical staff have beendeveloped to provide our clients with practical and innovative solutions whilst retaining the traditional values of aquality service.
Geophysical surveyingDesk studies Sampling
Site appraisal Coring & drilling
Thematic mapping Investigation
Environmental auditing In situ testing
Computer modeling Confined space & roped access
Risk assessment Instrumentation
Environmental impact assessment Telemetry
Engineering analysis Ground Monitoring
Engineering & environmental design Structures & Materials Consultancy & advice
Value engineering Environment Non-destructive testing
Environmental management On-site laboratory testing
Database & internet services QA/QC Inspection
Project management Product & component testing
Contract administration Environmental simulation
CDM planning supervisors Petrographic examination
Problem solving Chemical analysis
Expert witness Laboratory testing
Training
STATS Geophysical’s principal services cover the following areas:
Geophysical surveys for:• Archaeology• Brownfield investigations• Landfill surveys• Contaminated Land• Geology, stratigraphy and depth to bedrock
• Structural investigations and reinforcement• Non-destructive imaging of foundations• Historic Building surveys for stone and internal metal• Borehole surveys and tomography• Service and Utility Tracing
STATS LimitedPorterswood HousePorters WoodSt AlbansHertfordshireAL3 6PQ
Tel 01727 833 261Fax 01727 798 630
[email protected]@stats.co.uk
Websitewww.stats.co.ukwww.stats.co.uk/geophysics