A quantitative analysis Juan D. Montoro-Pons · A quantitative analysis Juan D. Montoro-Pons...
42
On the performance of record labels A quantitative analysis Juan D. Montoro-Pons Departamento de Econom´ ıa Aplicada Universitat de Val` encia May 14, 2013
Transcript of A quantitative analysis Juan D. Montoro-Pons · A quantitative analysis Juan D. Montoro-Pons...

On the performance of record labelsA quantitative analysis
Juan D. Montoro-Pons
Departamento de Economıa AplicadaUniversitat de Valencia
May 14, 2013

Introduction
The recorded music market has been primarily studied from the consumerperspective. Attempts to analyze it from the industry perspective includespapers concentrated in three main areas
1 Theoretical studies on the impact of piracy on firms’ profits. SeePeitz and Waelbroeck (2006) as a survey on previous work, or Alcalaand Gonzalez-Maestre (2010) and Minniti and Vergari (2010) asexamples of two recent developments.
2 Analysis of the commercial success and its concentration, mainly bylooking by the information provided by charts, as in Cox et al (1995),Strobl and Tucker (2000), Giles (2006)...
3 Analysis of the structure of the industry/business models using a mixof theoretical and qualitative/quantitative analysis. Examples areGander and Riepel (2004), Bourreau et al. (2012)
Juan D. Montoro-Pons (UV) Performance of record labels May 2013 2 / 27

Goals
1 To gain descriptive insights on the performance of record labels.
2 To single out the factors that explain record label profits
3 To try to map, at a later step, performance to specific business models
Juan D. Montoro-Pons (UV) Performance of record labels May 2013 3 / 27

Goals
1 To gain descriptive insights on the performance of record labels.
2 To single out the factors that explain record label profits
3 To try to map, at a later step, performance to specific business models
Juan D. Montoro-Pons (UV) Performance of record labels May 2013 3 / 27

Goals
1 To gain descriptive insights on the performance of record labels.
2 To single out the factors that explain record label profits
3 To try to map, at a later step, performance to specific business models
Juan D. Montoro-Pons (UV) Performance of record labels May 2013 3 / 27

Research question
What determines profits in record labels? Potential answers from theliterature:
1 From an industrial economics perspective, (abnormal) profits emergeat the industry level as a consequence of barriers (cost, regulation,concentration...) that prevent competition. One could rule outbetween-industry analysis but yet the dual nature of the industry (anoligopoly + a competitive segment) allows us to reach someconclusions.
2 From a strategic management perspective, specific resources at thefirm level may explain the outperformance of certain firms. Theseassets can be tangible or intangible such as organization structures ormanagement practices to mention two.
3 Finally the accounting/finance literature has a separate but relatedstrand of literature concerning the random walk as a descriptor of theTS dynamics observed in profits.
Juan D. Montoro-Pons (UV) Performance of record labels May 2013 4 / 27

Methodology
This empirical research is based on the quantitative analysis of profits in asample of record labels in Europe for 4 different countries over a period often years.
Given the nature of the data the analysis is based in multilevelmodels, although panel data techniques are also considered.
Even though the main results are quantitative, at a further step aqualitative analysis could be designed in order to gain further insightsinto record-labels that outperform the average firm and try to linkthat with, i.e. specific business models, catalogue features...
At this stage all the results are preliminary and a further inclusion ofcountries —to increase between country variability— should beconsidered.
Juan D. Montoro-Pons (UV) Performance of record labels May 2013 5 / 27

Data (i)
Data are obtained from Amadeus, a database compiled by Bureau vanDijk of comparable financial information for public and private companiesacross Europe. Overall the database includes roughly 19m companies of 43european countries. Some details about the sample:
Data were gathered for 225 record labels in four European countries:Austria, Spain, Sweden and the UK.
Data were selected for all the available years, which is (in the bestcase) from 2003 to 2012 (although very few observations for 2012were available), making a total of 10 years.
Record labels were selected on a first round based on their beingmembers of IFPI in the four target countries. The dataset wasenlarged in a second round to include IMPALA members that werenot members of IFPI.
Juan D. Montoro-Pons (UV) Performance of record labels May 2013 6 / 27

Data (ii)
The following information was gathered for every firm (when available)included in the sample:
Different measures of performance: return on total assets (roa), profitmargin (p/l before tax over operating revenue), gross profit marginand ebitda margin.
Different measures of a firm’s size: number of employees, total assets,total fixed assets.
Market relevance: total turnover and sales.
Balance structure indicators: liquidity ratio and gearing ratio.
Information about ownership and number of shareholders.
Juan D. Montoro-Pons (UV) Performance of record labels May 2013 7 / 27
Data (iii)
Additionally two more covariates were generated from the sampleinformation:
Share in the domestic market: we used total turnover in a year tocompute the % of the domestic market that each firm commands.
Major. A dummy was generated based on the information aboutglobal ultimate owner to identify whether a firm was a major. In short,major was equal to 1 for any firm the GUO of which was Vivendi,Sony Corporation, AI Entertainment Holdings LLC. or Citigroup Inc.
Juan D. Montoro-Pons (UV) Performance of record labels May 2013 8 / 27

The sample
The samples is comprised of 8 record labels in Austria, 50 in Spain, 137 inUK and 30 in Sweden.
. tab country
Country ISOcode Freq. Percent Cum.
AT 80 3.56 3.56ES 500 22.22 25.78GB 1,370 60.89 86.67SE 300 13.33 100.00
Total 2,250 100.00
Juan D. Montoro-Pons (UV) Performance of record labels May 2013 9 / 27

Descriptive statistics
. tab bvd country
BvDindependen
ce Country ISO codeindicator AT ES GB SE Total
- 0 30 30 0 60A+ 0 0 50 0 50A- 0 10 0 0 10B+ 0 20 280 0 300B- 0 10 0 0 10D 70 210 970 100 1,350U 10 220 40 200 470
Total 80 500 1,370 300 2,250
Juan D. Montoro-Pons (UV) Performance of record labels May 2013 10 / 27

Descriptive statistics
. tabstat roausingplbeforetax turnover totalassets numberofemployees share, by> (country)
Summary statistics: meanby categories of: country (Country ISO code)
country roausi~x turnover totala~r number~s share
AT .14045 11380.13 8562.878 22.86957 .28125ES -.0193021 5656.027 7273.398 16.36201 .03003GB .0662031 31875.37 47306.34 87.01351 .0253807SE -.0228843 2684.119 2839.789 6.024 .0371747
Total .0155238 15105.59 30795.81 33.48062 .0379377
Juan D. Montoro-Pons (UV) Performance of record labels May 2013 11 / 27
Descriptive statistics
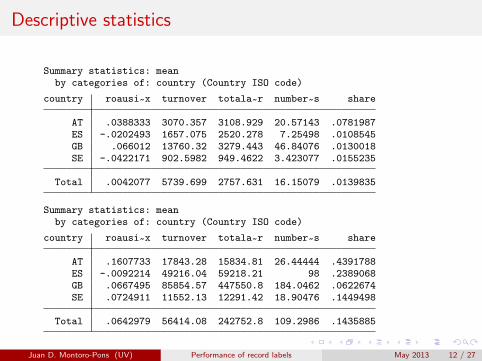
Summary statistics: meanby categories of: country (Country ISO code)
country roausi~x turnover totala~r number~s share
AT .0388333 3070.357 3108.929 20.57143 .0781987ES -.0202493 1657.075 2520.278 7.25498 .0108545GB .066012 13760.32 3279.443 46.84076 .0130018SE -.0422171 902.5982 949.4622 3.423077 .0155235
Total .0042077 5739.699 2757.631 16.15079 .0139835
Summary statistics: meanby categories of: country (Country ISO code)
country roausi~x turnover totala~r number~s share
AT .1607733 17843.28 15834.81 26.44444 .4391788ES -.0092214 49216.04 59218.21 98 .2389068GB .0667495 85854.57 447550.8 184.0462 .0622674SE .0724911 11552.13 12291.42 18.90476 .1449498
Total .0642979 56414.08 242752.8 109.2986 .1435885
Juan D. Montoro-Pons (UV) Performance of record labels May 2013 12 / 27

Descriptive statistics0
24
6
-1 -.5 0 .5 1 -1 -.5 0 .5 1
0 1
Den
sity
roausingplbeforetaxGraphs by major
Juan D. Montoro-Pons (UV) Performance of record labels May 2013 13 / 27
Descriptive statistics
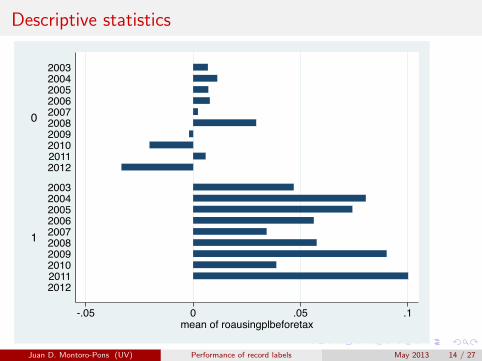
-.05 0 .05 .1mean of roausingplbeforetax
1
0
2012201120102009200820072006200520042003
2012201120102009200820072006200520042003
Juan D. Montoro-Pons (UV) Performance of record labels May 2013 14 / 27

Descriptive statistics
0 .1 .2 .3mean of roausingplbeforetax
1
0
2012201120102009200820072006200520042003
2012201120102009200820072006200520042003
Juan D. Montoro-Pons (UV) Performance of record labels May 2013 15 / 27

Descriptive statistics
-.2 -.1 0 .1 .2mean of roausingplbeforetax
1
0
2012201120102009200820072006200520042003
2012201120102009200820072006200520042003
Juan D. Montoro-Pons (UV) Performance of record labels May 2013 16 / 27
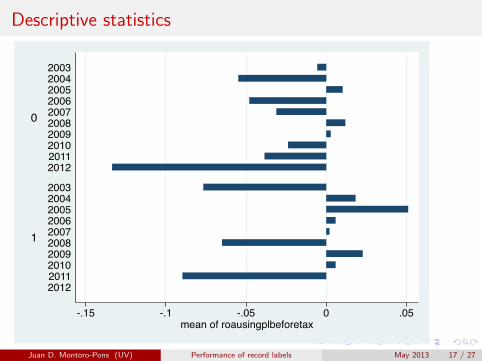
Descriptive statistics
-.15 -.1 -.05 0 .05mean of roausingplbeforetax
1
0
2012201120102009200820072006200520042003
2012201120102009200820072006200520042003
Juan D. Montoro-Pons (UV) Performance of record labels May 2013 17 / 27

Descriptive statistics
0 .05 .1 .15mean of roausingplbeforetax
1
0
2012201120102009200820072006200520042003
2012201120102009200820072006200520042003
Juan D. Montoro-Pons (UV) Performance of record labels May 2013 18 / 27
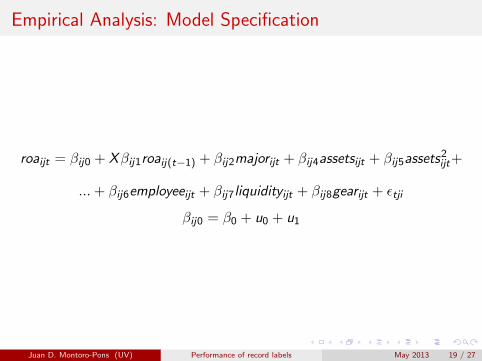
Empirical Analysis: Model Specification
roaijt = βij0 + Xβij1roaij(t−1) + βij2majorijt + βij4assetsijt + βij5assets2ijt+
...+ βij6employeeijt + βij7liquidityijt + βij8gearijt + εtji
βij0 = β0 + u0 + u1
Juan D. Montoro-Pons (UV) Performance of record labels May 2013 19 / 27

Empirical Analysis: ANOVA
. xtmixed roa || cntry: ||id:,var
Mixed-effects ML regression Number of obs = 993
No. of Observations per GroupGroup Variable Groups Minimum Average Maximum
cntry 4 18 248.2 382id 149 1 6.7 10
Wald chi2(0) = .Log likelihood = 194.5293 Prob > chi2 = .
roausingplbeforetax Coef. Std. Err. z P>|z| [95% Conf. Interval]
_cons .0209351 .027335 0.77 0.444 -.0326405 .0745106
Random-effects Parameters Estimate Std. Err. [95% Conf. Interval]
cntry: Identityvar(_cons) .0021389 .0023262 .0002538 .0180277
id: Identityvar(_cons) .0106165 .0024066 .0068081 .0165553
var(Residual) .0334669 .0016852 .0303217 .0369383
LR test vs. linear regression: chi2(2) = 103.00 Prob > chi2 = 0.0000
Note: LR test is conservative and provided only for reference.
Juan D. Montoro-Pons (UV) Performance of record labels May 2013 20 / 27
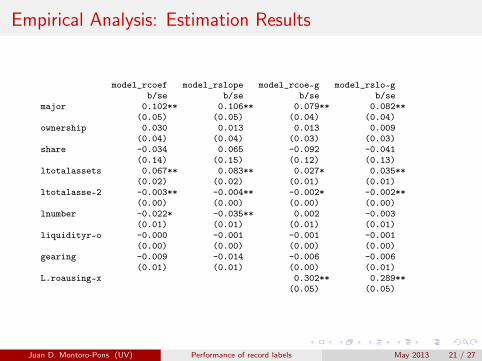
Empirical Analysis: Estimation Results
model_rcoef model_rslope model_rcoe~g model_rslo~gb/se b/se b/se b/se
major 0.102** 0.106** 0.079** 0.082**(0.05) (0.05) (0.04) (0.04)
ownership 0.030 0.013 0.013 0.009(0.04) (0.04) (0.03) (0.03)
share -0.034 0.065 -0.092 -0.041(0.14) (0.15) (0.12) (0.13)
ltotalassets 0.067** 0.083** 0.027* 0.035**(0.02) (0.02) (0.01) (0.01)
ltotalasse~2 -0.003** -0.004** -0.002* -0.002**(0.00) (0.00) (0.00) (0.00)
lnumber -0.022* -0.035** 0.002 -0.003(0.01) (0.01) (0.01) (0.01)
liquidityr~o -0.000 -0.001 -0.001 -0.001(0.00) (0.00) (0.00) (0.00)
gearing -0.009 -0.014 -0.006 -0.006(0.01) (0.01) (0.00) (0.01)
L.roausing~x 0.302** 0.289**(0.05) (0.05)
Juan D. Montoro-Pons (UV) Performance of record labels May 2013 21 / 27

The effect of size0
.1.2
.3.4
y
0 5 10 15 20x
0.1
.2.3
.4y
0 5 10 15 20x
-.3-.2
-.10
.1y
0 5 10 15 20x
-.1-.05
0.05
.1.15
y
0 5 10 15 20x
Juan D. Montoro-Pons (UV) Performance of record labels May 2013 22 / 27

Distribution of size by type of label0
.2.4
.6
0 5 10 15 0 5 10 15
0 1
Den
sity
ltotalassetsGraphs by major
Juan D. Montoro-Pons (UV) Performance of record labels May 2013 23 / 27

The effect of size0
.2.4
.6
4 6 8 10 12 4 6 8 10 12
0 1
Den
sity
ltotalassetsGraphs by major
0.2
.4.6
0 5 10 0 5 10
0 1
Den
sity
ltotalassetsGraphs by major
0.5
1
0 5 10 15 0 5 10 15
0 1
Den
sity
ltotalassetsGraphs by major
0.2
.4.6
0 5 10 15 0 5 10 15
0 1
Den
sity
ltotalassetsGraphs by major
Juan D. Montoro-Pons (UV) Performance of record labels May 2013 24 / 27
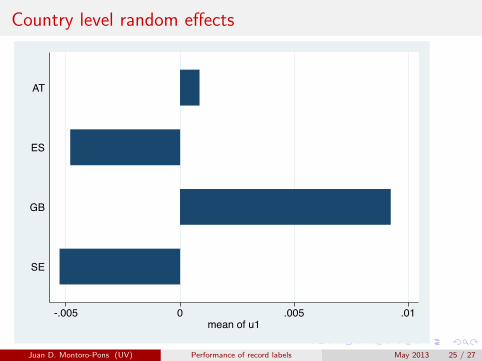
Country level random effects
-.005 0 .005 .01mean of u1
SE
GB
ES
AT
Juan D. Montoro-Pons (UV) Performance of record labels May 2013 25 / 27

Firm level random effects
-.04 -.02 0 .02 .04mean of u0
Major
Indep
SE
GB
ES
AT
SE
GB
ES
AT
Juan D. Montoro-Pons (UV) Performance of record labels May 2013 26 / 27

Preliminary conclusions
The estimated effect of majors on profits is positive, and itsmagnitude is of about +0.1. This premium (which cannot be relatedto other facts such as size, which is already controlled for) isconsistent with the existence of barriers between the two segments ofthe industry (in line with the industrial economics literature).
As for size (measured by assets) data show there is a threshold suchthat profits start to decrease in size from it. We found different sizethreshold values depending on the specific model, but in most cases itwas found that
Majors are larger than this profit-maximizing sizeIndependent labels are, in general, much smaller that this threshold.
Surprisingly, there is no evidence of a country effect. It could be dueto the unbalanced sample (i.e., too may observations concentrated inone market) that hinders between country variability. Hence includingfurther markets should be a next step in the research.
Juan D. Montoro-Pons (UV) Performance of record labels May 2013 27 / 27