A Maintenance Management Tool
12
O.~,tEGA Int. J. of Mgmt $ci.. Vol. 18, No. I. pp. 59-70. 1990 0305-0483 90 S3,00 + 0.00 Printed in Great Britain Pergamon Press plc A Maintenance Management Tool LM PINTELON Afdeling Industrieel Beleid, Belgium LN VAN WASSENHOVE Erasmus University, Rotterdam, The Netherlands (Received June 1988: in ret,ised form September 1989) This paper presents a structured Maintenance Management Tool (MMT). There is a great need for such tools although very few integrated efforts were made in the past. The MMT described here serves two purposes: to he a decision support tool for maintenance managers in industry and to he a vehicle for further research on maintenance decision-making. The concept has already received active interest from several Belgian companies. The MMT consists of two parts: A Control Board (CB) with different sets of performance indicators, each set corresponding to a different area of maintenance management and, functionally linked with the CB, a structured network of Detailed Reports (DR), which provide more disaggregated information. The MMT is not only useful to evaluate past actions but can also be used in continual improvement programs. As such the concept fits into the renewed interest for performance reporting observed in other areas, such as production control and logistics. 1. INTRODUCTION MAINTENANCE MANAGEMENTis one of those business functions that has always been largely neglected. Everyone has long been convinced that application of Operational Research (OR) techniques to such areas as inventory control and production planning is very valuable. Maintenance, unfortunately, is still often con- sidered as an unavoidable and uncontrollable cost factor. During the past two decades, how- ever, there appears to have been a steadily increasing interest in maintenance management as one of the key support functions of produc- tion. Some of the most important reasons for this evolution are: a growing competitive pres- sure that necessitates stringent cost control, a trend towards further automation that calls for highly reliable production equipment and, of course, the recent interest in Japanese manage- ment philosophies with their process-oriented view of production. This increased interest in maintenance man- agement, from the academic as well as from the industrial world, can be observed in different 59 places. There is a growing number of publi- cations on maintenance management in specific maintenance journals and in more generally oriented OR journals. Many conferences for maintenance managers are being organized. Consultants discover the maintenance market and a lot of maintenance oriented software is now being written. MMISs (Maintenance Management Information Systems) have become very popular: many packages for micro or mainframe computers appear on the market, several papers describe the requirements for and the features of MMISs and many companies consider implementation or development of MMIS. These MMISs consist of different modules such as equipment, bill of materials, spare parts inventory control, personnel management and work order management. Most of these packages are geared to adminis- trative and accounting control and are not really management tools. Reporting facilities are also typically weak in this type of software. An efficient maintenance performance system is not only expected to report on the perfor- mance of the maintenance department, but also
description
maintenance
Transcript of A Maintenance Management Tool

O.~,tEGA Int. J. of Mgmt $ci.. Vol. 18, No. I. pp. 59-70. 1990 0305-0483 90 S3,00 + 0.00 Printed in Great Britain Pergamon Press plc
A Maintenance Management Tool
L M P I N T E L O N
Afdeling Industrieel Beleid, Belgium
L N V A N W A S S E N H O V E
Erasmus University, Rotterdam, The Netherlands
(Received June 1988: in ret,ised form September 1989)
This paper presents a structured Maintenance Management Tool (MMT). There is a great need for such tools although very few integrated efforts were made in the past. The MMT described here serves two purposes: to he a decision support tool for maintenance managers in industry and to he a vehicle for further research on maintenance decision-making. The concept has already received active interest from several Belgian companies. The MMT consists of two parts: A Control Board (CB) with different sets of performance indicators, each set corresponding to a different area of maintenance management and, functionally linked with the CB, a structured network of Detailed Reports (DR), which provide more disaggregated information. The MMT is not only useful to evaluate past actions but can also be used in continual improvement programs. As such the concept fits into the renewed interest for performance reporting observed in other areas, such as production control and logistics.
1. INTRODUCTION
MAINTENANCE MANAGEMENT is one of those business functions that has always been largely neglected. Everyone has long been convinced that application of Operational Research (OR) techniques to such areas as inventory control and production planning is very valuable. Maintenance, unfortunately, is still often con- sidered as an unavoidable and uncontrollable cost factor. During the past two decades, how- ever, there appears to have been a steadily increasing interest in maintenance management as one of the key support functions of produc- tion. Some of the most important reasons for this evolution are: a growing competitive pres- sure that necessitates stringent cost control, a trend towards further automation that calls for highly reliable production equipment and, of course, the recent interest in Japanese manage- ment philosophies with their process-oriented view of production.
This increased interest in maintenance man- agement, from the academic as well as from the industrial world, can be observed in different
59
places. There is a growing number of publi- cations on maintenance management in specific maintenance journals and in more generally oriented OR journals. Many conferences for maintenance managers are being organized. Consultants discover the maintenance market and a lot of maintenance oriented software is now being written. MMISs (Maintenance Management Information Systems) have become very popular: many packages for micro or mainframe computers appear on the market, several papers describe the requirements for and the features of MMISs and many companies consider implementation or development of MMIS. These MMISs consist of different modules such as equipment, bill of materials, spare parts inventory control, personnel management and work order management. Most of these packages are geared to adminis- trative and accounting control and are not really management tools. Reporting facilities are also typically weak in this type of software.
An efficient maintenance performance system is not only expected to report on the perfor- mance of the maintenance department, but also

60 Pintelon, Van Wassenhove--A Maintenance Management Tool
has to offer an opportunity for in-depth analysis without investing too much time. All this re- quires consistent, updated and well managed databases. In practice very few of the existing information systems satisfy these needs.
In maintenance literature little is found on performance reporting. There is, to the best of our knowledge, almost no recent work on this topic. Some authors [7, 9, 11, 12] provide lists of performance indicators (PIs). These PIs give information on maintenance costs, work order management, personnel and equipment perfor- mance. Often maintenance costs are related to external data, such as the replacement value of the equipment. The PIs mentioned by the differ- ent authors are very similar and often little information is given on how to use them (except for some suggestions at the managerial level and on the frequency of reporting). The same type of indicators are found on checklists used by maintenance consultants for a quick analysis of the performance of their clients and in macro- economic surveys carried out for specific indus- trial sectors [I, 3, 4]. It would be unjust to state that these lists of performance indicators consti- tute the whole literature on maintenance perfor- mance. Corder [2] for instance, proposes to evaluate global maintenance performance with one fairly rough indicator. The Nippon Denso method [7] uses 14 indicators to evaluate both maintenance and production engineering. From these indicators, five are selected and integrated into one short-term PI for the maintenance department. Priel [15] and Noiret [13] fill out a kind of elementary control board with several groups of indicators.
Hibi [7] tries to combine all possible efficiency measures into one short-term PI and one long- term PI. The evolution of the latter is pictured graphically. Hibi is one of the few authors who thoroughly studied maintenance performance reporting. In our experience the Hibi system is too rigid to be used in practice. A lot of detailed information is needed to compute the two PIs and whenever some data are missing (which is often the case) it becomes really difficult to obtain a reliable result. Besides the obvious time-based follow-up of some indicators the multifactor graphs of Luck [8] must be men- tioned. Luck draws four multifactor graphs (planning, work load, cost, productivity) which he combines into one overall multifactor per- formance graph. The same idea is found in
Newbrough [I1], who proposes a multi-index profile on which some relevant PIs are plotted.
Since maintenance management is an impor- tant topic in production and operations man- agement and since performance reporting is a key factor in every control system, it is essential for every organization to have an efficient maintenance performance evaluation pro- cedure. It is our experience that many main- tenance managers feel the need for a good performance evaluation tool. To date these tools are neither readily available in literature nor in the field. The Maintenance Management Tool concept (MMT) described in this paper attempts to show how such a tool can be developed.
The paper is organized as follows: Section 2 describes the Maintenance Management Tool; Section 3 illustrates the use of the MMT; Sec- tion 4 reports on some implementation aspects; Section 5 describes the usefulness of the MMT as a research tool and Section 6 summarizes the conclusions.
2. THE MAINTENANCE MANAGEMENT TOOL (MMT)
The MMT is designed as a tool to evaluate maintenance performance. Performance is thor- oughly examined on five different domains (costs, equipment performance, personnel per- formance, materials management and work order control) and on different levels of aggre- gation. Only those aspects of maintenance that are really under control of the maintenance manager are reported.
The MMT consists of two parts: a Control Board (CB), and a network of Detailed Reports (DR). The CB has a signal function, it highlights those areas of maintenance management where something went wrong (symptoms), or where something is likely to go wrong in the near future. The DR help to make a proper diagnosis of those symptoms and, if possible, induce suggestions for an appropriate remedy. The MMT also allows the maintenance manager to put some performance indicators in a time perspective, either for trend analysis or forecast- ing purposes.
The control board (Figs 1 and 2)
The control board (CB) is a one page sum- mary of maintenance performance indicators. It
Omega, Vol. 18, No. I 61
Control Board--Period T
Ratio Actual Expected Target Notes Attention
BUDGET (1) Costs (period T) (2) Costs (year-to-date) (3) Wages (4) Material (5) Subcontracting (6) Miscellaneous
EQUIPMENT (7) Number of failures (8) Reliability (9) Maintainability
(10) Availability (11 ) Unit operating cost (12) Losses per unit
PERSONNEL (1 3) Percentage overtime (14) Percentage absence
MATERIAL (1 5) inventory turnover (16) Service rate
JOBS (17) Breakdown ratio (18) Planning rate (19) Planning execution (20) Service rate (21) Backlog
92% 98% 97% new m/c ALERT
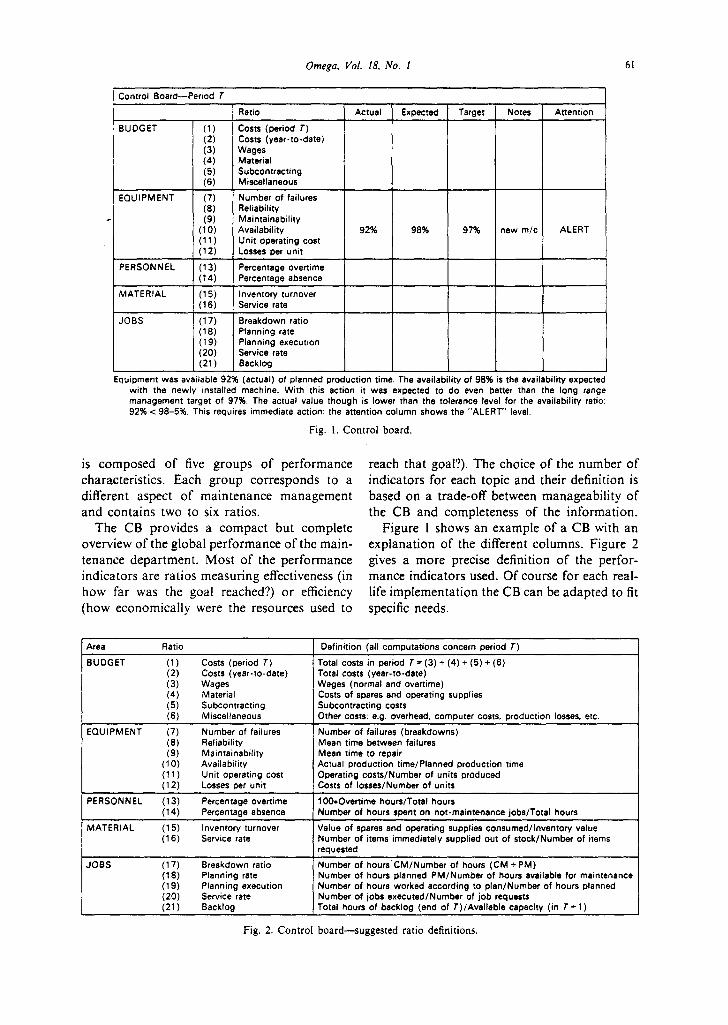
Equipment was available 92% (actual) of planned production time. The availability of 98% is the availability expected with the newly installed machine. With this action it was expected to do even better than the long range management target of 97%. The actual value though is lower than the tolerance level for the availability ratio: 92% < 98-5% This requires immediate action: the attention column shows the "ALERT" level.
Fig. 1. Control board.
is composed of five groups of performance characteristics. Each group corresponds to a different aspect of maintenance management and contains two to six ratios.
The CB provides a compact but complete overview of the global performance of the main- tenance department. Most of the performance indicators are ratios measuring effectiveness (in how far was the goal reached?) or efficiency (how economically were the resources used to
reach that goal?). The choice of the number of indicators for each topic and their definition is based on a trade-off between manageability of the CB and completeness of the information.
Figure l shows an example of a CB with an explanation of the different columns. Figure 2 gives a more precise definition of the perfor- mance indicators used. Of course for each real- life implementation the CB can be adapted to fit specific needs.
Area Ratio Definition (all computations concern period T)
BUDGET (1) Costs (period T) Total costs in period T = ( 3 ) + ( 4 ) + ( 5 ) + ( 6 ) (2) Costs (year-to-date) Total costs (year-to-date) (3) Wages Wages (normal and overtime) (4) Material Costs of spares and operating supplies (5) Subcontracting Subcontracting costs (6) Miscellaneous Other costs: e.g. overhead, computer costs, production losses, etc.
EQUIPMENT (7) Number of failures Number of failures (breakdowns) (8) Reliability Mean time between failures (9) Maintainability Mean time to repair
(10) Availability Actual production time/Planned production time (11 ) Unit operating cost Operating costs/Number of units produced (1 2) Losses per unit Costs of losses/Number of units
PERSONNEL (13) Percentage overtime lO0.Overtime hours/Total hours (14) Percentage absence Number of hours spent on not-maintenance jobs/Total hours
MATERIAL (1 5) Inventory turnover Value of spares and operating supplies consumed/Inventory value (1 6) Service rate Number of items immediately supplied out of stock/Number of items
requested
JOBS (1 7) Breakdown ratio Number of hours'CM/Number of hours (CM + PM) (18) Planning rate Number of hours planned PM/Number of hours available for maintenance (1 9) Planning execution Number of hours worked according to plan/Number of hours planned (20) Service rate Number of jobs executed/Number of job requests (21) Backlog Total hours of backlog (end of T)/Availeble capacity (in T ÷ 1 )
Fig. 2. Control board--suggested ratio definitions.

62 Pintelon. Van Wassenhove--A Maintenance Management Tool
The idea of a single overall performance measure, as is very often suggested both in literature and in practice, is rejected, since it is simplistic and not very useful to operational management. While its use appears to be attrac- tive, it is too risky, because of the aggregation of information which can obscure facts (e.g. some data cancel out). For each performance indicator the CB highlights the value for the period considered and compares this value with an expected value and a target value. This comparison allows one to draw the attention of the maintenance manager to those parameters that exceed tolerance levels; it helps the manager to recognize the symptoms. For a thorough diagnosis of these symptoms, the manager can consult a set of linked detailed reports (DR) (graphs and tables) on different levels of aggre- gation. This analysis should lead to the selection of an appropriate remedy (e.g. an organizational change or a new preventive maintenance pro- gram). It must be emphasized that the functional link between the CB and the DR allows for an efficient search through a structured network and avoids an undirected, perhaps tedious search in a pile of unrelated detailed reports.
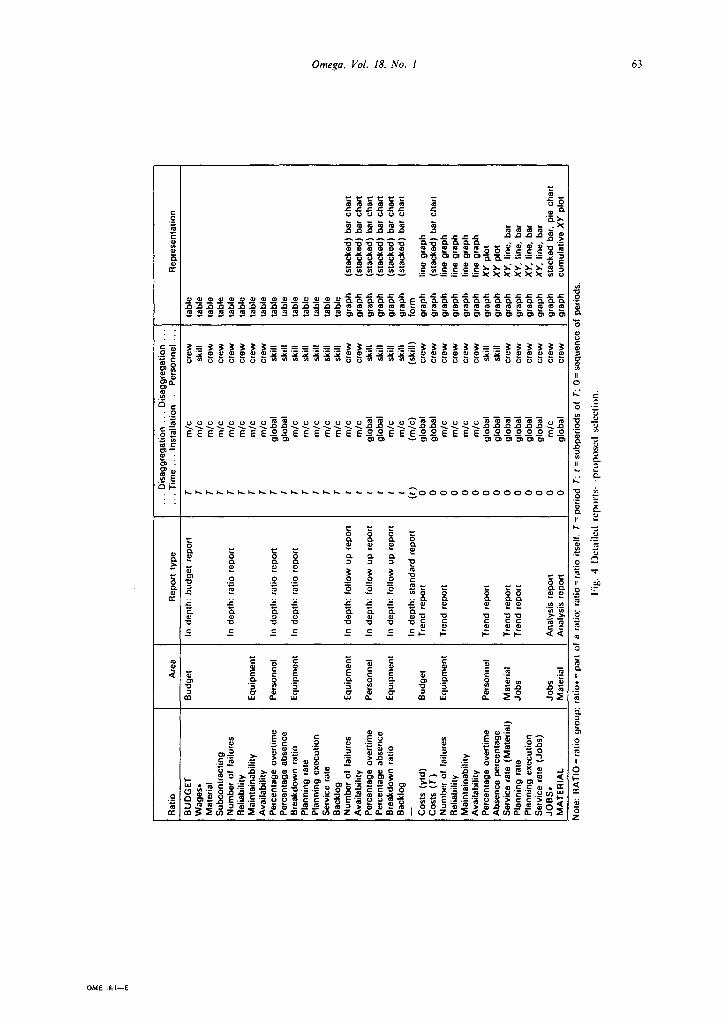
The detailed reports (Figs 3 and 4)
In the DR the information of the CB is disaggregated to enable the maintenance manager to analyze the symptoms he/she spotted on the CB by means of an efficient and guided search process. Therefore different types of reports are provided (Fig. 3). To improve user friendliness, an attempt was made to adhere to a uniform layout for all reports as much as possible. To further improve the decision
support characteristics of the system we tried to m a k e all DR self supporting by including all relevant information needed for a sound inter- pretation (in order to avoid the user having to look up old reports before being able to interpret the current one). We obviously had to make a selection from all conceivable detailed reports. Factors under consideration were: completeness and relevance of the reports, degree of control of the maintenance manager over the problem area in question, etc. Figure 4 shows how different reports on various aggregation levels are linked to the control board to allow adequate decision support in analyzing maintenance performance.
(I) In-depth reports. The in-depth reports provide information on short term maintenance performance. They help to answer questions such as "why did ratio X exceed tolerance limits in period T?" As defined here the in-depth report structure consists of three different levels of aggregation. It is of course, not always necessary to go through all three levels, as that depends on the needs of the user. The first level of aggrega- tion consists of ratio reports and budget reports, to help find the causes of the symptoms. The follow-up reports on the second level make it possible to locate the problem in time. On the third and lowest level of aggregation the stan- dard reports enable to user to dig into the fine details.
(a) Ratio reports The ratio reports and the CB look very much alike, but the information on the ratio report is on a lower level of aggre- gation (for example the CB shows the
CB: Control Board
Budget ratios EQuipment ratios Personnel ratios Material ratios Job ratios
DR: Detailed Reports
Short term evaluation
In-depth reports (disaggregation)
Ratio reports Budget reports
Follow-up reports
Standard reports
Long term evaluation
Trend reports (evolution)
Long term evaluation
Analysis reports (global insight)
Fig. 3. Detailed reports (structure).
,,.
Dis
aggr
egat
ion
...
Dis
aggr
egat
ion
Rat
io
Are
a R
epor
t ty
pe
...
Tim
e ..
. In
stal
latio
n ..
. P
erso
nnel
R
epre
sent
atio
n
Bud
get
In d
epth
; bu
dget
rep
ort
BU
DG
ET
W
ages
. M
ater
ial
Sub
cont
ract
ing
Num
ber
of f
ailu
res
Rel
iabi
lity
Mai
ntai
nabi
lity
Ava
ilabi
lity
Per
cent
age
over
time
Per
cent
age
abse
nce
Bre
akdo
wn
ratio
P
lann
ing
rate
P
lann
ing
exec
utio
n S
ervi
ce r
ate
Bac
klog
N
umbe
r of
fai
lure
s A
vaila
bilit
y P
erce
ntag
e ov
ertim
e P
erce
ntag
e ab
senc
e B
reak
dow
n ra
tio
Bac
klog
Cos
ts
(ytd
) C
osts
(T
) N
umbe
r of
fai
lure
s R
elia
bilit
y M
aint
aina
bilit
y A
vaila
bilit
y P
erce
ntag
e ov
ertim
e A
bsen
ce p
erce
ntag
e S
ervi
ce r
ate
(Mat
eria
l)
Pla
nnin
g ra
te
Pla
nnin
g ex
ecut
ion
Ser
vice
rat
e (J
obs)
JO
BS
. M
AT
ER
IAL
Equ
ipm
ent
Per
sonn
el
Equ
ipm
ent
Equ
ipm
ent
Per
sonn
el
Equ
ipm
ent
Bud
get
In d
epth
: ra
tio r
epor
t
In d
epth
: ra
tio r
epor
t
In d
epth
: ra
tio r
epor
t
In d
epth
: fo
llow
up
repo
rt
In d
epth
: fo
llow
up
repo
rt
In d
epth
: fo
llow
up
repo
rt
In d
epth
: st
anda
rd r
epor
t T
rend
rep
ort
Equ
ipm
ent
Tren
d re
port
Per
sonn
el
Tre
nd r
epor
t
Mat
eria
l T
rend
rep
ort
Jobs
T
rend
rep
ort
Jobs
M
ater
ial
Ana
lysi
s re
port
A
naly
sis
repo
rt
Not
e: R
AT
IO =
rat
io g
roup
; ra
tio*
= pa
rt o
f a
ratio
; ra
tio =
rat
io i
tsel
f. T
=
T m
/c
T m
/c
T m
/c
T m
/c
T m
/c
T m
/c
T ta
lc
T m
/c
T gl
obal
T
glob
al
T m
/c
T m
/c
T m
/c
T m
/c
T m
/c
t m
/c
t m
/c
t gl
obal
t
glob
al
t m
/c
t ta
lc
(t)
(m/c
) 0
glob
al
0 gl
obal
0
talc
0
m/c
0
m/c
0
m/c
0
glob
al
0 gl
obal
0
glob
al
0 gl
obal
0
glob
al
0 gl
obal
0
m/c
0
glob
al
~erio
d T;
t =
sub
peri
ods
crew
ta
ble
skill
ta
ble
crew
ta
ble
crew
ta
ble
crew
ta
ble
crew
ta
ble
crew
ta
ble
crew
ta
ble
skill
ta
ble
skill
ta
ble
skill
ta
ble
skill
ta
ble
skill
ta
ble
skill
ta
ble
skill
ta
ble
crew
gr
aph
crew
gr
aph
skill
gr
aph
skill
gr
aph
skill
gr
aph
skill
gr
aph
(ski
ll)
form
cr
ew
grap
h cr
ew
grap
h cr
ew
grap
h cr
ew
grap
h cr
ew
grap
h cr
ew
grap
h sk
ill
grap
h sk
ill
grap
h cr
ew
grap
h cr
ew
grap
h cr
ew
grap
h cr
ew
grap
h cr
ew
grap
h cr
ew
grap
h
of
T: 0
= s
eque
nce
of p
erio
ds.
I:i~
. 4
l)cl
;=ilc
d rc
p4~,
'ls
pr¢~
p¢~.
~cd s
ch,'c
lion.
(sta
cked
) ba
r ch
art
(sta
cked
) ba
r ch
art
(sta
cked
) ba
r ch
art
(sta
cked
) ba
r ch
art
(sta
cked
) ba
r ch
art
(sta
cked
) ba
r ch
art
line
grap
h (s
tack
ed)
bar
char
t lin
e gr
aph
line
grap
h lin
e gr
aph
line
grap
h X
Y p
lot
XY
plo
t X
Y,
line,
bar
X
Y,
line,
bar
X
Y,
line,
ba
r X
Y,
line,
ba
r st
acke
d ba
r, pi
e ch
art
cum
ulat
ive
XY
plo
t
P

64 Pintelon, Van Wassenhot'e--A Maintenance Management Tool
personnel ratios for the entire main- tenance crew, whereas the correspond- ing ratio reports present the same ratios per skill group).
(b) Budget reports These are the only reports that contain absolute numbers rather than ratios. The budget reports allow the mainte- nance manager to evaluate the degree to which actual costs of a certain period correspond to budgeted costs. The first budget report provides the global cost matrix, chosen here because of its cOn- venience and suitability for further dis- aggregation. This global cost matrix is just another way of presenting one of the ratio reports. On the next level of aggregation these matrix reports may contain: personnel costs per skill group, materials costs per production line, costs of subcontracting per production line, etc. The global sumtotals of the columns of these matrices also appear on the CB. Clearly these matrices can, if so desired, also be presented for each machine group or even for each individ- ual machine.
(c) Follow-up or control reports In these reports the period under con- sideration (e.g. month T) is divided into subperiods (e.g. weeks t l, t2, t3, t4). Since the purpose here is to follow the change of a specific performance indi- cator, a graphical format seems to be the most suitable representation form.
(d) Standard reports Standard reports are used daily on the production floor, such as work orders, shift reports and production reports. Those documents are in fact basic in- puts for the MMT. They can be of help if it is necessary to analyze certain aspects of maintenance management to the finest level of detail.
(2) Trend reports. Trend reports attempt to place the performance indicators for the current period (T) into a historical perspective ( . . . . T - 3, T - 2, T - 1) and allow for pro- jections (forecast for T + 1). They are meant to monitor the performance on a somewhat longer term. Important trend reports include personnel workload, failure characteristics of
the installations and maintenance costs. The trend report concerning personnel workload can be used as a first guideline in answering ques- tions concerning appropriate crew sizes. The report shows whether the current under- or overload of the crew is temporary or permanent in nature.
(3) Analysis reports. Like the trend reports they also provide information on the perfor- mance over several periods. The analyses sug- gested here relate to demand for spare parts and the occurrence of failures. The former presents a classical ABC analysis of the demand for spare parts. The latter provides the results of a simple downtime analysis, which can be used in the evaluation of the PM program. According to the needs of the company, other analyses can be designed, such as: possible correlations between equipment failures and product quality, effect of different product types on equipment failure characteristics, etc. The information system gen- erating the MMT must be flexible enough to allow the user to continue with his inquiries.
The list of reports presented here, is, of course, not exhaustive. Neither should it be used in every implementation. The purpose here is only to give an overview of possible reports that can be generated and to explain their use. Each company will have to adapt this array of reports to its own specific needs. A computer system can obviously be of help and specialized software is now available for more advanced statistical analyses.
3. USE OF THE MAINTENANCE MANAGEMENT TOOL
The MMT described here goes beyond most maintenance performance reporting methods mentioned in literature. The decision support features of the MMT consist of the concept of the CB, the functional link between CB and DR and the structure of the DR network.
It would be misleading to use the popular term 'expert system' for the MMT concept proposed in this paper, since MMT is a tool for the maintenance manager, which means it may assist him but it certainly cannot replace him. The knowledge and experience of the manager is still needed to interpret the results. The atten- tion and alert levels on the CB are not generated automatically by the system but are set by the manager based on his experience.
Omega, Vol. l& No. 1 65
Apart from being a tool for internal use the MMT can be used to facilitate communication between different business functions such as production and maintenance, as well as the communication between hierarchical levels, to- wards top management (upward communi- cation) and towards the workers on the floor (downward communication). This requires MMT to be flexible to allow the user to make extracts of reports according to his needs.
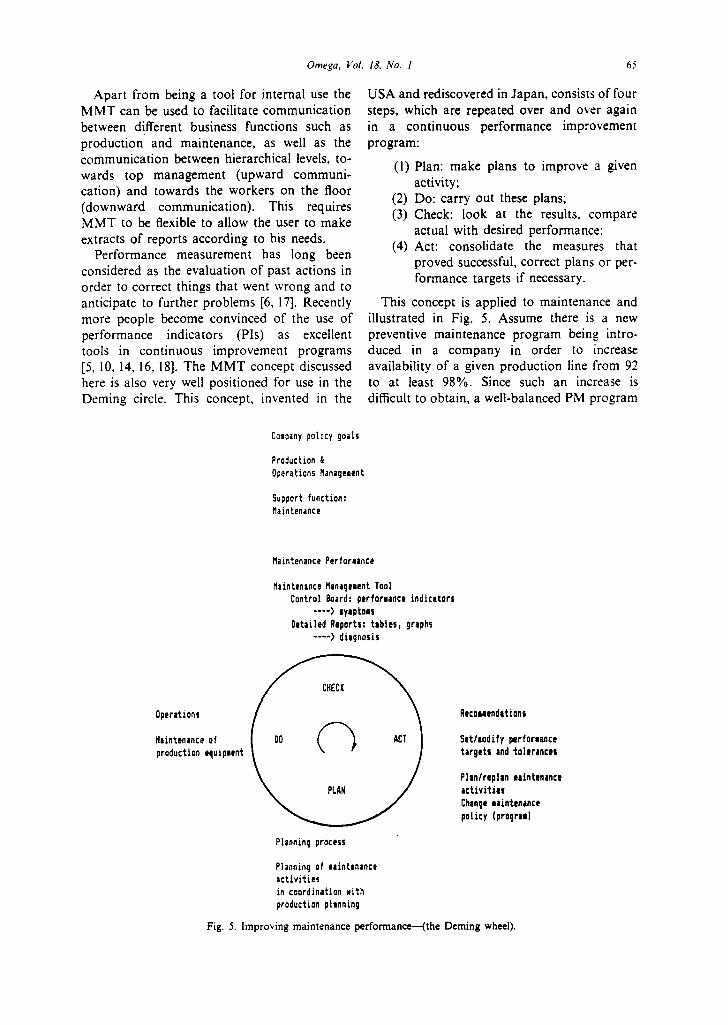
Performance measurement has long been considered as the evaluation of past actions in order to correct things that went wrong and to anticipate to further problems [6, 17]. Recently more people become convinced of the use of performance indicators (PIs) as excellent tools in continuous improvement programs [5, 10, 14, 16, 18]. The MMT concept discussed here is also very well positioned for use in the Deming circle. This concept, invented in the
USA and rediscovered in Japan, consists of four steps, which are repeated over and over again in a continuous performance improvement program:
(1) Plan: make plans to improve a given activity;
(2) Do: carry out these plans; (3) Check: look at the results, compare
actual with desired performance; (4) Act: consolidate the measures that
proved successful, correct plans or per- formance targets if necessary.
This concept is applied to maintenance and illustrated in Fig. 5. Assume there is a new preventive maintenance program being intro- duced in a company in order to increase availability of a given production line from 92 to at least 98%. Since such an increase is difficult to obtain, a well-balanced PM program
Maintenance Perforeence
Maintenance Management Tool Control Board: perforeance indicators
. . . . ) syoptois Oeteiled ~oports: tebles~ graphs
. . . . ) diagnosis
Operations
Maintenance of production equipment
Company policy goals
Production Operations Manageaent
Support function: Maintenance
Planning process
Recoioendations
Setleodify perforeanoe targets and tolerances
Plen/replan ,aintonance act iv i t ies Change eaintontnce policy (prolval)
Planning of maintenance activities in coordination .ith production plsnning
Fig. 5. Improving maintenance performance---(thcDemingwheel).

66 Pintelon, Van Wassenhot,e--A Maintenance Management Tool
(Plan) with different stages of implementation will be needed. Every period (e.g. month) the execution (Do) of that PM program will be evaluated (Check) and actual equipment perfor- mance compared with the desired performance. If the actual availability is lower than the de- sired 98% or lower than x%, with x % being a subtarget for one of the stages, the DR of the MMT can help to find the causes (diagnosis), leading to recommendations about the PM
program for the next period (Act) and for the planning process for the next period (Plan), and the Deming cycle starts again.
As a further illustration of the operational use of the MMT, consider the small example pic- tured in Fig. 6, where the functional links between the control board (CB) and detailed reports (DR) become apparent. Assume that on the CB the equipment ratio 'availability' has reached the red alert level in period T [Fig. 6(a)].
(o)
CONTROL BOARD - Per iod T
-- E q u i p m e n t ( 10 ] Ava iLab iL i t y
I (b )
Ratio report -Per iod T
AvailabiLity actual, expected attention
m / c I
• - m / c 2
m / c 3
(c )
= FoLLow up repor t - P e r i o d T
Capacity (h)
p l a n n e d production
,, , a c t u a l production
tl t 2 t3 t 4
(d) i I
i s.i,t ~.port I
Fig. 6. Illustration of the use of the MMT concept.

Omega. Vol. 18, No. 1 67
Question 1. Is this low availability due to one or to more installations?--Answer 1. The ratio report (an .in-depth report) in Fig. 6(b) shows that machine 2 causes the low availability.
Question 2. Was the availability of machine 2 low during all subperiods of T?--Answer 2. No. The follow-up report (another in-depth report) shows that availability was much lower than expected in subperiod t2 only [Fig. 6(c)].
Question 3. What is the reason for the low availability of machine 2 in t2?--Answer 3. To answer this question the standard shift reports of machine 2 in period t2 must be consulted [Fig. 6(d)].
As a final example, assume that the CB shows that personnel ratio (13), percentage overtime, is very high. Ratio reports (in-depth reports) on personnel ratios per skill group reveal the skill group, say the electricians, which was responsi- ble for the excessive overtime. Drawing a trend report next will show whether the overload continues in the upcoming periods. If so, hiring more electricians can be considered. If, on the contrary, the current overload is only temporary, subcontracting may be a good solution.
4. IMPLEMENTATION ASPECTS
Experiences from applications of our MMT in industry are very valuable since nearly every implementation generates interesting comments and questions. When the company already has an operational maintenance management infor- mation system, one can try to integrate the MMT concept and check whether it is able to remedy some of the deficiencies of the existing system. One can even consider the integration of the maintenance management information sys- tem with more business-wide concepts such as CIM. In situations where no maintenance infor- mation system is operational as yet, studying the impact and results of a rudimentary MMT system can be very instructive.
Implementation of the MMT concept can be viewed from two different angles. First one can start from the MMT concept and analyze the data required to generate the MMT and how to collect the data. Second, one can start from the existing data collection system and analyze in how far the MMT can be realized using readily available information. Both approaches can improve one's general insight in maintenance
management and be helpful in validating the MMT concept.
The MMT concept is a periodically generated frame of reference to evaluate maintenance per- formance. It is neither a turnkey concept nor a tailormade concept. It is more a 80-10-10 con- cept: 80% of the concept can probably be used in every implementation, 10% will have to be adapted to the sector or even to the company under consideration and the remaining 10% will be completely useless or irrelevant for the appli- cation at hand and will therefore have to be omitted or replaced.
The CB of the MMT contains 21 ratios, it therefore fits on one page. Although the number of ratios on the CB is unimportant, it is vital that the CB can be quickly scanned and inter- preted, hence the one-page format. A CB con- sisting of different pages would be time consuming to leaf through to obtain a general appreciation of all aspects of maintenance per- formance. Therefore, an efficient choice of ratios must be made. A realistic trade-off between completeness and manageability is one of the basic requirements for a useful CB.
In Fig. 2 some ratio definitions were pro- posed. In practice it is sometimes hard to find an appropriate definition for certain ratios which is acceptable to all people involved. However, only by carefully defining the ratios can one measure what one really intends to measure.
Every definition has to fit the business context of the company. It is sometimes better to use a definition that may not be 100% correct theo- retically, but has been used for years and is understood and accepted by everyone involved, than to use a new 100% correct definition with which everybody feels uncomfortable and un- certain. The most important points are to reach an agreement over the purpose of the ratio and its (one and only) definition and to make sure the data to correctly compute it are available.
A question that often arises in discussions with maintenance managers on the MMT con- cept is 'how are we doing compared to our competitors?' Managers are (often desperately) looking for some general industry figures to check their own performance. The idea of the availability of general worldwide figures of truth seems very attractive but is a mirage. Even if companies adopt the same definition for a given ratio there are a lot of other factors that make inter-company comparisons of the values for

68 Pintelon, Van Wassenhore--A Maintenance Management Tool
that ratio tricky: e.g. age and type of equipment, capacity use (workload) and accounting pro- cedures. Perhaps different plants of a multi- national company form the only reasonable area for comparison. For some ratios though, based on long experience and averaged over many companies, there exist 'optimal ranges' accepted by the whole sector. In the chemical process industries e.g. it is generally accepted that the ratio of yearly maintenance cost to replacement value of the installations should be between 2 and 3%. Of course the practical usefulness of such ranges as a management tool is fairly limited.
In designing a MMT for a specific situation it is often best to start from scratch. Afterwards the feasibility and practical realization of the design have to be considered. The decision is whether to adapt the design to the system or to extend the system such that it can accommodate the design. For instance it is ridiculous to say from the beginning 'we don't use graphs because our software doesn't support them'. It makes more sense to design a system with graphs when appropriate and to decide afterwards whether the graphs can be omitted or whether they are valuable enough to buy some additional soft- ware that supports them.
The discussion above reflects only some of the remarks often heard in discussions with main- tenance managers on this subject. Each remark in its own way illustrates an objective or a functionality of the MMT concept.
The MMT concept is currently being imple- mented in two Belgian firms. In a pharmaceuti- cal company the implementation is nearly completed and in a chemical firm the implemen- tation is now well under way. Several other companies in various sectors showed their inter- est by trying out the concept or part of it (the control board). Some consultants/software houses expressed interest in commercialization.
5. USEFULNESS OF THE MMT CONCEPT AS A RESEARCH TOOL
This MMT was developed as part of a PhD research project. From the above the potential practical usefulness of the tool should have become clear. From a research point of view there were two goals: (1) to gain insight in maintenance management through the design of the tool and through the feedback that came on
this concept from maintenance managers; and (2) to use this tool as a navigation board that translates the effects of certain actions on per- formance measures. The tool is a kind of screen on which the effects of different maintenance policies and new maintenance job scheduling rules can be monitored.
Concerning the general validation of the MMT there are some points that need further investigation. A dBaselII+ prototype, devel- oped after a structured data flow analysis is currently being used for these purposes. Sector dependency of the MMT seems worth investi- gating. Clearly the concept was developed for manufacturing industries rather than for service industries. Perhaps the MMT will be more useful in continuous production than in typical job shop situations. The latter usually allow for less stringent maintenance control due to more flexibility in capacity. Moreover the equipment used is often too specialized (e.g. CNC) to be maintained in-house, which requires specific maintenance and maintenance control. In the continuous production sector one can still dis- tinguish between many types of companies. Consider lbr instance an oil refining plant and a tin can manufacturer. Both have continuous production, but the conditions for planning and maintenance are very different. Some further research on the dependency of the MMT on sector characteristics is therefore required.
Another area of interest concerns the inter- relationship between the ratios on the CB. When certain actions are undertaken to improve a given performance ratio, how does that affect other ratios in either a desirable or an undesir- able way? Perhaps it is possible to determine clusters of interconnected ratios as well as 'desirable' ranges for the values of the ratios in those clusters. Looking for optimal values of performance ratios here can be compared to setting values for ratio analysis in a financial audit of a company. The isolated value of a single ratio may not mean much, but the values of certain clusters of ratios, when considered together, definitely reveal a lot about the finan- cial health of the company.
Using the ratios in the maintenance CB for auditing purposes similar to what is routinely done in the area of finance requires some conceptual thinking, but it can also be instruc- tive to perform some simulation runs with the abovementioned dBaselII + program. These
Omega, 1Iol. 18, No. 1 69
simulation runs are currently under study, using both real-life and special scenario data. These runs should provide us with the link between the performance indicators and the real means of control. We should gain insight in what happens if certain actions are undertaken (e.g. what happens if the PM program is cut down by 50%) and derive from there the means of control to improve performance.
Software implementation of the MMT is another interesting topic for further study. Some parts completed recently are the construc- tion of a data structure diagram to arrive at a conceptual (normalized) database design and the analysis of information storages and flows, to set up an information flow chart (e.g. a data flow diagram). From this the structure chart needed for computer implementation can be derived. The investigation of these aspects should shed some light on information bottle- necks and on information network flows. This in turn should highlight pieces of data that are extremely important because they are very often used in reports, the intensity with which infor- mation channels are used or misused, etc. All this should also provide some insight into the requirements for the organizational environ- ment of the maintenance information system. Data accuracy of the MMT is also a very important aspect. How reliable is the infor- mation and how can this be measured and controlled?
We already mentioned that performance re- porting becomes more and more important in several areas. We therefore feel it would be interesting to compare the concept developed here to performance reporting systems in other areas such as production control, logistics, etc.
6. CONCLUSIONS
This paper has presented a structured main- tenance management tool. There is a great need for such tools, although very few integrated efforts have been reported as of yet. The MMT described here serves two purposes, i.e. to be a decision support tool for the maintenance manager in industry and to be a vehicle for further research on maintenance decision- making.
The MMT consists of two parts: a Control Board with different collections of performance indicators, each corresponding to a different
area of maintenance management and, func- tionally linked with the CB, a structured net- work of Detailed Reports. The periodically generated CB helps the manager to detect those areas of maintenance management where some- thing went (or tends to go) beyond tolerance levels (the symptoms). Consultation of a num- ber of different types of DR enables the man- ager to determine exactly the cause of these 'symptoms', i.e. to arrive at a diagnosis. In practice, maintenance managers react positively to this MMT concept. They all recognize the need for a good performance system as a basic requirement for maintenance management and control. They further admit that what is found in practice seldom meets their needs concerning maintenance reporting and that valuable litera- ture on the subject can hardly be found. Finally, most of the commercially available software packages lack a flexible and userfriendly report- ing module. Therefore every attempt to con- struct tools in the area of structured maintenance reporting is studied with interest by managers. The fact that our MMT provides an integrated decision support approach makes it different from most other efforts in mainte- nance control or reporting. We firmly believe this integrated approach is the main reason for the active support and interest we found in industry during the development of the tool.
The MMT can also be used for further re- search on maintenance decision-making. Inter- esting questions are: in what way is performance affected by management decisions such as alter- ing the PM program? Can 'optimal' ranges for clusters of performance ratios be established? etc. The effect of different maintenance policies can be evaluated by generating the correspond- ing CB for each scenario, i.e. effectively using the CB as a simulation tool on the strategic or tactical level of decision-making.
REFERENCES
1. Buttery LM (1978) New survey of US maintenance costs. Hydrocarbon Processing 58, 85-90.
2. Corder GC (1962) Modern Maintenance, Seminar Publication of the British Productivity Council, Section 2.
3. de Vries Robbe AAC (1987) Wie is bang van een checklist? Technische Bedrijfs,'oering 2, 52-56.
4. DGS International Maintenance Consultants for Indus- trializing Countries (1987) Checklist, Jubileumlaan 75, 9000 Ghent, Belgium.
5. Fortuin L (1988) Performance indicators: Why, where and how. EJOR 34, 1-9.

70 Pintelon, Van 14,'assenhove--A Maintenance Management Tool
6. Globerson S (1985) Issues in designing a performance criteria system for an organization. Int. J. Prodn Res. 23, 639--646.
7. Hibi S (1977) How to Measure Maintenance Perfor- mance. Nordica, Hong Kong.
8. Luck WS (1956) Now you can really measure mainte- nance performance. Factory Mgmt Maintenance 114, 81-86.
9. Mann L (1983) Maintenance Management. Lexington Books, Lexington, MA.
10. NEVEM (!987) Performance indicatoren in de logistiek. Kluwer, Deventer, The Netherlands.
11. Newbrough ET (1967) Effective Maintenance Manage- ment. McGraw-Hill, NY.
12. Niebel BW (1985) Engineering Maintenance Manage- ment. Marcel Dekker, NY.
13. Noiret A (1978) Evaluation de l'Efficacit~ de la Mainte-
nance. L "Entretien dans les Industries des Proc~d~s, nov. 14. Novitsky MP (1986) Performance measurements: The
key to continuous improvements. APICS Conf. Proc., pp. 386-388.
15. Priel VZ (1962) Twenty ways to track maintenance performance. Factor)', pp. 88-96. McGraw-Hill, NY.
16. Souza SA (1986) Change performance measures first. APICS Conf. Proc., pp. 631-633.
17. Westwick CA (1973) How to Use Management Ratios. Gower Press, Westmead.
18. Wiggins JK (1986) Improvement through Performance Measurement. APICS Conf. Proc., pp. 514--516.
ADDRESS FOR CORRESPONDENCE: Luk Van Wassenhove, Erasmus University Rotterdam, Econometric Institute, PO Box 1738, 3000 Rotterdam, The Netherlands,