A. Legumes for crop production and N supply -...
39
A. Legumes for crop production and N supply
Transcript of A. Legumes for crop production and N supply -...

A. Legumes for crop production and N supply

From our workshop on legumes• Controversy over methods:‐ Questions about the use of reference crops in natural abundance‐ How to express the value of a legume pre‐crop
• N fixation‐ declining fixation with ley age, especially red clover‐ grass makes better use then forbs of fixed N
• Temperature effects – N is mineralised at low temperatures but not C
• Ineresting alternative strategies for improving the use of green manures to optimise N e.g. digestion

To do list!• Soil organic matter cycling to improve use of N from legumes
(precrop effects)• Synchronising N with crop N needs (in intercrops and rotations) • How best to establish cover crops in autumn?• How to retain N in the system over winter – does
retranslocation of N into roots play an important role?• Estimating belowground biomass – need a standard, cheap
approach! • Climate change effects – biomass distribution, reallocation
belowground, decomposition rates• Opportunities for new crops due to climate change• Breeding goals – climate change, pathogens• Holistic approach to understanding and optimising use of
legumes – MCA?• Knowledge exchange – multiple functions and services

Questions Knowledge for implementation
Ongoing or new research
Soil fertility effects of removing N-rich residues?
p. 65 Monday, p. 67 Tuesday
How obtain reliable on-farm estimates of N2 fixation?
Image analyses for estimating legume biomass
Management of cropping systems with no/short periods withoutvegetation?
Need to analyse tradeoffs (N, GHG, water, weeds, pests, diseases)
Synchronization betw. organic N (different sources) mineralizationand crop N uptake?
Sensors, models p. 22 Monday, p. 50 Monday, p. 2 Tuesday
Legume main crops and cover crops in pure stands or mixtures?
Multifunctionality of species mixtures
Perceptions ofmultifunctionality?
How avoid N surplus (reliablebalance calculations)?
More precise farm N balances
Assessments of indirect effects(e.g. soili fertility, land use) oflegumes and CS diversity?
p. 2 Monday
Management of cropping systems and soil N in different climates? The 19th N workshop!
Parallel workshop session B; Nitrogen in organic farming

C. Crop and soil sensors to predict N requirements
Issues: Variable light limiting analytical windows Frequent WR, Dual channel
Seasonal effects occur after sensor measurements – weather uncertainty
Need to be combined with crop models to learn and manage the system
Band selection and is important and driven by application. BM – Chl; VI – Read edge
Implementation: Displayed variation promotes demand Local validation in practiceSoil sensing: For understanding Plants dictate the requirement (zone boarders; varies between
seasons by weather)

D. Urease & Nitrification• Environmental benefits are proven• Concerns exist around non target effects (public perception)
• agronomic benefits: variable yield response crop quality?
• Farmer: improve environmental foot print but economic viability?
• carbon credits/environmental payments for fertiliser technologies to reduce emissions?
• Increasing sensitive analytical methods• Residues? Need for food safety standard (crop protection standard / reach directive

Workshop E: Measures to reduce N lossesJanjo de Haan, Ross Monaghan, Craig Drury, Christen Børgesen, Helena Aronsson
Crop residues animal manure urea NH4 NO3 fertilizers
NH3
Leaching ofN (and P)
N2N2O
• Management of the sources of N• Management of transport pathways
Take home message:‐To be aware and care of the the whole system‐All key N losses must be considered to ensure that pollution swapping is not occurring.

• Reduced N from animals excretion
‐ Remind about existing knowledge‐ Much done for P but not for N‐ Possibilities with ruman
modifications?• Better recognition of ”organic
value” of manure
• Methods for application: rates and techniques
• Control of drain flows• Combination of urease and nitrification
inhibitors• Acidifying manure• Cover crops• Support for manure storage• Removal of water from manure
Future challenges• Avoiding dislocation of nutrient cycles• Models and recommendations that consider whole system responses• We may have to combine several BMP’s for some soils and
environments to reduce N losses from the soils (Targeting 1 loss pathway with 1 BMP may lead to another N species loss)
• Functional networks for policy‐ advisors‐farmers‐scientists
Need of increased or updated knowledge, technical solutions

N budgets and indicators for best practice N management
Limits and potentials

Indicators
• Nitrogen Use Efficiency – system boundary different indicator– low‐input systems indicator meaningless
• Nitrogen surplus• Emission fluxes• Nitrogen in Product• Financial revenues

More complete budgets
• Improved analytical instrumentation allow better understanding of N flows
• Farm inputs are straightforward, Simultaneous capturing of NH3, NO3, N2O and N2 losses
• Still coverage is incomplete, connection to underlying processes is limited
• Observed variability is characteristic of biological systems, not an uncertainty!

Integration
• From individual installation to product• From individual product to overall service• From enterprise to country level• From nitrogen to P, C, …
+ avoid allocation issues, pollution swapping− increased complexity & handling

G. Nitrogen and carbon interactions
• Temperature sensitivity of soil organic matter decomposition
• Temperature sensitivity of microbial carbon/nitrogen use efficiency
• Factors affecting resource use efficiency– Fertilizer use efficiency– Microbial carbon/nitrogen use efficiency

Nitrogen and carbon interactions

h – Modelling of N2O emissionsKnowledge gaps need for research• plant varieties and plant mixtures, parameters in models, models with
these features• algorithms for cover crops, N2 fixation, mulch addition are needed• models are imperfect as assumptions to simulate are not always tested• prediction of mechanisms causing emissions, do we need to improve
this?• models dealing with livestock?• models dealing with manure? How specific are the models?• is it best to have more models than one good model?• models heterogeneity, difficult to compare models, what is a good
strategy to deal with this? • can we use models for national GHG inventories?

h – Modelling of N2O emissionsTechnical development• measurements of spatial variability of N• measurements for assessing NUE in permanent grassland is a
challenge• improve frequency of N2O measurements – robotics, automatic
chambers• EC is good for field scale but not plot scale for assessing treatments
Future collaboration• assimilation of different models in an intercomparison exercise• compiling datasets for N2O emissions• use the models to design measurement programmes• interaction modellers-experimentalists• homogenizing of measurement protocols

I N use efficiency in diversified cropping systems or systems with cover crops
• Helena Aronsson: MULTI‐FUNCTIONAL COVER CROPS FOR CROPPING SYSTEMS IN SOUTHERN SCANDINAVIA AND FINLAND
• Bill Deen: IMPACTS OF DECLINING ROTATION DIVERSITY ON NITROGEN USE EFFICIENCY IN MAIZE
• Xiaoxi Li: LEGUME‐BASED CATCH CROPS FOR ECOLOGICAL INTENSIFICATION

Improving scientific understanding• What are the mechanisms behind biodiversity benefits? • Where is the N in catch crops, what is its fate, and how
does it become available—what are the mechanisms?• Need to define functions desired from/provided by catch
crops• How cover crops impact P cycling• How to balance reducing inorganic N with crop demands—
improve mechanistic understandings• Understanding soil microbial community and interactions
with diseases and N cycling• More work on management of cover crops—timing, tillage,
establishment

From research to practice• Why don’t farmers want to use cover crops and how to encourage
adoption?• Develop guidelines that allow for management flexibility• Design decision support tools for catch crop selection• Demonstrate economic effects/benefits• Who gives input in developing guidelines? Include farmers and use
long‐term approach• Need for longer‐term cover crop studies to look at long‐term effects• Collaborative research with farmers to evaluate multifunctionality• How can farmers develop an altruistic mindset—communication
gap to farmers and policy makers• System design methods rather than specific results‐based

J. Parallel workshop:Models for yield and nitrogen forecast
• Short introduction round• Posters
– Presentation & discussion
• General discussion

Parallel workshopModels for yield and nitrogen forecast
• Posters
– 5 min Presentation + 5 min discussion
Title Presenting Author
Improving nutrient use efficiency and reducing environmental losses of nitrogen: Insights from a process‐based model and on‐farm trials
Eileen McLellan
Establishing the nitrogen dilution curve for potato in Belgium Feriel Ben AbdallahImpact of varieties on bread wheat nitrogen use efficiency for yield and grain protein content: when agronomy meets genetics
Jean‐Pierre Cohan
Calibration of A simple mechanistic wheat model for within‐field variable N application
Lina Nolin Nyström

On‐farm trials: improvements in NUE using the Adapt‐N tool
On-farm trials: coupled improvements in farm profitability and environmental outcomes
Improving Nutrient Use Efficiency And Reducing Environmental Losses Of Nitrogen: Insights From A Process‐based Model And On‐farm Trials
Eileen McLellan
Simulation model Adapt‐N improved accuracy of fertilizer recommendationsand improved N use efficiency

0
0.2
0.4
0.6
0.8
1
0.0 0.2 0.4 0.6 0.8 1.0 1.2 1.4 1.6
Relativ
e Yield (R
Y)
NNI
if NNI ≤ 1.16, RY= 1.68 NNI ‐ 0.72 NNI 2 , R2=0.75
if NNI > 1.16 , RY= 0.97
1
2
3
4
5
0 2 4 6 8 10 12
N con
centratio
n(%)
Total biomass (t DM ha ‐1)
Nc Belgium
Nc Greenwood et al. (1990)
Nc Duchenne et al. (1997)
Nc Giletto and Echeverría (2012)
Nc Bélanger et al. (2001) cv. Shepody
Nc Bélanger et al. (2001) cv. Russet Burbank
0
2
4
6
8
0 2 4 6 8 10 12
N con
centratio
n (%
)
Total biomass (t DM ha ‐1)
Limiting N conditions cv Bintje Non limiting N conditions cv Bintje
Limiting N conditions cv Charlotte Non limiting N conditions cv Charlotte
Belgian Nc curve (Nc (%) = 5.37 W‐0.45)
Establishment and validation of Nc curve
Comparison withdifferent potato curves
Evaluation of the usefulness of NNI to predict the tuber yield
Establishing the nitrogen dilution curve for potato in Belgium
Feriel Ben Abdallah
Updated N dilution curve for potatoand derived NNI values decribe N effects on productivity

Trials network : 10 trials (various soil types and locations) during 2 growing seasons (5 during 2013-2014 and 5 during 2014-2015) 5 more trials during 2015-2016
Studied factors (criss-cross or split-plot design) : N rates applied (6 levels) X bread wheat varieties(17)
Measurements at harvest : grain yield , grain protein content (GPC), total (grain+straw) N uptake(TNU), soil mineral Nitrogen (SMN) 60 to 90 cm deep
Statistical analyzes : Variance analysis with mixed models, N response models fitting for each variableat harvest, calculation of different NUE characteristics.
Variety effect on :• Optimum yield, optimum N rate (30 kg N/ha) and
corresponding GPC• Total N requirement per yield unit to reach optimum yield and
GPC 11.5%.• Apparent N recoveryIf needed, extra-N requirement does not increase SMN atharvest if it is moderate (< 30 kg N.ha-1)
Impact of varieties on bread wheat nitrogen use efficiency for yield and grain protein content: when agronomy meets genetics
Jean‐Pierre Cohan
Opt N Rates for wheat cultivars differ (30 kg N/ha)Higher N rates for „high N“ varieties do not rise SMN at harvest

ConclusionThe model showedpotential to be used as a decision support for site‐specific N‐fertilization
ResultsAdjusted thermal timerequirements, maximum protein concentration and mineralization constantimproved simulation results.
Calibration of A simple mechanistic wheat model for within‐field variable N application
Lina NolinNyström
Sirius wheat model was after site specific parametrisationto predict Yield and grain N but not SMN harvestThere is potential for site specific N fertilisation

What research is needed to improve these models?
• Subtopics– Crop N demand
• Type of crop model, – Soil N supply
• Nitrogen/carbon pool concept– Fertilizer recovery
• Interaction with soil N supply– Accuracy achievable/needed– Site specific calibration– Coupling with in season measurements
Workshop: Models nitrogen forecast

• Simulation models can contribute to improved N fertilisationrecommendations– Contribution may vary for different crops
• Accuracy of predictions for N demand and N supply is still an issue (esp. in Europe)– Model structure / type process descriptions / parametrisation– Site specific parameterisation– Genotypic differences have to be considered– Combination with other information sources is promising
• Sensor/Image data, empirical knowledge from field trials
– Relative vs. absolute predictions?
Conclusions
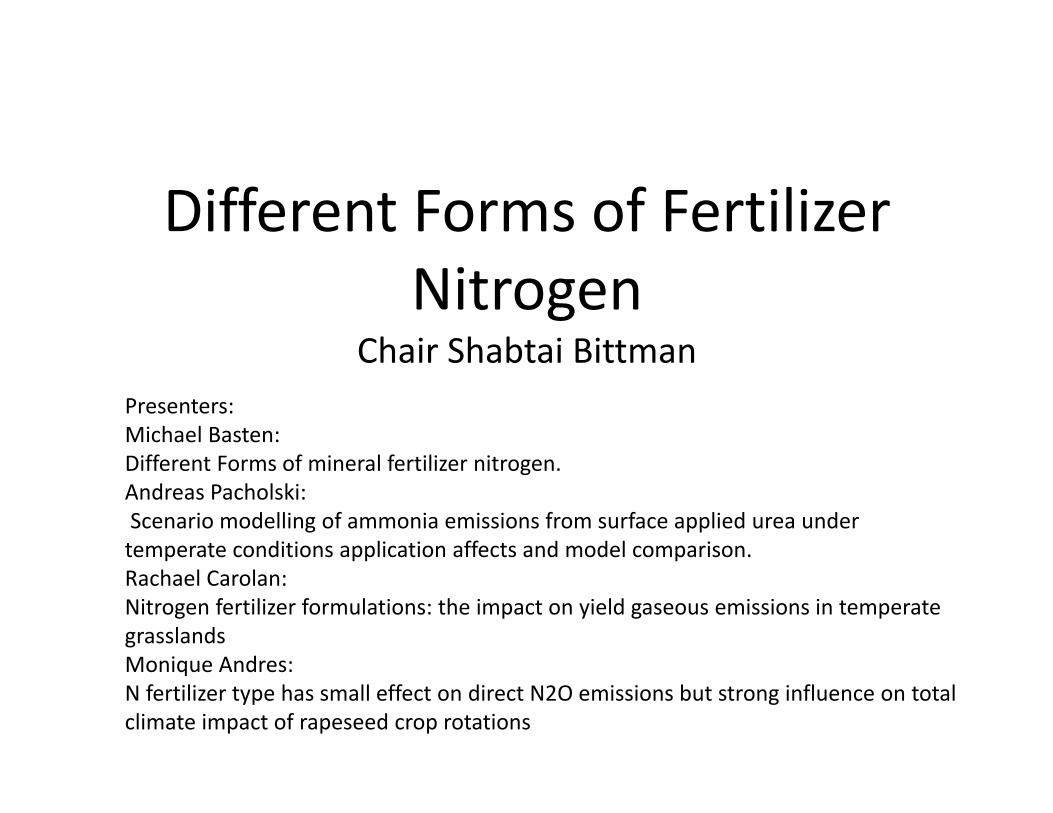
Different Forms of Fertilizer Nitrogen
Chair Shabtai BittmanPresenters:Michael Basten:Different Forms of mineral fertilizer nitrogen.Andreas Pacholski:Scenario modelling of ammonia emissions from surface applied urea under temperate conditions application affects and model comparison. Rachael Carolan: Nitrogen fertilizer formulations: the impact on yield gaseous emissions in temperate grasslandsMonique Andres:N fertilizer type has small effect on direct N2O emissions but strong influence on total climate impact of rapeseed crop rotations

Presenters:Michael Basten:Different Forms of mineral fertilizer nitrogen.Fertilizer production at near maximum efficiency for energy efficiency; urea somewhat more efficient than nitrate. Nitrate form is most efficient form in terms of yield and proteinAndreas Pacholski:Scenario modelling of ammonia emissions from surface applied urea under temperate conditions application affects and model comparison. Empirical modelling of N efficiency was more successful than dynamic model (Volt’air) at simulating Nh3 volatilization, extensive testing in Germany suggests e.f. of around 10% or about half the current EF of 205. Difference due to most application on winter wheat in cool wet weather in early spring. Rachael Carolan: Nitrogen fertilizer formulations: the impact on yield gaseous emissions in temperate grasslandsUrea reduced N@O compared to CAN but possible pollution swapping due to more nH3 and secondary N2O. Stabilized urea (rebranded from inhibitor) may educe emissions wile maintaining yield and N uptake on wet pasture s in Ireland. Monique Andres:N2O Emissios were generally low and N fertilizer type has small effect on direct N2O emissions but strong influence on total climate impact of rapeseed crop rotations. While factors like climate, site differences are less important regarding N2O emissions, using fermentation products as fertilizer avoids upstream fertilizer costs hence reduces impact of fertilizer

What are potential improvements in N forms for enhancing N use
efficiency and reducing emissions
Can policy makes wok with fertilizer industry to develop new N forms

Summary of parallel workshop session L:
Improved management of organic N resources Chair: Lars Stoumann Jensen
Professor of Soil Fertility and Organic Waste Resource RecyclingDept. Plant & Environmental Sciences, UNIVERSITY OF COPENHAGEN, [email protected]
Environmental Impacts
vs. valuable resources
Short oral poster presentations_1)Effects of Crushing and Drying Organic Products on Their Nitrogen and Carbon Mineralization in Soil Incubations(Caroline Le Roux)
2)Strip‐tillage Combined With Slurry Band Injection Below the Maize Row ‐ A New Approach to Improve the Nitrogen Use Efficiency of Organic Fertilizers (Stefan Ebert)
3)Effect Of Organic Fertilization on N2O Emissions and Wheat Crop Yield and Quality (Sergio Menendez)
4)Effect of Contrasting Application Techniques on Ammonia Emissions Following Food‐based Digestate Applications to Grassland (Fiona Nicholsson)

a) What are the main challenges for improved management of organic waste N resources?
Holistic challenges• Livestock intensification/specialisation leads to need for redistribution of
bulky/low conc. org. N waste at regional/country/EU ‐• Which system boundaries (farm+feedsupply, entire food‐chain, etc.) to consider• At what scales to analyse the challenge (farm, country, global)? • This will be determinant for the resulst
• How to determine the need for and the level of manure/org. wasteprocessing/treatment, with respect to different criteria
• Improving nutrient ratios• Retain organic matter relevance for soil quality• Recovering energy and biomaterials• Achieving economic balance/return
• Assessment approach?• Multicriteria analysis?• Cost‐benefit analysis ‐ farmer or societal perspective?• Entire life cycle assessment – and what level of allocation/system expansion?

Technical/agronomic challenges• Improving timing of nutrient
availability vs. crop demand, for higher nutrient use effeciency / fertiliser value – in both short and long‐term
• Optimisation of N:P:K:S:micronutr. ratios to meet crop demand – needfor treatment/processing?
• Developing application methodswith low emissions (NH3, N2O, N‐leaching) and high fertiliser value
• Determining environmentalemission factors of organic waste in comparison to synthetic N source –both short and long‐term
Regulatory and societal challenges• Need for redistribution of bulky/low
conc. org. N(&P) containing waste to minimise surpluses‐Within region/country/EU/globe?
• Legally defining/delineating organic N sources – end‐of‐waste criteria
• How to limit contaminants/unwantedsubstances, establish safe tresholds?‐ Metals, organic pollutants, plastics, pharmaceuticals, pathogens etc.
‐ Cocktail‐effects/interactions?• Can certification schemes help?• Are economic subsidies crucial?• Market development, productavailability and customer access
• New EU Fertiliser Regulation
a) What are the main challenges for improved management of organic waste N resources?

b) Where are the knowledge gaps / research needs?
• Better management and application methods for existing and new org. waste products (e.g. digestates)– Better mineralisation/availability characterisation
– How to achieve higher NUE / fertiliserreplacement value ≈ synthetic fertiliser
– Greatly reduced enviromental emissions– Economically feasible/profitable
• Dissemination & knowledge transfer– Locally adapted, tested (e.g. in farmers field trials) and documented
– otherwise farmers will not adopt– knowledge transfer, BMP examples– ideally integrated with Decision Support Tools
• New organic waste/manure processing/ treatment technologies –ramifications for– NUE and fertiliser subst. at all scales– Organic matter fate and soil organic
matter, soil quality/ fertility– Environmental impacts ‐ short & long‐
term (e.g. impact of NI or acidification)– Crop and fertiliser management
interactions
• Stakeholder perceptions & attitudes– Farmers, industry, consumer– Social acceptability, motivations
• Proper systems comparisons, e.g.– intensive vs. extensive livestock, – synthetic vs. biobased fertilizersat different scales (global, country, farm)THANK YOU!

M: Monitoring and modelling N leaching in watershed• Up‐scaling of results is important to inform national policy• Availability of data and higher resolution: new technologies, data sharing, long term monitoring, availability of climate data and field/farm management
• Time lag – better knowledge of time lag between farm practise and water quality and better management of expectations of policy makers & farmers
• Measures change without giving a chance for time lag – how do we know current programmes of measures are actually working...
• LCA puts leaching into a global perspective –Are we repairing systems rather than ever fixing them…Need to start using technology and big data ……Core issues – reduce food waste, less protein, pay more for food.
• Many countries face with monitoring issues for reactive nitrogen in groundwater, and both the unsaturated and saturated zone should be included in studying/evaluating nitrate on watershed scale.
• Also, diverse monitoring programs are important for following time lags and magnitudes of nitrate in both unsaturated and saturated soil zones. Good examples for such programs are the Netherlands and Belgium.
To sum up, we need: more detailed data, both unsat. and sat. zones inclusion, diverse monitoring programs.

N. Effects of management practices on N2O emissions
• High variabilty in emissions, noisy data
• Difficult to measure, modelling needed.
• No silverbullet – several microbial processes with different controls, different agricultutral systems, soils and cultural/socio‐economics contexts. Also climatic effects as well as historical legacy.
• Need to consider microbial level and agronomic practices.
We need:• good examples/demonstrations• modelling• mechanistic understanding

International N workshop Skara, SwedenDiscussion
Parallell session o.N efficiency in animal production
O

N utilisation in animal production
Knowledge?
Knowledge transfer?
Future needs?
N efficiencyEnergy efficiency

N utilisation in animal production
Major points from the discussion
• We have knowledge of the different parts of the system but we need to put the parts together in the whole production system on a farm level
• We need to focus more on the cropping systems and to relate it to the N efficiency of the animal
• Combinations of crop management, animal management plus purchase of supplies and economics are key parts for N use efficiency on the farm
• Needs for independent advisors and knowledge transfers in both directionsfarmers – researchers
• Work interdisciplinary and create international networks