a, Hao Donga, Ting-Ting Hana, Yun Chenb and Shou-Nian · CV curves of Pt DENs in TPrA solution S-8...
21
S-1 Supporting Information Enhanced anodic electrochemiluminescence of CdTe quantum dots based on electrocatalytic oxidation of co-reactant by dendrimer encapsulated Pt nanoparticles and its application for sandwiched immunoassays Lu-Lu Ren a , Hao Dong a , Ting-Ting Han a , Yun Chen b and Shou-Nian Ding a * a School of Chemistry and Chemical Engineering, Southeast University, Nanjing 211189, China b Department of Immunology, Nanjing Medical University, Nanjing, Jiangsu Province 210029, China *Corresponding authors. (S.-N. Ding) Fax: (+86)25-52090621. E-mail: [email protected]. Electronic Supplementary Material (ESI) for Analyst. This journal is © The Royal Society of Chemistry 2017
Transcript of a, Hao Donga, Ting-Ting Hana, Yun Chenb and Shou-Nian · CV curves of Pt DENs in TPrA solution S-8...

S-1
Supporting Information
Enhanced anodic electrochemiluminescence of CdTe
quantum dots based on electrocatalytic oxidation of
co-reactant by dendrimer encapsulated Pt
nanoparticles and its application for sandwiched
immunoassays
Lu-Lu Rena, Hao Donga, Ting-Ting Hana, Yun Chenb and Shou-Nian
Dinga*
aSchool of Chemistry and Chemical Engineering, Southeast University, Nanjing
211189, China
bDepartment of Immunology, Nanjing Medical University, Nanjing, Jiangsu Province
210029, China
*Corresponding authors. (S.-N. Ding) Fax: (+86)25-52090621. E-mail:
Electronic Supplementary Material (ESI) for Analyst.This journal is © The Royal Society of Chemistry 2017

S-2
CONTENS
Experimental Section Page
Reagents and chemicals S-3
Synthesis of CdTe QDs in aqueous S-4
Results and Discussion
Fig. S1. TEM image of Pt DENs S-5
Fig. S2. UV-vis spectra and FL intensity of CdTe QDs S-6
Fig. S3. TEM image of CdTe QDs S-7
Fig. S4. CV curves of Pt DENs in TPrA solution S-8
Fig. S5. Optimization experimental parameters S-9
Fig. S6. Stability of the ECL emission of CdTe QDs-Nafion/Pt DENs/GCE S-10
Fig. S7. TEM image of Fe3O4@SiO2 nanoparticles S-11
Fig. S8. TEM image of Fe3O4@SiO2/Pt DENs nanocomposites S-12
Fig. S9. FT-IR spectra of the Fe3O4@SiO2 before and after amination S-13
Fig. S10. Magnetization curves of Fe3O4, Fe3O4@SiO2 and Fe3O4@SiO2-Pt DENs S-14
Fig. S11. UV-vis spectra of the construction of captured probe S-15
Fig. S12. Optimization of pH, amount of QDs and incubation time S-16
Fig. S13. Stability, reproducibility and specificity of immunosensor S-17
Table S1. Comparison of different immunosensors for CEA detection S-18
Table S2. Detection of CEA using ELISA method and proposed immunosensor S-19
Table S3. Assay results of CEA in real samples S-20
References S-21

S-3
Reagents and chemicals. Cadmium Chloride (CdCl2∙2.5H2O, >99.0%) was obtained from
Shanghai Jinshan Tingxin Chemical Reagent Co. Ltd. (Shanghai, China). Sodium borohydride
(NaBH4, ≥96.0%), tellurium powder (Te, 99.9%), trisodium citrate dehydrate (Na3Cit∙2H2O),
FeCl3∙6H2O), ethylene glycol (EG) and sodium acetate anhydrous (NaAc) were provided from
Sinopharm Chemical Reagents Co. Ltd, (Shanghai, China). 3-Mercaptopropionic acid (MPA,
98.0%), tripropylamine, (3-aminopropyl) triethoxysilane (APTES, 97%), ethyl silicate (TEOS) and
glutaraldehyde (GA, 25%) were obtained from Aladdin Industrial Corporation. N-(3-
dimethylaminopropyl)-N’-ethylcarbodiimide hydrochloride (EDC) and N-hydroxysuccinimide
(NHS) were purchased from Sigma-Aldrich. Bovine serum albumin (BSA) was obtained from
Sangon Biotech Co., Ltd.

S-4
Synthesis of CdTe QDs in aqueous. CdTe QDs capped with 3-Mercaptopropionic acid (MPA)
were synthesized according to the literatures1, 2. Briefly, 67.0 μL of MPA and 91.3 mg of CdCl2∙2.5
H2O were dissolved in 40 mL of H2O. The pH of solution was adjusted to 11.0 using 1.0 M NaOH.
Under stirring with N2, the 1.0 mL of freshly prepared 0.04 M NaHTe solution (produced by the
reaction of oxygen-free NaBH4 solution with Te power under N2 atmosphere) was added to this
solution at room temperature. Then the solution was refluxed at 100 ℃. The obtained CdTe
products were precipitated for three times by ethanol with centrifugation at 10,000 rpm for 10
min. The purified CdTe precipitates were dispersed in deionized water and stored at 4 ℃ for late
use.

S-5
Fig. S1 TEM image of as-synthesized Pt DENs (inset: particle size distribution histogram of Pt
DENs).

S-6
Fig. S2 Normalized UV-vis absorption spectra and normalized FL intensity of CdTe QDs.

S-7
Fig. S3 TEM image of as-synthesized CdTe QDs.

S-8
Fig. S4 CV curves of (a) bare GCE, (b) Pt DENs/GCE in 0.1 M PBS (pH 7.5); (c) bare GCE, (d) Pt
DENs/GCE in 0.1 M PBS (pH 7.5) containing 10 mM TPrA. The volume of Pt DENs used to modify
GCE is 5 μL.
S-9
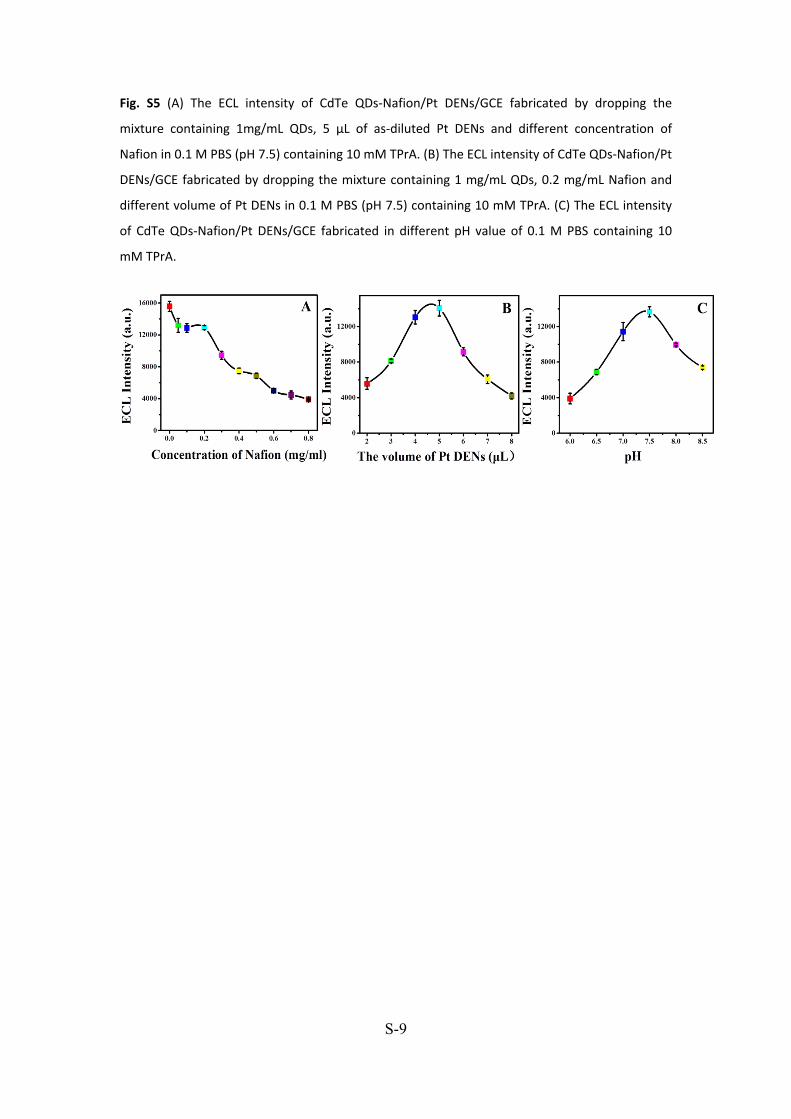
Fig. S5 (A) The ECL intensity of CdTe QDs-Nafion/Pt DENs/GCE fabricated by dropping the
mixture containing 1mg/mL QDs, 5 μL of as-diluted Pt DENs and different concentration of
Nafion in 0.1 M PBS (pH 7.5) containing 10 mM TPrA. (B) The ECL intensity of CdTe QDs-Nafion/Pt
DENs/GCE fabricated by dropping the mixture containing 1 mg/mL QDs, 0.2 mg/mL Nafion and
different volume of Pt DENs in 0.1 M PBS (pH 7.5) containing 10 mM TPrA. (C) The ECL intensity
of CdTe QDs-Nafion/Pt DENs/GCE fabricated in different pH value of 0.1 M PBS containing 10
mM TPrA.

S-10
Fig. S6 Stability of the ECL emission of CdTe QDs-Nafion/Pt DENs/GCE under continuous cyclic
potential (PMT 450V).
0 60 120 180
0
4000
8000
12000
EC
L In
tens
ity/a
.u.
Time/s

S-11
Fig. S7 TEM image of Fe3O4@SiO2 nanoparticles.

S-12
Fig. S8 TEM image of Fe3O4@SiO2/Pt DENs nanocomposites without cross-linking treatment.

S-13
Fig. S9 FT-IR spectra of the Fe3O4@SiO2 nanoparticles before and after surface modification with
APTES.

S-14
Fig. S10 Magnetization curves of Fe3O4NPs (a), Fe3O4@SiO2 NPs (b) and Fe3O4@SiO2-Pt DENs
nanocomposites (c) measured at 298 K. Insets: the photographs of Fe3O4@SiO2-Pt DENs
nanocomposites before and after magnetic separation by an external magnet.

S-15
Fig. S11 UV-vis spectra of Fe3O4@SiO2 (a), Pt DENs (b), Fe3O4@SiO2-Pt DENs (c), Ab1 (d) and
Fe3O4@SiO2-Pt DENs/Ab1 conjugation (e).

S-16
Fig. S12 Effects of pH (A), the amount of QDs added during labeling (B) and incubation time (C)
on the ECL intensity of immunosensor. (a) Incubation with Ag, (b) Incubation with QDs-Ab2.

S-17
Fig. S13 (A) ECL signals under continuous scan at different concentrations of CEA. (B) Storage
stability of the immunosenor. (C) The study on the reproduction of the immunosensor. (D)
Specificity investigations of the immunosensor for CEA detection: (a) blank, (b) Human IgG (500
ng/mL), (c) AFP (500 ng/mL), (d) BSA (500 ng/mL), (e) CEA (50 ng/mL), (f) CEA (50 ng/mL) +
Human IgG (500 ng/mL), (g) CEA (50 ng/mL) + AFP (500 ng/mL), (h) CEA (50 ng/mL) + BSA (500
ng/mL).

S-18
Table S1 The proposed ECL immunosensors for detecting CEA compared to other published ECL
immunosensor.
Materials, methods Linear ranges Detection limit Ref.
Au@BSA core/shell nanoparticles, ECL 0.001-200 ng/mL 0.3 pg/mL 3
g-C3N4 nanosheets, pH indicator 0.5-100 ng/mL 0.34 pg/mL 4
Silver nanoclusters, Fluorescence 0.01-1 ng/mL 3 pg/mL 5
Graphene Oxide-BaYF5:Yb, ECL 0.001-80 ng/mL 0.87 pg/mL 6
Gold composite, Electrochemical 1-150 ng/mL 0.2 ng/mL 7
Polythionine–gold, Electrochemical 0.005-40 ng/mL 2.2 pg/mL 8
Thiol derivative nanogold, Ultraviolet
(UV) spectroscopy5-80 ng/ml 2 pg/mL 9
CdTe QDs and AuNPs, ECL 0.01-40 ng/mL 1.67 pg/mL 10
This method 0.005-150 ng/ml 0.2 pg/mL -

S-19
Table S2 The detection for CEA in real samples using the proposed immunosensor and the
commercial ELISA method.
Sample No.Commercial ELISA
method (ng/mL)Our method (ng/mL)
Relative derivation
(%)
1 1.45 1.51 4.14
2 3.12 3.23 3.53
3 100.21 103.14 2.92

S-20
Table S3 The results of CEA detection in serum samples.
Initial human serum
(ng/mL)
The addition content(ng/mL)
The detection content(ng/mL)
RSD/%, n=3
Recovery/%
1 0.300.240.300.36
0.250.290.38
3.842.984.12
104.1796.7
105.56
2 0.650.520.650.78
0.500.670.82
5.962.133.09
96.15103.08105.13
3 20.6316.5020.6324.76
17.1320.6725.39
4.185.124.45
103.82100.19102.54

S-21
References
1 X. Zhang and S.-N. Ding, ACS Sens., 2016, 1, 358-365.
2 L. Zou, Z. Gu, N. Zhang, Y. Zhang, Z. Fang, W. Zhu and X. Zhong, J. Mater. Chem., 2008, 18, 2807.
3 A. Zhang, C. Huang, H. Shi, W. Guo, X. Zhang, H. Xiang, T. Jia, F. Miao and N. Jia, Sens. Actuators, B, 2017,
238, 24-31.
4 F. Shao, L. Jiao, L. Miao, Q. Wei and H. Li, Biosens. Bioelectron., 2017, 90, 1-5.
5 X. Yang, Y. Zhuo, S. Zhu, Y. Luo, Y. Feng and Y. Xu, Biosens. Bioelectron., 2015, 64, 345-351.
6 L. Zhao, J. Li, Y. Liu, Y. Wei, J. Zhang, J. Zhang, Q. Xia, Q. Zhang, W. Zhao and X. Chen, Sens. Actuators, B,
2016, 232, 484-491.
7 J. Shan and Z. Ma, Microchim. Acta, 2016, 183, 2889-2897.
8 X. Cai, S. Weng, R. Guo, L. Lin, W. Chen, Z. Zheng, Z. Huang and X. Lin, Biosens. Bioelectron., 2016, 81,
173-180.
9 H. Zeng, D. A. Y. Agyapong, C. Li, R. Zhao, H. Yang, C. Wu, Y. Jiang and Y. Liu, Sens. Actuators, B, 2015,
221, 22-27.
10 M. Yang, Y. Chen, Y. Xiang, R. Yuan and Y. Chai, Biosens. Bioelectron., 2013, 50, 393-398.