A Handbook on Governance and Socioeconomics of Large Marine Ecosystems
103
A Handbook on Governance and Socioeconomics of Large Marine Ecosystems Jon G. Sutinen Stephen B. Olsen Lawrence Juda Timothy M. Hennessey Thomas A. Grigalunas University of Rhode Island 2006
Transcript of A Handbook on Governance and Socioeconomics of Large Marine Ecosystems

A Handbookon
Governance and Socioeconomicsof
Large Marine Ecosystems
Jon G. SutinenStephen B. OlsenLawrence Juda Timothy M. Hennessey
Thomas A. Grigalunas
University of Rhode Island2006

A Handbookon
Governance and Socioeconomicsof
Large Marine Ecosystems
University of Rhode Island
2006
By
Stephen B. OlsenJon G. SutinenLawrence Juda
Timothy M. HennesseyThomas A. Grigalunas

Preface...........................................................................................................................................................................iv
Acknowledgments....................................................................................................................................................v
Foreword......................................................................................................................................................................vi
Part I: From Sectoral to Ecosystem-based Management.........................................................................1
A Paradigm Shift........................................................................................................................................................1
Ecosystem-based Management in LMEs....................................................................................................3Managing Humans in LMEs................................................................................................................................5
The Dimensions of Governance........................................................................................................................5
The Potential Benfits of Managing LMEs as Ecosystems.........................................................................8
The Global Environment Facility and Its Investments in LME Management..........................9
The Centrality of Governance Challenges in LMEs...............................................................................10
Part II: From Planning to Implementation: The Steps in the Governance Process...............12
A Strategic Approach to the Transition to Ecosystem-based Management inLMEs...........................................................................................................................................................................12
How Long Does It Take?............................... ........................................................................................................12Forming and Managing an Interdisciplinary Team.............................................................................. ............13
Understanding the Governance Cycle ........................................................................................................15Step 1: Issue Identification through the TDA......................................................................................................16Step 2: Negotiation of a Strategic Action Program..............................................................................................19Step 3: Formal Endorsement of the SAP................................................................................................................22Step 4: Adaptive Implementation of the SAP.......................................................................................................25Step 5: Evaluation and Sustained Learning..........................................................................................................26
The First Order: Assembling the Enabling Conditions for Ecosystem-based Management....................28The Second Order: Program Implementation as Behavioral Change...........................................................28Third Order Outcomes: The Achievement of Initial Ecosystem Quality Goals..........................................29The Fourth Order: Sustainable LME Conditions and Uses..........................................................................30
Part III: A Primer on the Challenges and Dimensions of LME Governance.............................31
Markets.......................................................................................................................................................................31Markets and Ecosystems........................................................................................................................................31
Pollution...............................................................................................................................................................32Destruction of Coastal Wetlands, Mangroves, Coral Reefs.........................................................................34Overfishing..........................................................................................................................................................34
Markets and Economic Justice...............................................................................................................................36What Does the Issue of Equity Have to do with LME Governance?..........................................................37
Correcting and Mitigating Market Failures....................................................................................................38
(ii)
TABLE OF CONTENTS
LME Governance Handbook

Government.........................................................................................................................39
Challenges for Successful Governance Programs.................................................................................41
Correcting and Mitigating Governance Failures....................................................................................45
Civil Society...............................................................................................................................................................46
Strengthening Adapative Governance for Complex Ecosystems...................................................47
Compliance, Enforcement and LME Governance.................................................................................48Compliance Behavior in Fisheries..........................................................................................................................48
Illegal Gains..........................................................................................................................................................49Expected Penalty.................................................................................................................................................49Moral Obligation.................................................................................................................................................50Social Influence...................................................................................................................................................50Aggregate Compliance Behavior......................................................................................................................51
Voluntary Compliance..............................................................................................................................................52User Participation................................................................................................................................................53Moral Suasion.....................................................................................................................................................56
Smart Compliance Policy..........................................................................................................................................56
Summary and Conclusions..................................................................................................................................60
Part IV. Sustainable Financing..........................................................................................................................61
The Financing Challenge....................................................................................................................................62
Planning for Sustainable Financing................................................................................................................63
Taming Markets......................................................................................................................................................64
Finance Mechanisms: An Overview..............................................................................................................66
Examples of Sustainable Financing for Marine Governance Initiatives.....................................69Tourism.................................................................................................................................................................... .69Energy and Mining..................................................................................................................................................70Fishery Management...............................................................................................................................................71Real Estate Tax Surcharges.....................................................................................................................................71Earmarked Bonds and Taxes...................................................................................................................................72For-profit Investments............................................................................................................................................72Potential Applications.............................................................................................................................................72
Criteria for Selecting Among Financing Options....................................................................................74
The Way Forward for Sustainable Financing of LMEs.........................................................................75
Readings and Sources of Information on Sustainable Financing.....................................................76
Part V. Future Directions.......................................................................................................................................79
References........................................................................................................................................................................80
(iii)Foreword

PREFACE
The primary purpose of this Handbook is to serve as a practical guide to innovators of governanceand socioeconomics in Large Marine Ecosystem (LME) projects. Based on a Global EnvironmentalFacility IW:LEARN-sponsored workshop for 11 LME programs,1 the Handbook is designed to beused in short courses and workshops on governance and socioeconomics science to support theecosystem approach to marine resources management.
The Handbook explains why governance and socioeconomics are important to the success ofresource management in the LME context. Good governance and socioeconomics can lead to goodoutcomes; bad governance and socioeconomics nearly always doom management efforts to failure.To improve the chances of successful management, the Handbook explains the basic principles andingredients that make for good governance and socioeconomics – at all phases of LME projectdevelopment, from the Transboundary Diagnostic Analysis to the Strategic Action Program, andimplementation of adaptive management and sustainable financing.
1Information on the workshop can be found at http://www.iwlearn.net/abt_iwlearn/pns/learning/b2-2lme
(iv) LME Governance Handbook

.
ACKNOWLEDGMENTS
This Handbook builds upon a series of meetings and publications on the human dimensions of largemarine ecosystems extending back over the past several years. With funding from the GlobalEnvironmental Facility (GEF) IW:LEARN program this Handbook and a training course wereproduced. The training course was held in Newport, Rhode Island in March 2006. It was attendedby 21 participants associated with nine large marine ecosystems. An early draft of the Handbookwas the basis for the training and this final version is much improved thanks to the excellentdiscussions and many suggestions of the participants.
We are particularly grateful for the strong support of Ken Sherman, director of the National Oceanicand Atmospheric Administration/National Marine Fisheries Service Narragansett Laboratory andOffice of Ecosystem Studies who instigated this effort and worked closely with the team on thedesign and content of the training workshop and this Handbook. Dann Sklarew (GEF IW:LEARN)served as our project manager. His many efforts in support of all aspects of the project are gratefullyacknowledged. The final draft of the Handbook benefited from the comments and suggestions ofmany reviewers including Alfred Duda (GEF Secretariat), Marea Hatziolos (World Bank), AndrewHudson (United Nations Development Program), and Veerle Vandeweerd, Ulrik Weuder and AnnieMuchai of the United Nations Environmental Progamme.
Glenn Ricci ably served as project manager at the University of Rhode Island Coastal ResourcesCenter (CRC) and dealt with the many substantive and logistical issues with effectiveness and goodhumor. Kimberly Kaine and Sharon Clements, also of CRC, with the assistance of Omar Fahmyand Ryan McLane smoothed the path for the participants’ travel and all the details that made thetraining a success.
(v)Foreword

FOREWORD
(vi)
Dr. Veerle VandeweerdUnited Nations Environment Programme
Coordinator GPA/Head, Regional Seas Programme
The health, and in some cases the very survival, of coastal populations depends upon the health andwell being of the marine and coastal ecosystems. The effective governance of marine and coastalecosystems is therefore essential to progress towards sustainable forms of development. Goodgovernance, in turn, requires a thorough understanding of the socioeconomic implications of coastaland marine ecosystem change. Together, the governance and socioeconomic aspects of large marineecosystems (LME) address the human dimensions of important regions of our planet.
This Handbook sets forth the defining features and the dynamic interplay between the governanceand socioeconomic modules and the three natural science modules (productivity, fish and fisheries,and pollution and ecosystem health) that together describe the condition and functioning of LMEs.As such it is a major contribution to LME planning and decision-making. The Handbook beginswith a discussion of ecosystem-based management as a paradigm shift from traditional sector-by-sector management. It proceeds to analyze the planning and decision-making process as it unfoldsinto a plan of action for ecosystem-based management. A primer on the driving forces andchallenges that must be understood and addressed in LME management explores markets and thefactors that determine whether stakeholders comply with or resist the implementation of rulesgoverning how natural resources are allocated and utilised. The final chapter is devoted to thecritical issue of sustained financing for long-term ecosystem-based management initiatives.
The production of the Handbook contributes to the partnership that links the coastal and marineactivities of the global Regional Seas Programme coordinated by the United Nations EnvironmentalProgramme (UNEP) with the LME approach. This joint initiative also contributes to one of theglobal Regional Seas Strategic Directions to “(d)evelop and promote a common vision andintegrated management, based on ecosystem approaches, of priorities and concerns related to thecoastal and marine environment and its resources in Regional Seas Conventions and Action Plans,introducing amongst others proactive, creative and innovative partnerships and networks andeffective communication strategies.”
LME Governance Handbook

(vii)
The Regional Seas Programmes provide a policy framework for the regional implementation of theGlobal Programme of Action for the Protection of the Marine Environment from Land-basedActivities (GPA). The GPA is the only global Programme of Action that addresses the linkagesbetween freshwater and the marine and coastal environment. It is now recognised that some 80percent of the pollution load in the oceans originates from land-based activities. The Regional Seas/LME partnership and the Global Environmental Facility/LME approach to ecosystem-basedmanagement are crucial to the implementation of the GPA.
This Handbook will complement the publication of “Ecosystem-based Management: Markers ForAssessing Progress,” among other publications, for the 2nd Intergovernmental Review Meeting ofthe GPA. This document, jointly produced by the GPA, the Coastal Resources Center of theUniversity of Rhode Island, and UNEP Collaborating Centre on Water and the Environment offerssets of markers that can be used to assess progress in the integrated management of river basins,coasts or large marine ecosystems. Like the Handbook, it provides guidance on the design andconduct of ecosystem-based management that addresses both the impacts of human activities andthe need to sustain or restore the goods and services generated by healthy ecosystems.
This “Handbook on the Governance and Socioeconomics of Large Marine Ecosystems” will be animportant reference that provides managers with important insights into good governance practicesand the socioeconomic dimensions of marine and coastal ecosystems.
Foreword

1
PART I
FROM SECTORAL TO
ECOSYSTEM-BASED MANAGEMENT
A PARADIGM SHIFTThe ecosystem paradigm has emerged as the dominant approach to managing natural resources andthe environment. Traditionally, management efforts have been organized around particular uses suchas fisheries or mineral exploitation, resulting in separate governance regimes for each use. Over timeit has become ever more apparent that such a sectoral approach results in conflicts among users andis inadequate in meeting the need for sustaining the goods and services that flow from healthyecosystems (Commission on Marine Science Engineering and Resources, 1969; Independent WorldCommission on the Oceans, 1998; Pew Oceans Commission, 2003; United States Commission onOcean Policy, 2004).
The shift away from the management of individual resources to a systems approach is evidenced inthe broader perspective of ecosystem-based management that has taken hold in a number of fieldssuch as forestry and fisheries and has been endorsed by a number of studies and expertcommissions (U.S. Commission on Ocean Policy, 2004; Pew Commission on the Oceans, 2003;the Independent Commission on World Oceans, 1998). It is also reflected in the actions of a varietyof U.S. states (Juda, 2003; Laffoley, 2004) and in the work of international organizations rangingfrom the International Oceanographic Commission, to the Food and Agriculture Organization, to theUnited Nations Environment Program, to the Global Environment Facility.
Why the need for change from traditional ways of governing natural resources and the naturalenvironment? What is ecosystem-based management and what advantages does it offer? And, whathas to be done in the name of this new approach?
Economic activity and human well-being depend on the functioning of natural systems that providegoods such as clean air, clean water, food, and services, such as the filtering of pollutants andprovision of living resource habitat. The economic value of the goods and services generated by theoperation of natural systems has been assessed at extremely high levels and the loss of these goodsand services would have devastating socioeconomic effects at local, regional, and global levels(Costanza, 1997; GEF, 1998; Daily, 2000; U.S. Commission on Ocean Policy, 2004). Yet overtime, the natural systems that provide these benefits have come under growing pressure as aconsequence of a combination of factors including:
• Growing world population and the global scale of markets that generate increasingdemands for natural resources
• Modern technology that enhances human capabilities to exploit natural resources, oftenwith attendant damage to the environment
Sectoral to Ecosystem-based Management

2 LME Governance Handbook
• Human impacts on the environment, including living resource habitat destruction and theintroduction into the environment of vast quantities of waste, including effluents which maynot be biodegradable, may be highly toxic, or, in the ocean environment, may significantlyreduce oxygen availability; overexploitation of renewable resources (fisheries, freshwater,etc.); and introduction/transfer of invasive species.
In a number of areas such as fisheries, coastal water quality, climate change and sea level rise, it isclear that existing management efforts are falling short (Millennium Ecosystem Assessment SynthesisReport, 2005). When the usual ways of doing things no longer result in desired outcomes, it isnatural that new approaches will be considered (Kuhn, 1970).
In the years preceding the 1992 United Nations Conference on the Human Environment andDevelopment (UNCED), attention progressively turned to ecosystem-based management (WorldCommission on Environment and Development, 1987). The Rio Declaration adopted at UNCEDcalled upon States “to conserve, protect and restore the health and integrity of the Earth’secosystem” (Rio Declaration, principle 7, 1992). And, Agenda 21 adopted at that meeting observedthat oceans and adjacent coastal areas form “an integrated whole that is an essential component ofthe global life-support system.” This realization, it was noted, requires new approaches to marineand coastal area management and development at the national, subregional, regional and globallevels – approaches that are “integrated in content and are precautionary and anticipatory inambit…” (Agenda 21, 17.1, 1992). Indeed, by 1997, the UN Commission on SustainableDevelopment found that:
The concept of integrated management of watersheds, river basins, estuaries and marine and coastalareas is now largely accepted in the United Nations system and in most countries as providing acomprehensive, ecosystem-based approach to sustainable development (E/CN.17/1997/2/Add.16(24 January 1997).
In simple terms, ecosystem-based management recognizes that human communities, like plant andanimal communities, are interdependent and interact with their physical environment to form distinctecological units called ecosystems. These units that provide the basis of life for fish, birds, marinemammals, and humanity itself are transboundary in character, typically cutting across existingpolitical and jurisdictional boundaries and, thus, subject to multiple management systems. Likewise,many human actions and their consequences, including pollution, extend across jurisdictionalboundaries and impact the functioning of important ecosystems shared by multiple jurisdictions.
The emergence of the ecosystem paradigm seeks to address management failure associated with thelack of congruence of (a) ecologically defined space, that is, the geographic areas encompassed bythe extent of natural ecosystems and (b) politically defined space, the geographical area comingunder the legal jurisdiction of particular political authorities (Juda, 1999; Juda and Hennessey,2003). It also seeks to overcome the significant limitations posed by the traditional, single sector/single species approach to management of natural resources and the natural environment. Thistraditional type of management generates unintended detrimental effects, that is, negativeexternalities. For example, the widespread and heavy use of fertilizers employed by modernagriculture has resulted in water bodies, as in the U.S. Gulf of Mexico, the Baltic and the BlackSeas, that are oxygen depleted and, consequently, devoid of fisheries. By definition, cosystem-based approaches to management take a systems view and seek to incorporate such potentialexternalities into decisionmaking (Christensen, et al., 1996; Franklin, 1997).

3
Ecosystem-based management has been defined by the Ecological Society of America asmanagement:
…driven by explicit goals, executed by policies, protocols, and practices, and madeadaptable by monitoring and research based on our best understanding of the ecologicalinteractions and processes necessary to sustain ecosystem structure and function(Christensen, et al., 1996).
As discussed below, such management requires substantial change in a number of areas of humanactivity and strongly underscores the need for intersectoral, stakeholder, and intergovernmentalcoordination and cooperation.
The approach in this Handbook has been inspired by our own experiences in the design andimplementation of coastal management efforts in the U.S. and several low-income nations, and bythe large marine ecosystem (LME) management efforts underway in several regions. Themanagement and assessment of LMEs – comprised of estuaries, inshore shallow waters and linkedwatersheds – is an expression of a movement that substituted managing individual sectors with anintegrated approach directed at sustaining the productive potential for ecosystem goods andservices (See Table 1). In ecosystem-based management, the associated human population andeconomic/social systems are seen as integral parts of the ecosystem. Most importantly, ecosystem-based management is concerned with the processes of change within living systems. Ecosystem-based management is therefore designed and executed as an adaptive, learning-based process thatapplies the principles of the scientific method to the processes of management.
ECOSYSTEM-BASED MANAGEMENT IN LMESDeveloped by Kenneth Sherman and Lewis Alexander, the concept of LMEs provides a science-based approach for dividing the world’s oceans into meaningful, ecosystem-based units that havemanagement utility (Sherman and Alexander, 1986; Alexander, 1993). LMEs include geographicareas of oceans that have distinct bathymetry, hydrography, productivity, and trophically dependentpopulations. The geographic limits of most LMEs are defined by the extent of continental marginsand the seaward extent of coastal currents. Over 90 percent of all fish and other living marine
Sectoral to Ecosystem-based Management
Table 1. Ecosystem-Based Management as a Paradigm Shift
From To
• Individual species • Ecosystems
• Small spatial scale • Multiple scales
• Short-term perspective • Long-term perspective
• Humans independent of ecosystems • Humans as integral parts of ecosystems
• Management divorced from research • Adaptive management
• Managing commodities • Sustained production potential for
ecosystem goods and services
From: Lubchenco (1994) in Sherman and Duda (1999)

4 LME Governance Handbook
resources produced are taken from the world’s 64 LMEs. Many LMEs are currently stressed fromoverexploitation of marine resources, habitat degradation, and pollution.
It is useful to emphasize the significance of the individual words in the name Large MarineEcosystems. The significance of large is that many of the natural resources of the areas aretransboundary. In other words, the resources, such as fish stocks, mineral deposits, etc., cross thejurisdictional boundaries of two or more sovereign states. The word marine is significant to theextent that the focus of the approach is on marine resources. However, the marine resources and theoverall status of the marine environment is inextricably linked to the coastal watersheds that borderthe ocean portion of the LME. As such, the LME model links the management of drainage basinsand coastal areas with continental shelves and dominant coastal currents. The approach:
• Addresses the many-faceted problem of sustainable development of marine resources
• Provides a framework for research, monitoring, assessment and modeling to allowprediction and better management decisions
• Aids in focusing marine assessments and management on sustaining productivity andconserving the integrity of ecosystems (Sutinen, et al., 2000)
The Global Environment Facility (GEF) and its Implementing Agencies (World Bank, UnitedNations Development Program [UNDP] and United Nations Environmental Program [UNEP])have adopted the LME approach for use in marine ecosystem management and assessment, seeingit as providing a framework for integrated management efforts (World Bank, 1996: Annex A).
As will be considered below, the LME-based approach requires social science as well as naturalscience investigations, since many of the root causes of the problems of the marine environment arethe consequences of human activities (Pernetta and Mee, 2001; Belausteguigoitia, 2004; Newell, etal., 2005). The GEF LME initiative has five modules:
• Productivity: focuses on oceanic variability and its effect on the production ofphytoplankton and zooplankton that are at the base of the ocean food chain; it is concernedwith the carrying capacity of ecosystems and their ability to sustain fishery and other livingresources.
• Fish resources and fisheries: considers the sustainability of individual species and themaintenance of biodiversity of living resources.
• Pollution and ecosystem health: examines ecosystem status and threats to theproductivity and sustainability of ecosystems as a consequence of eutrophication, biotoxins,pathology, and emerging diseases.
• Socioeconomics: considers human actions and the long-term sustainability andassociated socioeconomic benefits and costs of human activities.
• Governance: concentrates on adaptive management, stakeholder participation, andefforts to influence human behavior in support of ecosystem sustainability.
The first three modules are natural resource science-based and have been well-developed.Extensive scientific work has resulted in methods for monitoring and assessing the productivity, fishresources and fisheries, pollution and ecosystem health of LMEs (Sherman and Alexander, 1981,

5
1986; Sherman, et al., 1991, 1993, 1996, 1998; Sherman and Tang, 1999; Sherman and Skjoldal,2002; Duda and Sherman 2002; Hempel and Sherman 2003). Sustained, accurate and efficientassessments of changing ecosystem states are now feasible because of the advent of advancedtechnologies applied to coastal ocean observation and prediction systems. Such systems can nowmeasure ocean productivity, changes in fish stocks, and changes in water and sediment quality andgeneral health of the coastal ocean.
Consideration of the socioeconomic and governance modules has been more limited, despite thefact that work on these modules is essential to achieving effective ecosystem-based management.But as attempts are made to go from theorizing and conceptualization of natural system dynamics tooperationalization and implementation of management strategies, greater consideration must be givento the human dimension of LMEs, represented by the latter two modules (Juda, 1999; Juda andHennessey, 2001).
Managing Humans in LMEsEfforts to manage resources and the environment in the context of ecosystems are really aboutmanaging human behavior and encouraging and inducing behavioral patterns that take into accountthe operation of the natural world. People, of course, are part of that world and, given theirincreasing numbers and their intensifying use of resources and the environment, together with theimplications of their employment of ever more sophisticated technologies, their activities haveincreasing or perhaps even dominant significance in the continued evolution of natural systems. Thus,ecosystem-based management is not simply about science; successfully effectuating suchmanagement requires a very significant shift in human mindsets and behavior (Grumbine, 1993;Newell et al., 2005). Accordingly, careful attention must be given to human institutions, organization,activities, values, and their implications for the ecosystems and resources for which protection issought (McGlade and McGarvey, 1991; Hanna, 1998; Juda, 1999).
Management of LMEs requires not only knowledge of the changing pattern of human use ofecosystems and their ecological impacts but also the effects of change on the availability ofsocioeconomic benefits to be derived from LMEs. Both human and ecological systems arecomposed of complex webs of interrelated components and processes. Interactions occur withineach respective system and also between systems. It is necessary to view the natural environmentand related human dimensions as a set of interrelated components and processes rather thanisolated elements that act independently.
THE DIMENSIONS OF GOVERNANCEThe term “governance” has become prominent in many settings where a fundamental rethinking ofsocietal goals, structures and mores is seen as necessary. As defined by Olsen (2003), governanceaddresses the values, policies, laws and institutions by which a set of issues are addressed.Governance probes the fundamental goals and the institutional processes and structures that are thebasis for planning and decision-making. Management, in contrast, is the process by which humanand material resources are harnessed to achieve a known goal within a known institutional structure.We therefore speak of business management, park management, personnel management or disastermanagement. In these instances, the goals and the mechanisms of administration are well known and
Sectoral to Ecosystem-based Management

6 LME Governance Handbook
widely accepted. Governancesets the stage within whichmanagement occurs.
The paradigm shift requiressuch a profound reassessmentof how change withinecosystems is analyzed, howgoals are set and how humanactivities within ecosystems areregulated that the fifth LMEmodule is termed governanceand not management. However,once the paradigm shift hasbeen made successfully, the
day-to-day operations within an LME will assume the characteristics of management. It would bemore accurate to refer to ecosystem-based governance and not ecosystem-based management.The reality, however, is that the term ecosystem-based management has been formally adopted bymany institutions even though its practice is widely recognized as requiring the fundamental shifts inthinking and behavior that are associated with governance.
Governance encompasses the formal and informal arrangements, institutions, and mores thatstructure and influence:
• How resources or an environment are utilized
• How problems and opportunities are evaluated and analyzed
• What behavior is deemed acceptable or forbidden
• What rules and sanctions are applied to affect the pattern of use
We emphasize that governance is not synonymous with management. It includes all othermechanisms and institutions that serve to alter and influence human behavior (Juda, 1999; Juda andHennessey, 2001).
As suggested in Figure 1, there are three mechanisms by which the processes of governance areexpressed: the marketplace, the government, and the institutions and arrangements of civil society.1These mechanisms interact with one another through complex and dynamic interrelationships.Individually and collectively these three mechanisms of governance affect how humans use andotherwise interact with a LME. Failure to heed the signals from these institutions may lead tosanctions that range from economic loss, to incarceration or monetary penalties, or to expulsion oralienation from the community.
Each of the three governance mechanisms can alter patterns of behavior through tools such as thoseidentified in Table 2. Which tools to utilize in particular LMEs, and in what combination, are matters
Economic
Pressures
Legal/Political
Pressures
Social
Pressures
Human Uses of Ecosystems
Markets
Government
Civil Society
Figure 1. Three key governance mechanisms
1 We use the term civil society to refer to the arena of uncoerced collective action around shared interests,purposes and values, where its institutional forms are distinct from those of the state (government) and market.See the Centre for Civil Society (http://www.lse.ac.uk/collections/CCS/introduction.htm).

7
requiring careful considerationby governments andstakeholders.
The marketplace, in whichgoods and services areexchanged by profit-seekingproducers, traders, andconsumers, affects how theenvironment is utilized, whatresources are extracted, andthe manner in which theseresources are exploited. Fortheir part, consumers may cometo consider not only the productitself but also the manner in which it is produced, providing some significance to eco-labeling thatmay be supportive of natural ecosystem protection. Very importantly, contemporary efforts to attachmonetary value to ecosystem services (Costanza, 1997; Independent Commission on the WorldOceans, 1998), which have been regarded in the past as free, give a more concrete sense of valueto those services, demanding more careful consideration of the natural environment. It could alsoencourage the internalization of the costs of maintaining such services. In a variety of ways, themarketplace could make significant contributions to ecosystem protection. These topics arediscussed in greater detail in Part III.
Government policy and regulation, whether at a local, regional, or national level, is well recognizedas a mechanism that can affect human behavior. Tax policies can provide incentives for particulartypes of conduct and, through government spending patterns, a substantial portion of society’sresources may be directed so as to promote specific objectives. Regulatory efforts, such as zoningand permitting, can channel efforts along desired paths and, with their potential for unpleasantconsequences in the form of fines or even imprisonment, can discourage undesired behavior. But inthe long run, and perhaps most importantly, education may encourage environmental and ecosystemawareness that can encourage behavioral patterns supportive of ecosystem sustainability.
Social norms and networks – sometimes referred to as ‘social capital’ – shape individual andcollective behavior, and also facilitate cooperation among individuals and between groups ofindividuals. By encouraging trust, civic engagement, and social networks, social capital can enhanceeffective governance while reducing management costs (Grafton, 2005). Social capital appears tohave great potential for advancing ecosystem-based management in informal governance systems.As a manifestation of social capital, nongovernmental organizations (NGOs) are becoming moreevident in political activity at local, national, and international levels; there is a proliferation of NGOsthat actively and purposefully seek to influence public policy on a wide range of issues. NGOs are arecognized force and play multiple roles in affecting behavior and public policy. They may serve asadvocates of particular courses of action for government (e.g., limit the construction of shrimpponds) or of societal behavioral patterns (e.g., rejection of corrupt practices) or seek to encourageor discourage enactment of particular pieces of legislation. In democratic and pluralistic societies,nongovernmental groups play important constituency roles, affecting both governmental andmarketing decisions with attendant ramifications for the natural environment.
Sectoral to Ecosystem-based Management
Table 2. Major Governance Mechanisms and Tools
Government
• Laws and regulations
• Taxation and spending policies
• Education and outreach
Marketplace
• Profit-seeking
• Ecosystem service evaluation
• Eco-labeling & green products
Institutions and organizations of civil society
• Socialization processes
• Constituency roles and “issue framing”
• Co-management

8 LME Governance Handbook
In traditional political usage, NGOs are exemplified by environmental organizations such as theInternational Union for the Conservation of Nature and the World Wildlife Fund or tradeassociations such as the Chamber of Commerce or the National Association of Manufacturers thathave purposeful political agendas which, through explicit strategies, seek to influence publicattitudes, governmental policy, and the marketplace so as to achieve particular goals. But for thepurposes of the present analysis, NGOs should be thought of more broadly and include bodies thatmay be less overtly political in nature, ranging from community associations to fraternal organizationsto families and religious groups. All of these may serve as agents of socialization and thus shapehuman perceptions, preferences, and attitudes in positive ways.
While such groups may not issue edicts that are legally binding (in the way that law is in civil society)or explicitly seek to change governmental or economic policy, they do influence ideas and patternsof thought and often generate meaningful social pressures that encourage adherence to particularnorms of behavior. Nongovernmental institutions and arrangements can beneficially affect ecosystemuse patterns.
The Potential Benefits of Managing LMEs as EcosystemsSociety reaps tremendous benefits from the world’s oceans and coasts. In the United States, forexample, the economies of coastal watersheds account for half of the gross domestic product and60 million jobs. The human activities that generate this income and employment include marinetransportation and trade, fisheries, tourism and recreation. These activities draw people to settle inand visit coastal areas. As a result, the coasts are becoming increasingly crowded. In 2003, 53percent of the U.S. population lived in coastal counties, a zone that comprises only 17 percent ofthe total U.S. land area. Twenty-three of the 25 most densely populated counties are on the coast,and average 300 persons per square mile. In addition, there is growing demand to use living marineresources and to produce energy and minerals from offshore deposits.
The growth and settlement of populations in the coastal zone, in conjunction with the associated
Table 3. Linkages Between 5 LME Modules and TDA/SAP Processes
LME Module TDA SAP
1. Productivity Transboundary issue, identify
threats and root causes
Regional and national reforms to
maintain productivity
2. Fish resources
and fisheries
Transboundary issue, identify
threats and root causes
Regional and national reforms to
sustain fisheries
3. Pollution &
Ecosystem
Health
Transboundary issue, identify
threats and root causes
Regional and national reforms to
reduce pollution and sustain ecosystem
4. Socioeconomics Socioeconomic impact analysis,
including prioritization of issues
Economic instruments, investments,
etc. as tools for SAP implementation
5. Governance Governance analysis;
stakeholder analysis
Legal, policy and institutional reforms;
ministerial level adoption; stakeholder
involvement (private sector & civil
society)

9
economic activities, constitute a set of major stressors on coastal and ocean ecosystems. Humans’activities often lead to the degradation and loss of natural habitats; added waste disposal andpollution discharges to water bodies; overexploitation of living marine resources; invasive species,pathogens, toxic contaminants, and harmful algae blooms; and increased vulnerability to coastalhazards. In recent years in the U.S., for example, nearly a fourth of the estuarine areas wereunsuitable for swimming or fishing; and there were 18,000 days of beach closings and advisoriesissued in 2003 due to high bacterial counts. Nonpoint source pollution has increased as humanactivities have grown in coastal areas, causing nutrient enrichment, hypoxia, harmful algal blooms,toxic contamination, and other problems that plague coastal waters. Problematic point sources ofpollution include sewer system overflows, septic systems, wastewater treatment plants, animalfeeding operations and industrial facilities – all of which are the products of major economicactivities. In addition, the overexploitation of fisheries and other living marine resources continues forthe majority of the world’s stocks.
It is clear from this evidence that the failure to properly manage the human activities that affectoceans and coasts is compromising their ecological integrity, diminishing our ability to fully realizetheir potential, costing jobs and revenue, threatening human health, and putting our future at risk.
Management of human activities that affect an LME will, by necessity, depend on the informationproduced by a comprehensive monitoring network to assess the status and trends of the LME. Amonitoring network is ‘essential’ to an ecosystem approach to management, since policy must bebased on a scientific ‘understanding of the natural, social, and economic processes that affectoceans and coastal environments’ (United States Commission on Ocean Policy 2004, emphasisadded).
In other words, it is essential to understand the social and economic processes that affect oceansand coastal environments. Policy makers and stakeholders need to understand and have the abilityto explain variations in those human activities that impact habitat, pollute and over exploit the naturalresources in an LME.
THE GLOBAL ENVIRONMENT FACILITY AND ITS INVESTMENTS
IN LME MANAGEMENTThe Global Environment Facility (GEF, 1996a) defines its role in international waters as that of acatalyst for the implementation of ecosystem-based approaches to managing international watersand their drainage areas. The GEF’s investments follow a two-step process. The first calls for thepreparation of a Transboundary Diagnostic Analysis (TDA) that identifies threats, issues and theirroot causes. The TDA is followed by the negotiation of a Strategic Action Program (SAP) thatcreates the enabling conditions and identifies the necessary actions and commitments (includingpolicy, legal and institutional reforms and investments) that will be required to make the managementof an LME an operational reality. “Inter-ministry committees,” i.e., committees of representativesfrom pertinent national ministries, oversee TDA/SAP development and national-levelimplementation. Thus, both TDA and SAP are designed and implemented through country-drivenprocesses that involve the governments of the countries, civil society and private sector stakeholderswith interests in the marine resources and management. The relationship between the TDA/SAP andthe five LME modules is presented below as Table 3.
Sectoral to Ecosystem-based Management

10 LME Governance Handbook
The GEF funds for the TDA/SAP process are provided through grants administered by GEFimplementing agencies – i.e., either the World Bank, UNDP or UNEP. The countries within eachLME provide matching funds and in-kind contributions.
During the World Summit on Sustainable Development held in Johannesburg in 2002, participatingworld leaders agreed to adopt four marine goals: (1) to achieve substantial reductions in land-basedsources of pollution in 2006; (2) to introduce an ecosystems approach to marine resourceassessment and management by 2010; (3) to designate a network of marine protected areas by2021; and (4) to maintain and restore fish stocks to sustainable yield levels by 2015. These goalsreaffirmed the need for GEF investments in LME management.
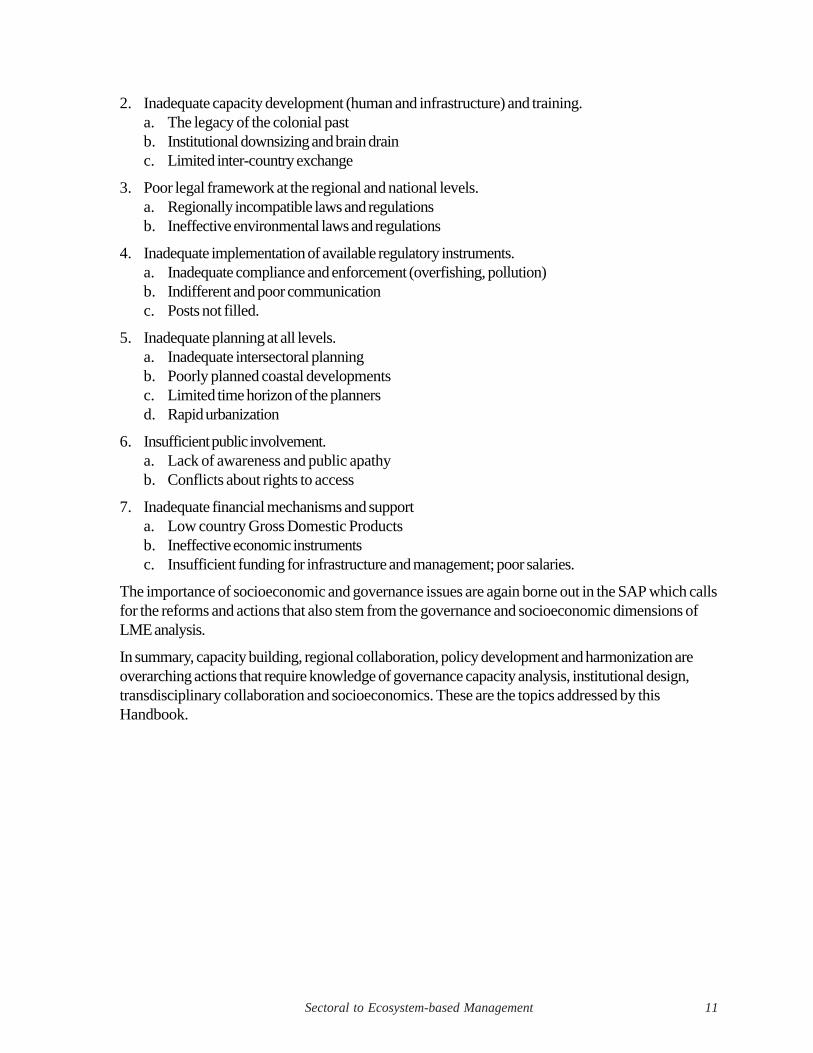
Since 1993, GEF has provided over US$260 million and mobilized US$450 million in additionalfunding to improve the assessment and management of LMEs across 121 countries participating inGEF projects (Duda and Sherman 2002; Alfred Duda, pers. comm.) following a country-drivenprocess described in Part II of this Handbook. Of 18 GEF-funded LME projects, the BenguelaCurrent project and the Guinea Current project are in the process of preparing SAPs, and threehave reached agreements among the several ministries in each country bordering the LMEs toestablish joint commissions to serve as decision-making bodies to apply ecosystem-basedmanagement practices.
THE CENTRALITY OF GOVERNANCE CHALLENGES IN LMESWhile the three natural science modules have so far received the greatest attention it is clear that thepriority issues that must be addressed to restore and/or sustain the qualities of any LME all arerooted in the design and implementation of a reformed governance structure and a new planning anddecisionmaking process. This is well illustrated by the Benguela Current LME. Here, the TDAidentified the following seven priority issues in the region:
• Decline in commercial fish stocks
• Uncertain ecosystem status
• Inadequate capacity to assess the ecosystem
• Deterioration in water quality
• Habitat destruction and alteration
• Loss of biotic integrity
• Harmful algal blooms
Six of the seven generic root causes (2-7) for these issues are challenges that requiresocioeconomic analysis and governance reforms.
1. A complex and variable ecosystem.a. Changing state of the Benguela Currentb. Inadequate informationc. Difficulty in monitoring and assessment
11
2. Inadequate capacity development (human and infrastructure) and training.a. The legacy of the colonial pastb. Institutional downsizing and brain drainc. Limited inter-country exchange
3. Poor legal framework at the regional and national levels.a. Regionally incompatible laws and regulationsb. Ineffective environmental laws and regulations
4. Inadequate implementation of available regulatory instruments.a. Inadequate compliance and enforcement (overfishing, pollution)b. Indifferent and poor communicationc. Posts not filled.
5. Inadequate planning at all levels.a. Inadequate intersectoral planningb. Poorly planned coastal developmentsc. Limited time horizon of the plannersd. Rapid urbanization
6. Insufficient public involvement.a. Lack of awareness and public apathyb. Conflicts about rights to access
7. Inadequate financial mechanisms and supporta. Low country Gross Domestic Productsb. Ineffective economic instrumentsc. Insufficient funding for infrastructure and management; poor salaries.
The importance of socioeconomic and governance issues are again borne out in the SAP which callsfor the reforms and actions that also stem from the governance and socioeconomic dimensions ofLME analysis.
In summary, capacity building, regional collaboration, policy development and harmonization areoverarching actions that require knowledge of governance capacity analysis, institutional design,transdisciplinary collaboration and socioeconomics. These are the topics addressed by thisHandbook.
Sectoral to Ecosystem-based Management

12 LME Governance Handbook
PART II
FROM PLANNING TO IMPLEMENTATION: THESTEPS IN THE GOVERNANCE PROCESS
A STRATEGIC APPROACH TO THE TRANSITION TO ECOSYSTEM-BASED
MANAGEMENT IN LMESWe now turn to the processes by which the governance and socioeconomic dimensions of LMEsare analyzed and a program of action is negotiated and then implemented. This is a complexundertaking that requires integrating across the five modules by which GEF investments in LMEmanagement are organized. The GEF recommends completing a series of actions that are organizedas a Transboundary Diagnostic Analysis (TDA) followed by the negotiation of a Strategic ActionProgram (SAP). Similar processes have been followed by all other efforts to manage largeecosystems containing a diversity of competing human activities.
GEF financing in support of LME management can be obtained through the following grants:
• PDF Block A grants (up to $50,000) finance the very early stages of project or programidentification
• PDF Block B grants (up to $350,000 for single country and up to $700,000 for multi -countryprojects) finance information gathering activities and the stakeholder consultations necessary toprepare full-sized project proposals
• PDF Block C grants (up to $1 million) provide additional financing, where required, for large,complex projects to complete technical design and feasibility analysis
• Medium-Sized Projects (MSPs; up to $1 million)
• Full-Sized Projects (>$1 million) for TDA/SAP development and/or implementation
How Long Does It Take?The transition from traditional sector-by-sector management to ecosystem-based managementrequires important shifts in the thinking and the behavior of both individual specialists and institutions.It is a process that evolves over considerable periods of time. Duda (2002) points out thatexperience in the management of such large ecosystems as the North American Great Lakes, theBaltic Sea, the Rhine basin and the Mediterranean Sea shows that 15-20 years were requiredbefore meaningful commitments to joint management improvements could be secured from theseveral countries involved. More time is needed before the transboundary water bodies respond tothe reductions in the stress from pollution, overfishing, eutrophication and habitat alteration that arebrought by the implementation of a program of action. Attaining environmental and societal goals fordesired ecosystem goals at this large scale may, therefore, require 20 to 30 years. As aconsequence, GEF investments in LME management “will often have ceased before actual waterbody improvements can be detected” (Duda, 2002). A major strength of the TDA/SAP process is

13
that it has adopted a country-driven, learning-by-doing approach by which such concrete actions asmonitoring the condition of the fisheries, conflict resolution and piloting of management actions allcontribute to building capacity in local institutions and demonstrating the benefits of ecosystemmanagement. In the case of the Benguela Current LME, the most advanced of the GEF-supported
LME management programs, seven years wererequired to complete the TDA/SAP process andmake the transition into an initial phase ofimplementation in 2002.
Forming and Managing anInterdisciplinary TeamThe holistic nature of ecosystem management andthe need to understand the dynamics of thefunctioning, condition, uses and governance of acomplex system requires a team with capabilitiesin diverse fields. Figure 2 below illustrates thetypical situation in which specialists representing
such diverse fields in the natural sciences, economics,political science, law and journalism come together toanalyze, and act upon, the issues posed by thegovernance of an ecosystem. Each of these specialistshas been shaped by their specialized education and hasa distinct vocabulary, draws upon different conceptualframeworks and often has a worldview shaped by adistinct values and beliefs. Each of these is illustrated inthe diagram as an independent “ring.” The central pillarrepresents the ecosystem governance issues that thesespecialists are working to understand and address.
In Figure 3, a cable links the rings together. The cablerepresents a shared appreciation of the manydimensions of the issues and the specialized knowledgeof each specialist. When the cable is present, an “epistemic community” has been formed (Haas1992). Its members share the same ultimate goals and have learned to respect and sufficientlyunderstand the fundamental features of each other’s disciplines, so that the team as a whole cananalyze issues from the perspectives of the five modules by which LME analysis and planning isorganized.
In LMEs supported by the GEF, an interdisciplinary team is usually formed in the initial stages of thepreparation of the TDA as a Technical Task Team (TTT) led by a project coordinator. Specialists infisheries, various branches of oceanography, socioeconomics and governance must together identifyand understand the issues that the TDA and SAP will address. The importance of thesocioeconomic and governance dimensions of LME management makes it imperative that thesesocial scientists are members of the team from the outset. The broad interdisciplinary representationrequired at this stage does not imply retaining the best scientific and academic experts, but ratherthose familiar with the condition and management issues of the LME being addressed (Mee, 2003).
Planning to Implementation
Figure 2. Diverse Perspectives of LMEspecialists
Figure 3. An epistemic community ofspecialists with shared perspectives

14 LME Governance Handbook
Table 4. Assembling The Enabling Conditions For Sustained LME Governance Through
the TDA/SAP Process
TDA/SAP Essential Actions TDA/SAP Process Indicators
Project Development
Design project concept Facilitator hired
Technical task team (TTT) formed
Project approved by GEF
STEP 1: Issue Identification & Constituency Building
Characterize management issues Project manager appointed
Identify stakeholders and their interests Inter-ministerial committees and steering
committee formed
[Prepare a governance baseline to assess existing management
system]
Draft TDA prepared
Identify & locate trans-boundary issues Stakeholders meeting to review TDA
Conduct causal chain analysis TDA adopted by steering committee
Prepare stakeholder and public involvement plan
STEP 2: Issue-Driven Analysis and Planning
Evaluate potential goals with stakeholders
Gather & interpret additional information on environment &
socioeconomic consequences of each issue
Complete a gap analysis of institutions, laws, policies and
projected investments
[Build scenarios]
[Compare costs and benefits of alternative strategies]
[Identify sustained funding options]
[Experiment and monitor]
Formulate the SAP
STEP 3: Negotiation of Goals, Policies & a Plan of Action
Select the implementing Framework TTT proposes 'vision statement' of long-term
goals (EcoQOs)
Conduct feasibility study of options and their social soundness Brainstorming long-term EcoQOs and options
for achieving them
Prepare monitoring andevaluation indicators Appoint national and regional SAP
formulation teams
Win formal endorsement of policies Set operational objectives/targets
Establish the implementing structure Agree on national/regional institutional
framework
Secure sustainable financing Produce draft SAP
Partnership conference and national
endorsement
Develop GEF intervention(s)
Ministerial conference to adopt SAP
Step 4: SAP Implementation
[Promote compliance with policies/procedures]
[Implement inter-agency coordination agreements]
[Construct and maintain necessary infrastructure]
[Strengthen staff technical and administrative capabilities]
[Implement conflict resolution procedures]
[Adjust program strategies as necessary]
[Monitor program performance and societal/environmental trends]
Conduct a donors conference
Develop GEF and other donor interventions

15
UNDERSTANDING THE GOVERNANCE CYCLETable 4 outlines the sequence of actions that should be completed as an LME management initiativefunded by the GEF progresses through the TDA/SAP process. In order to emphasize the dynamicsof a strategic and issue-drivengovernance process, we haveelected in this Handbook to groupthe actions required by the TDA/SAP process into the five steps ofthe policy cycle. Rather thanemphasizing the mechanics of theanalysis associated with each TDA/SAP action, this manner of visualizingthe governance process helpsunderstand the dynamics of aprocess characterized by bargainingand negotiation among the manygovernmental agencies and theprivate sector stakeholders that mustbe fully involved in the LME planningand decision-making process. Werefer the reader to the trainingmaterials contained in theTRAINSEACOAST preliminarymanual on the TDA/SAP process (Mee and Bloxham, 2005, with updates to be posted atwww.iwlearn.net)) for detailed descriptions and associated exercises on each step and action, asthese are required by those receiving GEF Block B grants. In this Handbook our purpose is toplace the TDA/SAP process in the context of other large-scale initiatives in ecosystem-basedmanagement and to suggest additional forms of governance and socioeconomic analysis andcapacity building that may be helpful in the development of a robust LME management system.
The policy cycle is shown in Figure 4. It begins with an analysis of threats, issues and their rootcauses called for by the TDA. It then proceeds to the formulation of a course of action (Step 2)through the actions and processes associated with the preparation of a SAP. Experience in a widediversity of settings suggests that the final phases of a SAP – where the goals, the authorities, the
Planning to Implementation
STEP 5: Program EvaluationRoutine self-assessmentsPeriodic external evaluations of governance processes andoutcomesProgram adaptations negotiated and adopted
The TDA/SAP actions and indicators are those listed by Mee and Bloxham (2005). Items in [ ] in the essentialactions column are additional recommendations that draws from Olsen (1999).
Figure 4. The Policy Cycle (GESAMP 1996)

16 LME Governance Handbook
implementing structures and the financing arrangements are formally committed to by thegovernments involved – have a distinct dynamic that is best understood and managed as a separatestep (Step 3). This is when stakeholders, managers, and political leaders commit to new behaviorsand formally allocate the authorities and resources by which the SAP will be implemented.Implementation of the program of action is Step 4. Evaluation of successes and failures, learning anda re-examination of how the issues themselves have changed, rounds out a “generation” of themanagement cycle as Step 5.
Given the lengths of time that are required to achieve the fundamental goals of sustainable levels ofhuman activity in an LME, it is important to understand that in adaptive management the processesof issue analysis, planning and implementation and evaluation proceed as a sequence of linkedgenerations of management: the TDA/SAP process. When successfully completed, it constitutes asingle cycle, or generation, of LME governance. In some instances, portions or even the entire LMEmay have progressed through an earlier cycle, or fragment of a management cycle before a GEFBlock B grant was negotiated. For example, the North Sea had been the subject of severalmanagement initiatives before the unifying concept of ecosystem-based management was adopted.Similarly, as a GEF-supported LME program matures it should anticipate completing severalgenerations of governance. Each generation is marked by the actions associated with each of thefive steps illustrated in Figure 4. As the capacity of the institutions responsible for the governance ofan LME matures and grows, it should be expected that each subsequent generation will addressadditional issues and/or expand the reach of its activities over a larger geographic area. This can beachieved through an iterative, adaptive management approach of revising and updating the TDA andSAP in agreed time frames (say every five years). In the case of LMEs, it may be anticipated that asthe program gains strength it will address issues and associated root causes that either were notpresent in the first generation or were not viewed as priorities at the time. The TDA/SAP process,as further described below, is designed to proceed through a logical process that is designed tocreate the enabling conditions for the changes in human behaviors that will mark the implementationof a program of action. This is Step 4 of the policy cycle.
Step 1: Issue Identification through the TDAIt is essential to recognize that any process that attempts to unify the management of LME resourceswill require governmental endorsement and must win support among the people of the place if it is tobe implemented successfully. The future governance of the LME must therefore be rooted indeveloping with the people of the place and with responsible governmental agencies, a fullappreciation for the past and current conditions and the social and biophysical processes that haveshaped them. The Technical Task Team (TTT) should begin by assuming that considerableinformation exists on the LME resources being addressed, including anecdotal information held bythe users of the ecosystem.
Ecosystem-based management of LME resources is particularly difficult because jurisdiction overthe resources lies with multiple sovereign coastal states. In addition, the major user groups thatcomprise the stakeholders that will be most directly affected by changes in how LME resource usesare allocated may live and work in places at a great distance from one another. They may beunaware of the linkages between, for example, water pollution in a faraway estuary and theabundance of fish offshore that depend upon those estuaries as a nursery. Similarly, the

17
governmental agencies responsible for managing conflicts and allocating use of fishery resources inthe LME may have had no relationship with the agency responsible for the management of anotherLME resource, such as petroleum resources or pollution control in an adjoining watershed. Forgingnew relationships requires identifying common interests and building trust.
The issue analysis process that begins at Step 1 is the heart of any ecosystem management effortand must be sustained through all the steps in a generation of management and then form the unifyingthread that links subsequent generations of ecosystem management to each other. We suggestseveral forms of issue identification and analysis that are best accomplished in parallel with frequentdiscussions and integrations of ideas and findings that involve the full project team.
Identify Stakeholders and Their InterestsAll parties involved or affected by the condition and use of an LME should be consideredstakeholders in the management process. In order to be objective in its analysis and effective insolutions, the LME management process must develop a shared vision that enables the stakeholdersto be independently identified and fully involved in all steps of the policy process.1 During the initialTDA fact finding process, stakeholders should agree to freely share the necessary information andthe project team should make sure that full recognition is given to the sources of the information thatis assembled (Mee, 2003). The resulting TDA is a document that is freely available to allparticipants in the process as well as to the public. As the LME management process matures, newissues will emerge and the relative importance of individual stakeholder groups will change.
Prepare a Governance BaselineNo LME management effort begins with a blank slate. It is, therefore, essential to comprehend thealready existing governance framework and to understand who does what and with what motivationand with what effect. Such analysis may begin with a governance “baseline” that answers thefollowing questions:
• What are the impacts of past planning and management in and affecting the LME?
• What are the existing rights to use the natural resources in the LME?
• Does the existing legal, institutional, and policy framework sustain the ecosystem processesand resources that produce the goods and services that can be generated by the LME?
• Are there governmental organizations with a sufficiently broad mandate to adopt and implementa program of action to address perceived problems with marine resource use? Do they possessthe necessary institutional capacity to implement such a program successfully?
Rather than compiling a static “snapshot” of the existing governance system, a governance baselinetraces how the current system has evolved. To do this, the team should focus on the outcomes ofpast action – or inaction – on management issues. This form of analysis provides a basis for makinginformed judgments on how best to influence the existing system. A sound SAP should build on thestrengths of the existing governance system and address its weaknesses. An important element of agovernance baseline is a “governance map” that indicates who does what, who is responsible forwhat, how responsibilities are perceived, and what role is played by non-governmental actors in theexisting system. The baseline is the basis for a gap analysis that examines during the preparation of
1 A handbook for incorporating stakeholders into goal-setting and the entire adaptive management process isbeing developed by the GEF IW:LEARN project. For details , see www.iwlearn.net.
Planning to Implementation

18 LME Governance Handbook
the SAP how the existing system needs to be reformed to meet the requirements for effective LME-based management. A gap analysis identifies the inadequacies, voids, and gaps in essential elementsof LME-based management system and options for how such gaps could be filled.
In some developing nations, the “rule of law” is weak and, at times, has only a marginal influence onhow decisions affecting the allocation and use of freshwater are made. In other situations, institutions– both formally constituted governmental institutions and the less formal business associations,unions or political parties – play important roles. A governance baseline should work to understandthese relationships and to analyze the distribution of power as this relates to the issues posed by themanagement of a LME.
Causal Chain AnalysisWorking closely with those engaged in theintegration of information on the productivity,fisheries and pollution modules, the project teamshould compile existing information on historicaltrends in the condition and activities of the LME.This will lead to the identification of themanagement issues that the SAP will be designedto resolve. As illustrated in Figure 5, “causal chainanalysis” organizes data on ecosystem changewithin an LME so as to illuminate the interplaybetween human activities, natural resources andecosystem processes. According to Pernetta andMee (2001), a “causal chain is a series ofstatements that demonstrates and summarizes, in astepwise manner, the linkages between problemsand their underlying or “root’ causes.” It can alsobe useful to assemble matrices that array
terrestrial and marine uses and ecosystem components in a manner that helps identify cause/effectrelationships and interdependencies. The use of such matrices encourages the systematic and moreholistic, as opposed to purely sectoral, consideration of actions.2
To foster exchange and cross disciplinary analysis, first within the project team and subsequentlywith the stakeholders in government and the private sector, it is important to organize information onecosystem processes and trends in the condition and use of the LME in text, figures and tables thatconvey the essence of the knowledge that emerges from this analysis.
2 See Sutinen, et al. (2000) for more details on the use of matrices for diagnosing the causes and effects ofproblems in LMEs.
IMPACT ON THE ENVIRONMENT
The death of aquatic species
TRANSBOUNDARY ENVIRONMENTAL PROBLEM
Chemical pollution
IMMEDIATE CAUSE
Hot spot, e.g. polluting factory
UNDERLYING CAUSES
Lack of industrial investment; Lack of economic incentives to reduce
pollution
Figure 5. An example of causal chain analysis

19
Step 2: Negotiation of a Strategic Action Program
Gap AnalysisAll ecosystem management programs contain common generic actions that must be performedsuccessfully if they are to be effective. Given the variance in the nature of the problems in differentLMEs and in the governance structure of the adjacent states, the needs and options for policy andinstitutional reform must be shaped through a country-driven process that is rooted in a thoroughunderstanding of the existing governance system, traditions and cultures of the place. Thegovernance baseline should therefore probe the presence or absence, strengths and weaknesses inthe existing governance system to identify the gaps that must be filled to develop a working LMEgovernance system. As suggested by Olsen (2002), the pre-conditions for the sustainedimplementation of an ecosystem management program can be grouped into four categories:
1. Unambiguous goals that define in specific terms the environmental conditions and the intensitiesand types of human activities that will lead to the fulfillment of the outcomes that the SAP isdesigned to achieve
2. Informed and supportive constituencies among stakeholders in both the private sector andgovernment that understand and support what the LME program is working to achieve
3. Institutional capacity to practice adaptive ecosystem management including the ability to collectand interpret data on ecosystem change, skills in conflict resolution, sufficient capabilities insurveillance and enforcement of SAP policies and procedures and a culture that encourages selfevaluation and learning.
4. Commitment, from both government and powerful private interests, that is expressed as theallocation of the authorities, funding and other resources necessary to implement the program. TheTDA/SAP process is designed to gain such governmental commitment through a series of stepsthat begins with the negotiation of a Block B GEF grant and proceeds through the appointment ofnational-level Inter-ministry Committees (composed of representatives from pertinent ministries)and a Steering Committee, the adoption of the TDA by the Steering Committee and culminates inthe adoption of the SAP at a ministerial conference.
Gap analysis examines the difference between what is already present in terms of each of these fourpreconditions and what needs to be done to advance effective governance of the LME. This is theheart of the SAP and involves analysis and debate on the policies and strategies that will be adoptedto address the issues identified in the TDA. Throughout this process, consultation with the relevantstakeholders for each issue continues to be essential. Among the questions that will need to beaddressed are:
1. What needs to be done that is not currently being done or not being done well?
2. What needs to be done first, i.e. what is the priority order of change?
3. Who should be responsible for needed change?a) Government?,b) Marketplace?c) Non-governmental bodies?d) Some combination thereof?
Planning to Implementation

20 LME Governance Handbook
4. Should change be top down? Bottom up? A mix of the two?
5. How should stakeholders and the public be consulted and involved?
6. What principles should be used to guide the development of new governance approaches?
7. What are the future conditions of the LME and what future forms of human use constitute theoutcomes that LME management is striving to achieve?
8. What realistic intermediate objectives should be set and what time lines should be adopted?
9. What instruments should be employed to advance these objectives?
10. What indicators should be used to assess progress toward achievement of objectives and in whattime frame?
11. How can adaptability, transparency and accountability of governance efforts be ensured?
Answers to these questions can be used to guide the adoption and implementation of appropriateprinciples, tools, regulations and management measures that will close identified gaps and contribute toeffective LME management systems.
Evaluate Potential Goals with the StakeholdersGoals must be selected that define the qualities of the environment and the societal conditions thatthe program is working to achieve. Program goals need to appeal to the values of the society as wellas reflect a solid understanding of the ecosystem and institutional process that must be orchestratedto achieve them. It is difficult to manage what one cannot measure. Without clear goals it is difficultor impossible to assess the long-term impacts of a program. Such goals should define both theenvironmental and social conditions (outcomes) that, when achieved, would constitute success. It ismost useful to set goals that define specifically how much by when. Goal setting is a complexprocess and reaching agreement requires building consensus on the nature and significance of theissues being addressed, visualizing an attractive but achievable future and debating how power andwealth will be distributed in the future. It is, therefore, very important to begin discussing goals earlyon in the SAP process and not leave it to a short-term decision in the formalized negotiation processof Step 3. For example, in the seriously eutrophied Danube/Black Sea basin system, the countriesagreed on a long-term goal of returning the Black Sea ecosystem to its ecological conditions in the1960s, prior to the onset of serious eutrophication. In the nearer-term, the countries agreed towork collectively to reduce nutrient loads to the Black Sea to 1997 levels.
Goals should address issues and outcomes that the people of the place care about deeply. They arethe basis for accountability. Specific goals encourage the project team and stakeholders to focusupon a few, carefully selected priorities and to think through what is feasible within a given timeperiod. While goals associated with timeframes a decade or more out into the future make thefundamental purposes of the program tangible, near-term goals mark the stepping stones to thoseends. The capacity to manage an ecosystem must be assembled gradually over time and the goalsshould balance the complexity and scope of the issues to be addressed with the managementcapacity that is present in the society and responsible institutions.
Conduct Additional Targeted Data Collection and ResearchThe analyses conducted in the TDA pertaining to consequences of the interactions among the naturaland human components of the LME should be the basis for setting priorities for additional data

21
collection and targeted research on those topics most relevant to framing management policies and asuitable institutional design for program implementation. This additional data gathering and analysismay be focused on collecting new or additional data on environmental, economic and socialconditions relevant to priority LME management issues. Some data collection and research willinvariably need to be sustained during the implementation of the management plan. During thepreparation of the SAP, additional analysis and discussions with stakeholders should probeknowledge and perceptions on the future implications of environmental, economic and social trendswithin and affecting LME resources, and weigh the implications of important uncertainties on howthe ecosystem functions and how it is likely to change.
Build ScenariosPlausible scenarios of contrasting future conditions can help visualize the likely implications ofdifferent courses of action. Scenarios can be very helpful in prompting informed debate and inbuilding constituencies for an emerging program of action. Scenarios are developed by applyingwhat has been learned from the TDA and the emerging SAP and engage the private sectorstakeholders and the institutions involved in grappling with the potential impacts of changes to thecondition and uses of the LME. Scenarios should crystallize the implications of alternative actionsand identify the key elements of a program of action. Well-prepared scenarios can play a centralrole in public education programs and in focusing the analysis and debate over what actions shouldbe taken to address current or anticipated changes to the ecosystem and the human activities itsupports. The economic dimensions of alternative scenarios may play a central role in musteringpolitical support for an Ecosystem-Based Management initiative in Step 3 (discussed below).
Scenarios are only one means for helping institutions, stakeholders and the public at large to absorb,discuss and consider the issues raised by an analysis of changes to freshwater flows and the long-term implications of such changes. While public awareness of the issues is important, the priority isto build a well-informed constituency for the emerging LME program. Events that foster interactionsamong groups that otherwise do not know each other, and provide a forum where differingperspectives and needs can be aired and discussed are particularly valuable.
Compare the Costs and Benefits of Alternative Courses of ActionA given problem may have several alternative solutions which appear both technically feasible andmore-or-less effective. Still, the investment and recurring costs of the alternatives will usually varysubstantially. Selecting among them is not straightforward and requires information not only on costsover time, but also on their relative efficiency — that is, cost effectiveness. For example, whenselecting among treatment strategies for a source of water pollution, effectiveness involves selectingthe alternative(s) with lowest cost per unit treated. At one level this can be viewed as a technical,engineering-economic problem. However, effective policy requires implementation, and it istherefore critical that the necessary management mechanisms and institutional structures be in place.If they are not, this will change the cost-effectiveness calculation.
Benefit-cost analysis can be a valuable decision tool, for several reasons. First, it puts publicinvestments on the same footing as private investments in that they must meet the same standard: thecosts of a policy, program, or activity should be justified by the resulting benefits. A well-donebenefit-cost analysis makes all calculations and assumptions explicit and thereby transparent to allstakeholders. Even so, even qualitative comparisons of costs and benefits can help to informdecisionmaking.
Planning to Implementation

22 LME Governance Handbook
Benefit-cost analysis raises several issues. One is whether the value of important benefits and costscan be quantified. Many advances have been made in natural resource valuation, and theopportunities and limitations of resource valuation are becoming increasingly well understood. Butmany difficulties remain, and data problems are always an issue, especially in developing countries.Another important issue, equity – the distribution of the benefits and costs of a proposed policyaction – should always be examined in such an analysis.
Sustained Financing for ImplementationA major challenge for all LMEs will be to secure the funding required to sustain the managementsystem after GEF funding is no longer available. No GEF-assisted LME has, as yet, made thistransition. However, when legitimate government commitment to reform is evident, the GEF maysupport one or more SAP implementation projects over an extended period – as long as 10 years –towards achieving a financially and institutionally sustainable LME governance system.
Securing such sustained funding is considered a national responsibility and must typically be fundedthrough the national budgetary allocations to the institutions involved. In many countries the funds toimplement a program through a permit program, to monitor and enforce, and continue research oncritical uncertainties are scarce. Such budgetary constraints may be a central limitation to institutionalcapacity. Market-based management systems can address this issue by raising revenues from LMEresource users licensed to harvest specified amounts of resources. More details on methods ofsustainable financing are provided in Part III of this Handbook.
Experiment and MonitorThe implementation of a management program designed to address current or impending issues willrequire changes in the behavior of several groups and institutions. The challenges of instigating, andmaintaining such changes in behavior lie at the heart of successful implementation (Step 4) andinvariably raise unforeseen problems and benefits. Experience has repeatedly demonstrated,particularly in low-income settings and where top-down enforcement by governmental agencies hasa record of yielding poor results, that experimenting with new policies and their associated behaviorsat a pilot scale can be very useful. Seeing is believing. If a new practice – for example a newapproach to addressing habitat degradation or overfishing or modifying how petroleum extraction ormining takes place – is implemented at a pilot scale during the SAP, the experience, if positive, cando much to build support and credibility for the ideas put forward by the project team. Similarly ifwhat appeared at first to be a good idea proves in practice to be impractical, it is best if theseproblems are identified early on and do not require modifying a new rule or practice that has gainedformal endorsement and is, therefore, hard to change. Many GEF LME SAP projects pilot suchapproaches through demonstration projects designed during the Block B stage.
Step 3: Formal Endorsement of the SAPStep 3 is the culmination of a process that has worked to integrate results of technical analysis with aprocess of mutual education and consensus building among the various stakeholders. Theimplementation of actions that will have emerged as most critical to sustaining the LME resourceswill require formal endorsement by government. In the case of LMEs, which span the waters ofmore than one nation (85 percent of the world’s 64 LMEs span two or more nations), negotiationswith several governments and governmental agencies will be required. Formal adoption of newecosystem-based management policies and procedures may take many forms, but typically requires
23
executive decrees, cabinet resolutions, and – at a minimum – high level administrative decisions.New government agencies may need to be created to implement an LME program. Existingagencies may need to formally commit to collaborating on the implementation of discrete elements ofthe program, and important roles may be given to NGOs.
Win Formal Endorsement of the Policies That Will Shape LME GovernanceFormal adoption of a new ecosystem-based management set of policies and procedures usuallyaffects the distribution of authority and influence among institutions, interest groups and politicians.This may trigger defensive behavior and bureaucratic maneuvering. Bargaining and accommodationwill dominate the process by which new policies and institutional arrangements find their place in theexisting structures and institutional territories of government. Critical to success is the meaningfulinvolvement of the pertinent private sector stakeholders and the pertinent institutions in both theTDA and SAP. If these institutions and decision makers have not been involved in the processes ofanalysis and in weighing the options suggested by the scenarios it will be difficult to win their supportat this late stage.
By Step 3, the project team and its supporters should have clearly defined the changes that areneeded to the resource allocation and management process to address the ecosystem managementissues that have been identified. The gap analysis should have identified any needed adjustments tohow LME resource uses are allocated and whether some resources are to be protected. Thesolutions being proposed must be politically, as well as technically, viable. Convincing argumentsmust be made that demonstrate that the whole ecosystem-based management approach, which isthe heart of the LME program, will, over the long term, generate greater benefits for both societyand the LME than would traditional state-by-state and sector-by-sector planning anddecisionmaking. The fundamental points are that (1) the values of sustained, or restored flows ofbenefits generated by a healthy ecosystem are large, and they benefit a diversity of groups and
Planning to Implementation
Option 2: Management and Task Oriented BCC
Monitoring, Control and SurveillanceWorking Group
Hake Working GroupWorking Group(Namibia/SA)
Pilchards,Horse Mackerel etc.
Working Group(Angola/Namibia)
JMC Fish(Renewable Resource Use)
Oil and GasWorking Group
EIAsWorking Group
Marine Miningand Dredging
Working Group
JMC Pollution Control(Environmental Impacts)
Alien invasives and HABsWorking Group
Protected AreasWorking Group
JMC Ecosystem Health(Ecosystem Conservation)
Ecosysystem VariabiityWorking Group
Marine Living ResourcesWorking Group
Ecosystem HealthWorking Group
BENEFIT(Scientific Research)
Benguela Current Joint Management Board(three national delegations)
Benguela CurrentSecretariat
Benguela Current Commission Ministerial Conference
(three national delegations)
Conference of the Parties of the Abidjan Convention
Option Two: Management and Task-Oriented Benguela Current Commission (BCC)
Figure 6. Organizational Structure of the BCLME

24 LME Governance Handbook
economically important activities in the LME, and (2) that a transparent and accountable system forallocating resource uses produces a secure environment for all concerned, including those who wishto make economic investments in the region. Simple graphics and cost-benefit tables can crystallizethe basic points and focus debate on the substance of the issues.
Select the Institutional Structure for Ecosystem-based ManagementPolicy ImplementationFully as important as winning the legal basis for LME management is the design of the institutionalstructure by which it will be implemented. The allocation of responsibilities for the management ofLME resources, and the capabilities of institutions involved, vary so widely from region to regionand nation to nation that there is no single model for the structure of a transboundary managementprogram. Nevertheless, there are three important considerations that should guide this importantelement of ecosystem-based management design.
The first is to match the scope and complexity of the agenda with the capacity of the institutions thatwill be responsible for implementation. Institutional capacity to successfully practice ecosystem-based management is in short supply everywhere. Ecosystem management will succeed if it isapplied incrementally and such capacity is “grown” within the responsible institutions and itssupporting constituencies.
The second consideration reflected in what is known as the “subsidiarity principle” is thatinstitutional arrangements should be designed as a decentralized system in which authority andresponsibility is delegated to the lower levels of an internally coherent “nested” system.
A third consideration that guides ecosystem-based management efforts is the “precautionaryapproach.” 3 Here the central idea is that a cautious approach must be taken in situations that poseserious or irreversible threats to human societies, or the environment. The probable benefits ofaction must be weighed carefully against the likely costs of inaction. Important elements of thisapproach are: establishing the minimum level of proof needed to justify action to reduce hazards, theearly detection of hazards, promotion of environmentally sound practices and reducing risks beforefull proof of harm is available.
The Benguela Current LME (BCLME) offers one model for the institutional structure for theimplementation of an LME management program. Here, the strategy has been to establish during theSAP process an Interim Benguela Current Commission (IBCC) which is to become the BenguelaCurrent Commission during the five years of initial SAP implementation. Working with the memberstates, the IBCC will promote cooperation with regional bodies, institutional linkages with the SouthAfrican Development Commission, and commitment with both the Law of the Sea and the FAOCode of Conduct for Responsible Fisheries.4 The Commission is a forum for dispute resolution. AProgram Coordinating Unit (PCU) that will act as its secretariat will support it. The Commission willalso be supported by three activity centers in each state and whose focus will be on marine living
4 The BC Commission is linked to the Abidjan Convention, a UNEP Regional Seas Programme (http://www.unep.org/regionalseas/Programmes/UNEP_Administered_Programmes/West_and_Central_Africa_Region/default.asp).
3 The UN Fish Stocks Agreement in article 6(2) describes the precautionary approach in the following manner:“States shall be more cautious when information is uncertain, unreliable or inadequate. The absence ofadequate scientific information shall not be used as a reason for postponing or failing to take conservation andmanagement measures.”

25
resources, environmental variability and predictability and ecosystem health and pollution. There willalso be five advisory groups: fisheries and living resources, marine environmental variability andecosystem health, marine pollution, legal affairs and maritime law, and information and dataexchange. The advisory groups will work with experts and institutions, industry and the NGOs.Activity centers will provide technical support to the advisory groups. Figure 6 illustrates theorganizational structure of the BCLME.
Step 4: Adaptive Implementation of the SAPThe entire TDA/SAP effort culminates in Step 4, with the sustained implementation of an integratedecosystem-based management process that protects the health, fishery resources, and productivityof the LME and the human activities it supports. Because all living systems evolve and change overtime, the implementation of an action program cannot be a static or rote process. Theimplementation phase will have to adapt to new issues, new knowledge and changes in the contextwithin which the system and its management operate. Adaptive ecosystem-based management iscomplex and requires long-term commitment to processes in which conflict mitigation is a dominanttheme.
The key to understanding the challenges of implementing a new policy and thereby working toinfluence the trajectory of societal and environmental change in an LME is to recognize that suchchange requires alterations in the behavior of key groups and institutions. Success includes evidenceof new forms of collaborative action among institutions, the actions of state-civil societypartnerships, and the behavioral changes of resource users as well as changes in patterns ofinvestment.
Implementing the ecosystem-based management policies and procedures formally endorsed in theSAP typically will be expressed in rules governing:
• The extraction and other uses of LME resources
• The discharge of wastewater and other substances that impact ecosystem health
• Land use practices (e.g., agriculture) in the coastal watersheds that are linked to thecondition of the LME
All three of these variables must be managed, since the interconnections between them willdetermine the impacts on the ecosystem. This, in itself, is a challenge since in many instancesresponsibility for each feature has been allocated to a different institution, each of which has itsconstituencies and a distinct “way of doing things.” It is essential to understand that the formalwritten rules that resulted from a formalized process may, in practice, be less important than theinformal rules that have evolved over time and are followed by the common consent of thoseaffected. Such informal rules may be the source of corrupt dealings and this may add additionallayers of complexity when working to implement ecosystem-based management procedures thatshould be founded upon transparency and consultation with all those affected – including the poor.
Central to the implementation and practice of adaptive management is sustained and carefullytargeted monitoring of natural and human conditions in the LME. Such monitoring falls into threebroad categories. The first is to monitor environmental, economic and social conditions at targetedlocations in the LME. Continuous monitoring is best, since important pulses may be of shortduration and easily missed. A second focus for monitoring should be directed at the abundance and
Planning to Implementation

26 LME Governance Handbook
distribution of the LME resources that the management rules have been designed to conserve orrestore. Third, there should be some monitoring of selected measures of program performance interms of the behaviors that most directly express the implementation of ecosystem management rulesand procedures. These may include data on permit processing, enforcement actions and – veryimportant – voluntary compliance with the program’s policies.
Since ecosystems at the LME scale are living systems that are in a constant process of change,monitoring activities should be linked to further research that can help interpret the data that isgathered and suggest the adjustments that should be considered to increase or sustain the efficiencyand impact of the program. The implementation of new rules governing the allocation of water, andthe monitoring of the accompanying changes in the system will invariably produce surprises andsuggest new insights and ideas. In an adaptive management process, these are welcomed and canform the basis of a culture that encourages learning. As in Step 2, new management techniques areoften best tested initially at a pilot scale and applied to the whole LME management system onlywhen they have been shown to be workable and effective.
Step 5: Evaluation and Sustained LearningAdaptive ecosystem-based management can only fulfill its promise if its principles and processes areapplied in an LME over several decades. The entire management system, its impacts, and thecondition of the LME, should be periodically re-evaluated to determine whether the goals of theprogram are being achieved. Such evaluations may close the loop of distinct “generations ofmanagement” and mark the sustained practice of adaptive ecosystem management. In programs thatpractice adaptive management, much of the learning occurs through internal processes of analysis,reflection and adjustment. These should be complemented by more formalized external evaluationstypically conducted by individuals with no former involvement in the program. There are dozens ofapproaches and methodologies for self-assessment and evaluation. These approaches vary greatlyin their purposes, substantive rigor and the validity and persuasiveness of the conclusions they offer.Within the ecosystem management context, these tools and approaches may be grouped into twobroad categories:
Performance evaluations are designed to assess the quality of the execution of a program and thedegree to which they meet the mandate and responsibilities awarded to them and the commitmentsmade to a funding institution. Here, the focus is upon accountability and quality control.Management capacity assessments are conducted to determine the adequacy of project or programdesign including management structures and governance processes as these relate to generallyaccepted international standards and experience. The purposes are generally to find ways toimprove program design and implementation and to make adjustments to the internal workings of aproject or program and to the coastal management strategies and practices that the project orprogram is promoting. This evaluative emphasis typically promotes “instrumental” learning expressedas adjustments to the program’s strategies.
Outcome evaluation assesses progress towards the program’s goals. The focus, therefore, is onthe impacts of a program on the LME’s natural and human dimensions of concern to the program.An outcome evaluation examines the trends and indicators of direct relevance to the program andworks to objectively estimate the relative contributions of ecosystem-based management policiesand processes to observe social, economic, and environmental change. The relevant outcomes may

27
include such expressions as a decrease in the destruction of important habitats, reduced pollution inthe LME, and increases in fish stock abundance.
Measuring Progress in Ecosystem-based Management through Four Orders of OutcomesAs applications of ecosystem-based management mature, the needs to complement methods oforganizing the processes of management with methods for assessing the outcomes of managementhas become apparent. The unifying framework developed by Olsen (2003) – shown in Figure 7 – isuseful for this purpose since it desegregates the ultimate goal of sustainable development into asequence of more tangible thresholds of achievement. This framework suggests the sets of indicatorsthat can be used to trace the evolution of an LME management system as it progresses from thebaseline conditions documented by the TDA to progressively more sustainable conditions andpatterns of use.
The framework defines the First Order as the most critical outcomes generated by the TDA andSAP. Building on methods developed by Canada’s International Development Research Center(IDRC), the implementation of a program is defined in the Second Order as changes in behavior inthe institutions and human population within and/or affecting the ecosystem in question (Earl et al.,
Planning to Implementation
National
Regional
Local
First Order: Enabling Conditions
Governmental
commitment:
authority, funding;
Institutional capacity
to implement;
Unambiguous goals;
Constituencies
present at local and
national levels.
Intermediate Outcomes End
Outcomes
Second Order: Changed Behavior
Changes in
behavior of
institutions and
stakeholder
groups;
Changes in
behaviors directly
affecting resources
of concern;
Changes in
investment
strategies.
Third Order: Attainment of
LME goals
Desired social
and/or
environmental
qualities
maintained,
restored or
improved.
Fourth Order: Sustainable LME
Conditions & Uses
A desirable and
dynamic balance
between social and
environmental
conditions is
sustained.
Scale
Time
Source: Olsen, 2003
Figure 7. The Four Orders of Outcomes in Ecosystem-Based Management

28 LME Governance Handbook
2001). Only after the requisite changes in behavior have been practiced for a sufficient period canimprovements be expected in the environment and in the social benefits that constitute the ThirdOrder achievement of the environmental and societal goals selected in the earlier phase of programdesign. In an operational sense, the ultimate goal of sustainable forms of coastal development is a“north arrow” that points in the direction of desired change.
It is important to recognize that some expressions of First, Second and Third Order outcomes willaccumulate concurrently within a given time period. While there are causal relationships between thethree Orders, they are not, and should not, be achieved in a strictly sequential order. For example,once some progress has been made in assembling First Order outcomes, programs should work toachieve some evidence of Second and Third Order outcomes in a learning-by-doing mode. This canbe accomplished, for example, by management activities at a pilot scale. Experience has repeatedlyreconfirmed that the most successful initiatives focus their efforts on one or two issues and thenexpand the scope of the program as experience, capacity, and constituencies are built. Particularly indeveloping country contexts, it is usually a mistake to launch a fully integrated program directed atmultiple issues and goals.
The First Order: Assembling the Enabling Conditions for Ecosystem-based ManagementThe goal of GEF investments in LMEs is to catalyze a country-driven process that creates theenabling conditions for sustained ecosystem-based management. These conditions (GEF “ProcessOutcomes”; Duda, 2002) are created by a successful TDA/SAP process and can be grouped inoutcome terms under the four headings of (1) unambiguous goals that define the conditions that theSAP is striving to achieve, (2) constituencies that actively support the SAP, (3) institutional capacityto practice ecosystem management and implement the SAP (4) governmental commitment asexpressed by the allocation of authority and resources required to successfully implement the SAP.Table 4 summarized the actions and indicators that serve as markers for the attainment of thesepreconditions for the effective and sustained implementation of an LME Program of Action.
The Second Order: Program Implementation as Behavioral ChangeSecond Order outcomes are evidence of successful implementation of an ecosystem-basedmanagement program. This includes evidence of new forms of collaborative action amonginstitutions, the actions of state-civil society partnerships, and the behavioral changes of resourceusers and changes in patterns of investment.
Changes in the behavior of institutions. Since governments are invariably organized alongsectoral lines, a major challenge is to achieve more integrated forms of planning and decision-making. The preparation of the SAP may require the reorganization of institutions, the redistributionof power and resources, the creation of commissions and task forces. These are First Orderachievements (GEF ‘Stress Reduction Outcomes’) that, when they produce the changes inbehavior, mark a critical expression of program implementation that marks the Second Order. Whileattention must focus on behavior change in the organs of government, equally important evidence ofcollaborative behavior may be seen in businesses, fishers associations, trade groups and the like. Inrecent years, much attention has been given to fostering public-private partnerships to achieveconservation and development goals. All of these are expressions of changes in institutionalbehavior.

29
Changes in the behavior of individuals, groups and businesses that make direct use of thegoods and services that coastal ecosystems generate is often the focal point of programimplementation. An obvious example is the cessation of such destructive practices as dynamitefishing or the release of untreated wastes into the environment. The successful implementation of by-catch reduction practices signals a behavior change that may be important to a reformulation of howfisheries are regulated in an LME.
Changes in investments that signal the provision of sustained financing for LME management andstrengthening the capacity of institutions to practice ecosystem-based management, and theconstruction of necessary physical infrastructure supportive of a program’s policies and programs isthe third category of behavioral change. These may include decisions to invest in better enforcementof existing rules, decisions to invest in long-term monitoring of the condition of the ecosystem, or thefinancing of appropriate fish-harvesting and processing infrastructure. Investments in habitatprotection and restoration, including patrolling of protected areas and restoration of wetlands, maybe important expressions of program implementation.
From a GEF perspective (Duda, 2002), Second Order outcomes may be gauged through “stressreduction indicators” that document specific on-the-ground measures implemented by the countriescollaborating in the management of an LME. For example:
• Enforcement actions on industrial pollution discharges
• Reduced incursion of industrial fishing vessels into nearshore waters reserved for artisanalfishers
• Successful elimination of activities in designated protected or “no-take” areas
• Reductions in fishing pressure, achieved through fleet reductions or other means consistentwith the Law of the Sea and FAO Code of Conduct for Responsible Fisheries
• Successful revenue gathering from those benefiting from the exploitation of LME resources
The Third Order Outcomes: The Achievement of Specific Ecosystem GoalsThird Order outcomes mark the achievement of the program’s goals as were defined during theissue selection and planning phase (the First Order) and may have been modified duringimplementation (the Second Order). These are the rewards for sustained achievements ininstitutional and behavioral change. Water quality improves, there are more fish, income levels rise,and target communities’ engagement in supplemental livelihoods stabilizes or improves. Third Orderoutcomes can be allocated to the two categories of ecosystem-based management goals.
• Targets for sustained or restored qualities of the bio-physical environment
• Targets in human quality of life may be expressed as greater equity and diversifiedlivelihoods
Within the GEF (Duda, 2002), the indicators of the Third Order have been termed “environmentalstatus indicators.” They should be defined during the SAP process and be the basis for measuringthe actual performance or success in restoring and protecting the LME. Examples of Third Orderoutcomes are:
• Measurable improvements chemical, physical and biological parameters
• Improved recruitment of priority fish species
Planning to Implementation

30 LME Governance Handbook
• Demonstrable reduction of persistent organic pollutants in the food chain
• Changes in local community income and social conditions as a result of improvedenvironmental conditions in the LME
• Reductions in the loading of nutrients and the associated evidence of eutrophic conditions
For an example of a GEF International Waters project reporting substantial progress in both StressReduction and Environmental Status Outcomes, see the mid-term report of the Danube/Black SeaBasin Strategic Partnership for Nutrient Reduction at: http://thegef.org/Documents/Council_Documents/GEF_C27/documents/C.27.Inf.6Danube.pdf.
The Fourth Order: Sustainable LME Conditions and UsesThe difference between Third and Fourth Order outcomes is that sustainable development requiresachieving a dynamic equilibrium among both social and environmental qualities. Sustainabledevelopment has not been achieved if, for example, the condition of the coral reefs of a place issustained or improved, but the people associated with them continue to live in unacceptable poverty.Similarly, sustainable development has not been achieved if some measures of quality of life are high,but such achievements are eroding the resource base or require the exploitation of other socialgroups. The challenge is vastly complicated by the imperative of defining an acceptable balance interms of both intergenerational equity and a planetary perspective on both societal andenvironmental conditions and trends. Recognizing that all living systems are in a constant process ofchange, sustainable forms of development will be dynamic, not static, and must be capable ofresponding to the surprises that Mother Nature delivers.
31
PART III
A PRIMER ON THE CHALLENGES ANDDIMENSIONS OF LME GOVERNANCE
As set forth in Part I of this Handbook, there are three primary mechanisms that influence howhumans utilize an LME: the marketplace (i.e., the economy), the institutions and arrangements ofcivil society; and the government. This part of the Handbook explains how socioeconomic andgovernance analyses can be applied to understand and explain how these mechanisms function, andhow they interact with one another. We emphasize again that failure to understand these institutionsand to heed their signals may doom efforts to manage LME resources to achieve societal goals andobjectives. Let us now examine each of these three mechanisms in more detail.
MARKETSMarkets are powerful institutions. Markets are where goods and services are exchanged and profitsare sought; and markets play a major role in governing how LME resources are used. Markets, too,are linked to the organizations and institutions of government and civil society – the other two forcesshaping humans’ interactions with natural ecosystems. This section explains in brief some of thefundamental forces that emanate from markets, and how those forces affect the status of LMEs ingeneral.
Markets and EcosystemsMarkets are the mechanism upon which economies are built. They have a solid record of producinggreat improvements in the lives of people in all corners of the globe. Markets, too, can do greatharm – especially to the earth’s natural ecosystems.
Markets, which offer the prospects of substantial economic gains, are principal drivers of excessiveextraction of natural resources and disposal of damaging pollutants. The evidence of the ecologicalcosts that market-driven economic activity has caused is frequently reported by news media:overexploited and collapsed fish stocks, harmful algae blooms, dying coral reefs, coastal deadzones, deforestation, endangered species, global warming and the rise in sea level, and many othercases of environmental degradation. Market-driven economic activities are one of the direct causesof overexploited fishery resources, of large marine ecosystems’ degraded primary productivity andoverall health.
The degraded marine ecosystems are, in turn, threatening the long-term well-being of the humancommunities that the economic activities support. This Tragedy of the Commons is playing out on alarge scale in our LMEs; and markets are at the center of the tragedy. The markets upon whichthese communities depend are tragically stressing the very natural systems upon which the marketsthemselves depend.
Dimensions of LME Governance

32 LME Governance Handbook
Why is this? Why are markets causing so much harm to our natural ecosystems?
Markets harm our ecosystems because market prices do not tell the ‘ecological truth’ (Brown2001). In other words, market prices do not reflect the full cost of producing products fromecosystem resources. Market prices cover the cost of capital and labor, but market prices to do notcover the costs of reducing a fish stock, of damaging habitat, of waste disposal and pollution, andother ecological costs. Low prices and costs drive consumers to demand more and suppliers toproduce more ecosystem-based products. The consequence is excessive levels of economicactivities that ultimately threaten the sustainability of the ecosystems upon which they depend.
This tragedy is particularly acute in coastal and marine ecosystems. As explained in Part I, theeconomic activities that contribute most to a country’s gross domestic product commonly lie alongthe coasts. Those economic activities include marine transportation and trade, fisheries, tourism andrecreation; and these industries draw people to work and settle in, and visit those coastal areas.1These economic and other human activities often lead to the degradation and loss of natural habitats,added waste disposal and pollution discharges to water bodies, overexploitation of living marineresources, invasive species, pathogens, toxic contaminants, harmful algae blooms, and increasedvulnerability to coastal hazards. In addition, the overexploitation of fisheries and other living marineresources continues for many of the fish stocks that have been assessed.
PollutionBoth groundwater and surface water stocksare susceptible to contamination in coastalregions. Approximately one-third of theworld’s population depends on groundwatersupplies for drinking and other householduses, for irrigation and other commercialpurposes. The principal sources ofcontamination include human, urban, industrial,and agricultural activities that discharge wasteproducts that leach into water-saturated soil.
Once the toxic substances enter groundwatervery little cleansing occurs; and, since the rate of groundwater replenishment is often very low, littlemixing and dilution take place.
Surface waters – the streams, lakes, estuaries, and oceans – are contaminated by many of the samehuman activities. According to UNEP (2002), sewage is the principal source of marine and coastalpollution.2 Sewage discharges dominate in urban areas. Globally, agriculture run-off andatmospheric deposition are major sources of fixed nitrogen. According to Larsen (2004), annualfertilizer use has risen tenfold during the past 50 years. The growth in nitrogen inputs has causedeutrophication in marine and coastal waters – including severe cases in several enclosed and semi-enclosed seas. In addition, the greater growth and decay of phytoplankton has increased thenumber and extent of dead zones (oxygen-depleted waters), which now number nearly 150, havingdoubled each decade since the 1960s (Larsen, 2004). Red tides of harmful algal blooms have hadmajor economic impacts on fisheries, aquaculture and tourism in many coastal regions.
1 As of the mid-1990s, nearly 40 percent of the worlds inhabitants lived within 60 km of the coast (UNEP 2003).2 UNEP. 2003. Global Environmental Outlook 3. United Nations Environmental Program, Nairobi.
Pollution is a threat to both marine and fresh waters.

33
Other important types of marine pollution are marine debris, oil spills, and ocean dumping. Marinedebris consists of materials such as plastic, polystyrene, metals and glass that slowly degrade andpersist in the marine environment for long periods of time. Lost or discarded fishing gear, shippingmaterials and other forms of solid waste material kill and injure large numbers of marine mammals,sea turtles and sea birds by ingestion or entanglement.
Oil is discharged from shipping, offshore extraction operations, and pipelines. The incidence ofaccidental oil spills can be controlled but never eliminated altogether, since nearly 60 percent of theworld’s oil is shipped by sea before being consumed.3 Many of the oil spill hot spots are in heavilytrafficked large marine ecosystems.4 In addition to accidental oil spills, there are oil discharges fromsunken, grounded or abandoned ships, from offshore drilling platforms, and from pipelines.
Ocean dumping – the deliberate disposal at sea of material or substances of any kind – accounts forabout 10 percent of marine pollution.5 The materials commonly dumped at sea include dredgedmaterials, industrial waste, sewage sludge, radioactive waste, mine tailings, decommissioned vessels,residues from chemical industries, ash from power stations and other unrecycled wastes, ballastwater contaminated with invasive microbes, and fish waste.
Why are humans contaminating their marine ecosystems with such large and diverse quantities ofpollutants?
Although some of this pollution is accidental and unintentional, a substantial portion of the wastedischarges are deliberate.6 Industries, households, and even municipalities find water bodies serveas convenient places to dump sewage and industrial wastes. In addition, there are indirect, diffusesources in the form of run-off from agricultural fields, silviculture, urban storm drains, and individualdisposal systems.
Those who are deliberatelydischarging these wastes into themarine environment often areunaware of the indirect ecologicalcosts that their discharges have onthe ecosystem. They view thedischarge of waste as free or allowedfor a nominal charge. Such chargesdo not reflect the full ecological costof the harm to the naturalecosystems. As a result, businessesand households produce more wastethan they otherwise would if theircosts of disposal were higher.
3 http://oils.gpa.unep.org/facts/oilspills.htm.4 These include the Gulf of Mexico, Northeastern U.S., Mediterranean Sea, Persian Gulf, North Sea, Baltic Sea,among others. Source: http://oils.gpa.unep.org/facts/oilspills.htm, accessed February 13, 2006.5 Source: http://www.oceansatlas.com/unatlas/U.S.es/oceandumpingwastes/dumping/dumping_at_sea.htm#Marine%20Pollution%20and%20Dumping; accessed February 13, 2006. Also see UNEP(2002, 192-198).6 http://oils.gpa.unep.org/facts/oilspills.htm.
Dimensions of LME Governance
Loss of mangroves can lead to a variety of problems in coastal and marine ecosystems

34 LME Governance Handbook
Destruction of Coastal Wetlands, Mangroves, Coral ReefsDestruction of habitats and other forms of direct physical alteration are one of the greatest threats tocoastal and marine ecosystems (UNEP 2002: 184). Nearly 60 percent of the world’s coral reefsare dying or under threat from human pressures; and almost half of the world’s wetlands and morethan half of the world’s mangrove forests were destroyed during the 20th century. Loss of coastalwetlands, mangroves and coral reefs reduces the buffer zone between land-based sources ofpollution and the open sea and between storm surges and tidal waves and vulnerable inhabitedcoastlines. These losses of coastal wetlands, mangrove forests, and coral reefs have furtheraggravated the levels of nitrogen in coastal and marine ecosystems (UNEP 2002: 181).
The development of coastal areas for human use directly causes much of this physical alteration.Principal types of physical alterations that harm habitats include dredging for ports and shippinglanes, creation of solid waste dumps and landfills, coastal construction of buildings and roads,cutting and destruction of mangrove and other coastal forests, and mining of marine sand, gravel,and reefs.
The markets that drive the development and alteration of coastal areas place little or no value oncoral reefs, mangroves, wetlands, and other ecological assets. As a result, the costs of destroyingthese assets are not reflected in the market, which in turn causes excessive and harmful dredging,dumping, construction, and extraction of marine ecosystem resources.
OverfishingThe FAO (2004) estimates that in 2003, one quarter of marine fish stocks were overexploited,depleted or recovering from depletion; about half were fully exploited; and one-forth could toleratemore catch. The trends are not comforting. From the mid-1970s to the present, the proportion ofoverexploited and depleted stocks has increased 2.5 times, and the proportion of stocks offeringpotential for higher catches has declined (from 40 percent to about 25 percent). There are manycauses of the deteriorating status of these fish stocks. But overfishing remains the number one threat.There simply are too many highly productive fishing vessels harvesting from fish stocks that aredwindling in size and in number.
The markets that are driving commercial fishing operations arenot telling the ecological truth. The market prices of the inputs(fuel, bait, labor, gear and other capital) and the prices of fishproducts do not include the ecological costs of stock depletion.Fishing operators typically pay no price to remove fish from thesea; yet there are costs in the form of lower stocks and futureyields, and in the form of reduced biodiversity. There areassociated ecological costs from damage to habitat, and frommortality of marine mammals and sea birds. There are nomarkets for these valuable assets.
In general, no individual producer (fisherman) has the right toexclude other producers from harvesting (or otherwise using) anypart of the resource. From an individual producer’s perspective,leaving fish to grow and reproduce is done at the risk of losingthe fish to other producers. Thus, there is no incentive to
Overfishing is a problem worldwide.

35
conserve the resource for future use, since no producer has exclusive use. The free use of marinefisheries is the fundamental cause of overexploitation in modern fisheries.
Since producers do not have the ability to protect and conserve the resource for their own use,there is competition among producers to catch fish before others do, driving the stock down belowthe optimum. The draw of perceived lower costs and greater net benefits brings more producers tothe fishery, and induces each to apply more effort than is optimal for maximum economicperformance of the fishery. The resulting economic performance in the fishery is inferior. The netbenefits (for all producers and consumers summed across all future periods) could be greater withlower levels of fishing effort. By lowering effort levels, future net benefits to producers couldincrease, and more than offset the reduction in current net benefits.
Under a regime of non-exclusive use and free access, competition to catch fish before otherproducers causes a “race-to-fish,” resulting in fishing seasons that are shorter than optimal formaximum economic performance, landings that are too small and of inferior quality, excessiveinvestments in vessels and gear, and in intermittent and inconsistent income generation for fishersthemselves.
Free access and non-exclusive use also leads to conflicts among user groups. Where no producerhas the right to exclude another from access to the resource, two or more producers can interact atthe same time and place in a fishery, imposing external costs on each other in the form of gear orother losses. Mobile gear (such as trawls) may fish in the same area as fixed bottom gear (such astraps), causing damage to one or both of the gears. Large, efficient international vessels can operatein a fishery on which small-scale local producers are heavily dependent, draining the stock availablefor capture by the smaller domestic producers. Failure to consider these external costs whendeciding where and how to fish causes inferior economic performance in the fishery.
Processors, distributors, wholesalers, retailers and consumers are also affected by the non-exclusivenature of the fishery. The race-to-fish can result in large quantities of fish being landed during shortperiods, requiring the buildup of excessively large processing, storage and distribution facilities tohandle the periodic peak loads. Wholesalers, retailers and consumers find supplies of specific fishare abundant for short periods and scarce for long periods; or, the product is processed for longshelf life, generally reducing the quality of the products and price on the market.
General economic trends of rising prices for fish as markets expand, and of improved harvestingtechnology, combine to put intense pressure on fisheries under free access. Rising fish prices and/orfalling costs induce more investments and more participants in the fishery. The structure of the entirefishing sector becomes too large and is placed at risk as resource stocks are drawn further down,widening the gap between what the resource stocks are able to supply and what the fishing sectorneeds to survive and prosper. In other words, capital’s capacity to produce exceeds the resource’scapacity to produce.
The degraded state of LMEs did not occur suddenly. Rather, the condition of LMEs has beendeteriorating over the course of several decades. Starting at the midpoint of the 20th century, we canconstruct a stylized picture of the trends in economic activities and ecosystem conditions for ahypothetical LME. At about 1950, marine transportation and trade, fisheries, marine mining, tourismand recreation produced relatively low economic activity; and the condition of the natural ecosystemwas good (little pollution, little physical alteration of habitats, and no overfishing). Figure 8 illustrates
Dimensions of LME Governance

36 LME Governance Handbook
this imagined scenario withthe solid black line showinglow economic market valuesbeing produced during the1950s, the dashed black lineshowing a high level of somemeasure of the condition ofthe natural ecosystem, andthe dashed grey linerepresenting the non-marketvalues of ecosystem services(such as biodiversity, waterquality, natural hazardmitigation).
As the coastal economygrew during the 1960-1980
period, the market value of LME-related economic activity rose and the condition of the naturalecosystem began to decline with increased pollution, habitat destruction and overfishing. The non-market value of ecosystem services initially grew and then declined as the condition of the naturalecosystem began to decline. During the 1980-2000 period, the condition of the natural ecosystemcontinued to decline, which in turn weakened economic activity dependent on LME resources. Atpresent, the LME finds itself with relatively low economic activity, and low non-market value ofecosystem services, which are the result of the degraded condition of the natural components of theLME. The projected future upturns in Figure 8 would be based on effective LME management.
All of these undesirable outcomes can be traced back to markets that do not tell the ecologicaltruth. Markets favor those who can produce and sell at the lowest cost. The market mechanism, ineffect, drives participants to ignore the ecological costs of pollution, of habitat destruction, and ofoverexploitation.
Markets are imperfect in other ways as well. As explained in the next section, imperfections inmarkets obstruct sustainable development and present a major challenge to the governance ofLMEs.
Markets and Economic JusticeMarkets are not intrinsically just institutions. Markets do not provide the greatest benefit to the leastadvantaged in society; and markets do not always offer fair and equal opportunities to all membersof society (Rawls, 1971).7
7 John B. Rawls, A Theory of Justice. Cambridge, Massachusetts: Belknap Press of Harvard University Press,1971. Rawls second principle of justice (p. 303) requires that “Social and economic inequalities are to bearranged so that they are to the greatest benefit of the least advantaged, and attached to offices and positionsopen to all under conditions of fair equality of opportunity.”
Figure 8. Stylized trends of LME values and biophysical conditions
Valu
e
Eco
syste
m
Co
nd
itio
n
Present
Present
1950
1950
Market Value
Non-market value

37
The World Bank, in its recent World Development Report 2006, Equity and Development,concludes that unequal opportunities are ‘truly staggering on a global scale.’ There are hugedisparities within and across countries in individuals’ opportunities for life itself, for education, forhealth, and for quality of life. These disparities are correlated with nationality, race, gender, andsocial-economic status – characteristics that are predetermined and beyond an individual’s control.
These inequities are not only morally offensive; they also limit individuals’ opportunities to realizetheir full potential and, in turn, limit their collective ability to achieve sustainable development. Inother words, there is a complementary relationship between equity and sustainable growth anddevelopment.8 The Report explains that poorer segments of society in developing countries often donot have access to the markets for credit, insurance, human capital, land and other naturalresources. As a result, these imperfect and missing markets limit the ability of individuals to use theirlabor, capital and natural resources in the most productive ways. In addition, unequal opportunitiestend to result in institutions and arrangements that protect and favor those groups with moreeconomic and political influence. These inequities can severely limit the ability of the poorer,disadvantaged groups to exploit their talents and contribute to sustainable development.
The Report says that “to prosper, a society must create incentives for the vast majority of thepopulation to invest and innovate.” Perfect capital markets, for example, allow anyone – regardlessof their wealth or status – with a profitable investment opportunity to either borrow money or usecollateral of an asset to finance the investment. These markets are not perfect, however. Access tocredit is not equally distributed, and differences in interest rates among borrowers and lenders arearbitrary. Title and security of tenure to land and other valuable property are often reserved forprivileged individuals; and discrimination and stereotyping limit the opportunities for education andemployment in human capital markets.
Markets for LME resources also are imperfect in similar ways. For example, in the U.S. and someother developed countries, exclusive rights to harvest fish were awarded free only to the owners offishing vessels. Crewmen and others who had material stakes in the fisheries did not have theopportunity to secure these harvest rights. South Africa currently is in the process of reallocatingfishing rights to historically disadvantaged individuals who did not have access to resources underapartheid on racial grounds.9
Economic and political institutions establish the incentives and constraints faced by individuals whenthey engage in market transactions. These institutions, which result from complex historicalprocesses, too often protect the opportunities and interests of privileged groups. The imperfectionsin markets tend to favor those privileged interests. These imperfections then lead to social conflictand impede progress towards sustainable development of environmental and natural resources.
What Does the Issue of Equity Have to do with LME Governance?Governance arrangements and policies that promote equal opportunities – where all people facesimilar conditions for becoming economically productive, politically influential, and socially active –promote sustainable growth and development. Correcting the equity imperfections in markets andother governance institutions is an essential task of good governance.
9 In contrast, the rights to extract oil and gas in U.S. federal waters are allocated in markets that are open to allwho have enough financial resources to participate in an open, competitive bidding process.
Dimensions of LME Governance
8 Equity is where individuals have equal opportunities to pursue their interests and also not be subjected toextreme deprivation (World Bank, 2006).

38 LME Governance Handbook
As coastal nations attempt to overcome the problems of overexploitation, pollution and habitatdestruction in LMEs, new governance regimes and arrangements will be created. The message ofthe World Bank Report for LME governance is that equity matters. Creating governance institutionsthat offer equal opportunities to all individuals in society will improve the prospects for thesustainable development of LME resources and improve the prospects for mitigating the ravages ofpoverty that persist in many of these coastal areas.
The new LME governance arrangements that are developed and implemented should attempt tolevel economic playing fields. This can be achieved by designing LME governance policies thatstrengthen the opportunities for participation by poorer and disadvantaged groups in gaining accessto and use of LME resources. This will not be easy or accomplished swiftly, for even new LMEgovernance institutions and arrangements will be linked to other economic and political institutions.The extent to which there is equity in credit, insurance, human capital, and land markets, will affectthe extent to which equity can be incorporated in LME governance institutions and arrangements.
Correcting and Mitigating Market FailuresWhat can be done about markets that do not tell the ecological truth? What can be done to correct ormitigate markets’ tendencies to harm ecosystems?
As explained above, the market does not properly value ecosystem goods and services and naturalassets. Key to creating a market that supports sustainable development of LME resources is to get itto tell the ecological truth. If we can design or reform markets so that they tell the ecological truth, wecan correct or mitigate their tendency to harm LMEs.
The first set of tasks is to calculate the ecological costs of those activities that are extracting LMEresources, polluting and altering the environment. Economists can work with natural resource scientiststo calculate these costs. This work will require integrating the socioeconomics module with the threenatural science modules of fish and fisheries, pollution and ecosystem health, and productivity.10
Once the ecological costs of resource extraction, pollution, and reduced productivity are calculated,the costs can be incorporated into the market prices. The various ways in which these ecologicalcosts can be incorporated into market prices are reviewed below in the section on SustainableFinancing. One way to incorporate ecological costs into market prices is to apply taxes to thoseactivities that harm the ecosystem. Another way is to place a cap on the amount of the damagingactivity and allow producers to trade their allowances – known as “cap and trade” and “tradablepermits.”
Subsidies of some economic activities (such as fishing) also lead to overexploitation and damage tomarine ecosystems. Conservative estimates of government subsidies to the fishing sector amount tomore than a quarter of the annual value of trade in fish (Milazzo, 1998). Many of these subsidies, ineffect, lower the cost of fishing, further distorting the market’s ability to tell the ecological truth.Economists can assess the nature and extent of subsidies – identify which subsidies causeoverfishing and overcapacity – which can then be phased out or replaced with environmentallyneutral subsidies.
10 Examples of such integrated analyses can be found in Chapters 9 – 12 of Hennessey and Sutinen 2005.

39
The approach that some countries are using is not to simply add more taxes and eliminate subsidies,but rather to shift taxes and subsidies to work in ecologically benign ways. For example, somecountries are reducing income and property taxes in exchange for adding taxes on environmentallydamaging activities, with an over all neutral effect on the total amount of taxes collected (Brown,2001). Subsidies can also be shifted such that their overall level is essentially unchanged while theyno longer promote ecological harm.
If these and other ways are found to tame markets so they support conservation, we can lookforward to improving the ecological condition of LMEs (Le Quesney and McNally, 2005).Referring again to Figure 8 and a hypothetical LME, with effective management and marketmechanisms, we can imagine that the condition and non-market value of ecosystem services willbegin to rebound in the near future and, after a lag in time, the market value of LME-relatedeconomic activities will grow to heights not heretofore realized – the result of markets that work inharmony with the LME.
What can be done to prevent markets from creating and/or aggravating economic inequities?
The first task should be to level the economic playing field by creating an economy where all peoplehave equal opportunity of access to markets. In other words, equalize access to credit, labor, landand other markets that exist. In addition, when new markets are created – as, for example, for rightsto use LME resources – ensure that they are designed to allow participation by small producerswho may otherwise not have access to these markets. Insuring access may require government-guaranteed loans to small producers for the purpose of purchasing fishing quota and other resourceuse rights. Another avenue for leveling the economic playing field is to design or reform market-access arrangements to encourage community-based organizations to participate in LME resource-related markets. If communities or small producers lack the will or ability to participate in suchmarkets, arrangements to share revenues generated by the use LME resources can be implemented.Such revenue sharing arrangements have proven effective in giving local communities a stake in theecological health of animal populations and their habitat (an example is Zimbabwe’s Campfireprogram11).
GOVERNMENTThe conventional view of government is that it sets the rules and enforces them, it recognizes andprotects property rights, and the government produces goods and services. The rules regulate theuse of natural resources, business practices, etc. In its protective role, government maintains securityand order by enforcing a set of rules within which people can interact peacefully with one another.These include rules against theft, fraud, physical harm to person and property. Without protection,property rights are not secure and the economy and social order suffer. A distinguishingcharacteristic of government is its monopoly on the legitimate use of coercive force to control thebehavior of individuals and groups.
The government also undertakes productive activities that cannot be efficiently organized by themarket. As explained above, markets do not “tell the ecological truth.” Markets generate too muchof those activities that generate negative spill-over effects (where one party’s actions impose costs
Dimensions of LME Governance
11 See http://www.unsystem.org/ngls/documents/publications.en/voices.africa/number6/vfa6.08.htm for a briefdescription of the program.

40 LME Governance Handbook
on other parties).12 In addition, the market fails to provide sufficient quantities of public goods, asexplained below in the section on Sustainable Financing.13
Providing public goods such as national security is a classic case of government production. Otherpublic goods include a monetary system, a system of jurisprudence, flood-control and insect-abatement programs. Near or quasi-public goods are also produced or subsidized by government.Examples of near-quasi public goods include education, streets and highways. In line with itsproductive function, a government will also promote competitive markets because competitiongenerally enhances productivity and value for the common good.
The presence of public goods and spill-over effects, which are common for LME resources,typically mandates government intervention. For example, the above analysis of the fishery showsthat open access to the resource leads to too many fishers chasing too few fish (a case of“reciprocal spill-overs”), and typically prescribes government intervention, in the form of fisherymanagement policies, to correct the market failure.
Government policies aimed at correcting market failure generally assign specific functions togovernmental agencies to produce specific outputs expected to correct the market’s shortcomings.These activities and outputs include:
• Regulatory services (e.g., fishery and environmental management regulations)
• Public goods (e.g., general law and order, fisheries research)
• Administering transfer payments (e.g., subsidies, social welfare)
It is important, if not essential, to analyze how those policies are produced, how managementservices are produced; and ask what conditions lead to government successes and failures. Thebehavior of individuals and agencies in the public sector can be analyzed by applying the commontools of governance and socioeconomic analysis. These tools help to understand and explainwhether the underlying conditions promote government failure or success. The basic idea is thatincentives matter – they shape the behavior of resource users and consumers, and they shape thebehavior of public officials and government organizations as well.
With such analysis and understanding, we are then prepared to prescribe ways to correct theobstacles in the public sector that lead to failures of government processes and policies. Otherwise,by promoting government intervention without prescribing proper arrangements, we might beencouraging greater inefficiencies that result from what Wolf (1988) calls “nonmarket failure.”
All forms of government intervention, such as fishery management regulations, require a regular flowof government services – services that are costly. Management costs are sometimes acknowledged,but not systematically accounted for in the analysis of policy. These costs, of course, must becovered. Below, we address this issue in a section on sustainable financing.
12 These effects are known as ‘external effects’ or ‘externalities’ in economics.13 Public goods are those which, when provided for one, are available to all at a zero price – for free.

41
Challenges for Successful Government ProgramsAs explained above, the institutions and organizations that comprise LME governance do notalways perform optimally. Markets, if not designed or regulated properly, can harm ecosystems anddisadvantaged members of society. Government institutions and organizations also can fail toachieve societal objectives. If not properly designed and managed, they can thwart efforts toimplement the ecosystem approach to management of LME resources.
In this section we identify some ofthe factors that challenge efforts todesign and implement successfulgovernment programs. We offer abrief analysis of how resourcemanagement policies are produced,how management services areprovided; and identify conditionsthat tend to lead to governmentsuccesses and failures. With suchanalysis and understanding, we arethen better prepared to prescribeways to correct the obstacles in thepublic sector that lead to failures ofgovernment processes and policies.
Let us use fisheries to illustrate thisanalysis.14 Above, we reported on the dismal state of global fisheries, many of which areoverexploited by fleets with overcapacity. This record demonstrates that our fishery managementinstitutions have failed to conserve fishery resources and improve the economic health of fishingcommunities. Why have our management institutions not done better? The FAO (2000) and otherobservers attribute this poor record to (i) tendencies to give priority to short-term social andeconomic needs at the expense of the longer-term sustainability of fish stocks; (ii) poorly definedobjectives; and (iii) institutional weaknesses, particularly in relation to the absence of long-termrights amongst the different key stakeholders and decisionmaking structures and processes. Thesethree problem areas are really just manifestations of the incentive structure found in most fisheries(and many other natural resource) governance regimes.
We based the analysis on the following simplified system of fisheries governance. In democraticcountries, the fisheries governance system consists of both formal and informal linkages among fourcomponents of the system.15 The legislature passes fisheries laws that authorize the implementationof fisheries policies and programs by a fisheries agency. In turn, the fisheries agency commonlyestablishes a fisheries management authority to develop fishery management plans that specify the
14 This section draws heavily upon, and uses excerpts from, Sutinen and Soboil (2003).15 This analysis does not apply to non-democratic countries such as Burma, China, Cuba, Egypt, Iran, Pakistan,Saudi Arabia, and Vietnam, where more than one-sixth of the world’s people live. The analysis of governmentperformance by non-democratic states requires further research.
Dimensions of LME Governance
Legislature Executive Branch
Fisheries Agency
Fisheries
Management
Authority
Stakeholders
Fishermen,
Communities,
Environmentalists
Figure 9. Fisheries Governance System

42 LME Governance Handbook
set of management measures that are applied to the fisheries under its jurisdiction. Stakeholders(such as fishing producers, communities and environmental advocates) usually have a formal role –from advising to decision-making – in the management plan development process. The resultantplans, if approved, are then implemented by the fisheries agency. The solid arrows in Figure 9represent these formal linkages.
In addition to the formal linkages, there are informal linkages – represented by the dashed arrows inFigure 9. As voters who help elect members of the legislature, fisheries stakeholders frequently taketheir problems and concerns to their elected representatives. If a stakeholder group feels that thefishery management process has not treated it properly, they will ask their elected representative toassist them. The assistance often is in the form of influencing the fisheries agency and/or fisheriesmanagement authority. Sissenwine and Mace (2001) refer to this as the “end run” phenomenon. Wenow examine the political dynamics of the fisheries governance system in more detail. 16
The political process controls government and, in democratic countries, political decisions areproduced by a legislative process. Voters elect representatives to guide government policies andactions; agencies are formed; and bureaucrats hired to implement government policies. These threedomestic groups are major players in the political process, and government policies and actionsresult from complex interactions among these players. Voters – especially groups of voters withspecial interests – express their demand for government policy and action. Elected representativessupply legislation (policy) to address this demand; while government bureaucrats implement theprograms and rules specified in the legislation. In the fisheries context, the principle products of thispolitical marketplace are fisheries laws and regulations related to conservation and management,safety, environmental protection, etc.
Voters are the consumers of the political process, demanding political products. Voters - includinggroups of voters that form to pursue their special interests – demand public-sector action to reduceinefficiencies and to redistribute income, usually through self-serving benefits. Votes, campaigncontributions and lobbying are the currency by which these demands are expressed. In addition,foreign groups also participate in the political process by lobbying for their special interests.17
Politicians are the elected administrators and legislators in federal, state/provincial and localgovernment, including members of executive and legislative branches. Politicians are motivated, inpart, by the need to be elected or remain in power by supplying the political goods that aredemanded by voters. Therefore, politicians tend to select positions that maximize the probability ofre-election.
Bureaucrats work at national, state/provincial and local levels as hired officials. Agency employeesimplement laws, implement regulations and develop programs. Bureaucrats are motivated in part byself-interest too. They naturally resist downsizing their budget and number of employees, andcommonly attempt to increase the size of their budget and number of employees. To achieve thisobjective, they often appeal to politicians with programs that would be favored by voters.18
17 For example, EU industrial fishing fleets and U.S.-based international NGOs are forms of foreign interests thathave significant influence on developing countries and their LME management.
16 The arguments in this section are based on extensive public choice literature, e.g. Buchanan and Tullock,1962; Buchanan, 1980; Niskanen, 1971; Olson, 1964; and Wolf, 1988. Applications of public choice to fisheriescan be found in Andersen et al., 1998, and Upton and Sutinen, 2000.
18 For a study of this phenomenon outside of fisheries, see Johnson and Libecap (1994).

43
Political equilibrium is reached as voters, politicians and bureaucrats make choices to achieve theirown objectives. Both socially desirable and undesirable outcomes are possible, depending on theunderlying incentives of these groups.
Government failure (i.e., socially undesirable outcomes) is due to a number of interrelated causes,including:
• Special interest effects (both domestic and foreign)
• Rational voter ignorance
• Bundling of issues
• Shortsightedness effects
• De-coupling of costs and benefits
• Lack of public accountability among legislators and/or bureaucrats
• Bureaucratic inefficiencies.
Special-interest effects occur when a relatively small number of citizen or foreign parties make largeindividual gains at the expense of a large number of citizens who bear small individual losses. Rentseeking occurs when individuals and groups attempt to use the political process to redistributeincome from others to themselves. Special interests gain disproportionate power relative to theirnumbers because they can provide campaign funds, publicity and delivery of voters who arepassionate about a particular issue. Meanwhile, rational voter ignorance occurs because it is seldomworth the cost for the typical voter to acquire the information needed to make a fully informedvoting decision. In addition, the choice of a single voter is seldom decisive when the overall numberof voters is large. This further decreases the voter’s motivation to acquire more information.
The packaging or bundling of the candidate’s positions further accentuates special interest effectsand rational voter ignorance. Members of the general public who are relatively disinterested in aspecific issue are unlikely to vote on the basis of that issue alone. It is likely that many other issuesare of greater importance to her or him, especially when the impact on their welfare is small. Yet,members of an interest group are likely to vote strictly according to the issue, especially when it hasa significant effect on their welfare. A given political candidacy tends to be accepted or rejected onthe basis of the entire package of positions and not on the basis of a single, special-interest issue.Since voters can only express their will through a legislator who represents a bundle of politicalgoods, the political process becomes imprecise with regard to voter preferences. For example, ithas been estimated that the typical citizen makes only one public choice decision for each thousandmade in the private sector. In addition, politicians often package issues in a complex manner so thatmost voters will be unaware of the true costs that programs will impose upon them. However,special interests are more likely to be well-informed regarding the underlying costs and benefits of apolicy that is specific to their interests.
Politicians tend to be shortsighted because they face short re-election cycles that range from two tosix years.19 They are concerned about the consequences of policies and programs before the nextelection. The long-term consequences tend to carry little weight in the calculations of the politician.
Dimensions of LME Governance
19We use the term shortsightedness to describe the tendency by people to ignore, or give little weight to, futureconsequences, especially consequences in the medium-to-distant future.

44 LME Governance Handbook
Politicians often exhibit shortsightedness. They regularly enact special legislation and appropriationsfor fisheries, and periodically attempt to directly influence the contents of fishery management plans.
Shortsightedness also is present on the demand side. Fishing interests in most managed fisheriestend to be shortsighted about fishery management policy. In open-access fisheries, fishermen haveno secure claim on future outcomes in their fishery. That is, they have no assurance that they willreap the benefits that might accrue from their short-term sacrifices. Fishermen in rights-basedfisheries, on the other hand, are expected to be less shortsighted. Fishermen also tend to beshortsighted because of the great uncertainty they face regarding future fishery policies, fish stocksand markets. Fishermen are simply being rational in their shortsightedness.
The shortsightedness on both the demand and the supply sides of the political marketplacecombines to favor legislation that provides easily identified current benefits at the expense of futurecosts that are complex and difficult to identify. Conservation, which requires short-term sacrifice inexchange for long-term gains, tends to be disfavored in this environment.
Another characteristic that strongly influences fishery policies and outcomes is de-coupled benefitsand costs. Political products have benefits and they have costs. For many fishery products, thosewho benefit are not those who pay the cost of a product. For other products, benefits accrue at adifferent point in time from the costs. An example of de-coupled benefits and costs are government-financed vessel buyback programs, such as the US$25 million vessel/permit buyout program in theU.S. Northeast fisheries. The beneficiaries are the fishermen whose vessels are purchased by theprogram and those remaining in the fishery. The costs, on the other hand, are borne by the generaltaxpayer. The beneficiaries do not pay in proportion to the benefits they receive; and the payers donot benefit in proportion to what they pay. In short, the principal conclusion from this analysis is thatwho pays and how they pay for management services influences policies and the economicperformance of a fishery (Andersen and Sutinen, 2003).
The two characteristics of 1) shortsightedness of the principal actors and 2) de-coupled benefits andcosts of fishery products have a powerful influence on the choice of fishery management policies.The presence of shortsightedness and de-coupled costs and benefits works against adoption ofeffective conservation policies. The structure of the fishery management system tends to disfavoreffective conservation policies because they concentrate short-term costs upon resource users inexchange for benefits in the future that would not necessarily accrue to those users who make thesacrifice.
There are many examples in which the political marketplace favors fishery policies and programswhere benefits are distributed to a few and the costs are borne by taxpayers. Fishery policies andprograms with short-term benefits, and costs to be borne in the future are also favored. The politicalmarketplace disfavors policies and programs for which costs are concentrated on a few and benefitsaccrue to many; and policies and programs with short-term costs in exchange for future benefits.The fishery political marketplace can be expected to produce effective conservation policies onlywhen those who sacrifice in the present can expect to receive benefits in the future.
Government agencies do not face incentives to produce goods and services efficiently. By cultivatingthe political influence of powerful politicians and groups of constituents, bureaucrats createopportunities for themselves to lead larger government agencies. While bureaucrats compete for taxrevenues, promotions, higher incomes and greater power (just as employees do in the private

45
sector), they do not face incentives to increase the value and decrease the costs of their outputs.Public employees cannot increase their income by improving the efficiency of the agency, and theirjob performance is usually difficult to measure (at least in terms of the contribution to the agency’soutput). As a result, they tend to be less conscious of costs, especially since they are spending otherpeople’s money. There is no need to compare revenues with costs; there is no measure ofinefficiency and no pressure to reduce it. The incentives inherent in government agencies lead toinefficient production of government goods and services (Niskanen, 1971; Wolf, 1988).
In addition, government is often the sole provider of the good or service. The exclusive right ofproduction is often mandated by law. Education and postal services in the U.S. are exceptions. Ingeneral, the lack of constant competition for customers leads to inefficiency in governmentproduction.
Unlike the private sector, there is no systematic mechanism to weed out governmental inefficiencies.In the private sector, inefficient firms do not survive – they go bankrupt. In the public sector,agencies with high costs or that cannot meet their targets are often rewarded with increased funding.Agencies that reduce costs and do not spend their budget allocation are penalized with the threat ofa smaller budget the following year.
Correcting and Mitigating Government FailuresThe fishery political marketplace can be expected to produce effective conservation policies onlywhen those who sacrifice can expect benefits in proportion to their sacrifice. To implement thisprinciple, governance arrangements should include the following:
First, devolve to users and others with strong interests in a fishery, the rights and responsibilities ofsetting management policies and bearing the full consequences of those policies. Such action wouldattempt to harmonize interests of managers and users to act in the nation’s interest. This can beachieved by efforts to encourage and facilitate implementation of individual or community fishingquota and other rights-based programs. Examples of rights-based methods include the lobstermanagement zones in Maine, quota holder associations in New Zealand, and the community-basedmanagement regime in Japan. Government still has a legitimate role in management, but it should bethe role of oversight rather than operational decision-making. Appropriately done, such reformwould greatly weaken the shortsightedness among resource users, giving them the incentive to bewilling to make the short-term sacrifices needed to rebuild depleted stocks and avoid overfishing.
Second, remove or minimize opportunities for the political marketplace to produce fishery productswith de-coupled costs and benefits. In current governance systems, too many policies and programsprovide benefits for a select few and impose widespread costs. The full costs of fishery managementneed to be recovered from the beneficiaries of that management. That is, we need to implement theprinciple of beneficiaries paying in proportion to the benefits they receive. In some cases, this wouldmean imposing user fees on resource users and, for other policies and programs, paid for by thegeneral taxpayer.20 Properly designed and implemented, cost-recovery can have sizeable beneficialeffects on the performance of fishery management. Experiences with cost-recovery in Australia andNew Zealand bear this out.
20 For more on cost-recovery and ways to finance fishery management, see Andersen and Sutinen (2003).
Dimensions of LME Governance

46 LME Governance Handbook
Third, fishery managers need to be protected from the shortsighted tendencies of electedrepresentatives. Political interference is common in fishery management throughout the world.Australia has attempted to remove fishery management from the political arena by establishing theAustralian Fisheries Management Authority (AFMA) in 1991. By statute, AFMA has the day-to-day responsibility for developing and implementing fishery management plans. Political involvementin fishery management is allowed only at the strategic level. Unlike in the U.S., Commonwealthgovernment agencies have no authority for developing or implementing fishery management plans.Another way to minimize political interference may be to request our elected representatives topledge not to interfere in the development and implementation of fishery management plans. Thismay be all that they need in order to effectively resist the pleas of constituents who are pursuingshort-term interests.
CIVIL SOCIETYThe institutions and arrangements of civil society play a central role in influencing behavior. Asexplained above, social norms and networks – “social capital” – shape individual and collectivebehavior, and also facilitate co-operation among individuals and between groups of individuals. Thesocial norms and networks can encourage trust, civic engagement, and enhance effectivegovernance while reducing management costs. These have considerable potential for advancingecosystem-based management in informal governance systems.
The institutions and arrangements establish “working rules” that are commonly known, monitoredand enforced (Ostrom, 1990). Though different than the legal requirements established throughgovernmental processes, they are powerful tools that influence individual and group actions. Theviolation of patterns of behavior adopted by the formal and informal institutions of civil society canproduce powerful peer pressures and, ultimately, can lead to isolation or expulsion from thecommunity or even physical retribution.
Basic to effective management of common property resources is trust among users that they will alladhere to applicable rules (Hall-Arber and Finlayson, 1997). Social institutions contribute expertiseand local knowledge and play a crucial role in the diffusion and adoption of reforms, for example, inhow fisheries are conducted and wastes are disposed. Social institutions and NGOs can provide“eyes and ears” to ensure that the policies and actions adopted by the SAP are put into place withtheir participation and involvement, and are implemented.
All is not always well with existing institutions and arrangements of civil society, however. Socialnorms in some societies are not consistent with conserving LME resources, protecting habitat andthe quality of the aquatic environment. Many of the institutions and arrangements of traditionalsocieties have been weakened or destroyed by various influences of globalization. For example,traditional marine tenure arrangements that once protected local fishery resources do not apply toencroachment by fishers from outside the local community. In such cases, there is a need to buildnew, or expand and strengthen the traditional, institutions and arrangements for the issues of LMEresource management and governance.
To address this challenge, many inter-governmental and non-governmental organizations arecurrently engaged in efforts to educate, change values, attitudes and behavior through the use ofsocial marketing and participatory management approaches. These are discussed in more detail

47
below. It is increasingly recognized that civil society should directly and officially share actualmanagement responsibilities with governmental authorities through what is termed “co-management”(Felt, Neis, and McKay, 1997; Wilson, et al., 2003).
STRENGTHENING ADAPTIVE GOVERNANCE FOR
COMPLEX ECOSYSTEMSEffective governance institutions are crucial to sustaining the goods and services that flow fromLMEs. The work of Elinor Ostrom and others (Lee, 1993; Hennessey, 1994; Hennessey andHealey, 1994; Juda and Hennessey, 2001) have demonstrated the need for governance institutionsat a variety of levels to cope with the uncertainty and dynamics of ecosystems, and the impacts ofhuman uses. Elinor Ostrom (2003), one of the leading authorities on institutional analysis and designhas observed: “The most important contemporary environmental challenges involve systems that areintrinsically global or are tightly linked to global pressures and that require governance at levels fromthe global down to the local.” This observation clearly applies to LME governance needs whichrequire integration at all levels and sectors from the national to the local and from program toprogram. Ostrom suggests the following general principles to guide the design of robust ecosystemgovernance systems:
• Devise rules that match prevailing ecological conditions
• Clearly define the boundaries of natural resources and users
• Devise accountability mechanisms for monitors
• Apply graduated sanctions for violations
• Establish low cost mechanisms for conflict resolutions
• Involve interested parties in informed discussion of rules
• Allocate authority to allow for adaptive governance at multiple levels from the global tothe local (also referred to as nested governance systems )
• Employ a variety of institutional types that are tailored to their position and roles in alayered governance system
Perhaps, most important for our purposes is the notion of “nested institutions.” Ostrom suggests thatinstitutional arrangements must be complex, redundant, and nested in many layers. She warns thatstrategies that rely on one level and centralized command and control have been repeatedlydesigned and applied to complex ecosystems and they have failed. Governance should employ amix of institutional types using a variety of decision rules to change incentives, increase information,monitor use and induce compliance.
Another key feature of adaptive governance is the role of adaptive management. Adaptivegovernance sees ecosystems as laboratories for the design and adaptation of the institutions thatcontribute to a governance system. The management of ecosystems consists of far more thanpassing data from scientists to decisionmakers. Management occurs within an institutional settingthat attempts to reconcile the differing values of user groups and the general public and thenprovides the means for implementing chosen objectives. After making a detailed analysis of the
Dimensions of LME Governance

48 LME Governance Handbook
governance of large and complex coastal ecosystem – the watershed of the Columbia River in theU.S. – Lee (1993), concluded that “adaptive management is an approach to natural resourcemanagement that embodies a simple imperative: policies are experiments; learn from them.” Heproposes a set of institutional conditions that enable adaptive management and the challenges facingthose who are working to practice adaptive ecosystem governance (see Lee 1993 for details).
COMPLIANCE, ENFORCEMENT AND LME GOVERNANCEOne of the principal challenges of ecosystem-based management is to secure acceptable levels ofcompliance with the regulations and management measures implemented in an LME. Governmentsregulate the extraction and use of LME resources to mitigate the overexploitation of thoseresources, pollution and destruction of habitat. Government relies on monitoring, surveillance, andenforcement of the regulated economic agents to control these activities (such as fishing, mining,tourism services, waste disposal, land use).
Enforcement programs are based on the deterrence framework, which assumes that the threat ofsanctions is the only policy mechanism available to secure compliance with regulations. The theoryof deterrence, has at least two important shortcomings, however first, the model does not explainthe available evidence very well and, second, the policy prescriptions of the model are not verypractical. Low expected penalties do not always result in high levels of non-compliance; andprescriptions of more enforcement inputs and higher penalties are usually unfeasible or not cost-effective.
In addition, acquiring more and better enforcement services is expensive. In living marine resourcemanagement programs, for example, enforcement is frequently the most costly element, accountingfor a quarter to over a half of all public expenditures (Wallis and Flaaten, 2000: Table 1). This raisesquestions of whether there are ways to improve the cost-effectiveness of traditional enforcement,and whether there are ways to secure compliance without heavy reliance on costly enforcement.There are such ways, as this section illustrates, for the case of fisheries.21
Compliance Behavior in Fisheries22
The purpose of a fisheries compliance program is to have fishers comply with conservation andmanagement regulations. Therefore, we need to understand why people comply, and why they donot. We begin by reviewing the basic theory of compliance behavior, first for the individual and thenfor fishers as a group. Research studies indicate that four factors tend to influence individuals’decisions whether to comply with a law or regulation: (1) the amount of illegal gain or benefit, (2) theexpected penalty, (3) moral obligation, and (4) social influence.23 This is illustrated by the cartoon inFigure 10.21 Much of what follows applies to compliance behavior in general, not just fisheries. Similar patterns ofcompliance behavior are found in sectors that are subject to environmental regulations, for example. Also, notethat this section does not address the problem of fish piracy on the high seas, which has been a prominentconcern in recent years (see http://www.high-seas.org/ for more information).22 This section uses excerpts from Sutinen, J. G. 1996. Fisheries Compliance and Management: AssessingPerformance. Australian Fisheries Management Authority, Canberra, ACT (August).23 See Kuperan and Sutinen (1998) and Sutinen and Kuperan (1999) for a detailed derivation of these factors; also seeGezelius (2002) and Hatcher and Gordon (2006) for reviews of the fisheries compliance research literature. The literatureincludes studies of fisheries in developed and developing countries, such as Indonesia, Philippines, Malaysia, andSouth Africa (Kuperan, et al. 1997; Hauck and Kroese, 2006).

49
Next, we discuss each of the four factorsin more detail, for each is influenced byfishery policy and each, in turn, influencesthe extent to which fishery policy iseffective.
Illegal GainsThe illegal gain or benefit in acommercial fishery is the amount ofadded income that can be earned fromviolating a regulation.24 It is this addedillegal gain that usually temps people toviolate a fishery regulation, though, insome cases, violations are inadvertentor due to ignorance.
The amount of potential illegal gains infisheries often is quite large. For example, in the New England groundfish fishery referred to above,Sutinen, et al. (1990) found a large percentage of fishers were earning illegal gains of about aquarter of million dollars per year. In some cases, illegal fishing trips earned three times the revenueof legal trips. Not all fisheries offer such large potential illegal gains, of course. The important point,however, is that often the incentive to violate can be very powerful and difficult for fishers to resist.25
Potential and actual illegal gains are dynamic, frequently changing, and are influenced by severalconditions in the fishery. The regulations influence the extent of illegal gain. In general, the morerestrictive the regulation, the greater the potential gain from violation. Biological conditions are amajor factor determining illegal earnings relative to legal earnings. The size, location and compositionof the fishery resource, which are constantly in flux, strongly influence where and how fishers canearn the most income. Prices and market conditions also affect the prospects for illegal gains andthereby influence the amount of compliance in a fishery.26 A compliance program must account forthe nature and determinants of illegal gains and be prepared to adapt and adjust to these conditionsas they change over time.
Expected PenaltyThe expected penalty works to deter individuals from committing a violation. If large enough, theexpected penalty can offset the illegal gain and remove the incentive to violate. Unfortunately, this israrely the case. As explained below, the expected penalty usually is small relative to the illegal gain.
The expected penalty is equal to the size of the penalty times the probability of being caught andconvicted of the violation. The magnitude and nature of the penalty or sanction is often constrainedby law and determined by the judicial system. The average size of the penalty for any given violationusually is less than the maximum allowed by law.
Dimensions of LME Governance
24 In the case of a subsistence fishery, the illegal benefit is the added value of fish taken illegally for personalconsumption.25 Poverty and other forms of dire financial circumstances are well-known to drive noncompliance amongfishers.26 For more discussion of these conditions and how they influenced compliance in the New England groundfishfishery, see Sutinen, et al. (1990).
? Illegal
Gain
Expected Penalty
Moral Obligation
Social Influence
Compliance Non compliance
Figure 10. The compliance decision

50 LME Governance Handbook
Penalties generally are not large relative to illegal gains. For example, in the groundfish fishery of theNortheast United States, Sutinen, et al. (1990) estimate flagrant violators grossed about $15,000per trip from violating closed area and mesh size regulations, resulting in illegal earnings of$225,000 during 1987. Typical penalties, when caught and sanctioned for these violations, rangedfrom $3,000 to $15,000 in monetary fines.
The probability of being caught and convicted is usually small, very small. The typical odds of beingcaught violating a fishery regulation are below one percent, and often at or near zero (Sutinen andGauvin, 1989; Bean, 1990; Furlong, 1992; Kuperan, 1992).
When the small probability is multiplied by the modest penalty usually imposed, the expectedpenalty most fishers face is small. It is regarded by many fishers as a “cost of doing business.” Thispattern of low certainty and severity of sanctions relative to potential illegal gains tends to appear inmost fisheries. Raising penalties to the point where the expected penalty offsets illegal gain generallyis not feasible. The courts are not willing to mete out sanctions perceived as excessively severe.Rather, courts tend to impose sanctions that fit the crime, as measured by the illegal gains realized orthe social harm caused by the detected and proven violation.
The implications of this evidence are clear. Compliance policy cannot depend exclusively on deterrenceto ensure a high degree of compliance among most fishers.
Moral ObligationDespite the strong incentive to violate (high potential illegal gain relative to the expected penalty), ahigh proportion (50 to 90 percent) of fishers normally comply with regulations (Sutinen, et al., 1990;Sutinen and Gauvin, 1988; Bean, 1990). This pattern is typical of regulated fisheries.
Asked why they persist complying when illegal gains are much larger than the expected penalties,many fishers refer to the need to “do the right thing” (Gauvin, 1988; Gezelius, 2002). That is, theyexpress an obligation to obey a set of rules (either their own or an authority’s). The sense of moralobligation is common throughout society and may be a significant motivation explaining much of theevidence on compliance behavior.
An individual’s moral obligation to comply is the result of two forces: the individual’s moraldevelopment and standards of personal morality, and the individual’s perceptions of how just andmoral are the rules and regulations. That is, the moral obligation to comply is based on individuals’perceptions of the fairness and appropriateness of the law and its institutions.
An individual who believes that complying with the regulation is the “right thing to do” will feel amoral obligation to comply. An individual disagreeing with the regulation, or management policy andprocedures, may feel the opposite, and be obliged to violate the regulation. The basis of moralobligation is discussed in more depth below, as it is an important consideration when setting andimplementing policy.
Social InfluenceMost individuals also are influenced by their peers, or people who matter to them, when decidingwhether to comply. Social influence is known to play a significant role in everyday social exchange,often taking subtle forms of ostracism or withholding of favors. A group of fishers can reward andpunish its members, either by withholding or conferring signs of group status and respect, or moredirectly by threatening them with sanctions.

51
Social influence in fisheries is often manifested in forms of verbal and physical abuse (e.g., fist fights,destruction of gear and vessels). In the Massachusetts lobster fishery strong forms of socialinfluence, commonly called “self-enforcement,” are estimated to account for the bulk of enforcementin the fishery (Sutinen and Gauvin, 1988). Fisheries, where social influence to comply withmanagement regulations is prevalent and appears highly forceful, include American lobster(Massachusetts and Maine), clam (Rhode Island), herring roe (Alaska, British Columbia, Oregon,San Francisco Bay), saithe (Norway), and sakuri ebi (Japan). There probably are many otherfisheries where this phenomenon is operative.
Social influence and moral obligation are closely linked. The standards an individual uses to judgehis/her own behavior are used to judge others’ behavior. Therefore, the moral principles on whichindividuals base their own behavior are also the basis for the social influence they exercise. Themore widespread a common moral obligation is in the fishing population, the stronger the socialinfluence is expected to be. An important implication is that policies that strengthen the moralobligation to comply also strengthen social influence.
These four factors do not always influence individuals as portrayed in Figure 10. In some fisheriesthere is no moral obligation to comply and social influence is on the other side – encouragingindividuals to violate (Figure 11). Thiswas the case in the New Englandgroundfish fishery during the late 1980swhere the pressures from crews andcompetition with others drove captains ofvessels to fish in closed areas and useillegal nets on most trips (Sutinen, et al.,1990). In such cases, complianceprograms must not only strive to increasedeterrence (i.e., the expected penalty),they also must strive to build a strongsense of moral obligation to complyamong fishers and to shift social influenceto the side of supporting compliance withthe regulations. How this can beaccomplished is discussed at some lengthbelow.
Aggregate Compliance BehaviorAll fishers are not alike in their compliance behavior. Some are more compliant than others, reflectingvariations in the size and nature of the four forces of compliance. For example, some fishers invest inmethods to avoid detection and face lower probabilities of detection than other fishers (Anderson andLee, 1986; Bean, 1990). Others have a stronger moral obligation and face more social pressure tocomply (Gauvin, 1988).
The available evidence suggests that within the typical population of fishers there is a small coresubgroup, of about 5 to 15 percent of fishers, which tends to violate chronically and flagrantly. Theyare motivated largely by the tangible (usually financial) gains from illegal fishing. Moral obligation andsocial influence have little or no effect on their behavior. Only by changing the economic incentives,
Dimensions of LME Governance
?
Illegal
Gain
Expected
Penalty
Social
Influence
Compliance Non-compliance
Figure 11. Undesirable Compliance Context

52 LME Governance Handbook
by reducing the potential illegal gains or by increasing the expected penalty, can their illegal fishing becontrolled. In the absence of incentive programs, the only control mechanism for this subgroup isenforcement.
The remainder of the population consists of a small fraction (5-15 percent) that is strongly influencedby moral obligation and comply most, if not all, of the time, and a large portion that normallycomplies, depending largely on the degree of social influence they face. This latter group typicallyconsists of about 70 to 90 percent of the fishing population.
The result is that a small number of fishers tend to account for – directly and indirectly – most of thenon-compliance, and most of the risk to conservation and management of a fishery. Chronic violatorscan only be controlled by enforcement and other tangible incentives. Smart compliance policy (discussedbelow) recognizes and exploits this critical feature of compliance behavior.
Voluntary ComplianceIt is becoming increasingly evident that a critical and necessary condition for successful fisherymanagement is fishers’ support for the program. The evidence is extensive and persuasive,originating from several countries for a variety of fishery settings. The evidence is provided by front-line fishery managers, enforcement authorities, industry spokesman and field researchers.27 Weknow that without widespread industry support, a fishery management program is doomed.
As noted above, the vast majority of compliant behavior is “voluntary,” more the result of moral andsocial considerations rather than coercive enforcement.28 Studies of fisheries compliance indicatethat a large proportion of fishers are strongly affected by the twin forces of moral obligation andsocial influence. This group of fishers, which often comprises about 90 percent of the fishingpopulation, normally complies with fishery regulations.
Individuals’ voluntary compliance is closely linked to regulatory policy and practices. Thecompliance literature recognizes two types of intrinsic motivation or obligation to comply (Tyler,1990). One is related to the individual’s desire to behave according to her/his sense of personalmorality, i.e., an internal obligation to follow one’s own sense of what is right or wrong. The othertype is related to the intrinsic obligation to follow the dictates of a “legitimate” authority (such as thepolice, one’s boss, or other authority figure). These relationships are illustrated in Figure 12.Legitimacy effectively functions as a stock of loyalty on which leaders can draw. Those who acceptan authority’s legitimacy tend to comply with its dictates even when the dictates are contrary to anindividual’s self-interest.29
27 ‘The point is that fishery management cannot rely on the surveillance and control system to ensure totalcompliance. There are two important aspects of this conclusion. One, there will always be some degree of non-compliance with the regulations. No amount of enforcement effort will completely eradicate violations of theregulations, and management policy should allow for this fact. Two, the degree of compliance is closely linkedto the extent to which fishers support management policy. A high level of support by the fishing communitytranslates directly into compliance with management regulations’ (Sutinen, 1995).28 This pattern of high compliance rates in the face of low expected penalties is commonly found in otherregulated industries as well.29 Tyler (1990) argues that it is better for a rule-making body to base compliance on legitimacy rather than onpersonal or group morality because the scope of legitimate authority is more flexible (in that leaders usuallyhave a wide range of discretionary authority). Personal morality, on the other hand, is double-edged, for it mayor may not accord with the dictates of the authority, leading to resistance to the law and legal authority, insteadof compliance with its dictates.

53
Fishers tend to comply more with lawsand regulations that are “legitimate.”Coercion, the threat of sanction, usually isnot the principal factor influencing theircompliance decisions (Sutinen andKuperan, 1999; Kuperan and Sutinen,1998; Hanna, 1995; Gezelius, 2002).
What is the basis for legitimacy andvoluntary compliance?
• First, there must be a reasonablycommon understanding of thebasic nature and extent of theproblem, such asoverexploitation.
• Second, the procedures fordeveloping and implementingmanagement measures must be perceived to be fair.
• Third, the resulting measures must be perceived to be effective, i.e. to make a significantcontribution to resolving the problem.
When these conditions are reasonably well satisfied, fishers are willing to sacrifice personal gain forthe good of the fishery, and to sacrifice immediate gain to realize improved harvests in the future.When these conditions are not reasonably well satisfied, fishers balk. Their resistance is expressedin a variety of ways. They speak out at public hearings (either personally or via lobbyists). Theyseek support from their legislative representatives. And/or, they violate the regulations. Non-compliance for most is a last resort, but is also one of the most effective means of protest, and iteffectively sabotages a management program.30
How can legitimacy and, therefore, voluntary compliance be strengthened? One approach is throughgreater user participation in the design and implementation of policy. Moral suasion is anotherapproach.
User ParticipationUser participation in the design and implementation of policy can help create the conditions oflegitimacy noted above. A large body of research on user (stakeholder) participation in fisherymanagement indicates that compliance is greater and far less costly when users are meaningfullyinvolved in the development and implementation of fishery management programs. Involving fishersand other stakeholders in the development and implementation of a compliance program improvesthe fairness and appropriateness of the program, and in turn improves its cost-effectiveness.Keeping regulations simple and with a clear connection to conservation goals, and the equitableapplication of regulations and enforcement are also believed to be important for securing industrysupport (Sutinen, 1995).
Dimensions of LME Governance
30 See Hauck and Kroese (2006) for an example of “protest fishing” in the South African abalone fishery.
Fairness
Efficiency
Process
Fairness
Effectiveness
Outcomes
Legitimacy
Moral
Suasion
Moral Development
& Personal Values
Moral Obligation
& Social Influence
Voluntary Compliance
Figure 12. Determinants of voluntary compliance

54 LME Governance Handbook
Hanna (1995) argues that the extent of user participation in the process significantly affects the costsand the effectiveness of management. She identifies four stages of the management process: (1)description of the resource context, (2) program design, (3) program implementation, and (4)monitoring and enforcement. Describing the resource context is an assessment process with users asits focus, and includes information on describing users, processors, markets and analysis of users’interests. This is related to the TDA process presented in previous sections. Design of themanagement program is dependent on the descriptive information, and the quality of the descriptiondetermines whether the management program design reflects well its social and economicenvironment. This effort is comparable to the SAP development process described in previoussections. As with SAP implementation, implementation of the management program is the legal andadministrative process required to put the program into effect. Monitoring the state of the fisheryand enforcing compliance with regulations are ongoing processes over the life of the program. Eachof the four stages of management involves costs. The major costs of fishery management are thecosts of gathering information, designing regulations, coordinating participants, monitoringconditions, enforcing regulations. This group of costs is called transactions costs.
Hanna asserts that the transactions costs of management will vary by the extent of user participationin the management process. In particular, she argues that the least-cost structure for the descriptionand design stages is a top-down management structure, relying on small numbers of experts andinvolving very little participation by resource users. This is because a user participatory structurerequires greater amounts of time and resources spent in coordination, information dissemination, andconflict resolution. In the implementation stage, however, the balance of transactions costs shifts.The benefits of user participation are realized in lower transactions costs of monitoring andenforcement because users are more likely to comply with the regulations and the regulations aremore likely to be enforceable. Costs also are affected by the different incentives faced by usersunder top-down and bottom-up management structures. The top-down structure creates anincentive to sabotage the program because uncertainty about the goals of the process tends toshorten time horizons of users, encouraging short-term actions at the expense of long-termsustainability. The bottom-up structure, involving extensive user participation, creates a stake in theoutcome and reduces uncertainty about process goals. Also, user participation can promotestewardship through creating an assurance of control over outcomes. Hanna concludes that the“benefits of top-down management are front loaded, whereas the benefits of user participation areend loaded,” having the potential for long lasting returns.
The extent and nature of user participation in fishery management can vary widely. In general, it is “adynamic partnership using the capacities and interests of user-groups complemented by the ability ofthe fisheries administration to provide enabling legislation and administrative assistance. The fisheriesadministration and the user-groups share responsibilities and competence for fisheries management”(Nielsen and Vedsmand, 1995). The partnership can encompass a range of possible ratios ofgovernment and user-group rights and responsibilities in the management process. The rights andresponsibilities concern the tasks of management. There are at least seven key tasks that can beshared between government and resource users in the development and implementation of a fisherymanagement program. These include (1) assessment of the state of the fishery, (2) settingmanagement objectives, (3) selecting management measures, (4) allocation of catches (or otherbenefits) among resource users, (5) allocation of catches over time, (6) enforcing regulations, and(7) learning about changing conditions in the fishery.

55
It is important to recognize that as the degree of participation increases, the program’s control overboth the process and the outcomes diminishes. More participation is not necessarily better. Thedegree of participation that a program selects can be visualized as a ladder with four rungs.
Level One: Providing Information. Providing information can be the sole objective of a project’sparticipation efforts. Public information materials typically include publications, slide shows, videos,books and brochures. Information can increase the public’s awareness and understanding of theresource area, its management issues, and the causes and solutions to coastal problems. Informationcan encourage stakeholders to voluntarily comply with regulations and to participate more fully inthe program.
Level Two: Consultation. Consultation is a two-way process. It calls for both giving and receivingopinions and information. It provides stakeholders a role in shaping both the analysis of issues andwhat should be done about them. It is a process that allows the project manager to retain controlover the project’s process while seeking local knowledge and welcoming ideas on what actions totake. Committees, working groups and public workshops are common consultation techniques.
Level Three: Collaboration. In collaborative management, those responsible for a coastalmanagement program share power with others external to their team. Collaborative participationworks well when project managers are willing to limit program actions to those that thecollaborators can formally agree to. This can reduce a program to following easy courses of action,rather that the more difficult, proactive courses that may ultimately have a greater impact. Strongleadership may be required to make a collaborative approach viable. Collaboration is built onpartnerships that usually require considerable time and energy to develop. Collaborativeapproaches, however, are often the most effective path to solving complex issues including manyinterests.
Level Four: Support to Independent Initiatives. When supporting independent initiatives, aprogram works to help government agencies or local communities develop and carry out their ownplans. Such programs must put clear limits on what they will support. Formal institutional structureswill be needed to define the goals and the procedures that allow stakeholders to organize, engage incontracts, and own and manage assets.
All effective ecosystem governance programs rely upon a mixture of methods to implement theirplan of action. Regulations – applied by rules, zoning ordinances and permit processes – areinvariably important. Non-regulatory methods include investments in infrastructure, the purchase oflands, education and investments in monitoring and research. A participatory approach to ecosystemgovernance enables stakeholders and the public to see these efforts as a coherent whole and worksto win their support for the program. Voluntary compliance by a supportive population lies at theheart of the successful implementations of an ecosystem governance program.
Most major fishing nations currently rely on the consultative mode of user participation, but there isa growing trend toward greater sharing of power between government and user groups. Theavailable evidence from these experiences supports Hanna’s (1995) argument that the performanceof fishery management institutions is strengthened by meaningful user participation.
Dimensions of LME Governance

56 LME Governance Handbook
Moral SuasionAnother common approach to strengthening voluntary compliance is moral suasion. Formal socialmarketing techniques,31 as well as straight forward education, provide people with informationwhich, if successful, shapes their attitudes and values, and induces socially desirable behavior. Thegeneral operating hypothesis is that information influences personal values, and personal valuesinfluence behavior (Fishbein and Azjen 1975).
An illustration of this is Michael Crichton’s (1988) story of his search for egg-laying leatherbackturtles along the east coast of Peninsular Malaysia. After several nights waiting, he discovers one ofthe giant turtles laying her eggs near his hotel. While Crichton watches the turtle’s slow and clumsyeffort to dig a pit for her eggs, a vacationing family arrives. The parents take flash photographs ofthe children each taking a turn sitting atop the back of the turtle. After several minutes of the family’staunting the creature, a local Malay boy arrives and explains to the family what the turtle is doing,how she had laboriously struggled up the beach, turned around to face the ocean, how long it hadtaken her to dig her pit, the effort it would take to lay her eggs, and the many hours she would liethere, exhausted, trying to find the strength to struggle down the beach and return to the surf bydaybreak. The family listened in silence, their young son got off the turtle’s back. The children wereencouraged to touch the turtle’s shell and make peace with the great creature. With growing respect,the family stepped back from the pit. Once they understood what was happening, they becamesympathetic and understanding, stopped harassing the turtle and quietly drifted away.
In this example, the Malay boy’s explanation persuaded the family to stop their environmentallyundesirable behavior. Simple education functioned as moral suasion, i.e., inducing socially desirablebehavior by shaping and/or appealing to people’s personal values.
Properly executed, moral suasion can be a cost-effective means of strengthening compliance withfishery regulations. The effort will have to do more than just educate in most instances; it will have topersuade. The effort will have to develop a common understanding of the nature and extent offishery management and compliance problems, and to convince users of the fairness andeffectiveness of procedures and measures used to manage fisheries. The moral suasion effort willhave to be ongoing. Short-term moral suasion efforts have no long-lasting effects and the payofffrom the effort may take a generation to fully realize.
Smart Compliance PolicyWhat do these considerations imply about policy?
The stylized facts about compliance behavior have two meaningful implications for compliance andenforcement policy, and for overall policy: (1) promote voluntary compliance, and (2) target chronicand frequent violators. In addition, there are three other policy prescriptions implied by the researchon compliance: (3) maximize the deterrent effect of sanctions; (4) account for non-compliance insetting regulations; and (5) adopt enforceable regulations. We now discuss each of these in turn.
A compliance program needs to recognize that compliance behavior varies among fishers. Thecompliance problems presented by those fishers not affected by moral obligation and social31 Social marketing is a communication approach that makes use of commercial marketing principles to “sell”ideas, attitudes and behaviors to campaign for behavioral change. Mahanty and Stacey (2004) illustrate howsocial marketing techniques can be applied to promote participatory management of natural resources in thePacific region.

57
influence need to be addressed differently than the compliance problems presented by the rest of thefishing population. This will involve developing strategies that seek to strengthen voluntarycompliance, and to target scarce and costly enforcement resources.
Promote Voluntary ComplianceAs explained previously, the willingness to comply stemming from moral obligation and socialinfluence is based, inter alia, on the perceived legitimacy of the authorities charged withimplementing the regulations. Research evidence suggests that a key determinant of perceivedlegitimacy is the fairness built into the procedures used to develop and implement policy. Therefore,regulatory authorities should determine what policies and practices are judged fair by thosesegments of the population subject to regulations. This may mean, for example, that civil penaltiesand other sanctions should be comparable in value to the larger of the harm done or gains realized.This may mean that individuals subject to surveillance and monitoring be treated with dignity andrespect. This may mean that regulations must appear reasonable and ‘make sense’.
There are a number of conclusions for policy that flow from the model developed here. Perhaps themost important implication is that top-down, command and control-style policies likely will not beperceived as legitimate. The result will be policy that is ineffective in achieving its goals, and aprogram that is costly and rife with popular dissatisfaction.
Another implication of the theory is that policy makers should pay more attention to the fundamentalissues of institutional design. Like other political and legal institutions in society, regulatory bodiesshould devote great effort to developing legitimacy. The mere fact that an institution is formed undera piece of legislation does not necessarily confer on it legitimacy. How legitimacy can be earned isbeyond the scope of this contribution, but is an important issue worthy of future investigation.
More equitable procedures for imposing restrictions on the economic community should strengthenlegitimacy and voluntary compliance. Co-management regimes, in which participants areempowered to play a prominent role in decisionmaking, may be a means of achieving this end(Hanna, 1995). This would address, in part, the need to incorporate procedural justice in theinstitution. Similarly, enforcement policies and practices need to be seen by participants as being fair.This means that enforcement authorities should target chronic and flagrant violators of theregulations, punishing them accordingly, while tolerating to some degree minor violations byindividuals who normally comply with the regulations.
To the extent that a regulatory authority has legitimacy, it will possess a precious stock of loyaltyupon which it can draw in times of crisis. A collapse of a fishery resource, or environmental calamity,can be swiftly and severely dealt with by a legitimate authority, imposing on participants significantshort-term sacrifices. Participants who view the authority as legitimate feel a strong obligation tocomply even when the dictates of the authority are contrary to their self interest.
Target Frequent ViolatorsWe turn now to the subgroup of fishers who tend to flagrantly and chronically violate fisherymanagement regulations. Even if the subgroup of chronic, flagrant violators is small and the amountof their illegal fishing is minor, they need to be controlled. Weak enforcement would allow chronic,flagrant violators to flaunt violation of the law. Being seemingly immune to the regulations sends twosignals to normally law-abiding fishermen. One is that regulatory procedures are unfair, having noeffect on flagrant illegal fishing. The other is that the regulatory program is not effectively managing
Dimensions of LME Governance

58 LME Governance Handbook
the fishery (protecting the resource). Each of these signals weakens the moral obligation to complyand the moral basis on which social influence is exercised. As moral obligation and social influenceare weakened, compliance begins to erode among those who would normally comply with theregulations. Their subsequent noncompliant behavior influences others not to comply with theregulations, and ultimately compliance breaks down.32 Only effective enforcement can prevent thisdeterioration.
The cost-effective use of scarce and costly enforcement resources requires targeting the chronic,flagrant violators, devoting more enforcement resources to detecting and sanctioning thesepernicious individuals. The reductions in illegal fishing mortality will be greatest when these violatorsare brought under control. Also, a positive multiplier effect on deterrence is expected when thechronic, flagrant violator is caught and penalized. The reverse is also true – i.e., while severeenforcement actions taken against the marginal, inadvertent or infrequent violator iscounterproductive, possibly having a negative multiplier effect on deterrence.
Another reason for targeting chronic, flagrant violators is that it places them at greater risk. Achronic violator – by virtue of the fact that s/he is violating more frequently – stands a greater chanceof being detected during the course of a season than a fisher who infrequently violates. By increasingthe surveillance and monitoring of chronic, flagrant violators, the odds of detection can besubstantially improved. It is easy to demonstrate for a not unrealistic setting that increasing theinspection frequency from once to fours times a year can increase the odds of detection from about20 percent to over 60 percent. Therefore, targeting is an effective way of increasing the expectedpenalty to the point where it can be a potent deterrent.
Penalties for this group should be high, especially for repeat offenders. Offenders with seriousviolations should face more comprehensive and regular reporting, monitoring and surveillancerequirements (the reason for this is discussed below in the subsection on maximizing deterrence).Repeat violators should face the prospect of being banished from all fisheries.
The need to target chronic, flagrant violators does not imply no enforcement resources are directedtowards fishers who normally comply with management regulations. Indeed, a balanced allocation ofcostly enforcement resources is optimal. While enforcement resources should be used to targetchronic, flagrant violators, there also is the need for routine monitoring and surveillance of normallycompliant fishers. These fishers must have occasional contact with and other reliable informationabout the presence and performance of enforcement personnel so that the legitimacy of theenforcement program is maintained.
Coercive enforcement measures remain an essential ingredient in any compliance regime, evenwhere a high degree of compliance is realized via the twin forces of moral obligation and socialinfluence. As noted above, in almost any group of individuals subject to regulation there is a coresubgroup (usually small) of chronic, flagrant violators motivated largely by the direct tangibleconsequences of their actions. Moral obligation and social influence have little or no effect on theirbehavior. Only by changing the economic incentives, by reducing the potential illegal gains or byincreasing the expected penalty, can their illegal activity be controlled. In the absence of incentiveprograms, the only control mechanism for this subgroup is enforcement.
32 This process of deteriorating compliance is believed to have occurred in Northeast fisheries in the late 1980s(Sutinen, et al., 1990).

59
Some of the findings in the large body of research literature on enforcement and compliance alsohave implications for policy that are useful for LME governance. We briefly present three of thesepolicy prescriptions next.
Maximize Deterrent of SanctionsThe first is to maximize the deterrent effect of sanctions. As indicated above, the courts commonlyrestrict the severity of sanctions to not exceed the illegal gains realized or the social harm caused bythe violation. This, combined with the usual small probability of detection and conviction, results in arelatively small expected penalty and, thus, weak deterrence. To maximize the deterrent effect of thegiven sanction, compliance authorities can apply what is popularly referred to as the heaven, hell andpurgatory approach to compliance. Developed by Russell (1990),33 the method involvescategorizing regulated entities (e.g., fishermen) by their compliance status, and imposing monitoringrequirements and sanctions that induce high levels of compliance.
The first step in developing the heaven, hell and purgatory approach to compliance is to categorizeregulated entities by their compliance status. There would be a “green list” of entities that have asuperior record of compliance – for example, no more than one significant violation during the pastthree (or five) years; a “red list” of frequent and/or flagrant violators who have a poor record ofcompliance; and a “yellow list” of entities that have a slightly blemished record of compliance duringthe past three (or five) years.
The second step is to define the set of privileges and obligations that entities face in each listcategory. Green list entities would have the most privileges and fewest obligations; the red listentities the fewest privileges and most obligations; and the yellow list categories privileges andresponsibilities somewhere in between. Indeed, red entities may be banned altogether from fishing.For example, green entities may able to fish whenever and wherever they wish within the confines ofthe fishing regulations; and yellow entities may be restricted to fishing only during some hours ofeach day and only in some areas. Green entities would be monitored (inspected) infrequently andhave minimal, if any, reporting requirements; whereas yellow entities would be regularly monitoredand have frequent and onerous reporting requirements. In other words, yellow entities are entitled tosome, but not all, of the privileges accorded to green entities, and are subject to greater scrutiny andself-reporting than green entities.
A key component of this approach is that yellow entities may earn elevation to the green status bydemonstrating an acceptable level of compliance for a specified period of time. The status of redentities, on the other hand, is irreversible. Therefore, the third step is to determine the terms underwhich a yellow entity may ‘earn’ elevation to the green list – such as having a perfectly clean recordof compliance and reporting over the course of, say, three years.
This method of graduated sanctions (in terms of privileges and obligations) produces a strongerincentive to comply for a given probability of detection and penalty. This occurs because a violationhas an expected cost in terms of future foregone opportunities (lost privileges) and future costs(increased scrutiny) in addition to the expected penalty of the violation itself.
Dimensions of LME Governance
33 Also see Russell (2003) for a comprehensive discussion of environmental monitoring and enforcement.

60 LME Governance Handbook
Account for Non-Compliance in Setting RegulationsOne of the most important implications is to systematically account for the level of non-compliancewhen setting management policy.34 This principle can be easily seen in the context of a regulation ontotal catch. Suppose there is a reliable estimate of the amount of illegal fish being taken in a fisherymanaged with a quota on the total catch by individual producers (i.e., individual quotas). Non-compliance is properly accounted for in such a fishery when the amount of illegal catch issystematically factored into the setting of the total allowable catch (TAC) for the fishery. That is, ifthe biological sustainable yield for the fishery is 100 units and the amount of illegal catch in thefishery is estimated to be 20 units, then the amount of total allowable catch allocated to quotaholders in the fishery should equal the difference, 80 units. The sustainability of the fishery can onlybe ensured if the amount of illegal catch is systematically factored in to the amount of the TAC.
The same principle applies to other management measures. For example, in the case of a closedarea, if the closed area is being breached and fish illegally taken in the area, that fishing mortality hasto be taken into account when assessing the performance of the management program. Boundariesof the closed area may have to be adjusted to ensure that the amount of total fishing mortality is atsustainable levels. The principle also applies to other input controls.
Adopt Enforceable RegulationsEnforcement authorities regularly report that too many fishery management regulations are simplynot enforceable. It is too easy to evade detection. A common refrain of field agents is that “we onlycatch the stupid.” To minimize, if not avoid, the implementation of unenforceable regulations,enforcement authorities need to be included the process that develops regulations. They should betasked with assessing the enforceability of each and every management measure underconsideration.
SUMMARY AND CONCLUSIONSThis part of the Handbook has briefly explained some of the implications of socioeconomic andgovernance analyses for LMEs. The analyses indicate that while the three mechanisms ofgovernance (markets, government, civil society) are potent determinants of LME outcomes forproductivity, fish resources and fisheries, pollution and ecosystem health, there are several keychallenges inherent in each mechanism that have to be addressed. Some approaches for addressingthese challenges have been discussed in this and other previous parts of the Handbook. Sustainablefinancing also has the potential for addressing many of the challenges presented by imperfectmarkets and government, which is the subject of the following Part IV.
34 Examples of methods for measuring noncompliance in fisheries can be found in Gauvin (1988), Bean (1990),and Kuperan (1992). Also see the Appendix in Sutinen (1996).

61
PART IV
SUSTAINABLE FINANCING
During the past 30-plus years, coastal nations have enacted numerous environmental and naturalresource laws and programs to mitigate or halt the degradation of marine ecosystems. There nowexist myriad national and international programs to regulate pollution, to reduce the destruction ofcoastal wetlands, mangroves, and coral reefs, and to manage fishery resources at scales that rangefrom inshore small-scale fisheries to large marine ecosystems. In some regions, the implementationof the laws and programs have resulted in substantial expenditures for pollution control, fisheriesmanagement, and land use regulation in the coastal regions. In other settings, there is a large“implementation gap” and little has been done to implement formally adopted policies and
management schemes.Although there is no globalaccounting of the totalamounts that coastal nationshave spent and are spendingon programs to improve thecondition of LMEs, there area few examples that indicatethe order of magnitudes ofexpenditures on someprograms.
For example, Olsen andNickerson (2003) report thatthe U.S. Chesapeake BayProgram, an outstandingexample of adaptiveecosystem management atthe scale of a large estuaryand its watershed, spendsapproximately US$70
million per year on efforts that are linked directly to program goals.1 The program operates with anannual budget of US$6 million in core funding that covers the costs of maintaining the program’soffices, the salaries of the staff, the production and publication of reports and elements of the publiceducation programs. The Great Barrier Reef and the Wadden Sea programs each spend
1 The area of the Chesapeake Bay is 6,475 square kilometers, and its watershed extends over some 172,000square kilometers. Management of the Bay primarily involves efforts to control and reduce nutrients andpollutants that flow into the Bay and its tributaries, as well as restore riparian and aquatic habitat to sustainestuarine fisheries.
Sustainable Financing
Figure 13. Stylized trends of LME values, ecosystem condition, and
management expenditures
Man
ag
em
en
t
Exp
en
dit
ure
s
Present
National Government $ GEF$
Sustainable Financing $
1950
Valu
e
Eco
syste
m
Co
nd
itio
n
Present
Present
1950
1950
Market Value
Non-market value

62 LME Governance Handbook
approximately US$20 million per year on management efforts (Olsen and Nickerson 2003).2Regarding fisheries, Wallis and Flaaten (2000) report that OECD countries governments spent atotal of US$2.24 billion in 1997 on fisheries management, an amount equivalent to 6 percent of thevalue of OECD fisheries landings. The expenditures on fisheries management – for research,enforcement and management administration – account for about one third of all governmentfinancial transfers to marine capture fisheries (OECD 2000: 133). Emerton, et al. (2006) summarizethe latest available data on the amounts and sources of funding globally for all protected areamanagement, which totals US$6.5 billion annually. For comparison, Spergel and Moye (2004)claim that the operation of a global network of marine protected areas “might cost between US$7billion and US$19 billion annually.”
Although we do not know the magnitudes with much certainty, we can comfortably conjecture thatthe amount of expenditures on conservation and management of marine resources has grownsteadily since the mid-1970s. We illustrate this stylized trend in expenditures for a hypothetical LMEin Figure 13. As noted above, the GEF has provided over US$260 million and mobilized US$450in additional funding to support the planning and implementation of LME assessment andmanagement projects in 121 countries since 1993. The grey dashed line in Figure 13 represents theGEF expenditures for our hypothetical LME, which extends beyond the present and ending at sometime in the future.
THE FINANCING CHALLENGEPrograms for managing LME resources will likely grow significantly in scale and scope, which willincrease the demand for additional revenues to cover the costs of these programs. GEF funding,although large by some standards, is limited and will not continue indefinitely into the future. It isessential that LME program managers and their partners begin early on in the TDA/SAP process toplan for the long-term financing of these critical programs. Financial planning for resourcemanagement is not common. Traditionally, policy makers and managers have focused primarily onthe scientific and administrative requirements of environmental and natural resource managementplans, and ignored or given little attention to the long-term financing required to implement programsand practice adaptive management over the decades.
There are at least two major challenges for financing LME programs. LMEs, by definition, involvetransboundary resources, which require expensive monitoring and assessment efforts to supportcooperative management programs among two or more coastal states. This challenge is complicatedby the fact that not only do two or more countries have to agree upon how to manage use of aresource, they also have to agree upon how to finance the monitoring, assessment, enforcement, andadministration of the management program. And, while some financing approaches may beappropriate in one of the countries, the same approaches may not be appropriate or feasible inanother of the countries participating in the project. How costs and benefits will be allocated amongparticipating states will likely be another major issue.
A second major challenge for financing LME programs after GEF support ends is competing fornational funds with other sectors, such as education, health, housing, transportation, which oftenhave priority over environmental programs for government revenue. According to WCPA (2000),2 Australia’s Great Barrier Reef covers an area of 347,800 square kilometers; and the Wadden Sea, an estuarybordered by the Netherlands, Germany, and Denmark, covers an area of 13,500 square kilometers.

63
‘following the economic crisis in South East Asia, budget cuts resulted in significant reductions infunding for the environment.’ Well-designed financing arrangements that are linked to revenuesgenerated by users of LMEs resources can mitigate, if not avoid, this erosion and fluctuation infunding for an LME program.
Fortunately, there is a growing awareness of the need for and application of financial planning inenvironmental and resource management programs. There are several excellent guides for planningand implementing sustainable financing mechanisms (described in brief below). The guides explainthe principles and methods of developing financial plans, and explain and provide examples ofspecific financing mechanisms or tools that are being used throughout the world.
As good as they are, the guides on sustainable financing tend to focus on a relatively narrow set ofissues and approaches to environmental and natural resource management. The excellent guides bythe World Wildlife Fund (2004) and the World Conservation Union (IUCN 2000) concentrate onfinancing protected areas, both marine and terrestrial. There clearly is a need for a set of guidelineson sustainable financing for LME projects that involve multiple approaches to management and,perhaps most challenging, that involve multiple countries attempting to manage transboundaryresources.
This Handbook will not attempt to provide comprehensive guidelines on LME sustainable financing.Instead, this part of the Handbook will summarize some of the essential aspects of sustainablefinancing, and provide some directions on how LME program participants can move forward ondeveloping sustainable financing for their programs.
PLANNING FOR SUSTAINABLE FINANCINGLME programs and projects should view the development of long term financial plans for SAPimplementation as a top priority. Paraphrasing the World Commission on Protected Areas (WCPA)(2000), a financial plan helps to determine the funding requirements (including the amounts andtiming of the funding) and to identify income sources for each of the needs. In other words, theplanning involves identifying both how much money is needed for all the activities and “locates themost appropriate funding sources for short, medium, and long-term needs.” WCPA notes that somesources of funding “are more reliable than others, some sources are easier to raise than others, andsome can be used freely according to management priorities while others come with stringsattached.” In addition, funding sources vary by the time horizons for which they are available (e.g.,bank overdrafts vs. mortgages), and by the effort required to acquire the funding. Some fundingarrangements require considerable amounts of time and effort to establish, and while they providelittle revenue in the short term, they offer the prospect of providing steady and reliable revenues overthe long term.
The guidelines in WCPA (2000) provide an excellent set of principles and procedures fordeveloping plans for sustainable financing. Although the WCPA focuses on financing planning forprotected area management, the guidelines can be readily adapted to LME programs. Theguidelines prescribe three operational principles:
• Develop financial plans within the full context of LME management plans and its legal framework
Sustainable Financing

64 LME Governance Handbook
• Adopt a business approach to financing LME programs, including identifying specific consumers(beneficiaries) of LME resources and management programs, and determining methods forcapturing appropriate remuneration from those consumers
• Link public revenue streams to public goods, and link private revenue streams to club, localpublic, and private goods3
The guidelines encourage program managers to investigate a wide range of financing options and todiversify their portfolios of revenue sources. Chapter 2 in the WCPA guidelines explains how toidentify and classify benefits from the environmental and natural resources, and how to link theconsumers/beneficiaries with each form of the benefits. Chapter 3 explains the basics ofimplementing the financial plan in the context of an overall business plan for the managementprogram. The second part of the guidelines catalogs various sources of funding, and the third partpresents a few case studies of sustainable financing programs.
In a recent update of the WCPA guidelines, Emerton, et al. (2006) provide a more sophisticatedand complete exposition of sustainable financing for protected areas. Numerous examples and casestudies are presented that demonstrate the full set of challenges and promising prospects ofsustainable financing approaches. Those who are interested in developing long-term financial plansfor LME programs will find this report immensely valuable. There is, however, a need to adapt andexpand the guidelines to account for the multinational, transboundary resource aspects of LMEprojects.
TAMING MARKETSSustainable financing can potentially yield a double dividend. In addition to covering the costs ofLME projects, financing arrangements and mechanisms also can be used to tame markets andmitigate the harm that markets do to ecosystems.
As explained in Part III of this Handbook, markets do not naturally tell the ecological truth – i.e., donot reflect the full costs of using ecosystem resources – which drives economic activities that lead todegradation of ecosystems. Market-driven economic activities are one of the direct causes ofoverexploited fishery resources, of degraded primary productivity and overall health of large marineecosystems. Although market prices cover the cost of capital and labor, the prices to do not coverthe costs of reducing a fish stock, of damaging habitat, of waste disposal and pollution, and otherecological costs. Sustainable financing offers a suite of mechanisms for creating markets that tell theecological truth, and mitigate their tendency to harm LMEs.
3 Public goods are those which, when once provided, are available to all at a zero price — for free. Morespecifically, public goods are those for which one party’s use of the good does not subtract from anotherparty’s use (examples include marine research and education, navigational aids, clean waters and beaches,habitat and species preservation and restoration, early warning systems for tsunami and typhoons, andattractive vistas). In the case of private goods, one party’s use subtracts from, and perhaps precludes, the useby another party (examples include exclusive individual mining and fishing rights). In addition, there is a widevariety of government goods and services that are impure public goods, that are neither perfectly non-rival norperfectly non-excludable. Goods (or services) that are excludable and non-rival are club or local public goods;and goods that are non-excludable and rival are common-pool goods.

65
The judicious application of taxes, user charges, fees, and other financing mechanisms can makemarkets more ecologically truthful. By calibrating taxes, charges, and fees, to reflect ecologicalcosts, and adding them to costs of capital and labor, market-driven activities will reduce theirexploitation of fisheries, damage to habitat, and pollution. For example, pollution charges resultingfrom damage assessments for marine oil spills could provide the funds for cleanup and restoration ofinjured resources. Thus, compensation for damages provides sustainable financing for protection ofLME resources. In addition, charging polluters for damages also internalizes environmental costs sothat the ecological costs of a harmful activity are better reflected in the market price of outputs. Byraising the cost of market goods to include their harmful effects, charging polluters for damagesserves to help “get the price right,” a cornerstone in sustainable resource use.
To calibrate these and other charges, the ecological costs of activities that are extracting LMEresources, and polluting and altering the environment must be estimated. Economists, working withnatural resource scientists, apply valuation techniques to calculate these costs. This involves theintegration of the socioeconomics module with the three natural science modules of fish andfisheries, pollution and ecosystem health, and productivity. For examples of such integratedassessments, see Hennessey and Sutinen (2005: Chapters 9 – 12).
Valuation of Ecosystem Services and AssetsThe coastal and marine natural resources of an LME are capital assets – in effect, representingwealth embodied in its marine natural resources. Capital assets – natural or otherwise – can providevaluable services (“interest”) over time if maintained, much like savings in a bank provides a flow ofinterest income. Resource valuation involves the use of concepts and methods to estimate theeconomic value the public holds for ecosystem services and assets.4 These services may be director indirect; and they may or may not be bought and sold in the marketplace.
Direct services include on-site use of marine parks, beaches, exploitation of marine minerals, orharvesting of fish, shellfish, or wood from mangroves. Indirect services occur off site, for example,when fish “produced” by a mangrove stand are harvested many miles away. Some natural resourcesservices are exchanged in organized markets, such as commercial fisheries, oil and other minerals,coastal land and other property, or tourism. However, a central feature of many, if not most, marineresource issues is that the ecosystem services provided are not traded in markets. The servicesprovided, as for example, by mangroves, corals, and sea grasses, water quality, recreation, scenicamenities and biodiversity are not bought and sold in markets – and, as a result, often are giveninadequate attention in public policy.
Four types of value are associated with resource services: (1) use value is the benefit received fromon site or physical use, such as harvesting of fish, exploitation of oil or beach us; (2) passive usevalue is the enjoyment one gets from a resource above and beyond any direct use. Passive uselosses may arise if individuals feel worse off when they learn of the loss of an endangered species,closure of beaches, or other adverse impacts on other natural resources – even if they do not usethese resources themselves. People might be willing to pay to prevent such losses, much as theymight pay to reduce the malnutrition of children or respond to a natural disaster in a place that theywill never actually visit; and (3) total value is the sum of use and passive use value. Individuals also
4 A succinct explanation of these methods is provided by the National Research Council (1997: 21-24).
Sustainable Financing

66 LME Governance Handbook
may have an (4) option value when supply (e.g., threat of extinction; the outcome of a policy) ordemand is uncertain. Option value may be thought of as what you would pay to keep open theopportunity to later use a site or a resource.
Resource valuation, which estimates the value of particular resource services, can be used to informpolicy for improving resource management. Many advances have been made in natural resourcevaluation, and the opportunities and limitations of resource valuation are becoming increasingly wellunderstood. The World Bank’s manual, Estimating the Costs of Environmental Degradation,explains, in practical terms, the methods of resource valuation.5 Excellent examples of resourcevaluation studies can be found at several websites, including the IUCN’s Biodiversity Economics(www.biodiversityeconomics.org/library/index.html), the Conservation Finance Alliance(www.conservationfinance.org/Relevant_links/CF-Papers.htm), and the WWF(www.worldwildlife.org/conservationfinance/pubs.cfm), among others.6 The multitude of studies andapplications documented to date is evidence that data problems and other difficulties are beingovercome, and that resource valuation is a critical tool for managing ecosystem resources.
In addition, estimates of the value of lost or degraded ecosystem services and assets can be used tocalculate the ecological costs of market-driven activities. Once resource valuations have estimatedthe ecological costs of resource extraction, pollution, and reduced productivity are calculated, thecosts can be incorporated into the market prices. The ecological costs can be incorporated intomarket prices by applying taxes and user charges to those activities that harm the ecosystem. Inother words, the ecological cost estimates can be used to design financing mechanisms that correctmarket prices that would otherwise ignore ecological costs.
In addition to helping to correct failures of markets, sustainable financing mechanisms also have thepotential to improve government performance. If properly designed and implemented, user chargesand other mechanisms can mitigate shortsightedness, link benefits with costs, and reducegovernment inefficiencies in the provision of policies and programs. Ensuring that beneficiaries ofgovernment management efforts pay in proportion to the benefits they derive from the use ofecosystem resources and services – through the use of taxes, user charges and fees, for example –encourages cost-effective provision of government program products (see Anderson and Sutinen2003 for a detailed discussion of this issue).
FINANCE MECHANISMS: AN OVERVIEWThere are literally hundreds of mechanisms for sustainable financing of LME programs.7 However,there are four basic types of methods for financing government programs: taxes, user charges andborrowing (bonds and loans), and grants. Broad-based general taxes comprise the main source ofgovernment revenue. Designating general tax revenues for LME programs raises at least two
7 The Guidebook of Financial Tools produced by the U.S. Environmental Protection Agency (EPA 1999) coverssome 340 mechanisms that can be used to pay for sustainable environmental programs. (http://www.epa.gov/efinpage/guidebook/guidebooktp.htm )
5 Available online at http://siteresources.worldbank.org/INTEEI/214574-1110798478534/20781069/EnvironmentalDegradationManual.pdf. Another excellent reference is NRC (2004).6 Other references related specifically to economic valuation of marine resources are included on theIW:LEARN Web page for the Workshop on the Sustainability of Large Marine Ecosystems, a companionresource to this Handbook (http://www.iwlearn.net/abt_iwlearn/pns/learning/b2-2lme/riworkshop).
67
significant concerns. First, general tax revenues are the primary source of funding for defense,transportation, education, and social services programs. Earmarking general taxation funds for LMEprograms places the financial security of those programs in competition with the other programsupon which the governments commonly place higher priority. In addition, earmarking these fundsconstrains policy makers’ ability to redirect these funds where they may be most needed at certainpoints in time.
The second concern with using general tax revenue is that there is no relationship between theamount of taxes paid by individual taxpayers and the amount of goods and services they have usedor benefits received. Broad-based taxes (such as income, property, sales taxation) are appropriatemeans of financing public goods. Public goods, such as national security or elementary andsecondary education, are financed with broad-based taxation because the benefits are widespreadand excluding nonpayers from access to its benefits would be nearly impossible.
Since many government-provided goods and services are not pure public goods, and perhapsbecause of a widespread sentiment to reduce the taxpayers’ burden, there is movement away frombroad-based taxation towards user charges (also known as fees and selective taxes). A salientadvantage of user charges is that this form of generating revenue is capable of balancing whatpeople pay with the benefits they receive. From an economic perspective, user charges allocatescarce resources and distribute costs. When the correlation between benefit and charge is strong,user charges become prices, which helps to mitigate the harm that markets do to ecosystems.
User charges are fees individuals pay to government that are based on the benefits received or theamount used of the good or service provided by the government. At least four types of user chargescan be distinguished:
• User fees
• Regulatory fees
• Beneficiary-based taxes
• Liability-based taxes
User fees include royalties on the use of natural resources, bridge and highway tolls, lease and rentalpayments, and charges for recurring sales of resources (e.g., timber, minerals, water). Regulatoryfees include charges for inspecting and testing services, patent and copyright fees, permit and licensefees associated with regulatory programs, judicial services, passport and customs services. Otherexamples include fees that households and businesses pay for the costs of providing water andwaste water services, electricity, etc. Some specific examples include fees for access andconnection to public utilities (e.g., sewage lines), construction of environmental facilities (e.g.,underground storage tanks), operating franchises/businesses on public property, monitoring andinspection services, recreational uses (e.g., moorings), permitting services, product registration, solidwaste disposal, and water withdrawal.
Examples of special charges include effluent and emission charges, impact fees, severance tax (acharge for the extraction of a natural resource on public lands, such as timber, water, fish, coal, oiland gas, minerals), and for hazardous waste disposal.
Sustainable Financing

68 LME Governance Handbook
Beneficiary-based taxes (sometimes referred to as earmarked taxes) are correlated with, but nottied to, the use of a government-provided good or service. For example, taxes on gasoline in theU.S. are dedicated to a highway trust fund for financing highway construction and othertransportation projects. Liability-based taxes are charges for the purpose of abating hazards (e.g.,oil spills) or compensating for environmental and other damages imposed on third parties (CBO,1993). Other examples include selective taxes on sales of energy, petroleum products, agriculturalchemicals (fertilizer, pesticides), motor fuels, vehicles, rental cars, marine fuels, watercraft, hotels,real estate transfers, hard-to-dispose items.
Table 5. Financing Mechanisms (Spergel and Moye 2004)
1. Tourism revenues
a) Protected area entry fees
b) Recreation fees, e.g., diving, angling, &
yacht/mooring fees
c) Airport passenger & cruise ship fees, taxes &
fines
d) Hotel taxes
e) Tourism-related operations of conservation
agencies
f) Voluntary contributions by tourism industry
groups
2. Energy & Mining revenues
a) Oil spill fines & funds
b) Taxes, royalties & fees from offshore mining &
oil & gas
c) Right-of-way fees for pipelines &
telecommunications infrastructure
d) Hydroelectric power revenues
e) Voluntary contributions by energy companies
3. Fishing industry revenues
a) Tradable quotas
b) Catch & service levies
c) Eco-labeling & product certification
d) Fishing access payments
e) Recreational fishing license fees & excise taxes
f) Fines for illegal fishing
4. Real estate & development rights
a) Purchases & donations of land &/or
underwater property
b) Conservation easements
c) Real estate tax surcharges for conservation
d) Tradable Development rights & wetland
banking
e) Conservation concessions
5. For-profit investments
a) Private sector investments promoting
conservation
b) Biodiversity prospecting
6. Grants and donations
a) Donors
b) Foundations
c) Nongovernmental organizations
d) Private sector
e) Conservation trust funds
7. Government revenue allocations
a) Direct allocations from government budgets
b) Earmarked government bonds & taxes
c) Lottery revenues
d) Wildlife stamps & tags
e) Economic instruments to stimulate
environmental investment
f) Debt relief

69
EXAMPLES OF SUSTAINABLE FINANCING FOR MARINE
GOVERNANCE INITIATIVESAn excellent discussion of some of the more common financing mechanisms can be found in Spergeland Moye (2004).8 Table 5 lists many of the funding methods that they present. We present here afew examples how these mechanisms are and could be used for the implementation of an LMESAP.
TourismAs Spergel and Moye observe, marine-based tourism activities – cruises, scuba diving, sailing,whale-watching, and beach-side resorts – generate billions of dollars of revenue each year. Thenational economies of some countries, such as those in the Caribbean and the Maldives, dependheavily on marine tourism; and this tourism activity depends heavily on the health of reefs and marinelife, and on the quality of the water and beaches of marine ecosystems. In most cases, the industry isfreely benefiting from the use of those marine ecosystem goods and services, but this situation isbeginning to change as shown by the following examples.
User Fees: Scuba Diving in Mabini, Batangas, Philippines: 9 The Center for ConservationFinance and WWF-Philippines helped to establish a dive fee system in Mabini, Batangas, thePhilippines, a popular site for scuba diving. The fee revenue collected is directly allocated to coastalresource management activities. Management focuses on combating the pollution and unregulatedexploitation that threaten the municipal waters. There are three types of fees: a Diver’s Daily Pass(P50), an Annual Diver’s Pass (P1,000), and an Annual Dive Professional Pass (P700). Divers mayeither pay for the pass on their hotel bill, or when they register at the municipal tourism office. Diverswith no pass are subject to fines and confiscation of gear, redeemable only after paying the fine.Boatmen who ferry divers without passes also may be fined. A Coastal Resource ManagementBoard ensures that fees collected are applied to funding conservation, protection, and managementof Mabini municipal waters. The Board comprises representatives from the local government,NGOs, and recreational diving associations, thus engaging the various stakeholders of the region.Activities supported through the Board include implementation of marine sanctuary policies, wastemanagement programs, and enforcement patrol.
Trust Fund: Mesoamerican Reef: 10 Conservation trust funds in Belize, Guatemala, Honduras,and Mexico are being used to protect the Mesoamerican Reef. The World Bank, the GlobalEnvironment Facility, the WWF, the IUCN, worked with the governments of Mexico, Belize,Guatemala, and Honduras to establish conservation priorities at both a regional and national level.One outcome has been that the four countries bordering the Mesoamerican Reef now realize thatthe tourism and fisheries –two major sectors of their national economies – depend directly on thehealth of the reef’s ecosystem. As one of the first conservation trust funds to be implemented on anecoregional, trans-national scale, it provides a model for similar transboundary and ecoregionalprojects elsewhere.
9 Source: http://worldwildlife.org/conservationfinance/projects/scuba.cfm10 Source: http://worldwildlife.org/conservationfinance/projects/mesoamerican.cfm
Sustainable Financing
8Several other good sources of sustainable financing methods are listed and described at the end of this part ofthe Handbook.

70 LME Governance Handbook
Energy and MiningThe marine mining and energy sectors also produce significant revenues each year. Offshore andcoastal production of oil and gas is found in many of the world’s LMEs, including the Gulf ofGuinea, Benguela Current, South China Sea, Timor Sea, Gulf of Mexico, Caribbean, and the NorthSea. According to Snyder (2005), oil industry experts predict that offshore oil and gas productionwill grow from providing around 34 percent of global oil production and 28 percent of global gasproduction in 2004, to 39 percent and 34 percent, respectively, by 2015. The oil industry currentlyis spending in excess of US$100 billion/year to explore, develop and operate offshore oil and gasfields. The industry pays royalties on their offshore production, and in most areas producers aresubject to regulations to control their impacts on the marine ecosystem. The following examplesdescribe a few cases of how finance mechanisms are being applied in this sector.
Gamba Complex Biodiversity Project, Gabon: In 2000, the Shell Foundation, in partnershipwith the Smithsonian Institution, WWF, and the Wildlife Conservation Society, funded efforts tomonitor and mitigate impacts on biodiversity of petroleum exploration and production in the GambaComplex (Spergel and Moye 2004).
Oil Spill Revolving Fund in the Straits of Malacca: A group of Japanese marine insurancecompanies established a revolving fund for emergency response and cleanup of oil spills in the Straitsof Malacca. The fund pays for emergency actions to control and remove spilled oil; and companiesresponsible for the spills reimburse the fund for the expenses incurred (Spergel and Moye, 2004).
Emergency Response Fund in the Galápagos: The fund, established by the Government of Belgiumand managed by a local committee, covers the cost of responding to oil spills and other environmentalemergencies (Spergel and Moye, 2004).
Polluter Liability for Damages Oil Spills: Liability is a clear application of the Polluter PaysPrinciple and holds responsible parties financially accountable for the damages they cause.Generally, liability for damages provides an incentive to reduce pollution, compensate losers andalso provides the means to restore injured ecosystems. Several states in the United States, includingAlaska, Florida, and Washington State, make claims against oil polluters using general damage orpenalty-based compensation formulae for oil spills (e.g., Plante, et al., 1993; Grigalunas andJohnston, 1999; Grigalunas, et al., 1999; Brans, 2001). Generally, the size of damages using theseapproaches depends upon the amount spilled, the quantity recovered, the characteristics of the oil,and the sensitivity of the environment contaminated by the spilled oil. Hence, the formula tries toapproximate a damage function.
At the federal level in the U.S., a simplified damage assessment procedure has been developed andput into regulations to assess polluters (“responsible parties”) for damages. Economic damages areassessed based on lost use value from reduced recreational and commercial catch, losses to publicbeach users when oil comes ashore and reduces beach uses, and viewing value losses to birdwatchers. These losses are assessed over time until the injured resources are estimated to recoverto their without-spill level. Discounting is used to convert all annual future dollar flows of losses intoa lump-sum equivalent loss today. Responsible parties are required to restore natural resourcesharmed by the spill. They must also pay for response and cleanup, assessment costs, lost profits,and costs incurred by governments in assisting the public in the assessment process.
71
Fishery ManagementGeneral taxation pays for most fishery management programs, but this approach began to change inthe 1980s and 1990s when a few countries introduced major changes in the way fisherymanagement services are financed and provided (Anderson and Sutinen, 2003). Australia, Canadaand New Zealand implemented user charges to recover the costs and devolved or arranged foralternative suppliers to bid on providing some fishery management services.
Australia: Beginning in the mid-1980s, Australia applied the principles of cost-recovery to a widerange of administrative and program delivery areas. The cost-recovery policy is based on the “userpays” principle, in which users of Commonwealth services pay for services in proportion to thebenefits they receive. As required by statute, the fishing industry pays 100 percent of recoverablecosts of running the Australian Fisheries Management Authority (AFMA), including the costs ofManagement Advisory Committees and Consultative Committees, licensing, AFMA’s day-to-dayfisheries management activities, the cost of maintenance of management plans, logbooks andsurveillance.
Canada: In the mid-1990s, Canada began collecting user fees from holders of licenses in theAtlantic and Pacific commercial fisheries. Canada also applies the “user pays” principle where thosewho benefit from a public resource pay an amount that reflects the value of fishing. The fees recovera portion of the costs of monitoring, at-sea observers, basic fisheries science, enforcement and otherfisheries management services. The user charges are paid to the service provider – either thegovernment or private contractors.
New Zealand: In 1995, New Zealand changed from collecting fishery resource rentals to cost-recovery. The government first recovered the costs of fishery management on the basis of the“avoidable cost” principle, which involves recovering the government’s costs that otherwise wouldhave been avoided if the fisheries were not used for commercial purposes. After discovering firsthand that the avoidable cost approach led to numerous problems, New Zealand changed, in 1999,the basis for recovering costs from an avoidable cost approach to an efficiency-based approach.Under the efficiency-based approach, those who benefit from a service pay for the cost of suchservice.
Namibia: The government of Namibia levies a tax on commercial landings, and the revenuecollected is placed into a Fisheries Management and Research Fund, which is used to support stockassessments and enforcement of no-take marine protected areas (Spergel and Moye, 2004).
United States: The 1996 amendments to the Magnuson-Stevens Fishery Conservation andManagement Act authorizes collecting user fees on fisheries that are managed under individualfishing quotas and community development quotas. Currently, some costs of management are beingrecovered from the Alaska halibut and sablefish fishery.
Real Estate Tax SurchargesThe value of coastal property generally tends to be high, especially along coastlines that are favoredfor residential, tourist, and industrial uses. In recognition of this and the fact that property ownersbenefit from a healthy marine ecosystem, governments have applied surcharges to real estate taxesas a way of generating funds for marine conservation and management.
Sustainable Financing

72 LME Governance Handbook
San Juan County Land Bank Tax: All buyers of real estate in San Juan County in the state ofWashington (U.S.) pay an additional 1 percent real estate transfer tax. The County uses the revenuecollected with the tax to purchase conservation easements and land, such as beaches and shoreline,to protect it from being developed and to preserve wildlife habitat (Spergel and Moye, 2004).
Earmarked Bonds and TaxesGreen Fund Levy: In Trinidad and Tobago, where tourism and fisheries are key components of theeconomy, a Green Fund Levy provides funds for the governmental Environmental ManagementAgency, NGOs and communities to carry out environmental projects. The levy imposes a tax ongross sales of businesses, which generates about US$10 million per year, specifically to mitigateenvironmental impacts of pollution and inappropriate development (Spergel and Moye, 2004).
For-profit InvestmentsAsian Conservation Company:11 The AsianConservation Company (ACC), which linksprivate sector investment and biodiversityconservation, was developed through anNGO-private sector partnership. Thisinnovative private sector model involves aprivate equity holding company to leveragelong-term financial support for biodiversityconservation from portfolio companies. TheACC is assembling a portfolio of private
investments for the purpose of conserving biodiversity and being profitable. ACC invests
in companies that operate in high priority biodiversity areas and work to reduce adverseenvironmental impacts. Incorporated in January 2001 with an initial capitalization of $12.5 million,the ACC has invested in a environmentally-responsible nature tourism operation and a sustainablymanaged blue crab production facility. By proving that private investment in ecologically soundcompanies is both beneficial to the environment and profitable in the marketplace, ACC is anexample of novel conservation finance that can be replicated in other priority conservation areas ofthe world. ACC’s Web site (http://www.asianconserve.com/) provides further information about thecompany’s activities and investments.
Potential ApplicationsEnvironmental Charges for Marine Mining: Environmental charges also might be important forsustainable financing for marine environmental protection and restoration from injury to ecosystemsbecause of marine mining. Ocean mining for hard minerals – sand, gems, and metals – occursthroughout much of the world. For example, a significant (about 28 percent) and growing share ofthe sand used in construction in Korea comes from ocean mining (Ministry of Construction and
Seaweed farming has become an attractive investmentopportunity in many countries
11 Source: http://worldwildlife.org/conservationfinance/projects/acc.cfm.

73
Transportation, 2002). Placer minerals (garnet and ilmenite) in the Gulf of Mannar, India(Sambandam, 2003), and Namibia’s coastal waters are mined for diamonds.
Mining, often using hydraulic dredges, is by its nature environmentally obtrusive. Borrow pitscreated by marine mining can take many months to recover, during which time the pre-miningbottom productivity is lost. Further, sediment plumes can cause mortality for sensitive eggs andlarvae. A tax or fee on extraction might be levied to reflect damage to fisheries. (Indeed, such a feeis levied on onshore sand mining in Korea to restore the environment). The proceeds then could beused to restore or maintain fishery resources harmed by marine mining and/or to compensate forstudies of the effects of mining on the environment or policies which might be implemented to reducelosses.
A tax per unit mined would internalize costs for mining operators which, in turn, may influenceoperator behavior by creating incentives for mining in less vulnerable areas, limiting miningtemporally to avoid sensitive period (similar to the use of environmental windows), or adoption ofnew practices. A successful system might also collect sufficient funds to help maintain or restoreinjured fishery stocks and support needed research.
A main issue is quantifying the economic losses to commercial fisheries from mining. To fill this gap,Grigalunas et al, (2004) used a bioeconomic model to provide preliminary estimates of short-term,long-term and indirect (ecosystem) damages to vulnerable benthic and demersal commercialfisheries from marine sand mining in the Ongjin area. This area is off the west coast of Korea, nearIncheon. Damages are assessed over time until the harmed species recover to their pre-miningequilibrium. Depending upon the maximum life, for some species the time to recovery can be manyyears. In the case of crab, which has a short life span, recovery occurs over a brief period, once thebottom habitat is restored to its pre-mining productivity. Other assumptions are given in Grigalunas,et al. (2004). Damages were estimated to amount to US$18,618 (preliminary) for one year ofhypothetical mining on a single site. If a charge was to be imposed on mining operators, the methodsoutlined above might be used to set the charge on miners. Ongoing research will refine (and likelyincrease) these estimates by including excess mortality to larvae from sediment plume and employinga more realistic, longer period for bottom habitat recovery.
Cost Sharing for Navigational Safety Aids in Malacca Straits: This example concerns howone might allocate among user states the cost of navigational aids to improve vessel safety in theMalacca Straits.12 By way of background, the Malacca Straits are the second-busiest internationalstraits in the world and are intensively used for transporting oil, bulk commodities, and containerizedgoods. Dangerous operating conditions exist in much of the Straits because of narrow waters atsome points, sedimentation of channels, shipwrecks, and heavy traffic through and across the straits.
The littoral states of Malaysia, Indonesia, and Singapore have funded most of the navigational aids,but efforts have been made over the years to have the users of the Straits (Japan, China, Korea,Taiwan China, the U.S., etc.) contribute to the cost of providing navigational measures (e.g. Hamza,1997). However, international law prevents littoral states from restricting passage or charging a userfee, except during time of war. Hence, funding from international sources for navigational aids wouldhave to be voluntary or come through international bodies.
Sustainable Financing
12 For a brief description of the WB-GEF Malacca Straits Marine Electronic Highway (MEH) Project; seehttp://gefonline.org/projectDetails.cfm?projID=1270.

74 LME Governance Handbook
Grigalunas (2000) estimated how the costs of navigation aids would be allocated under alternative“rules of the game” for ships using the Malacca Straits. These rules of the game are meant to reflect(albeit imprecisely) the beneficiaries. All of the alternatives would rely on asking (moral suasion) usercountries to pay a “fair share” based on their use, i.e., the “beneficiary pays” principle is employed.
Five rules-of-the-game were considered:
1. Share of costs based on transits. Using this rule, cost share would be concentrated onPanama (20.8 percent), Singapore (10.3 percent), Liberia (9.0 percent) and Malaysia (8.0percent). Thus, the top five users pay 52.7 percent of costs.
2. Share of costs based on shipowner nationality. Under this rule, the top five users wouldpay 57.5 percent of costs. The top five under this rule consist of: Japan (16.9 percent) ,Singapore (18.5 percent), Greece (8.5 percent), Malaysia (7.1 percent), and China (6.5percent).
3. Share of cost based on tanker transits. For this rule, costs would be distributed: Japan(63.7 percent), Korea (18.5 percent), Singapore (11.1 percent), China (3.1 percent), andAustralia (2.4 percent).
4. Share based on gas transits. Japan (74.2 percent), Korea (19.6 percent), China (4.8percent), Spain (0.8 percent), and Australia (0.4 percent).
5. Share of costs based on combination of tanker and gas transits. One can argue thattankers and gas tankers pose the greatest threat to the environment. Tankers use theMalacca Straits more than twice as frequently as gas tankers. A cost sharing mechanismbased on tankers and gas transits would be paid largely by Japan (63.7 percent), followedby Korea (18.5 percent) and then Singapore (11.1 percent).
The examples described here are but a small sample of the growing list of sustainable financingarrangements currently in use. These cases demonstrate that sustainable financing is feasible and thatthere is almost no limit to ways in which marine conservation and management projects can befunded sustainably.
CRITERIA FOR SELECTING AMONG FINANCING OPTIONSFinancing provides the means to carry out governance activities, and also has the potential to tamemarkets and improve governments’ delivery of policies and programs. We have also seen that thereare numerous examples of sustainable financing mechanisms that are operational in the field. Tamingmarkets, improving government performance, and practicability are important considerations whendesigning sustainable financing plans for LME projects. In addition, there are other criteria that arerelevant for weighing the potential success of financing approaches. For instance, excessivetransaction costs to study, implement, and enforce compliance with a resource governance programwill cause the program to fail. Hence, designing financing methods requires anticipation oftransaction costs and tailoring methods to the seriousness of the issues faced.
In sum, criteria that can be important in assessing financing options include:• Efficient resource use• Cost effectiveness

75
• Transaction costs• Political feasibility• Fairness
Financing will be easier to justify if the benefits (broadly construed) of proposed governanceactivities clearly exceed their costs (‘economic efficiency’). The public would be ill served – and fewprograms are sustainable – if costs systematically outweigh benefits. Nor would the public interestbe served by blatantly excessive costs imposed on operators, driving them out of business. Similarly,failure to use a cost-effectiveness standard, for example, for restoration of coastal wetlands or totreat water pollution, would mean costs that are higher than necessary. This reduces what could beaccomplished with a given budget. Perceptions of wasteful use of resources will also erode publicsupport for governance.
High transactions costs undermine the potential for success, and thus curtail or eliminate potentialgains from governance. For example, simplified approaches for assessing damages from oil spills orother marine pollution provides a quick and inexpensive way to assess damages for small incidents.Generally, making programs too costly or too inconvenient is a formula for failure.
Fees and charges provide environmentally friendly incentives and can be used to raise funds forgovernance programs. At the same time, imposing fees and penalties is rarely popular, thoseindividuals/users subject to regulations may not comply, and proposed actions for financing whichlack broad public support will not be implemented or successful. Hence, political feasibility also is amajor concern when weighing financing options.
Fairness encourages support for financing and compliance with programs. As explained in Part III ofthis Handbook, compliance is encouraged when affected parties feel they have a say in newprograms, and the costs of programs are distributed in a way considered to be equitable by thosemost affected by the policy.
The above criteria are not independent. An onerous user fee system, or a program which is toocomplicated, likely will not be politically feasible to implement or maintain. Similarly, a system oftransferable quotas for fisheries management or for nutrient pollution control could captureconsiderable economic rents for public LME uses through the auctioning of quotas or permits.However, a transferable quota or permit system might not be politically feasible, unless at least someof the permits are given to those currently in the industry (‘grandfathering’), with the balance ofpermits auctioned and awarded to the highest bidders. We make note of these criteria below, whendiscussing financing options.
THE WAY FORWARD FOR SUSTAINABLE FINANCING OF LMESThere is an urgent need to plan for the sustainable financing of LME projects. The current practiceof financing projects – with GEF funds and appropriations of general tax revenues by coastalgovernments – cannot be relied upon to support the growing demand of applying the ecosystemapproach to managing transboundary resources in LMEs. Implementing sustainable financingarrangements faces several challenges, not the least of which is to secure agreement among coastalstates on how to finance the costly monitoring, assessment, enforcement, and administration of thetransboundary LME management programs. Development of long-term financial plans needs to
Sustainable Financing

76 LME Governance Handbook
begin as soon as possible. Fortunately, there is a growing body of experience with sustainablefinancing arrangements to draw from for this planning exercise. Unfortunately, there are few reportsof experiences on financing arrangement for transboundary resource management programs.
To set the stage for this planning, there is a need to document the amounts and types of expenditureson LME-related management programs. In conjunction with expenditures data, there also is a needto document (1) the amount of public revenues (taxes, fees, etc.) currently provided by theeconomic activities in LMEs – the beneficiaries of management programs; (2) how these revenuesare collected, and how they are used; and (3) the extent to which the fiscal policies of taxes andsubsidies are supporting the sustainable development of marine ecosystem resources.
With this evidence in hand, the LME community can begin to examine and consider – perhaps in thecontext of an international forum – the most appropriate sustainable financing methods andapproaches for transboundary resource management programs (current and prospective) that arethe peculiar feature of LMEs. Clearly, there is much work to be done if we are to secure thepotential that the sustainable development of LMEs offers to future generations.
READINGS AND SOURCES OF INFORMATION ON
SUSTAINABLE FINANCINGThe following set of documents and websites provide excellent information on financial planning, thedetails of financing mechanisms, and examples and case studies of sustainable financing arrangements.
Conservation Finance Alliance (CFA). 2006. Conservation Finance Guide. An online version of theGuide can be found at guide.conservationfinance.org/.
The Guide presents a host of potential financing opportunities for nature conservationin general, with a special focus on protected area management. Chapters are written to help users(i) understand; (ii) select; (iii) assess; and (iv) implement the most appropriate finance mechanismsfor their particular situation. The Guide is designed to allow non-experts to get started and maketangible progress on conservation finance initiatives, as well as provide resources and ideas forthose with more experience. Potential audience members include: government officials; protectedarea managers; conservation NGOs; technical consultants; and donor agencies.
Emerton, L., Bishop, J. and Thomas, L. (2006). Sustainable Financing of Protected Areas: Aglobal review of challenges and options. IUCN, Gland, Switzerland and Cambridge, UK. x +97pp. Available at www.biodiversityeconomics.org/applications/library_documents/lib_document.rm?document_id=781.
IUCN’s World Commission on Protected Areas (WCPA) prepared Guidelines onFinancing Protected Areas in 2000. At that time there was an expectation that by the time ofIUCN’s World Parks Congress, or shortly thereafter, a new edition might be available. This documentis a greatly expanded and quite different study that reflects the increasing sophistication with whichfinancial and funding issues for protected areas are now considered. The changing global andfinancial environments faced by protected area agencies and managers include the unpalatablereality that competition for government funds has led to greater funding shortfalls for protectedarea management. This Guideline sets out the background to financing protected areas and identifiesa series of approaches towards PA financial sustainability. The Guideline includes many examples

77
and case studies that give protected area managers some familiar stories of funding challenges aswell as some excellent indications of the way forward.
Environmental Protection Agency (EPA). 1999. A Guidebook of Financial Tools: Paying forSustainable Environmental Systems. Environmental Finance Program. Available at www.epa.gov/efinpage/guidebook/guidebooktp.htm.
The Guidebook provides an overview of approximately 340 financial tools that areuseful in paying for sustainable environmental systems. The financing tools include traditional meansof raising revenue, borrowing capital, enhancing credit, creating public-private partnerships, andways of providing technical assistance; and financing tools that are, will, or might soon be, availableto address significant environmental priorities, including ways of lowering the costs of compliance,encouraging pollution prevention, paying for community-based environmental protection, financingbrownfields redevelopment, and improving access to capital for small businesses and theenvironmental goods and services industry. Each tool is described along with its actual and potentialuses, advantages and limitations, and references for further information.
Le Quesne, T. and R. McNally. 2005. The Green Buck: using economic tools to deliver conservationgoals, a WWF Field Guide. WWF-UK. 66 pp. Available at www.biodiversityeconomics.org.
This field guide aims to introduce economic approaches to conservation to non-specialists. using case studies from the WWF network, it illustrates how economic mechanismshave been &/or are being used to (1) finance conservation, (2) create markets that supportconservation, and (3) influence government policies and plans. Ways in which economics can beused to influence policies and plans include (a) cost-benefit analysis, (b) environmental assessment,(c) valuation for advocacy, and (d) reforming taxation, charges & subsidies. The guide contains afew marine-related programs, e.g., scuba divers fund in the Philippines, communal area conservanciesin Namibia, turtle egg protection in the Philippines, tourism development in Fiji, marine resourcevaluation in Samoa, coral reef degradation globally, and ecological criteria for sharing tax revenuesin Brazil.
Spergel, B. and M. Moye. 2004. Financing Marine Conservation: A Menu of Options. Center forConservation Finance, WWF. Available at www.worldwildlife.org/conservationfinance.
This guide describes over 30 mechanisms for financing marine conservation, boththrough raising revenues and providing economic incentives. Included with the descriptions arereal examples of how these mechanisms have been implemented around the world. It is intendedas a practical guide to familiarize conservation professionals with a menu of options to creativelyand sustainably finance marine and coastal conservation.
WCPA. 2000. Financing Protected Areas: Guidelines for Protected Area Managers. FinancingProtected Areas Task Force of the World Commission on Protected Areas of IUCN, in collaborationwith the Economics Unit of IUCN, Gland, Switzerland and Cambridge, UK. viii + 58 pp. Availableat www.iucn.org/themes/economics/.
This document reviews and assesses the status of various protected area (PA) financemechanisms, the major obstacles and opportunities for their implementation, and the potential forimprovement. Part I of the report presents the background and a conceptual framework fordiscussing PA financing. Part II defines and describes different mechanisms for financing PAs, and
Sustainable Financing

78 LME Governance Handbook
reviews their strengths and weaknesses in light of real-world experiences. Part III identifies keyconclusions and makes several recommendations for improving the sustainability, efficiency andeffectiveness of PA financing.
Internet sources of information on sustainable financing:
• conservationfinance.org/
• ecosystemmarketplace.com/
• worldwildlife.org/conservationfinance/pubs.cfm
• www.biodiversityeconomics.org/index.html
• www.ifc.org/ifcext/enviro.nsf/Content/SFMF-What
• www.iucn.org/themes/economics/

79
PART V
FUTURE DIRECTIONS
LMEs are being analyzed in the context of five modules: productivity, fish resources and fisheries,pollution and ecosystem health, socioeconomics, and governance. The first three modules, whichhave received extensive attention, provide a description and assessment of the operation of naturalsystems that yield many needed and desired goods and services. The socioeconomic andgovernance modules, which are the subject of this Handbook, are now receiving increasingconsideration. They encompass the human dimension of LMEs, examining the societalconsequences of observed changes in the natural environment and contemplating the mechanismsand measures that can serve to protect the sustainability of natural systems on which we all depend.As LME management efforts have matured, the socioeconomic and governance modules havecome to be recognized as central to the ecosystem-based approach to marine resource andenvironmental management.
Addressing the governance and socioeconomic requirements for effective management of largemarine ecosystems is not an easy task. However, it is absolutely essential to sustaining marineecosystem benefits to humanity. Insights and information derived from analyses of these modulesare at the core of success in encouraging behavioral modifications at both the individual andcollective scale that are required to achieve natural system sustainability. This Handbook hasconsidered the potential roles of the three key governance mechanisms: the marketplace,government, and civil society, which together can contribute to better environmental outcomes andclose the gap between what is currently being done and what needs to be done. The challengingpath ahead is to instigate processes of societal change that are informed by scientific expertise,inspire public involvement and support, are sensitive to the unique societal context of each LME andare flexible and adaptive to emerging circumstances in their execution. Context is critical too. Thegoal of environmental sustainability remains constant, but the means of achieving that goal will varyfrom place to place.
There are many obstacles to achieving the necessary changes in existing governance systems.Moving toward ecosystem-based management requires substantial will, inspired leadership,sustained effort, technical capacity, and cooperation among people and states sharing large marineecosystems. It also requires sustained financial support. This Handbook has sought to explain whyecosystem-based management must succeed, why the analysis of governance issues is of centralimportance, and to suggest how governance efforts may be designed to contribute to desiredoutcomes. The precise nature of governance systems and the actions taken must always be createdand shaped by those who benefit from, and those with responsibility for maintaining or restoring, thequalities of each LME.
Future Directions

80 LME Governance Handbook
REFERENCESAcheson, J. M. (ed.) 1994. Anthropology and institutional economics. Lanham, Maryland:
University Press of America.
Akers, R. L. 1985. Deviant Behavior: A Social Learning Approach, Third Edition. Wadsworth,Belmont, Calif.
Alchian, A.A. 1977. Economic forces at work. Liberty Press, Indianapolis, Indiana.
Alexander, L. (1993). “Large Marine Ecosystems: A new focus for marine resources management.”Marine Policy 17: 186-198.
Andersen, P, and J. G. Sutinen. 2003. Financing Fishery Management: Principles and EconomicImplications, in W. Shrank, R. Arnason, R. Hannesson (eds.), The Cost of FisheriesManagement: pp 45-63. Hants, England: Ashgate Publishing.
Andersen, P., J. Sutinen and K. Cochran. 1998. Paying for Fishery Management: EconomicImplications of Alternative Methods for Financing Management. Pp. 439-454, In Proceeding ofthe IXth Conference of the International Institute of Fishery Economics and Trade.Tromso, Norway.
Anderson, L.G. and Lee, D.R. 1986. “Optimal Governing Instruments, Operation Level, andEnforcement in Natural Resource Regulation: The Case of the Fishery”. Amer. J. AgriculturalEcon. 68(3):678-690.
Arnason, R. 2000. Economic Instruments to Achieve Ecosystem Objectives in FisheriesManagement, ICES Journal of Marine Science 57(3): 742-51.
Aronfreed, J. 1968. Conduct and Conscience. Academic Press, New York.
Ayres, R.U. and A.V. Kneese. 1969. Production, consumption and externalities. AmericanEconomic Review, Vol. 59: 282-297.
Baden, J. And R. Stroup. 1981. Saving the wilderness: a radical proposal. Reason 13:29-36.
Bavinck, M. et al. Interactive Fisheries Governance: A Guide to Better Practice. (Amsterdam:Centre for Maritime Research, 2005)
Bean, C. 1990. An Economic Analysis of Compliance and Enforcement in the Quahaug Fishery ofNarragansett Bay. Unpublished Masters Thesis, University of Rhode Island.
Becker, Gary. 1968. ‘Crime and Punishment: An Economic Approach,’ J. Political Economy76(2): 169-217.
Benguela Current Large Marine Ecosystem Programme: Transboundary Diagnostic Analysis 2002.Windhoek, Namibia.
Braden, John and Charles Kolstat. 1991. Measuring the Demand for Outdoor Recreation. NewYork: North Holland publishing Co.
Bradley, Paul. 1974. ‘Marine Oil Spills: A Problem in Environmental Management’. NaturalResource Journal 14(July): 337-359.

81
Brainerd, T., P. Clay, D. Hakserver, M. Hall-Arber, C. Kellogg, A. Kitts, and D. McCarron. 1996.Report to the ASMFC committee on economics and social sciences; Commercial sectorreference document on identification and prioritization of economic and sociocultural dataelements. ASMFC, Washington DC, 41 pages.
Brans, Edward H.P. 1994. ‘Liability for Ecological Damage Under the 1992 Protocols to the CivilLiability Convention and the Fund convention, and the oil pollution Act of 1990, Part II’, TMA‘94-3, pp. 85-91.
Brans, Edward H.P. 1995. ‘The Braer and the Admissibility of Claims for pollution Damage Underthe 1992 protocols to the civil Liability Convention and the Fund Convention. EnvironmentalLiability (3)4: 61-69.
Brans, Edward H.P.. 1994. ‘Liability for Ecological Damage Under the 1992 Protocols to the CivilLiability Convention and the Fund convention, and the oil pollution Act of 1990, Part I’, TMA‘94-3, pp. 61-84.
Brown, L. 2001. Eco-Economy: Building an Economy for the Earth. Earth Policy Institute(http://www.earth-policy.org/Books/Eco/index.htm).
Buchanan, J. and G. Tullock. 1962. The Calculus of Consent. Ann Arbor: University of MichiganPress, 1972.
Buchanan, J.M. 1980. Rent-seeking under external diseconomies. In Toward a Theory of theRent-Seeking Society, J.M. Buchanan, R.D. Tollinson, and G. Tullock (eds.). College Station:Texas A&M Press.
Caddy, J.F. and G.D. Sharp. 1986. An ecological framework for marine fishery investigations. FAOFish. Tech. Pap., (283):152 p.
Calow, P. and V. Forbes, Initial Risk Assessment Manila, The Philippines: UNDP IMO RegionalProgramme for the Prevention and Management of Marine Pollution in East Asian Seas.
Caton, A and McLoughlin, K (eds.). 2000. Fishery Status Reports 1999: Resource Assessments ofAustralian Commonwealth Fisheries. Bureau of Rural Sciences, Canberra, Australia.
Cheung, S.N.S. 1970. The structure of a contract and the theory of a non-exclusive resource.Journal of Law and Economics 13: 49-70.
Christensen, N., A. M. Bartuska, et al. (1996). “The Report of the Ecological Society of AmericaCommittee on the Scientific Basis for Ecosystem Management.” Ecological Applications 6:665-691
Christensen, Norman et al. 1996. ‘The Report of the Ecological Society of America Committee onthe Scientific Basis for Ecosystem Management,’ Ecological Applications, 6: 665-691.
Clark, John R. 1996. Coastal Zone Management Handbook. Boca Raton: Lewis Publishers.
Coase, R. 1960. The problem of social cost. Journal of Law and Economics 3:1-44.
Coastal Zone Management Act, Public Law 92-583.
References
82 LME Governance Handbook
Commission on Marine Science Engineering and Resources (Stratton Commission) (1969). OurNation and the Sea: A Plan for National Action. Washington, D.C., Government PrintingOffice.
Committee on the Scientific Basis for Ecosystem Management. 1996. Ecological Applications 6:665-691.
Cordell, John. 1984. Defending Customary Inshore Sea Rights. Senri Ethnological Studies 17:301-326.
Costanza, R. and 12 others. 1997. The value of the world’s ecosystem services and natural capital.Nature 387:253-260.
Costanza, R. And C. Folke. 1996. The structure and function of ecological systems in relation toproperty rights regimes. Pages 13-34 in S. Hanna, C. Folke and K-G. Maler (eds.), Rights tonature: ecological, economic, cultural, and political principles of institutions for theenvironment. Island Press, Washington, D.C..
Costanza, Robert, et al., (eds.). 1992. Ecosystem Health: New Goals for EnvironmentalManagement (Washington, D.C.: Island Press.
Couper, Alistair. 1983. The Times Atlas of the Oceans. New York: Van Nostrand ReinholdCompany.
Crawford, Jeffrey S. 1984. An Economic Input-Output Analysis of the Marine-OrientedIndustries of New London County, Connecticut. Masters Thesis. Storrs: Univ. OfConnecticut.
Creed, Carolyn F. & Bonnie J. McCay. 1996. ‘Property Rights, Conservation and InstitutionalAuthority: Policy Implications of the Magnuson Act reauthorization for the Mid-Atlantic Region.’Tulane Environmental Law Journal 9(2): 245-256.
Crichton, M. 1988. Travels. Ballantine, New York.
Cumberland, J.H. 1966. A regional inter-industry model for analysis of development objectives.Regional Science Association Papers, Vol. 17: 65-95.
Daily, G. C., T. Soderqvist, et al. (2000). “The Value of Nature and the Nature of Value.” Science289: 395-396.
Daly, H.E. 1968. On economics as a life science. Journal of Political Economy, Vol.76: 392-406.
Demsetz, H. 1964. The exchange and enforcement of property rights. Journal of Law andEconomics 7:11-26.
Demsetz, H. 1967. Toward a theory of property rights. American Economic Review 57:347-359.
Department of Fisheries and Oceans (DFO). 2000. DFO Science Stock Status Reports 2000.Canadian Stock Assessment Secretariat. Ottawa, Ontario.
Department of Fisheries and Oceans (DFO). 2001. Marine Protected Areas, Oceans Canada.Ottawa, Ontario

83
Dietz, T., E.Ostrom, and C. Stern. 2003. The struggle to govern the commons. Science: 12:1907-1911.
Dinneford, E.; K. Iverson; B. Muse and K. Schelle. 1999a. Changes under Alaska’s Halibut IFQprogram, 1995 to 1998. Alaska Department of Fish and Game; Juneau, Alaska.
Dinneford, E.; K. Iverson; B. Muse and K. Schelle. 1999b. Changes under Alaska’s Sablefish IFQprogram, 1995 to 1998. Alaska Department of Fish and Game; Juneau, Alaska.
Doeringer, Peter, Philip Moss, and David Terkla. 1986. The New England Fishing Economy:jobs, income and kinship. Amherst: University of Massachusetts Press.
Downs, Anthony. 1967. Inside Bureaucracy. Boston: Little, Brown and Company.
Duda, A.M. and K. Sherman. 2002. A new imperative for improving management of large marineecosystems. Ocean & Coastal Management 45:797-833.
Dyer, C., and J. Poggie. 1998. ‘Application of the Natural Resource Region as a Unifying HumanEcosystem Theory,’ unpublished draft. University of Rhode Island.
Dyer, Christopher L. and David Griffith. 1996. An Appraisal of the Social and Cultural Aspectsof the Multispecies Groundfish Fishery in New England and the Mid-Atlantic Regions.Aguirre International/ NOAA. Bethesda, MD.
Dyer, Christopher L. and James R. McGoodwin. 1994. Folk Management in the World’sFisheries: Lessons for Modern Fisheries Management. Boulder: University Press ofColorado.
Dyer, Christopher L., and John J. Poggie, Jr. 1998. ‘Integrating Socio-cultural Variables into LargeMarine Ecosystems: The Natural Resource Region Model.’ NOAA Workshop on Large MarineEcosystems. University of Rhode Island. Kingston.
Dyer, Christopher L., Duane A. Gill and J. Steven Picou. 1992. ‘Social Disruption and the ValdezOil Spill: Alaskan Natives in a Natural Resource Community.’ Sociological Spectrum 12(2):105-126.
Edwards, Stephen F. and Glenn A. Anderson. 1984. Land use Conflicts in the Coastal Zone: AnApproach for the Analysis of the Opportunity Costs of Protection of Coastal Zone Resources’:J. of the Northeast Agric. Econ. Council (13): 1: 73-82.
Eggertsson, T. 1990. Economic behavior and institutions. Cambridge University Press, NewYork.
European Union, ‘Overview of the Programme [Integrated Coastal Zone ManagementDemonstration Programme],’ (http://europa.eu.int/en/comm/dg11/iczm/overview.html)
FAO. 1999. The State of World Fisheries and Aquaculture 1998. United nations, Rome.
FAO. 2004. The State of World Fisheries and Aquaculture 2004. UN Food & AgricultureOrganization, Rome.
FAO. In Prep. Guidelines for the Routine Collection of Capture Fishery Data. Fisheries TechnicalPaper. Rome: Food and Agriculture Organization of the United Nations.
References

84 LME Governance Handbook
Felt L., B. Neis, and B. McKay, “Comanagement,” in J. Boreman, et al., (eds.), NorthwestAtlantic Groundfish: Perspectives on a Fishery Collapse (Bethesda, MD: American FisheriesSociety, 1997) pp. 185-194
Franklin, J. F. (1997). Ecosystem Management: An Overview. New Haven, Yale UniversityPress.
Freeman, A. Myrick III. 1993. The Measurement of Environmental and Resource Values:Theory and Methods. Washington, D.C.: Resources for the Future.
Furlong, W.J. 1991. “The Deterrent Effect of Regulatory Enforcement in the Fishery”, LandEconomics, 67(1):116-129.
Gauvin, J. 1988. An Econometric Estimation of Compliance Behaviour in the MassachusettsInshore Lobster Fishery. Unpublished Masters Thesis, University of Rhode Island.
Gezelius, S. 2002. Do Norms Count? State Regulation and Compliance in a Norwegian FishingCommunity, Acta Sociologica 45:305-314.
Global Environment Facility (1998). Valuing the Global Environment: Actions and Investmentsfor a 21st Century. Washington, D.C., Global Environment Facility
Gordon, H.S. 1954. The economic theory of a common-property resource: the fishery. Journal ofPolitical Economy 62:124-142.
Goulder, Lawrence H. and Donald Kennedy. 1997. ‘Valuing Ecosystem Services: PhilosophicalBases and Empirical Methods.’ pp. 23-47. In Daily, Gretchen (ed.), Nature’s Services:Societal Dependence on Natural Ecosystems. Washington, D.C.: Island Press.
Grafton, R. Q. (2005). “Social Capital and Fisheries Governance.” Ocean & CoastalManagement 48: 753-766.
Grigalunas, T., J. J. Opaluch, J. Diamantides. 1998. ‘Estimating the Economic Cost of Oil Spills:Issues, Challenges and Examples’, Coastal Management (June).
Grigalunas, T., J. Opaluch, D. French, and M. Reed. 1988. Measuring damages to marine naturalresources from pollution incidents under CERCLA: application of an integrated, ocean systems/economics model’, Marine Resource Econ., 5:
Grigalunas, Thomas A. 1998. Practical uses of Environmental Economics in Large Scale MarineEcosystems. Paper presented to the meeting on the Benguela Current LME, Cape Town, SouthAfrica (July).
Grigalunas, Thomas A. and Craig A. Ascari. 1982. ‘Estimation of Income and EmploymentMultipliers for Marine-Related Activity in the Southern New England Marine Region’, J. of theNortheast Agric. Econ. Council (XI) 1:25-34 (Spring).
Grigalunas, Thomas A. and James J. Opaluch. 1988. ‘Liability for Oil Spills: A New Approach forProviding Incentives for Pollution Control’ Natural Resources Journal Vol. 28 (Summer).
Grigalunas, Thomas A. and James J. Opaluch. 1989. ‘Managing Contaminated Marine Sediments:Economic Considerations’, Mar. Policy.

85
Grigalunas, Thomas A. and James J. Opaluch. 1990.’Social Costs’, in Scott Farrow (ed.),Managing Our Outer Continental Shelf Resources: Oceans of Controversy. New York:Taylor and Francis Publ. Co.
Grigalunas, Thomas A. and James J. Opaluch. 1998a. Natural Resource Damage Assessmentand the Straits of Malacca. Manila: UNDP/IMO/GEF Regional Programme for MarinePollution and Management in East Asian Seas.
Grigalunas, Thomas A. and James J. Opaluch. 1998b. Sustainable Financing for Ship-BasedPollution Prevention and Management in the Malacca Straits. Manila: UNDP/IMO/GEFRegional Programme for Marine Pollution and Management in East Asian Seas.
Grigalunas, Thomas A.. 1997. Benefit-Cost Framework for Marine Pollution Prevention andManagement in the Malacca Straits. Manila: UNDP/IMO/GEF Regional Programme forMarine Pollution and Management in East Asian Seas.
Grumbine, R. E. (1993). “What is Ecosystem Management?” Conservation Biology 8(1): 27-38.
Haas, P. 1992. Epistemic communities and international policy coordination. InternationalOrganization 46: 1.
Hall-Arber, M. and A.C. Finlayson, “Role of Local Institutions in Groundfish Policy,” in J. Boreman,et al., (eds.), Northwest Atlantic Groundfish: Perspectives on a Fishery Collapse (Bethesda,MD: American Fisheries Society, 1997) pp. 111-138
Hanna, S. 1995. ‘Efficiencies of user Participation in Natural Resource Management’. in PropertyRights and the Environment - Social and Ecological Issues. Beijer International Institute ofEcological Economics and The World Bank. Washington, DC.
Hanna, S. S. (1998). “Institutions for marine ecosystems: economic incentives and fisherymanagement.” Ecological Applications 8 (Supplement): S170-174
Hanna, S., C. Folke and K-G. Maler. 1966. Rights to nature: ecological, economic, cultural,and political principles of institutions for the environment. Island Press, Washington, D.C.
Hanna, S.S. 1998. Institutions for marine ecosystems: economic incentives and fishery management.Ecological Applications 8(Supplement):S170-S174.
Hatcher, A. and D. Gordon. 2005. Further Investigations in the Factors Affecting Compliance withUK Fishing Quotas, Land Economics 81(1): 71-86.
Hatcher, A. and Robinson, K. (eds.). 1999. The Definition and Allocation of use rights in EuropeanFisheries. Center for the Economics and Management of Aquatic Resources (CEMARE).University of Portsmouth, UK.
Hatcher, A., S. Jaffry, O. Thébaud, and e. Bennett. 2000. Normative and Social InfluencesAffecting Compliance with Fishery Regulations, Land Economics 76 (August): 448-61.
Hauck, M. and M. Kroese. 2006. Fisheries Compliance in South Africa: A Decade of Challengesand Reform 1994-2004, Marine Policy 30: 74-83.
Hauck, M. and N. Sweijd. 1999. A Case Study of Abalone Poaching in South Africa and its Impacton Fisheries Management, ICES J. Marine Science 56: 1024-32.
References

86 LME Governance Handbook
Healey, M. and T. Hennessey. 1994. The utilization of scientific information in the management ofestuarine ecosystems. Ocean and Coastal Management 23:167-191.
Hempel, G. and K. Sherman, eds. 2003. Large Marine Ecosystems of the World: Trends inExploitation, Protection, and Research. Elsevier. the Netherlands.
Hennessey, T. 1994. Governance and adaptive management for estuarine ecosystems: The case ofChesapeake Bay. Coastal Management 22:119-145.
Hennessey, T. and D. Soden. 1999. Ecosystem management: The governance dimension. InSoden, D. and B. Steele, eds. Handbook of Global Environmental Policy andAdministration. New York, Marcel Decker.
Hennessey, T. and J. Sutinen, Eds. 2005. Sustaining Large Marine Ecosystems: The HumanDimension. Large Marine Ecosystems Series. Amsterdam, Elsevier.
Hennessey, T. M. 1997. Ecosystem Management. In: Soden, D., B. Lam and J. Tennert (eds.),Ecosystems management: a social science perspective. Dubuque, Iowa: Kendal/Hunt.
Hennessey, Timothy. 1994, ‘Governance and Adaptive Management for Estuarine Ecosystems: TheCase of Chesapeake Bay,’ 22 Coastal Management 119-145.
Hiatt, Terry and Terry, Joe. 2000. Stock assessment and fishery evaluation report for theGroundfish fisheries of the Gulf of Alaska and the Bering Sea/Aleutian Island area: EconomicStatus of the Groundfish fisheries off Alaska, 1999. National Marine Fisheries Service (NMFS).Seattle, WA
Hønneland, G. 1998. Compliance in the Fishery Protection Zone around Svalbard. OceanDevelopment and International Law 29, 330-360.
Hønneland, G. 1999. Compliance in the Barents Sea Fisheries. Oslo: Institute of PoliticalScience, University of Oslo.
Horwood, J.W., J.H. Nichols, and S. Milligan. 1998. Evaluations of closed areas for fish stockconservation. Journal of Applied Ecology. 35:893-903
Hunt, Robert, ed. 1997. Property Rights. Monographs in Economic Anthropology, Vol. 14.University Press of America. Lanham, MD.
IDA. 1999. Fisheries Law Enforcement: Assessment of Deterrence. IDA Document D-2381.Institute for Defense Analysis, Alexandria, VA.
Imperial, Mark T. and Timothy Hennessey. 1993. ‘The Evolution of Adaptive Management forEstuarine Ecosystems: the National Estuary Program and its Precursors,’ 20 Ocean andCoastal Management 147-180’
Imperial, Mark T. and Timothy Hennessey. 1996. ‘An Ecosystem-Based Approach to ManagingEstuaries: An Assessment of the National Estuary Program,’ 24 Coastal Management 115-139.
Independent World Commission on the Oceans. 1998. The Ocean Our Future. Cambridge,Cambridge University Press.

87
International Union for the Conservation of Nature and Natural Resources (IUCN). 1994. Guidelines for Protected Area Management Categories. IUCN, Gland, Switzerland, andCambridge, U.K.
Interorganizational Committee on Guidelines and Principles. 1993. Guidelines and Principles forSocial Impact Assessment. IAIA, Box 70, Belhaven, NC 27810 (40 pages).
Isard, W. 1972. Ecologic-Economic Analysis for Regional Development. The Free Press, NewYork.
Jentoff, S. and B. McCay. 1995. user participation in fisheries management. Marine Policy. 19(3).pp. 227-246.
Johnson, R. & Libecap, G. 1994. The Federal Service System and the Problem of Bureaucracy:The Economics and Politics of Institutional Change, Chicago: University of Chicago Press.
Juda, L. 1993. ‘Ocean Policy, Multi-use Management, and the Cumulative Impact of PiecemealChange: The Case of the United States Outer Continental Shelf,’ 24 Ocean Development andInternational Law 355-376.
Juda, L. 1999. Considerations in Developing a Functional Approach to the Governance of LargeMarine Ecosystems. Ocean Development and International Law 30: 89-125.
Juda, L. 2003. Changing National Approaches to Ocean Governance: The United States, Canada,and Australia. Ocean Development and International Law 34: 161-187.
Juda, L. and T. Hennessey. 2001. Governance profiles and the management and use of large marineecosystems. Ocean Development and International Law 32:43-69.
King, Dennis M. and David A. Story. 1974. Use of An Economic-Environmental Input-OutputAnalysis for Coastal Planning With Illustration for the Cape Cod Region. Amherst:University of Massachusetts, Center for Water Resources Research.
Kirkley, J.E. and I.E. Strand. 1988. The technology and management of multi-species fisheries.Applied Economics 20:1279-1292.
Kitts, Andrew W., and Scott R. Steinback. No date. Data Needs for Economic Analysis of FisheryManagement Regulations. Unpublished manuscript, Northeast Fisheries Science Center, WoodsHole, MA.
Kohlberg, L. 1969. ‘Stage and Sequence: the Cognitive-Development Approach to Socialization,’in D. A. Goslin (ed.) Handbook of Socialization Theory and Research. Rand McNally, NewYork.
Kohlberg, L. 1981. Essays on Moral Development. Vol. 1.The Philosophy of MoralDevelopment: Moral Stages and the Idea of Justice. San Francisco: Harper and Row.
Kohlberg, L. 1984. Essays on Moral Development: Vol. II. Harper and Row, San Francisco.
Kopp, Raymond and V. Kerry Smith. 1993. Valuing Natural Assets: The Economics of NaturalResource Damage Assessment. Washington, D.C.: Resources for the Future, 358 pp.
Kuhn, T. S. (1970). The Structure of Scientific Revolutions. Chicago, University of ChicagoPress.
References

88 LME Governance Handbook
Kuperan Viswanathan, K. 1992. Deterrence and voluntary compliance with the zoningregulation in the Malaysian Fishery. Ph.D dissertation, University of Rhode Island, Kingston.294p.
Kuperan, K. and J. G. Sutinen. 1995. Compliance with Zoning Regulations in Malaysian Fisheries.In D. Liao (ed.), International Cooperation for Fisheries and Aquaculture Development:Proceedings of the 7th Conference of the International Institute of Fisheries Economicsand Trade, Vol. 1, Keelung, Taiwan: National Taiwan Ocean University.
Kuperan, K., and J. G. Sutinen. 1998. ‘Blue Water Crime: Legitimacy, Deterrence and Compliancein Fisheries,’ Law and Society Review 32(2):309-338.
Kuperan, K., N. Abdullah, I. Susilowati, I. Siason, and C. Ticao. 1997. Enforcement andCompliance with Fisheries Regulations in Malaysia, Indonesia and the Philippines.Universiti Pertanian Malaysia. Diponegoro University, University of the Philippines in the Visayas.
Laffoley, L., E. Maltby, et al. (2004). The Ecosystem Approach: Coherent Actions for Marine andCoastal Environments, English Nature. Millennium Ecosystem Assessment (2005). Ecosystemsand Human Well–being: Biodiversity Synthesis.
Larkin, P.A. 1996. Concepts and issues in marine ecosystem management. Reviews in FishBiology and Fisheries 6:139-164.
Larsen, J. 2004. Dead Zones Increasing in World’s Coastal Waters, Eco-Economy Updates,Earth Policy Institute (http://www.earth-policy.org/Updates/Update41.htm).
Laurens, et al.. 1997 Indicators for Environmental Issues in the European Coastal Zone, IntercoastNetwork, Fall 1997, pp. 3-4, 31.
Lee, David (ed.). 1999. United Kingdom Sea Fisheries Statistics 1998. Ministry of Agriculture,Fisheries and Food (MAFF). The Stationery Office, London.
Lee, K. 1993. Compass and Gyroscope. Washington, D.C. Island Press.
Levy, M., R. Keohane and P. Haas. 1993. Improving the effectiveness of internationalenvironmental institutions. In Haas, P. ed. Institutions for the Earth. Cambridge, MIT Press.
Lewis M. Alexander. 1993. Large Marine Ecosystems: A New Focus for Marine ResourcesManagement, 17 Marine Policy 186-198.
Libecap, G.D. 1989. Contracting for property rights. Cambridge University Press, New York.
Mahanty, S. and N. Stacey. 2004. Collaborating for Sustainability: A Resource Kit forFacilitators of Participatory Natural Resource Management in the Pacific. South PacificRegional Environment Programme. Available at http://www.sprep.org.ws/iwp/documents/IWP_Complete_version_001.pdf.
Marine Protection, Research, and Sanctuaries Act, Public Law 92-532.
MARPOL, International Convention for the Prevention of Pollution from Ships. 1973, as modifiedby the Protocol of 1978 (MARPOL73/78)
McCay, Bonnie & James Acheson (eds.). 1987. The Question of the Commons. Tucson:University of Arizona Press.

89
McClanahan, T.R., and B. Kaunda-Arara. 1996. Fishery recovery in a coral-reef marine park andits effect on the adjacent fishery. Conservation Biology 10(4): 1187-1199
McGlade, J.M. 1989. Integrated fisheries management models: understanding the limits to marineresource exploitation. American Fisheries Society Symposium 6:139-165.
McGlade, Jacqueline. 1995 . ‘Intelligent Knowledge Based Systems for the Analysis of CoastalZones: Design Logic of SIMCOAST,’ in ASEAN-EU Workshop Report, InterdisciplinaryScientific Methodologies for the Sustainable use and Management of Coastal Resource Systems(University of Warwick).
McGoodwin, James R. 1990. Crisis in the World’s Fisheries: People, Problems, and Policies.Stanford: Stanford University Press.
Mee and Bloxham, 2005
Milazzo, M. 1998. Subsidies in World Fisheries: A Reexamination. World Bank Technical PaperNo. 406: Washington, DC.
Miles, E. et al. 2002. Environmental Regime Effectiveness: Confronting Theory andEvidence. Cambridge, MIT Press.
Milliman, Scot. R. 1986. ‘Optimal Fishery Management in the Presence of Illegal Activity’. J.Environ. Econ. and Manage. 13(4):363-381.
Musgrave, Richard. 1969. Cost-Benefit Analysis and the Theory of Public Finance, Journal ofEconomic Literature (7)3.
National Academy of Sciences. 1997. Striking a Balance: Improving Stewardship of MarineAreas. Washington, D.C.: National Academy Press.
National Oceanic and Atmospheric Administrations (NOAA). 1999. Our Living Oceans: Reporton the Status of U.S. Living Marine Resources, 1999. NOAA Technical MemorandumNMFS-F/SPO-41. National Oceanic and Atmospheric Administrations, Silver Spring, MD.
National Research Council (NRC). 2004. Valuing Ecosystem Services: Toward BetterEnvironmental Decision-Making. National Academy Press. Washington, D.C.
National Research Council (NRC). 1999. The Community Development Quota Program inAlaska. National Academy Press. Washington, D.C.
National Research Council (NRC). 2001. Marine Protected Areas: Tools for Sustaining OceanEcosystems. National Academy Press. Washington, D.C.
NEPA, National Environmental Policy Act, Public Law 91-190.
Nielsen, J.R. and T. Vedsmand. 1995. Fisheries co-management: An alternative strategy in fisheries- cases from Denmark. Issue paper for the OECD study on the efficient management of livingmarine resources.
Nielsen, J.R. and C. Mathiesen. 2003. Important Factors Influencing Rule Compliance in Fisheries:Lessons from Denmark, Marine Policy 27(5): 409-16.
Niskanen, W. 1971. Bureaucracy and Representative Government. Chicago, IL: Aldine Press.
References

90 LME Governance Handbook
North Pacific Fishery Management Council (NPFMC). 2001. Joint Report of the PollockConservation Cooperative and High Seas Catchers Cooperative, 2000. Anchorage, Alaska.
North, D.C. 1992. Transaction costs, institutions, and economic performance. ICS Press, SanFrancisco, California.
OECD. 1994. Fisheries Enforcement Issues, Paris: Organization for Economic Co-operation andDevelopment.
Olsen, S. B. 2003. Frameworks and indicators for assessing progress in integrated coastalmanagement initiatives. Ocean and Coastal Management 46: 347-361.
Olsen, S. B. and D. Nickerson. 2003. The Governance of Coastal Ecosystems at the RegionalScale. Narragansett, R.I., Coastal Resources Center, University of Rhode Island: 32pp.
Olson, M. 1964. The logic of Collective Action. Harvard University Press, Cambridge MA.
Organization for Economic Co-operation and Development (OECD). 1997. Towards SustainableFisheries: Economic Aspects of the Management of Living Marine Resources. Paris,France.
Organization for Economic Co-operation and Development (OECD). 2000. Review of Fisheriesin OECD Countries. Volume I: Policies and Summary Statistics. Paris, France.
Organization for Economic Co-operation and Development (OECD). 2000. Review of Fisheriesin OECD Countries. Volume II: Country Statistics. Organization for Economic Co-operationand Development (OECD), Paris, France.
Ostrom, Elinor. 1990. Governing the Commons: The Evolution of Institutions for CollectiveAction. New York: Cambridge University Press.
Osuga, Hideo. 1997. ‘International Conventions on Liability and Compensation for Oil PollutionDamages’, in Ross, Tejales, and Rosales (eds.) Sustainable Financing Mechanisms: PublicSector-Private Sector Partnerships.
Pauly, D. V. Christensen, J. Dalsgaard, R. Froese and F. Torres, Jr. 1998. Fishing down marinefood webs. Science 279: 860-863.
Pew Oceans Commission (2003). America’s Living Oceans: Charting a Course for SeaChange,
Pollnac, Richard B. 1984. Investigating Territorial Use Rights Among Fishermen. Senri EthnologicalStudies 17: 285-300.
Pollnac, Richard B. 1992. Multi-use Conflicts in Aquaculture – Sociocultural Aspects. WorldAquaculture 23 (2): 16-19.
Ross, S. A., C. Tejales, and R.M Rosales (eds.). 1997. Sustainable Financing Mechanisms:Public Sector-Private Sector Partnerships. Proceedings of the Regional Conference onSustainable Financing Mechanisms for the Prevention of Marine Pollution. Manila, ThePhilippines: UNDP IMO Regional Programme for the Prevention and Management of MarinePollution in East Asian Seas.

91
Rowley, C.K., R.D. Tollison, and G. Tullock (eds.). 1988. The political economy of rent-seeking.Kluwer Academic Publishers, Boston.
Russ, G.R., and A.C. Alcala. 1996. Marine reserves: Rates and patterns of recovery and decline oflarge predatory fish. Ecological Applications. 6(3): 947-961
Russell, C. S. 1990. Game Models for Structuring Monitoring and Enforcement Systems, NaturalResource Modeling 4(2): 143-73.
Russell, C. S. 2003. The Economics of Environmental Monitoring and Enforcement, AshgatePublishing Ltd.
Russell, Susan. 1994. Institutionalizing Opportunism: Cheating on Baby Purse Seiners in BatangasBay, Philippines. in Anthropology and Institutional Economics. Edited by James M. Acheson.pp. 87-108.
Sherman, K. and H.R. Skjoldal, eds. 2002. Large Marine Ecosystems of the North Atlantic:Changing States and Sustainability. Elsevier. the Netherlands.
Sherman, K. and L. M. Alexander, Eds. (1986). Variability and Management of Large MarineEcosystems. Boulder, Westview Press.
Sherman, K., L.M. Alexander, B.D. Gold, eds. 1993. Large Marine Ecosystems: Stress,Mitigation, and Sustainability. AAAS Press,Washington, DC.
Sherman, K., M. Grosslein, D. Mountain, D. Busch, J. O’Reilly and R. Theroux. 1996. Thenortheast shelf ecosystem: An initial perspective. in The Northeast Shelf Ecosystem,Assessment, Sustainability and Management. edited by K. Sherman, N.A. Jaworski and T.J.Smayda. pp. 103-126.
Sherman, Kenneth, et al. (eds.). 1986. Variability and Management of Large Marine Ecosystems.Boulder: Westview.
Sherman, Kenneth, et al. (eds.). 1989. Biomass Yields and Geography of Large MarineEcosystems. Boulder: Westview Press.
Sherman, Kenneth, et al. (eds.). 1990. Large Marine Ecosystems: Patterns, Processes, and Yields.Washington, D.C.: American Association for the Advancement of Science.
Sherman, Kenneth, et al. (eds.). 1992. Food Chains, Yields, Models, and the Management ofLarge Marine Ecosystems. Boulder: Westview Press.
Sherman, Kenneth, et al. (eds.). 1993. Large Marine Ecosystems: Stress, Mitigation andSustainability Washington, D.C.: American Association for the Advancement of Science.
Sherman, Kenneth, et al. (eds.). 1998. Large Marine Ecosystems of the Indian Ocean: Assessment,Sustainability, and Management. Malden, MA: Blackwell Science.
Sherman, Kenneth, N.A. Jaworski and T.J. Smayda (eds.). 1996. The Northeast Shelf Ecosystem:Assessment, Sustainability, and Management. Cambridge, MA: Blackwell Science.
Sherman, Kenneth. 1994. ‘Sustainability, Biomass Yields, and Health of Coastal Ecosystems: anEcological Perspective,’ 112 Marine Ecology Progress Series 277-301.
References

92 LME Governance Handbook
Sherman, Kenneth. 1997. ‘Large Marine Ecosystems: Assessment and Management from DrainageBasin to Ocean,’ Paper to the Joint Stockholm Water Symposium/EMECS Conference.
Shrank, W., R. Arnason, and R. Hannesson (eds.). 2003. The Cost of Fisheries Management: pp45-63. Hants, England: Ashgate Publishing.
Sigurjonsson, Johann (eds.). 2000. State of Marine Stocks in Icelandic Waters 1999/2000.Prospects for the Quota year 2000/20001. Marine research Institute Report No. 75, Reykjavik,Iceland.
Sissenwine, M. & Mace, P. 2001. Governance for Responsible Fisheries: An Ecosystem Approach.In M. Sinclair and G. Valdimarsson (ed.), Responsible Fisheries in the Marine Ecosystem.Rome: The Food and Agriculture Organization of the United Nations.
Slocombe, D. Scott. 1993. ‘Implementing Ecosystem-based Management,’ 43 BioScience 612-622 (1993).
Snyder, Robert E. 2005. What’s New in Production, World Oil Magazine 226 (1) (January) (http://www.worldoil.com/magazine/MAGAZINE_DETAIL.asp?ART_ID=2479&MONTH_YEAR=Jan-2005 accessed May 2,2006).
Solow, R.M. 1991. ‘Sustainability: an economist’s perspective.’ Paper presented as the EighteenthJ. Seward Johnson Lecture to the Marine Policy Center, Woods Hole Oceanographic Institution,Woods Hole, MA., June 14, 1991.
Stratton Commission. 1969. (Commission on Marine Science, Engineering and Resources), OurNation and the Sea: A Plan for National Action. Washington, D.C.: Government Printing Office.
Sutinen, J. G. 1987. ‘Enforcement of the MFMCA: An Economist’s Perspective,’ Marine FisheriesReview, 49(3):36-43.
Sutinen, J. G. 1993. “Morality and Fairness, and Their Role in Fishery Regulation,” in Proceedingsof the IV Annual Conference of The European Association of Fisheries Economists, M.Spagnolo (ed.), Salerno, Italy; pp 7-15.
Sutinen, J. G. 1995. ‘Summary and Conclusion of the Workshop on Enforcement Measures,’Fisheries Enforcement Issues. OECD.
Sutinen, J. G. 1996. Fisheries Compliance and Management: Assessing Performance.Australian Fisheries Management Authority, Canberra, ACT (August).
Sutinen, J. G. and J. R. Gauvin. 1988. A Study of Law Enforcement and Compliance in theCommercial Inshore Lobster Fishery of Massachusetts. Volumes I and II. An unpublishedReport to the Environmental Enforcement Division, State of Massachusetts.
Sutinen, J. G. and K. Kuperan. 1994. A Socioeconomic Theory of Regulatory Compliance inFisheries. Paper presented to the 7th Conference of the International Institute of FisheriesEconomics and Trade, 18-21 July, 1994, Taipei, Taiwan.
Sutinen, J. G. and K. Kuperan. 1999. ‘A Socioeconomic Theory of Regulatory Compliance inFisheries,’ International Journal of Social Economics 26(1/2/3):174-193.

93
Sutinen, J. G. and P. Andersen. 1985. ‘The Economics of Fisheries Law Enforcement.’ LandEconomics, 6l(4):387-397.
Sutinen, J. G. and T. M. Hennessey (eds.), 1987. Fisheries Law Enforcement: Programs,Problems and Evaluation, Marine Technical Report 93, University of Rhode Island, Kingston,RI.
Sutinen, J. G. and T. M. Hennessey. 1986. ‘Enforcement: The Neglected Element in FisheriesManagement.’ E. Miles, R. Pealy and R. Stokes (eds.), Natural Resource Policy andManagement: Essays in Honor of James A. Crutchfield. Seattle: University of WashingtonPress.
Sutinen, J. G., A. Rieser, and J. R. Gauvin. 1990. ‘Measuring and Explaining Noncompliance inFederally Managed Fisheries,’ Ocean Development and International Law, 21:335-372.
Sutinen, J. G., and J. R. Gauvin. 1989. “An Econometric Study of Regulatory Enforcement andCompliance in the Commercial Inshore Lobster Fishery of Massachusetts,” in P. A. Neher, R.Arnason, and N. Mollet (eds.), Rights-Based Fishing. Kluwer Academic Publishers,Dordrecht, Boston, London.
Sutinen, J. G., et al. 2000. A Framework for Monitoring and Assessing Socioeconomics andGovernance of Large Marine Ecosystems. NOAA Technical Memorandum NMFS-NE-158.Northeast Fisheries Science Center, Woods Hole, MA.
Sutinen, J.G. 1993 ‘Recreational and Commercial Fisheries Allocation with Costly Enforcement.’Amer. J. Agricultural Econ. 75(5): 1183-1187.
Sutinen, J.G., and M. Soboil. 2003. ‘The Performance of Fisheries Management Systems and theEcosystem Challenge.’ In M. Sinclair and G. Valdimarsson (ed.), Responsible Fisheries in theMarine Ecosystem. Rome: The Food and Agriculture Organization of the United Nations.
Sutinen, Jon G. and Harold F. Upton. 2000. ‘Economic Perspectives on New England FisheriesManagement,’ Northeast Naturalist 7(4): 361-72.
Sutinen, J. G., J. Yahaya, and V. Hirunruk. 1992. “Fisheries Law Enforcement Programs, Practicesand Problems in Malaysia, Philippines, and Thailand,” in James B. Marsh (ed.), Resources andEnvironment in Asia’s Marine Sectors, Taylor and Francis Publishers.
Tyler, T. 1990. Why People Obey the Law. New Haven & London: Yale University Press, 273p.
U.S. Commission on Ocean Policy. 2004. An Ocean Blueprint for the 21st Century.
Underdal, A. 1980. ‘Integrated Marine Policy: What? Why? How?,’ 4 Marine Policy 159-169.
Underdal, A. 2002. One question, two answers. In Miles et al., eds. Environmental RegimeEffectiveness: Confronting Theory and Evidence. Cambridge, MIT Press.
UNEP. 2002. Global Environmental Outlook 3: Past, present, and future perspectives. UnitedNations Environmental Programme, Nairobi, Kenya. http://www.unep.org/GEO/geo3/english/pdf.htm
United States Congress. 1990. Oil Pollution Act of 1990. Pub.Law 101-380, 104 Stat. 484, Aug.18.
References

94 LME Governance Handbook
Vallega, A. 1991. The human geography of semi-enclosed seas: the Mediterranean case — a firstapproach. in The Development of Integrated Sea-use Management. Edited by H.D. Smithand A. Vallega. Routledge, New York, pp.238-259.
Vallega, Adalberto. 1992. Sea Management: A Theoretical Approach (London: Elsevier AppliedScience)
van den Bergh, J.C.J.M. 1996. Ecological Economics and Sustainable Development, Theory,Methods, and Applications. Edward Elgar, Brookfield, U.S..
Victor, P.A. 1972. Pollution Economy and the Environment. George Allen and Unwin Ltd.London.
Vogt, W. 1948. Road to Survival. New York: William Sloan.
Von Moltke, Konrad. 1997. ‘Institutional Interactions: The Structure of Regimes for Trade andEnvironment,’ in Oran Young, Global Governance. Cambridge: MIT Press, pp. 247-272.
Wallis, Paul, and Ola Flaaten. 2000. Fisheries Management Costs: Concepts and Studies. Paris:Organization for Economic Cooperation and Development.
Walters, C. 1986. Adaptive Management and Renewable Resources. New York: Macmillan.
Wilson, D. C., et al., (eds.), The Fisheries Co-management Experience: Accomplishments,Challenges and Prospects. Dordrecht, Kluwer Academic Publishers, 2003)
Wolf, C. Jr. 1988. Markets or Governments: Choosing between Imperfect Alternatives. TheMIT Press, Cambridge, MA.
World Commission on Environment and Development (1987). Our Common Future. Oxford,Oxford University Press.
Young, O. 1989. International Cooperation: Building Regimes for Natural Resource and theEnvironment. Cornell University Press.
Young, O. 1999. Governance in World Affairs. Cornell University Press.
Young, O. and G. Osherenko, eds. 1993. Polar Politics: Creating International EnvironmentalRegimes. Ithaca, Cornell University Press.
Young, O. ed. 1999. The Effectiveness of International Environmental Regimes. Cambridge:MIT Press.

COASTAL RESOURCES CENTERUniversity of Rhode Island
Narragansett Bay Campus, Narragansett, Rhode Island 02882, USATel: (401) 874-6224 FAX: (401) 874-6920 WWW: http://www.crc.uri.edu/