A framework for vulnerability assessment of coastal ...
13
Fisheries Research 147 (2013) 381–393 Contents lists available at ScienceDirect Fisheries Research jo u r n al homep age: www.elsevier.com/locate/fishres A framework for vulnerability assessment of coastal fisheries ecosystems to climate change—Tool for understanding resilience of fisheries (VA–TURF) Samuel S. Mamauag a,b,∗ , Porfirio M. Ali ˜ no a,b , Renmar Jun S. Martinez a,b , Richard N. Muallil a,b,c , Maria Victoria A. Doctor b , Emerlinda C. Dizon d , Rollan C. Geronimo d , Fleurdeliz M. Panga a,b , Reniel B. Cabral a,b,e a Marine Science Institute, University of the Philippines Diliman, Quezon City 1101, Philippines b Marine Environment and Resources Foundation, Inc., Marine Science Institute, University of the Philippines Diliman, Quezon City 1101 Philippines c Mindanao State University—Tawi-Tawi College of Technology and Oceanography, 7500 Bongao, Tawi-Tawi, Philippines d Conservation International—Philippines, Teachers Village, Diliman, Quezon City 1101, Philippines e National Institute of Physics, University of the Philippines Diliman, Quezon City 1101, Philippines a r t i c l e i n f o Article history: Received 23 February 2013 Received in revised form 11 July 2013 Accepted 15 July 2013 Keywords: Vulnerability assessment Coastal fisheries ecosystem Climate change a b s t r a c t Vulnerability assessment (VA) is increasingly developed and utilized in various sectors and fields of soci- ety. VA provides a better understanding of the interactions among system, pressures, and threats, which serves as a basis for targeted adaptation strategies. The framework or tool named tool for understand- ing resilience of fisheries (VA–TURF) was developed to assess the vulnerability of the coastal fisheries ecosystems in the tropics to climate change. VA–TURF has three major components, namely, fisheries, reef ecosystem, and socio-economics. Although each component has intrinsic properties, the three com- ponents are strongly interrelated. Indicators associated to sensitivity, exposure, and adaptive capacity were developed for each component of TURF. The exposure variable used was wave. VA–TURF uses information obtained through rapid assessments except for the reef ecosystem component. The analyt- ical approach for integrating scores is straightforward and devoid of highly sophisticated mathematical methods. The utility of VA–TURF primarily considers the fishers of a coastal community (barangay) as the major stakeholder, thereby facilitating familiarization and community ownership of the tool. VA–TURF was demonstrated in all the coastal barangays of two island municipalities (Lubang and Looc, Occidental Mindoro, Philippines) located along the Verde Island Passage, which has the world’s highest marine shore fish biodiversity. Local stakeholders such as fishers, barangay leaders, residents, and local executive staff of the two municipalities participated in the process of scoring and determining the vulnerability of the sites during a series of workshops. The local-level fisheries vulnerability assessment framework devel- oped encourages community-level actions and provides opportunities for strategic actions and scaling-up of efforts at various governance levels. © 2013 Elsevier B.V. All rights reserved. 1. Introduction Global and regional assessments have been initiated to deter- mine the vulnerability of countries to various impacts of climate change. Recently, the assessment of fisheries vulnerability at the national (country) level has attracted increasing interest (Allison et al., 2009; Hughes et al., 2012). Some studies have also focused on coastal community-level vulnerability assessment (VA) (e.g., Clark et al., 1998; Dolan and Walker, 2006; Cinner et al., 2012). In a study by Allison et al. (2009) on the vulner- ability of 132 national economies to potential climate change ∗ Corresponding author. Tel.: +632 433 1806; fax: +632 433 1806. E-mail address: [email protected] (S.S. Mamauag). impacts on their capture fisheries, four countries in Asia are among the most vulnerable economies, namely, Yemen, Pakistan, Bangladesh, and Cambodia. These countries are least developed, with high poverty levels and high reliance on fish for dietary protein. The assessment of approximately 170 countries for the impacts of extreme weather-related events (i.e., storms, floods, and temper- ature extremes) on lives and associated socio-economic attributes showed that six Asian countries are among the most vulnera- ble countries, specifically, Bangladesh (rank 1), Myanmar (rank 2), Vietnam (rank 5), Philippines (rank 7), Mongolia (rank 9), and Tajik- istan (rank 10) (Harmeling, 2011). These countries are subjected to frequent weather disturbances that exacerbate the potential impacts of climate change on the biophysical, social, and economic attributes of the country. 0165-7836/$ – see front matter © 2013 Elsevier B.V. All rights reserved. http://dx.doi.org/10.1016/j.fishres.2013.07.007
Transcript of A framework for vulnerability assessment of coastal ...
Aefi
SMFa
b
c
d
e
a
ARRA
KVCC
1
mct(a(ea
0h
Fisheries Research 147 (2013) 381– 393
Contents lists available at ScienceDirect
Fisheries Research
jo u r n al homep age: www.elsev ier .com/ locate / f i shres
framework for vulnerability assessment of coastal fisheriescosystems to climate change—Tool for understanding resilience ofsheries (VA–TURF)
amuel S. Mamauaga,b,∗, Porfirio M. Alinoa,b, Renmar Jun S. Martineza,b, Richard N.uallil a,b,c, Maria Victoria A. Doctorb, Emerlinda C. Dizond, Rollan C. Geronimod,
leurdeliz M. Pangaa,b, Reniel B. Cabrala,b,e
Marine Science Institute, University of the Philippines Diliman, Quezon City 1101, PhilippinesMarine Environment and Resources Foundation, Inc., Marine Science Institute, University of the Philippines Diliman, Quezon City 1101 PhilippinesMindanao State University—Tawi-Tawi College of Technology and Oceanography, 7500 Bongao, Tawi-Tawi, PhilippinesConservation International—Philippines, Teachers Village, Diliman, Quezon City 1101, PhilippinesNational Institute of Physics, University of the Philippines Diliman, Quezon City 1101, Philippines
r t i c l e i n f o
rticle history:eceived 23 February 2013eceived in revised form 11 July 2013ccepted 15 July 2013
eywords:ulnerability assessmentoastal fisheries ecosystemlimate change
a b s t r a c t
Vulnerability assessment (VA) is increasingly developed and utilized in various sectors and fields of soci-ety. VA provides a better understanding of the interactions among system, pressures, and threats, whichserves as a basis for targeted adaptation strategies. The framework or tool named tool for understand-ing resilience of fisheries (VA–TURF) was developed to assess the vulnerability of the coastal fisheriesecosystems in the tropics to climate change. VA–TURF has three major components, namely, fisheries,reef ecosystem, and socio-economics. Although each component has intrinsic properties, the three com-ponents are strongly interrelated. Indicators associated to sensitivity, exposure, and adaptive capacitywere developed for each component of TURF. The exposure variable used was wave. VA–TURF usesinformation obtained through rapid assessments except for the reef ecosystem component. The analyt-ical approach for integrating scores is straightforward and devoid of highly sophisticated mathematicalmethods. The utility of VA–TURF primarily considers the fishers of a coastal community (barangay) as themajor stakeholder, thereby facilitating familiarization and community ownership of the tool. VA–TURFwas demonstrated in all the coastal barangays of two island municipalities (Lubang and Looc, Occidental
Mindoro, Philippines) located along the Verde Island Passage, which has the world’s highest marine shorefish biodiversity. Local stakeholders such as fishers, barangay leaders, residents, and local executive staffof the two municipalities participated in the process of scoring and determining the vulnerability of thesites during a series of workshops. The local-level fisheries vulnerability assessment framework devel-oped encourages community-level actions and provides opportunities for strategic actions and scaling-upnanc
of efforts at various gover. Introduction
Global and regional assessments have been initiated to deter-ine the vulnerability of countries to various impacts of climate
hange. Recently, the assessment of fisheries vulnerability athe national (country) level has attracted increasing interestAllison et al., 2009; Hughes et al., 2012). Some studies havelso focused on coastal community-level vulnerability assessment
VA) (e.g., Clark et al., 1998; Dolan and Walker, 2006; Cinnert al., 2012). In a study by Allison et al. (2009) on the vulner-bility of 132 national economies to potential climate change∗ Corresponding author. Tel.: +632 433 1806; fax: +632 433 1806.E-mail address: [email protected] (S.S. Mamauag).
165-7836/$ – see front matter © 2013 Elsevier B.V. All rights reserved.ttp://dx.doi.org/10.1016/j.fishres.2013.07.007
e levels.© 2013 Elsevier B.V. All rights reserved.
impacts on their capture fisheries, four countries in Asia areamong the most vulnerable economies, namely, Yemen, Pakistan,Bangladesh, and Cambodia. These countries are least developed,with high poverty levels and high reliance on fish for dietaryprotein.
The assessment of approximately 170 countries for the impactsof extreme weather-related events (i.e., storms, floods, and temper-ature extremes) on lives and associated socio-economic attributesshowed that six Asian countries are among the most vulnera-ble countries, specifically, Bangladesh (rank 1), Myanmar (rank 2),Vietnam (rank 5), Philippines (rank 7), Mongolia (rank 9), and Tajik-
istan (rank 10) (Harmeling, 2011). These countries are subjectedto frequent weather disturbances that exacerbate the potentialimpacts of climate change on the biophysical, social, and economicattributes of the country.
3 ies Res
(eosmcadofifCaPtte
anoucPpfteec(idipdTefrtohe(2uaatwsodSgiataeoiAP
82 S.S. Mamauag et al. / Fisher
In the recent studies by Hughes et al. (2012), Burke et al.2012), and Cabral et al. (2012, 2013a), the Philippines is consid-red “very vulnerable” or has “high urgency of threat” in termsf the ecological and social dimensions of sustainability (e.g., foodecurity, fisheries, and marine ecosystem). In the Philippines andany tropical countries, millions of people depend highly on the
oastal fisheries ecosystem for food and livelihood. These countriesre beset by wide-scale environmental issues such as overfishing,estructive fishing, sedimentation, pollution, and coastal devel-pment (Burke et al., 2012). The high degree of dependence onsheries by nearly 60% of the Philippine population and declining
ood fish intake are greatly concerning (SCTR-Philippines, 2012;abral et al., 2013a). Coastal fisheries are estimated to contributet least 5% of the gross domestic product of the country (SCTR-hilippines, 2012). However, fishers are considered the poorest ofhe poor sectors in the Philippine society (Castro, 2009) and thushe most vulnerable sector to climate change in terms of socio-conomic attributes.
Although the anthropogenic impacts of climate change maydd only a small increment at a short time scale relative to theormal climatic variability, the compounding impacts on the biol-gy of marine organisms can be immense (Brander, 2009). Thus,nderstanding climate change impacts is a challenge. Moreover,limate variability studies (i.e., El Nino–Southern Oscillation andacific Decadal Oscillation) have long indicated effects on manyelagic fisheries including changes in the recruitment patternsor tuna species (Lehodey et al., 2003) as well as regime shifts inuna, anchovy, and sardine fisheries in the Pacific Ocean (Chavezt al., 2003). The influence of climate variability (El Nino–La Ninavents) on the local sardine fishery in the Philippines provides cru-ial insights on climate change impacts on fisheries in the tropicsVillanoy et al., 2011). Brander (2007, 2009) suggested a strongnteraction between fishing and climate change, as shown by theirect (e.g., physiology, development rates, reproduction, behav-
or, and survival of individuals) and indirect effects (e.g., ecosystemrocesses as well as changes in the production of food or abun-ance of competitors, predators, and pathogens) of climate change.his finding provided an insightful perspective for the VA of fish-ries ecosystems and showed the usefulness of VA as an approachor adaptation (e.g., Allison et al., 2009). Information on climate-elated impacts for nearshore or demersal fisheries is only startingo emerge. Munday et al. (2008) conducted a comprehensive reviewf climate change impacts on coral reef fishes, many of which areighly targeted (e.g., Maypa et al., 2002; Cinner et al., 2009a). How-ver, the present state of most of these fisheries indicate overfishinge.g., McClanahan et al., 2008; Mamauag et al., 2009; Muallil et al.,012), which exacerbates the climate change impact. Therefore,rgent interventions with emphasis on the precautionary approachre needed (FAO, 2008). To illustrate an example in the Philippines,necdotal accounts among small-scale fishers (EBM, 2010) revealedhat the overexploitation of the fishing grounds in Bolinao (north-estern Luzon) (McManus, 1997) may have affected the supply of
iganid padas, which are juveniles of the reef fish Siganus fuscescens,n a fry fishery. The recruitment may also have been jeopardizeduring the 1998 and 2010 El Nino–Southern Oscillation (RESILIENTEAS, 2012). Siganid fisheries are predominantly associated to sea-rass and coral reefs. This fishery is important in many coastal areasn the Philippines (Soliman and Yamaoka, 2010a) and may serve as
model for demonstrating fishery interactions with sea surfaceemperature (SST) (e.g., Munday et al., 2008; Donelson et al., 2010)nd monsoonal variabilities (e.g., Takemura et al., 2004; Solimant al., 2010b). Such relationships may have been disrupted by the
ccurrence of SST anomalies, extremes in monsoons, as well asncrease in intensity and frequency of storms (e.g., Brander, 2009).nother study on a target species of the artisanal fisheries in thehilippines suggested that the reproduction and recruitment ofearch 147 (2013) 381– 393
the orange-spotted grouper Epinephelus coioides is associated withSST, tides, lunar periodicity, and monsoonal exposure (Mamauag,2011). Studies on E. coioides and its behavior as an ontoge-netic habitat shifter along a creek–mangrove–coral reef habitatcontinuum (Sheaves, 2005; Mamauag, 2011) may help in under-standing the potential impacts of climate change on nearshorefisheries.
The frequency and intensity of extreme climate events suchas floods, storms, and hurricanes, may have a major impact onfuture fisheries production in inland and marine systems (Brander,2007), resulting in socio-economic impacts on communities thatare highly dependent on fishing (Allison et al., 2009). A critical expo-sure factor that affects nearshore fisheries is wave. A coast that lacksphysical barrier and is exposed to prevalent winds as well as poten-tially long fetch will have a high wave exposure, which is enhancedduring storms (Villanoy et al., 2012).
Based on the VA framework (Intergovernmental Panel onClimate Change, 2001) as well as numerous issues and experiencesin the artisanal fisheries in the Philippines, we formulated a toolnamed tool for understanding resilience of fisheries (VA–TURF) todetermine the fisheries ecosystem vulnerabilities of local fishingvillages. The tool enables the identification of fishing communitiesthat are highly vulnerable to climate change impact. The scope ofthe developed VA tool extends beyond the basic fisheries aspectssuch as gears and catch rates, as it considers salient ecological andsocial features such as functionally important fish species, habitatconditions of the fisheries, and dependence of human communi-ties on fishing. VA–TURF focuses on the coastal or fishing village(barangay) as the spatial unit of analysis. As the smallest unitof management, the barangay is an appropriate model in under-standing habitat conditions and fisheries dynamics that are crucialfor strategic responses at the local or community level. Similarto the VA for marine fisheries developed by Johnson and Welch(2009), a simple semi-quantitative approach was adopted to pro-mote the use of VA for status assessment as well as developmentof actions and strategies in areas that are data-limited but neces-sitate urgent preparation for climate change. This approach doesnot require extensive datasets and can incorporate expert judg-ments as well as locally relevant knowledge to assess vulnerability.This approach can also identify fisheries with the highest vulner-ability and therefore priorities for adaptive actions. The VA–TURFvariables can be objective, using quantitative data such as catchrate, coral cover, population size, and annual income. The vari-ables can also be subjective, using expert opinion or qualitativedata such as change in catch composition and presence of adjacenthabitats.
2. Vulnerability assessment framework for assessing localfisheries
The framework for VA–TURF is consistent with those proposedin Intergovernmental Panel on Climate Change (2001), which indi-cated that vulnerability is a function of exposure, sensitivity, andadaptive capacity. We adopted the definitions of Licuanan et al.(2012) for the major components. Exposure quantifies the inten-sity or severity of the physical environment conditions that affectthe present state of the biophysical system. Sensitivity describesthe present state of the system based on the specific proper-ties that respond to the exposure factors arising from climatechanges. Adaptive capacity is the ability of the system to copewith the impacts associated with the changes in climate. Fish-
ing communities are highly vulnerable to climate change if theyare highly exposed to climate variability, their fish stocks arehighly sensitive in combination to other pressures such as over-fishing, and have low adaptive capacity (high reliance on fishing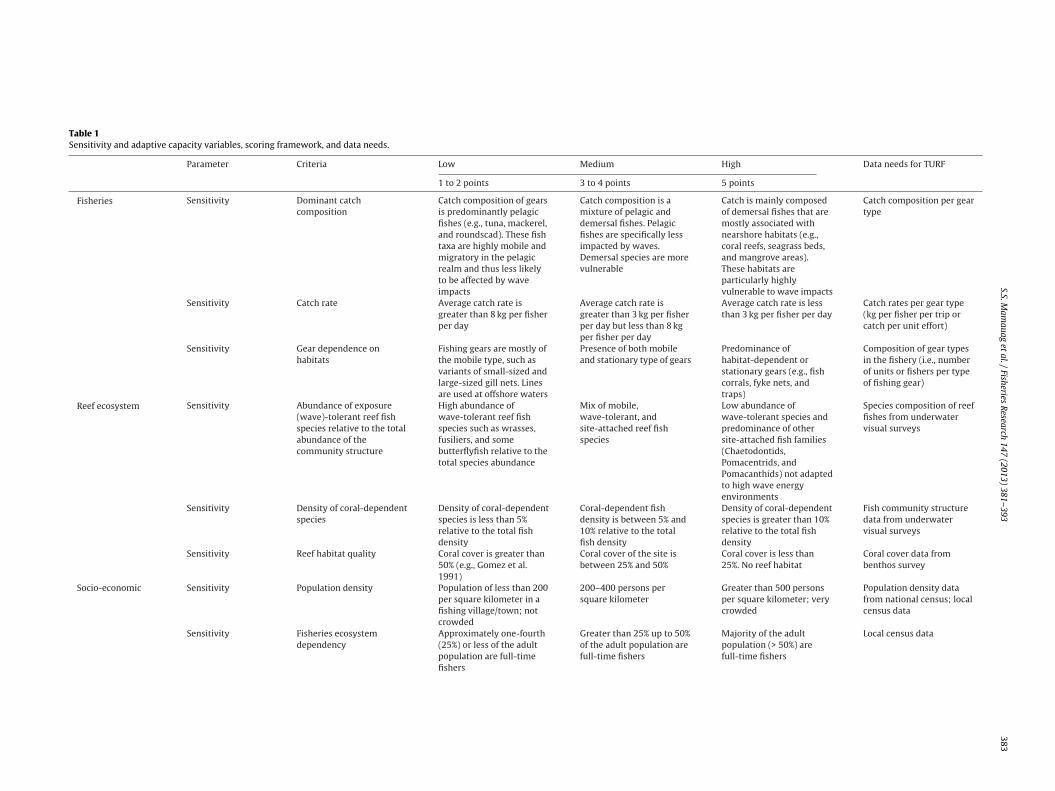
S.S. M
amauag
et al.
/ Fisheries
Research
147 (2013) 381– 393383
Table 1Sensitivity and adaptive capacity variables, scoring framework, and data needs.
Parameter Criteria Low Medium High Data needs for TURF
1 to 2 points 3 to 4 points 5 points
Fisheries Sensitivity Dominant catchcomposition
Catch composition of gearsis predominantly pelagicfishes (e.g., tuna, mackerel,and roundscad). These fishtaxa are highly mobile andmigratory in the pelagicrealm and thus less likelyto be affected by waveimpacts
Catch composition is amixture of pelagic anddemersal fishes. Pelagicfishes are specifically lessimpacted by waves.Demersal species are morevulnerable
Catch is mainly composedof demersal fishes that aremostly associated withnearshore habitats (e.g.,coral reefs, seagrass beds,and mangrove areas).These habitats areparticularly highlyvulnerable to wave impacts
Catch composition per geartype
Sensitivity Catch rate Average catch rate isgreater than 8 kg per fisherper day
Average catch rate isgreater than 3 kg per fisherper day but less than 8 kgper fisher per day
Average catch rate is lessthan 3 kg per fisher per day
Catch rates per gear type(kg per fisher per trip orcatch per unit effort)
Sensitivity Gear dependence onhabitats
Fishing gears are mostly ofthe mobile type, such asvariants of small-sized andlarge-sized gill nets. Linesare used at offshore waters
Presence of both mobileand stationary type of gears
Predominance ofhabitat-dependent orstationary gears (e.g., fishcorrals, fyke nets, andtraps)
Composition of gear typesin the fishery (i.e., numberof units or fishers per typeof fishing gear)
Reef ecosystem Sensitivity Abundance of exposure(wave)-tolerant reef fishspecies relative to the totalabundance of thecommunity structure
High abundance ofwave-tolerant reef fishspecies such as wrasses,fusiliers, and somebutterflyfish relative to thetotal species abundance
Mix of mobile,wave-tolerant, andsite-attached reef fishspecies
Low abundance ofwave-tolerant species andpredominance of othersite-attached fish families(Chaetodontids,Pomacentrids, andPomacanthids) not adaptedto high wave energyenvironments
Species composition of reeffishes from underwatervisual surveys
Sensitivity Density of coral-dependentspecies
Density of coral-dependentspecies is less than 5%relative to the total fishdensity
Coral-dependent fishdensity is between 5% and10% relative to the totalfish density
Density of coral-dependentspecies is greater than 10%relative to the total fishdensity
Fish community structuredata from underwatervisual surveys
Sensitivity Reef habitat quality Coral cover is greater than50% (e.g., Gomez et al.1991)
Coral cover of the site isbetween 25% and 50%
Coral cover is less than25%. No reef habitat
Coral cover data frombenthos survey
Socio-economic Sensitivity Population density Population of less than 200per square kilometer in afishing village/town; notcrowded
200–400 persons persquare kilometer
Greater than 500 personsper square kilometer; verycrowded
Population density datafrom national census; localcensus data
Sensitivity Fisheries ecosystemdependency
Approximately one-fourth(25%) or less of the adultpopulation are full-timefishers
Greater than 25% up to 50%of the adult population arefull-time fishers
Majority of the adultpopulation (> 50%) arefull-time fishers
Local census data
384S.S.
Mam
auag et
al. /
Fisheries R
esearch 147 (2013) 381– 393
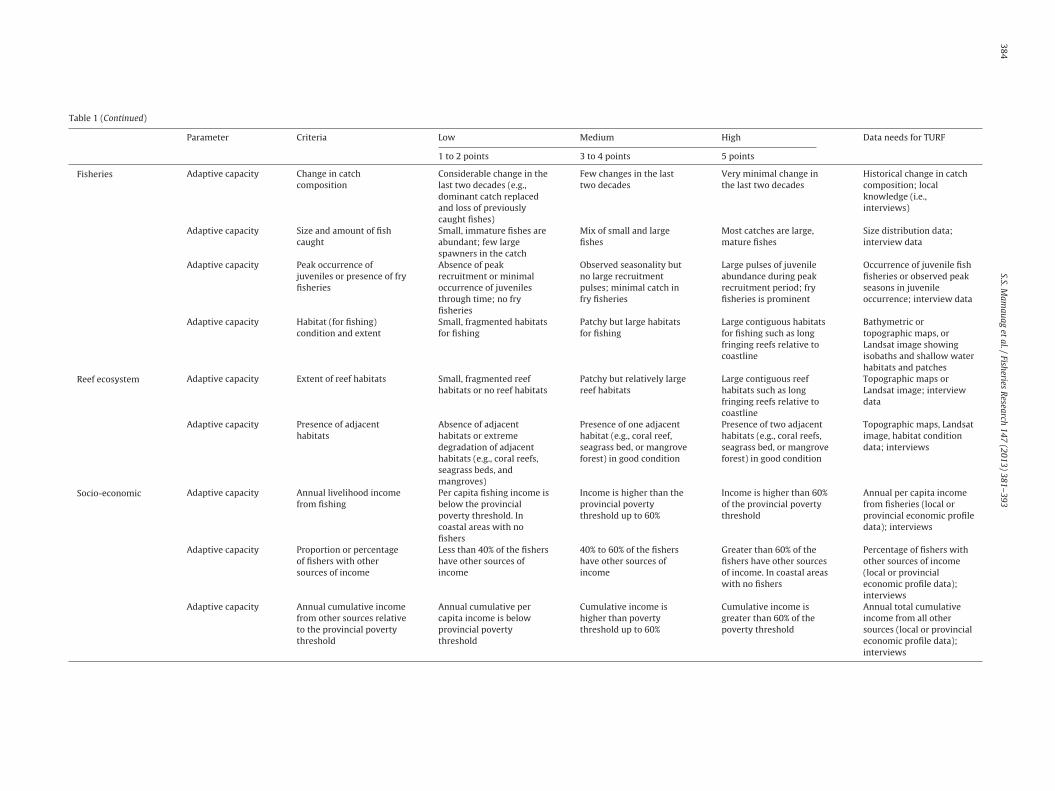
Table 1 (Continued)
Parameter Criteria Low Medium High Data needs for TURF
1 to 2 points 3 to 4 points 5 points
Fisheries Adaptive capacity Change in catchcomposition
Considerable change in thelast two decades (e.g.,dominant catch replacedand loss of previouslycaught fishes)
Few changes in the lasttwo decades
Very minimal change inthe last two decades
Historical change in catchcomposition; localknowledge (i.e.,interviews)
Adaptive capacity Size and amount of fishcaught
Small, immature fishes areabundant; few largespawners in the catch
Mix of small and largefishes
Most catches are large,mature fishes
Size distribution data;interview data
Adaptive capacity Peak occurrence ofjuveniles or presence of fryfisheries
Absence of peakrecruitment or minimaloccurrence of juvenilesthrough time; no fryfisheries
Observed seasonality butno large recruitmentpulses; minimal catch infry fisheries
Large pulses of juvenileabundance during peakrecruitment period; fryfisheries is prominent
Occurrence of juvenile fishfisheries or observed peakseasons in juvenileoccurrence; interview data
Adaptive capacity Habitat (for fishing)condition and extent
Small, fragmented habitatsfor fishing
Patchy but large habitatsfor fishing
Large contiguous habitatsfor fishing such as longfringing reefs relative tocoastline
Bathymetric ortopographic maps, orLandsat image showingisobaths and shallow waterhabitats and patches
Reef ecosystem Adaptive capacity Extent of reef habitats Small, fragmented reefhabitats or no reef habitats
Patchy but relatively largereef habitats
Large contiguous reefhabitats such as longfringing reefs relative tocoastline
Topographic maps orLandsat image; interviewdata
Adaptive capacity Presence of adjacenthabitats
Absence of adjacenthabitats or extremedegradation of adjacenthabitats (e.g., coral reefs,seagrass beds, andmangroves)
Presence of one adjacenthabitat (e.g., coral reef,seagrass bed, or mangroveforest) in good condition
Presence of two adjacenthabitats (e.g., coral reefs,seagrass bed, or mangroveforest) in good condition
Topographic maps, Landsatimage, habitat conditiondata; interviews
Socio-economic Adaptive capacity Annual livelihood incomefrom fishing
Per capita fishing income isbelow the provincialpoverty threshold. Incoastal areas with nofishers
Income is higher than theprovincial povertythreshold up to 60%
Income is higher than 60%of the provincial povertythreshold
Annual per capita incomefrom fisheries (local orprovincial economic profiledata); interviews
Adaptive capacity Proportion or percentageof fishers with othersources of income
Less than 40% of the fishershave other sources ofincome
40% to 60% of the fishershave other sources ofincome
Greater than 60% of thefishers have other sourcesof income. In coastal areaswith no fishers
Percentage of fishers withother sources of income(local or provincialeconomic profile data);interviews
Adaptive capacity Annual cumulative incomefrom other sources relativeto the provincial povertythreshold
Annual cumulative percapita income is belowprovincial povertythreshold
Cumulative income ishigher than povertythreshold up to 60%
Cumulative income isgreater than 60% of thepoverty threshold
Annual total cumulativeincome from all othersources (local or provincialeconomic profile data);interviews
ies Res
fWsetmwlsftmc
2
wd
mwEi4aa
22sttsmmticslroa
pfqm
2otcbSboahr8ctb
S.S. Mamauag et al. / Fisher
or food and livelihood) (e.g., Allison et al., 2009; Johnson andelch, 2009). The components are further divided into three
ub-components, namely, fisheries, reef ecosystem, and socio-conomics. Each sub-component incorporates variables relevanto evaluating sensitivity and adaptive capacity (Table 1 ), as deter-
ined based on the consensus agreement achieved from variousorkshops. The number of variables for each component was
imited from two to four for simplicity and to focus on the mostalient attributes in the context of climate change. The variablesor each component are outlined and discussed below. Most ofhe variables show qualitative to semi-quantitative categories to
ake the tool more comprehensible and easier to use by the localommunities.
.1. Fisheries
The fisheries aspect examines the type of fisheries in an areaith emphasis on the dominant gears used and its distribution,ominant catches, as well as historical catch patterns.
Unless otherwise indicated below, the rank categories (low,edium, and high) for all variables under the fisheries componentere established based on the fisheries dataset of the Community
cology (COMECO) Laboratory of the Marine Science Institute. Datanclude perception surveys of 2400 fishers from 240 barangays in0 municipalities in the Philippines, and from several test fishingnd fish landing site surveys in some of these municipalities (seelso Mamauag et al., 2009; Muallil et al., 2012, 2013).
.1.1. Sensitivity variables for the fisheries component
.1.1.1. Dominant catch composition. This variable relates to theensitivity of the dominant species or taxa in the catch. Specieshat are highly associated with nearshore habitats are more sensi-ive than those found mostly in the water column. More frequentevere storms and intensified wave surge can potentially deci-ate nearshore habitats such as coral reefs, sea grass beds, andangroves in varying degrees (Webster et al., 2005) and affect
he fisheries that these habitats support. Increasing SST, changesn oceanographic processes, and habitat loss caused by climatehange may result in recruitment failure especially of top demer-al species that typically possess a territorial adult stage. Habitatoss or diminished topographic complexity may also result in lowefuge potential of juveniles and/or adults. This scenario may alsoccur under SST anomalies, during which coral reef habitats areffected by bleaching events (Pratchett et al., 2008).
The categories (predominantly demersal, mix of demersal andelagic, and predominantly pelagic) are presented in a simpleorm to facilitate ease of scoring by local stakeholders. It is semi-uantitative, and thus scoring is mainly based on the majority orinority in the catch composition.
.1.1.2. Catch rate. This variable relates to the total catch in weightf catches per fisher per unit time. Catch rates are used as proxy forhe standing biomass of fish stocks. A high standing biomass indi-ates less sensitivity to climate change impact. Habitat decimationy large, destructive waves or bleached coral reefs in the case ofST may result in lower catches especially of demersal fish speciesecause of the displacement resulting from habitat loss. The impactf wave exposure on nearshore habitats with lower catches is char-cteristically greater than those with higher catches. Sensitivity isigh if catch rate is less than 3 kg per fisher per day, medium if catchate is 3–8 kg per fisher per day, and low if catch rate is greater than
kg per fisher per day. Catch-per-day rates can be used instead ofatch-per-hour rates, which require more data-intensive estima-ion. The latter can still be applied if sufficient data across all siteseing evaluated are available.
earch 147 (2013) 381– 393 385
2.1.1.3. Gear dependence on habitats. This variable relates to theinteraction between fishing gears and habitats in the contextof their vulnerability to climate change. The degradation ofnearshore habitats (coral reefs, seagrass beds, and mangroves)by storms, bleaching events (Pratchett et al., 2008), and tidalflooding/inundation have concomitant deleterious effects on targetspecies dependent on these habitats. Fishing gears that are highlyassociated with these habitats (e.g., Cinner et al., 2009a) have thesame vulnerability. Hence, gear dependence manifests an intrin-sic attribute of the fisheries, whereby catch (rate and composition)is affected by the reduction of this dependence following habitatdegradation. Artisanal fishers in the Philippines use fish corrals(nets attached to wooden frames), which are semi-permanentlyfixed on shallow habitats such as seagrass beds for long durationsand mainly catch various demersal species including juvenile fish.These are considered as the most sensitive gear, whereas gears thatare not dependent on shallow habitats and used offshore such asdrift gill net and hook and line are the least sensitive.
2.1.2. Adaptive capacity variables for the fisheries component2.1.2.1. Change in catch composition. The effect of fishing is clearlyshown by changes in catch composition. Large-bodied species areintensively targeted and thus undergo reduction before smallerones (e.g., Pauly et al., 1998). Catch composition is altered becauseof the changes in species composition based on size. The rates andprocess of potential recovery of the fish stocks in the communitystructure can be determined based on the change in catch compo-sition (e.g., Jennings, 2001).
The significant losses in species diversity shown by the changesin catch composition indicate lower adaptive capacity. Disturb-ance by storms and destructive waves as well as increasing watertemperature affect fish assemblage differentially. After an impact,the assemblage or community structure with more species has agreater tendency to revert to its former state in a shorter time thana community with lower species richness (e.g., McClanahan et al.,2011).
Based on fishers’ historical accounts from interview data ofCOMECO, catch rates in the Philippines started to rapidly drop inthe 1980s and then further declined in the 1990s. This trend wasalso reflected in catch composition, with previous top target speciesreplaced by other species in the present decade thus forming thebasis of the categories established in this variable.
2.1.2.2. Size and amount of fish caught. Size selectivity and fishingintensity can reduce the mean size and abundance of fish, whichhave implications on size (age) at sexual maturity and reproductiveoutput (e.g., Sadovy, 1996). Fishing affects the abundance of demo-graphic classes such as that of sexually mature adults (spawningindividuals), which are selectively targeted because of their largersize. Populations with numerous large, likely spawning individualshave higher adaptive capacity than those with fewer spawners.
2.1.2.3. Peak occurrence of juveniles or presence of fry fisheries. Therecruitment pulse or observed increase in the densities of juvenilesof a species at particular periods can be a proxy for recruit-ment patterns (e.g., Srinivasan and Jones, 2006). In fisheries, theharvest of fry, fingerling, or juveniles of target fish species at spe-cific periods indicate their recruitment season (e.g., Soliman andYamaoka, 2010a; Mamauag, 2011). Recruitment is important in thereplenishment of fish populations because large recruitment pulsespotentially enhance populations or stocks through time (e.g., Caleyet al., 1996). Recruitment studies on some reef fish species have
demonstrated seasonality, which can be attributed to biological(e.g., reproduction and larval supply) and physical (e.g., water circu-lation and temperature) factors in sites (e.g., Sponaugle et al., 2006;Abesamis and Russ, 2010). Some of these fishes exhibit restricted
3 ies Res
r(tbmi
nmruotGenoep2mpir
te
2awbicsfgwsl
b(
2
stscwsa(ae
vttBah
86 S.S. Mamauag et al. / Fisher
ecruitment periods, whereas the others show extended seasonsSrinivasan and Jones, 2006). In the Philippines, fry fisheries targethe juvenile stage of several species such as milkfish, grouper, rab-itfish, and anchovies (dulong) (e.g., Mamauag, 2011). Increasingortality at this life stage can adversely affect population replen-
shment (e.g., Cabral et al., 2013b).Fry fisheries in the Philippines are highly associated with
earshore habitats such as seagrasses and mangroves; however,any of these are considerably degraded, and their cover is highly
educed (SCTR-Philippines, 2012). Grouper fry catch in one partic-lar site (Calauag, Quezon, Philippines) have decreased by severalrders of magnitude given the proximity of the settlement habi-ats to fishing pressure (Mamauag et al., 2009; Mamauag, 2011).iven the paucity of a comprehensive management for fry fish-ries in the Philippines, immediate management intervention iseeded which should also be in conjunction with the managementf the adults. Some reef fishes (e.g., groupers, rabbitfish, snappers,mperors, etc.) undergo ontogenetic habitat movement encom-assing the mangrove–seagrass–coral reef continuum (Mumby,006; Nagelkerken, 2009). In the context of population replenish-ent, fishing pressure, and climate change impacts, fish exhibiting
eak recruitment with large pulses despite time restrictions mayndicate higher adaptive capacity than fish that hardly demonstrateecruitment peaks or periodically undergo weak recruitment.
The categories for this variable were defined based on studies onhe occurrence of grouper juveniles in the Philippines (Mamauagt al., 2001; Mamauag, 2011).
.1.2.4. Habitat (for fishing) condition and extent. Fishery catch rateslso depend on the condition and extent of the “fishing grounds,”hich include shallow water habitats such as coral reefs, seagrass
eds, and mangrove areas. High catch rates are likely observedn extensive habitats in good condition because of high habitatomplexity or heterogeneity (e.g., Wilson et al., 2006, 2008), moreuitable sites for recruitment (e.g., Man et al., 1995), adequate sizeor movement (e.g., Maypa et al., 2012), presence of spawningrounds (e.g., Zeller, 1998), and thus high abundance, biomass, asell as production. By contrast, fragmented and degraded habitats
how lower catch rates resulting from low habitat heterogeneity,ow recruitment, etc.
Data on gear distribution and extent of fishing areas gatheredy COMECO were used for defining the categories for this variablesee also Muallil et al., 2012).
.2. Reef ecosystem
The basic life history characteristics and behavior of a targetpecies are important biological features that provide insights intohe vulnerability of fisheries (Brander, 2007). Thus, the ecologicalignificance of the habitats of the target species is emphasized,onsidering their interaction with other species and connectivityith other nearshore habitats. These relationships are crucial for
urvivorship in a temporal and spatial dimension. Other key vari-bles include the community structure of site-attached organismse.g., reef fishes) and their associated habitats (e.g., corals), whichre the best indicators of climate change impacts (e.g., Mundayt al., 2009; Pratchett et al., 2008).
One thousand transects from fish visual census (FVC) sur-ey in the Philippines (i.e., COMECO dataset) were examinedo establish the categories of the sensitivity variables (wave-
olerant fish and coral-dependent fish) under this component.enthos data from COMECO was also considered to define the vari-bles of habitat quality, habitat extent, and presence of adjacentabitats.earch 147 (2013) 381– 393
2.2.1. Sensitivity variables for the reef ecosystem component2.2.1.1. Abundance of exposure (wave)-tolerant reef fish speciesrelative to the total abundance of the community structure. The abun-dance of wave-tolerant species (i.e., strong swimmers) in a reef siteshows an intrinsic property of the fish community structure as aresponse to climate-related factors such as wave. Fishes that arestrong swimmers and highly mobile can withstand wave turbu-lence compared with fishes that are not accustomed to high waveenergy environments (Fulton and Bellwood, 2005; Fulton et al.,2005).
The low, medium, and high categories were determined on thebasis of the percent abundance of strong swimming fishes relativeto other fishes at the family level.
2.2.1.2. Density of coral-dependent species. Reef fishes that arehighly dependent on corals are the most vulnerable to climate-related phenomena such as coral bleaching (Pratchett et al., 2008).Coral bleaching diminishes coral cover and topographic complex-ity, thereby negatively affecting the abundance of coral-dependentspecies. In relation to wave impact, increasing intensity and waveheight will likely demolish some species of corals such as those ofthe branching type and therefore reduce topographic complexity.Such damage affects reef fish species that depend on these typesof corals for food or shelter, which may result in their displace-ment. Changes in distribution are a short-term effect, and impairedrecruitment due to habitat loss is a long-term effect.
Using Pratchett et al.’s (2008) list of coral-dependent fishes, FVCdata were examined to determine the percent abundance or densityof coral-dependent fishes in each category (low, medium, and high).
2.2.1.3. Reef habitat quality. This variable relates to the conditionand extent of reef habitats, which influences the abundance, diver-sity, and population size of reef fishes that are highly dependenton them (e.g., Booth and Beretta, 2002). Low coral cover and/orless contiguous reefs may have fewer species and lower abun-dance, whereas reefs with larger cover and/or more contiguoushabitats may have more species and higher abundance. Wave andSST impacts are expected to be greater in sites with few speciesand low abundance than those with high species richness and highabundance. Therefore, habitats of low quality may be more vulner-able.
Benthos data and the categories in coral cover by Gomez et al.(1994) were used to derive the categories for this variable.
2.2.2. Adaptive capacity variables for the reef ecosystemcomponent2.2.2.1. Habitat extent. Extensive habitats or expansive reefs mayharbor several targeted reef fish species, which has significantimplications on fish populations and communities (Pratchett et al.,2008). Extensive reef habitats may reflect high coral species rich-ness or high habitat complexity and serve as refugia for adultsand juvenile coral-dependent species (e.g., Graham et al., 2006;Munday, 2004). Jones et al. (2004) estimated that 65% of the fishspecies in the reefs they studied preferentially settle in or nearlive coral. Large areas of reefs are also crucial for the spawning ofsome reef fishes, especially highly mobile fishes such as groupers.Zeller (1997, 1998) showed that the coral trout Plectropomus leop-ardus moves more than a kilometer from its home range to formspawning aggregations at a site where it has previously spawned.
2.2.2.2. Presence of adjacent habitats. The presence of adjacent non-reef habitats such as seagrass beds and mangrove forests enhances
the connectivity of the sites that are important for fish survivorshipat different life stages. Habitats and populations that are connectedto each other enhance the health or condition of the interconnectedhabitats as a whole. The recovery of a devastated portion depends
ies Res
otloh(e(
2
fipdfsuoac
oifii2coih
aPtapt
22caoottwtathta
leaaHa1
st
S.S. Mamauag et al. / Fisher
n the adjacent habitats (Cowen and Sponaugle, 2009). Habitatshat are not affected by the climate stressor serve as sources ofarvae or refuge sites. This aspect also indicates the importancef ontogenetic habitat migration. Several reef fish species utilizeabitats other than coral reefs for their survivorship and growthe.g., Mumby, 2006; Nagelkerken, 2009; Mamauag, 2011). The cat-gories for this variable were established according to Mamauag2011) with supplementary information from the benthos data.
.3. Socio-economics
Socio-economic factors are extremely important in measuringsheries vulnerability because of the tight relationship betweeneople and fisheries resources. Communities that are highlyependent on fishing are likely to be vulnerable to climate-relatedactors such as elevated SST, increasing storm frequency, and waveurge (e.g., Allison et al., 2009). Population density, fisher pop-lation size, fishing dependency, and incomes from fishing andther livelihoods are some key indicators for the socio-economicssessment of fisheries (e.g., McClanahan et al., 2006) in relation tolimate change (Allison et al., 2009).
Population size and its corresponding degree of dependencen fisheries is a reasonable proxy indicator. The potential impactncreases with the number of fishers who depend highly on theshery. In addition, the fishers’ capacity to shift to other sources of
ncome indicates greater adaptive capacity (e.g., McClanahan et al.,008). Therefore, the socio-economic vulnerability of the fishingommunity can be measured based on the population size, levelf dependence on fisheries, annual household income from fish-ng, number of fishers with other sources of income, and annualousehold income derived from other sources.
Information on population density, fisher density, fisher incomend other sources of income from 40 coastal municipalities in thehilippines (i.e., COMECO dataset), and from Municipal Profiles andhe National Statistics Office were evaluated to establish the vari-bles and their thresholds under this component. Information onoverty threshold were obtained from Provincial Profiles and fromhe National Economic Development Authority.
.3.1. Sensitivity variables for the socio-economic component
.3.1.1. Population density. The number of people living in a coastalommunity is an important metric for determining sensitivity tony perturbation including climate change. The state or conditionf a coastal fishery is highly dependent on the degree of utilizationf the resource users. The greater the number of resource users,he higher the pressure (e.g., Pauly, 1990). Therefore, this rela-ionship reflects an intrinsic socio-economic property of fisheries,hich can further demonstrate the impact by climate change. On
he other hand, extrinsic market-based factors (Cinner et al., 2009b)re adaptive capacity concerns that will be considered also. Whilehe proxy used here is the state of their income and other liveli-ood streams in the participatory context, this is acknowledged ashe more appropriate sensitivity criteria because it is an intrinsicttribute of social–ecological systems.
A major caveat of this criterion is the assumption that someand areas in coastal barangays are not habitable because of highlevation although this information is not readily known for manyreas. Congested areas or the crowdedness of built structures suchs houses at the coasts may be considered as a proxy indicator.owever, caution should be observed because some settlementreas may represent traditional or tenurial fisheries (e.g., Fox,
977).In 2010, the National Statistics Office reported an average den-ity of 308 people per square kilometer, which was considered ashe medium category in this study.
earch 147 (2013) 381– 393 387
2.3.1.2. Fisheries ecosystem dependency. This attribute providesvital information on the importance of fisheries to the well-being ofthe community. The proportion of the fishers relative to the totalpopulation indicates the significance of fisheries in an area. Themore fishers present in the community, the higher the dependencyon fishing. Many coastal communities of developing countries inthe tropics depend largely on fishery resources for food and liveli-hood (Allison et al., 2009; Cinner et al., 2009b; Muallil et al., 2011;Cabral et al., 2013a).
2.3.2. Adaptive capacity variables for the socio-economiccomponent2.3.2.1. Annual livelihood income from fishing. The per capitaincome of fishers from fishing is a common indicator for charac-terizing the economic profile of a community (e.g., Muallil et al.,2011). This economic indicator may be considered for a coastalfishing community that may be affected by a climate changestressor (e.g., Allison et al., 2009). This indicator is intrinsic tothe socio-economic system of a community and can be used asa metric for determining its adaptive capacity when subjected toclimate change stressors. A higher average income of the fishersreflects a higher capacity of the community to adapt to a changingclimate.
Given that the poverty threshold is a critical level for sur-vival, adaptive capacity is considered low when income is belowthis level, medium when income is above this level and upto 60% higher than this level, and high when income is abovethe 60% level. We posit the threshold of 60% from the povertyline as a very conservative level. Income below this level repre-sents a cause for alarm that should be addressed immediately.In contrast, exceeding the 60% level signifies a high degree ofconfidence.
2.3.2.2. Proportion or percentage of fishers with other sources ofincome. Some fishers in coastal areas especially large islandsengage in other income-generating livelihoods such as farming,public work services, construction, and public transportation ser-vices, among others (e.g., Muallil et al., 2011). A community hasa higher adaptive capacity if more fishers have supplementallivelihoods or other sources of income. Similar to the povertythreshold category, the 60% threshold level, which represents a highadaptive capacity for this variable, is a conservative metric. Lowadaptive capacity (below 40%) also demonstrates a conservativeestimate.
2.3.2.3. Annual cumulative income from other sources relative to theprovincial poverty threshold. The availability of income-generatinglivelihoods other than fishing potentially provides a fishing com-munity with a higher capacity to adapt when their fisheries areimpacted by climate changes. Multiple and multisectoral sourcesof income (e.g., supplemental livelihood) that are accessible to fish-ers may increase cumulative income. However, the potential to beemployed in any of these livelihoods will depend considerably onthe skill of the person (e.g., Cabral and Alino, 2011; Muallil et al.,2011; Marshall et al., 2012).
2.4. Wave exposure
Although VA–TURF can also take into account temperature, theexposure variable considered in this work is the wave exposure ofthe area (Villanoy et al., 2012; Salamante and Villanoy, 2012). Wave
exposure is derived using the Wave Exposure Model software fromthe National Oceanic and Atmospheric Administration. The modelconsiders wind, local topography including the shoreline, and thebathymetry of the area.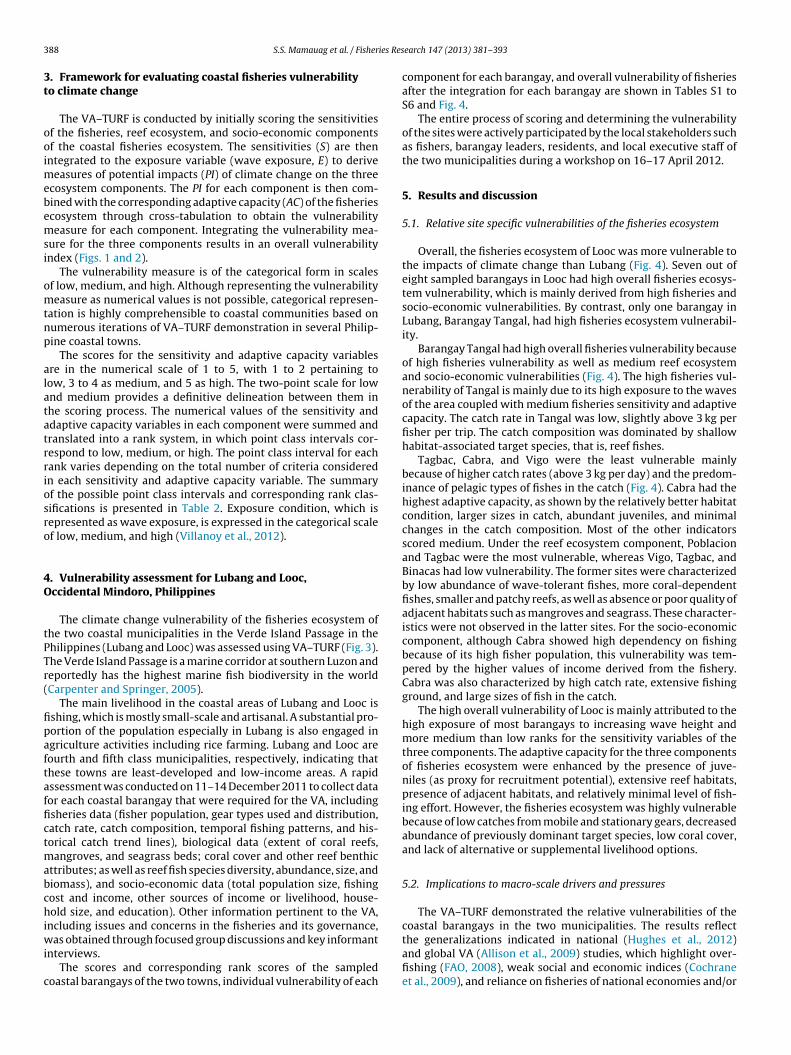
3 ies Res
3t
ooimebemsi
omtnp
alatatrriosro
4O
tPTr(
fipaftaffictmabchiwi
c
88 S.S. Mamauag et al. / Fisher
. Framework for evaluating coastal fisheries vulnerabilityo climate change
The VA–TURF is conducted by initially scoring the sensitivitiesf the fisheries, reef ecosystem, and socio-economic componentsf the coastal fisheries ecosystem. The sensitivities (S) are thenntegrated to the exposure variable (wave exposure, E) to derive
easures of potential impacts (PI) of climate change on the threecosystem components. The PI for each component is then com-ined with the corresponding adaptive capacity (AC) of the fisheriescosystem through cross-tabulation to obtain the vulnerabilityeasure for each component. Integrating the vulnerability mea-
ure for the three components results in an overall vulnerabilityndex (Figs. 1 and 2).
The vulnerability measure is of the categorical form in scalesf low, medium, and high. Although representing the vulnerabilityeasure as numerical values is not possible, categorical represen-
ation is highly comprehensible to coastal communities based onumerous iterations of VA–TURF demonstration in several Philip-ine coastal towns.
The scores for the sensitivity and adaptive capacity variablesre in the numerical scale of 1 to 5, with 1 to 2 pertaining toow, 3 to 4 as medium, and 5 as high. The two-point scale for lownd medium provides a definitive delineation between them inhe scoring process. The numerical values of the sensitivity anddaptive capacity variables in each component were summed andranslated into a rank system, in which point class intervals cor-espond to low, medium, or high. The point class interval for eachank varies depending on the total number of criteria consideredn each sensitivity and adaptive capacity variable. The summaryf the possible point class intervals and corresponding rank clas-ifications is presented in Table 2. Exposure condition, which isepresented as wave exposure, is expressed in the categorical scalef low, medium, and high (Villanoy et al., 2012).
. Vulnerability assessment for Lubang and Looc,ccidental Mindoro, Philippines
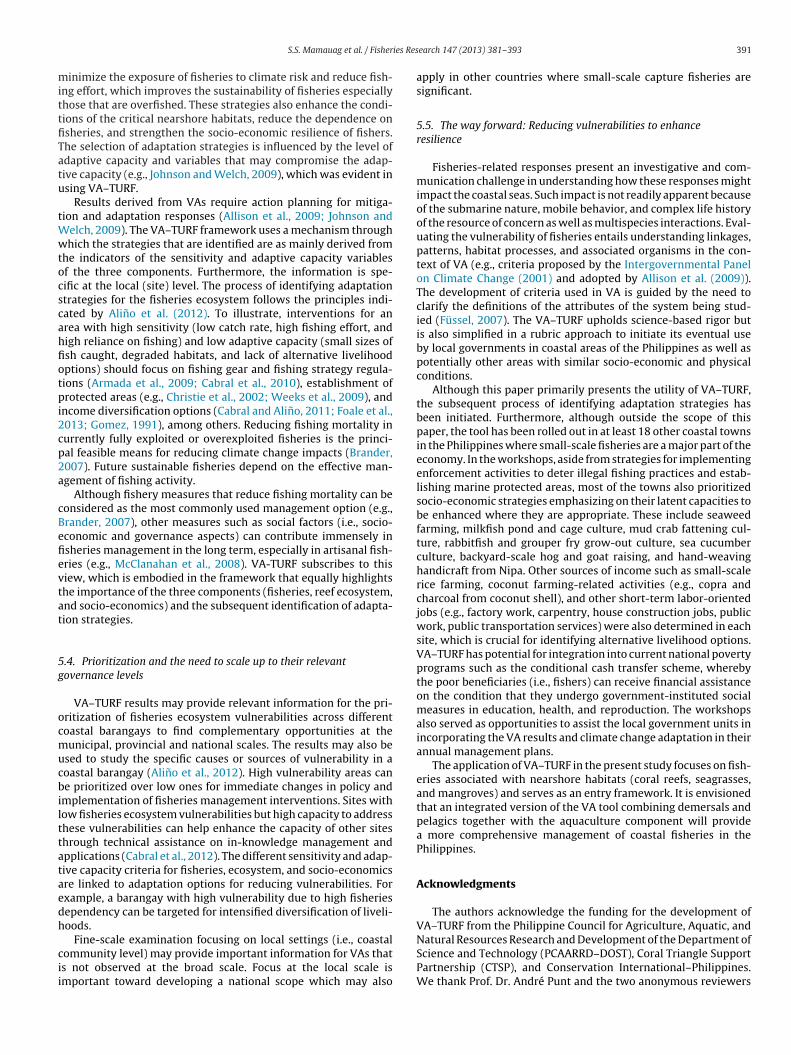
The climate change vulnerability of the fisheries ecosystem ofhe two coastal municipalities in the Verde Island Passage in thehilippines (Lubang and Looc) was assessed using VA–TURF (Fig. 3).he Verde Island Passage is a marine corridor at southern Luzon andeportedly has the highest marine fish biodiversity in the worldCarpenter and Springer, 2005).
The main livelihood in the coastal areas of Lubang and Looc isshing, which is mostly small-scale and artisanal. A substantial pro-ortion of the population especially in Lubang is also engaged ingriculture activities including rice farming. Lubang and Looc areourth and fifth class municipalities, respectively, indicating thathese towns are least-developed and low-income areas. A rapidssessment was conducted on 11–14 December 2011 to collect dataor each coastal barangay that were required for the VA, includingsheries data (fisher population, gear types used and distribution,atch rate, catch composition, temporal fishing patterns, and his-orical catch trend lines), biological data (extent of coral reefs,
angroves, and seagrass beds; coral cover and other reef benthicttributes; as well as reef fish species diversity, abundance, size, andiomass), and socio-economic data (total population size, fishingost and income, other sources of income or livelihood, house-old size, and education). Other information pertinent to the VA,
ncluding issues and concerns in the fisheries and its governance,
as obtained through focused group discussions and key informantnterviews.The scores and corresponding rank scores of the sampled
oastal barangays of the two towns, individual vulnerability of each
earch 147 (2013) 381– 393
component for each barangay, and overall vulnerability of fisheriesafter the integration for each barangay are shown in Tables S1 toS6 and Fig. 4.
The entire process of scoring and determining the vulnerabilityof the sites were actively participated by the local stakeholders suchas fishers, barangay leaders, residents, and local executive staff ofthe two municipalities during a workshop on 16–17 April 2012.
5. Results and discussion
5.1. Relative site specific vulnerabilities of the fisheries ecosystem
Overall, the fisheries ecosystem of Looc was more vulnerable tothe impacts of climate change than Lubang (Fig. 4). Seven out ofeight sampled barangays in Looc had high overall fisheries ecosys-tem vulnerability, which is mainly derived from high fisheries andsocio-economic vulnerabilities. By contrast, only one barangay inLubang, Barangay Tangal, had high fisheries ecosystem vulnerabil-ity.
Barangay Tangal had high overall fisheries vulnerability becauseof high fisheries vulnerability as well as medium reef ecosystemand socio-economic vulnerabilities (Fig. 4). The high fisheries vul-nerability of Tangal is mainly due to its high exposure to the wavesof the area coupled with medium fisheries sensitivity and adaptivecapacity. The catch rate in Tangal was low, slightly above 3 kg perfisher per trip. The catch composition was dominated by shallowhabitat-associated target species, that is, reef fishes.
Tagbac, Cabra, and Vigo were the least vulnerable mainlybecause of higher catch rates (above 3 kg per day) and the predom-inance of pelagic types of fishes in the catch (Fig. 4). Cabra had thehighest adaptive capacity, as shown by the relatively better habitatcondition, larger sizes in catch, abundant juveniles, and minimalchanges in the catch composition. Most of the other indicatorsscored medium. Under the reef ecosystem component, Poblacionand Tagbac were the most vulnerable, whereas Vigo, Tagbac, andBinacas had low vulnerability. The former sites were characterizedby low abundance of wave-tolerant fishes, more coral-dependentfishes, smaller and patchy reefs, as well as absence or poor quality ofadjacent habitats such as mangroves and seagrass. These character-istics were not observed in the latter sites. For the socio-economiccomponent, although Cabra showed high dependency on fishingbecause of its high fisher population, this vulnerability was tem-pered by the higher values of income derived from the fishery.Cabra was also characterized by high catch rate, extensive fishingground, and large sizes of fish in the catch.
The high overall vulnerability of Looc is mainly attributed to thehigh exposure of most barangays to increasing wave height andmore medium than low ranks for the sensitivity variables of thethree components. The adaptive capacity for the three componentsof fisheries ecosystem were enhanced by the presence of juve-niles (as proxy for recruitment potential), extensive reef habitats,presence of adjacent habitats, and relatively minimal level of fish-ing effort. However, the fisheries ecosystem was highly vulnerablebecause of low catches from mobile and stationary gears, decreasedabundance of previously dominant target species, low coral cover,and lack of alternative or supplemental livelihood options.
5.2. Implications to macro-scale drivers and pressures
The VA–TURF demonstrated the relative vulnerabilities of thecoastal barangays in the two municipalities. The results reflect
the generalizations indicated in national (Hughes et al., 2012)and global VA (Allison et al., 2009) studies, which highlight over-fishing (FAO, 2008), weak social and economic indices (Cochraneet al., 2009), and reliance on fisheries of national economies and/or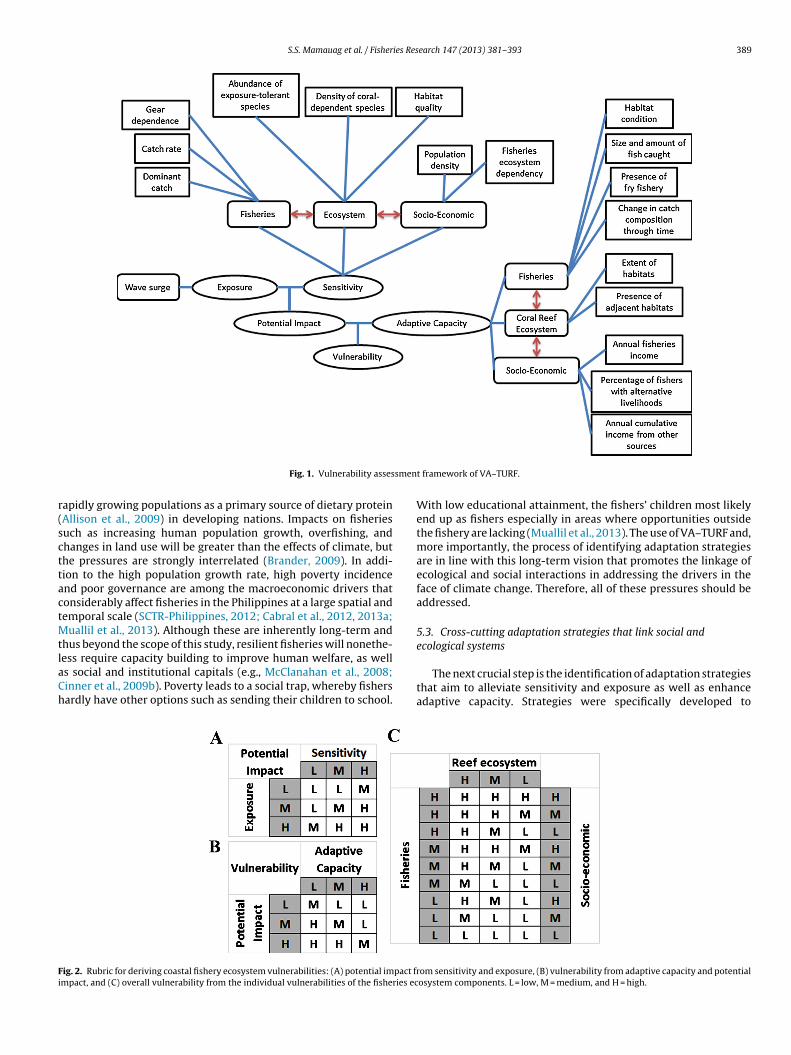
S.S. Mamauag et al. / Fisheries Research 147 (2013) 381– 393 389
smen
r(scttactMtlaCh
Fi
Fig. 1. Vulnerability asses
apidly growing populations as a primary source of dietary proteinAllison et al., 2009) in developing nations. Impacts on fisheriesuch as increasing human population growth, overfishing, andhanges in land use will be greater than the effects of climate, buthe pressures are strongly interrelated (Brander, 2009). In addi-ion to the high population growth rate, high poverty incidencend poor governance are among the macroeconomic drivers thatonsiderably affect fisheries in the Philippines at a large spatial andemporal scale (SCTR-Philippines, 2012; Cabral et al., 2012, 2013a;
uallil et al., 2013). Although these are inherently long-term andhus beyond the scope of this study, resilient fisheries will nonethe-
ess require capacity building to improve human welfare, as wells social and institutional capitals (e.g., McClanahan et al., 2008;inner et al., 2009b). Poverty leads to a social trap, whereby fishersardly have other options such as sending their children to school.ig. 2. Rubric for deriving coastal fishery ecosystem vulnerabilities: (A) potential impact frmpact, and (C) overall vulnerability from the individual vulnerabilities of the fisheries ec
t framework of VA–TURF.
With low educational attainment, the fishers’ children most likelyend up as fishers especially in areas where opportunities outsidethe fishery are lacking (Muallil et al., 2013). The use of VA–TURF and,more importantly, the process of identifying adaptation strategiesare in line with this long-term vision that promotes the linkage ofecological and social interactions in addressing the drivers in theface of climate change. Therefore, all of these pressures should beaddressed.
5.3. Cross-cutting adaptation strategies that link social andecological systems
The next crucial step is the identification of adaptation strategiesthat aim to alleviate sensitivity and exposure as well as enhanceadaptive capacity. Strategies were specifically developed to
om sensitivity and exposure, (B) vulnerability from adaptive capacity and potentialosystem components. L = low, M = medium, and H = high.

390 S.S. Mamauag et al. / Fisheries Research 147 (2013) 381– 393
Table 2Point class interval and corresponding rank classifications for the sensitivity and adaptive capacity components of the fisheries ecosystem.
Fisheries ecosystem Number ofvariables
Minimum totalscore possible
Maximum totalscore possible
Point class interval (score to ranksystem conversion)
FisheriesSensitivity 3 3 15 3–7 → Low (L)
8–11 → Medium (M)12–15 → High (H)
Adaptive capacity 4 4 20 4–9 → Low (L)10–15 → Medium (M)16–20 → High (H)
Reef ecosystemSensitivity 3 3 15 3–7 → Low (L)
8–11 → Medium (M)12–15 → High (H)
Adaptive capacity 2 2 10 2–4 → Low (L)5–7 → Medium (M)8–10 → High (H)
Socio-economicsSensitivity 2 2 10 2–4 → Low (L)
5–7 → Medium (M)8–10 → High (H)
Adaptive capacity 3 3 15 3–7 → Low (L)8–11 → Medium (M)12–15 → High (H)
Fig. 3. Map of the study sites (barangays) in Lubang and Looc.
Fig. 4. Overall fisheries ecosystem vulnerability to climate change of the sampled barangays. Labels are: 1—Cabra, 2—Tagbac, 3—Poblacion, 4—Tangal, 5—Binacas, 6—Maliig,7—Vigo, 8—Tilik, 9—Balikyas, 10—Burol, 11—Agkawayan, 12—Kanluran, 13—Guitna, 14—Bonbon, 15—Talaotao, 16—Ambil, 17—Bulacan. Labels 1 to 8 are barangays of Lubang,and 9 to 17 of Looc.
ies Res
mittfiTatu
tWwtocscahfiotpi2cp2a
cBefievtat
5g
ocmucbilttataedh
cii
S.S. Mamauag et al. / Fisher
inimize the exposure of fisheries to climate risk and reduce fish-ng effort, which improves the sustainability of fisheries especiallyhose that are overfished. These strategies also enhance the condi-ions of the critical nearshore habitats, reduce the dependence onsheries, and strengthen the socio-economic resilience of fishers.he selection of adaptation strategies is influenced by the level ofdaptive capacity and variables that may compromise the adap-ive capacity (e.g., Johnson and Welch, 2009), which was evident insing VA–TURF.
Results derived from VAs require action planning for mitiga-ion and adaptation responses (Allison et al., 2009; Johnson and
elch, 2009). The VA–TURF framework uses a mechanism throughhich the strategies that are identified are as mainly derived from
he indicators of the sensitivity and adaptive capacity variablesf the three components. Furthermore, the information is spe-ific at the local (site) level. The process of identifying adaptationtrategies for the fisheries ecosystem follows the principles indi-ated by Alino et al. (2012). To illustrate, interventions for anrea with high sensitivity (low catch rate, high fishing effort, andigh reliance on fishing) and low adaptive capacity (small sizes ofsh caught, degraded habitats, and lack of alternative livelihoodptions) should focus on fishing gear and fishing strategy regula-ions (Armada et al., 2009; Cabral et al., 2010), establishment ofrotected areas (e.g., Christie et al., 2002; Weeks et al., 2009), and
ncome diversification options (Cabral and Alino, 2011; Foale et al.,013; Gomez, 1991), among others. Reducing fishing mortality inurrently fully exploited or overexploited fisheries is the princi-al feasible means for reducing climate change impacts (Brander,007). Future sustainable fisheries depend on the effective man-gement of fishing activity.
Although fishery measures that reduce fishing mortality can beonsidered as the most commonly used management option (e.g.,rander, 2007), other measures such as social factors (i.e., socio-conomic and governance aspects) can contribute immensely insheries management in the long term, especially in artisanal fish-ries (e.g., McClanahan et al., 2008). VA-TURF subscribes to thisiew, which is embodied in the framework that equally highlightshe importance of the three components (fisheries, reef ecosystem,nd socio-economics) and the subsequent identification of adapta-ion strategies.
.4. Prioritization and the need to scale up to their relevantovernance levels
VA–TURF results may provide relevant information for the pri-ritization of fisheries ecosystem vulnerabilities across differentoastal barangays to find complementary opportunities at theunicipal, provincial and national scales. The results may also be
sed to study the specific causes or sources of vulnerability in aoastal barangay (Alino et al., 2012). High vulnerability areas cane prioritized over low ones for immediate changes in policy and
mplementation of fisheries management interventions. Sites withow fisheries ecosystem vulnerabilities but high capacity to addresshese vulnerabilities can help enhance the capacity of other siteshrough technical assistance on in-knowledge management andpplications (Cabral et al., 2012). The different sensitivity and adap-ive capacity criteria for fisheries, ecosystem, and socio-economicsre linked to adaptation options for reducing vulnerabilities. Forxample, a barangay with high vulnerability due to high fisheriesependency can be targeted for intensified diversification of liveli-oods.
Fine-scale examination focusing on local settings (i.e., coastalommunity level) may provide important information for VAs thats not observed at the broad scale. Focus at the local scale ismportant toward developing a national scope which may also
earch 147 (2013) 381– 393 391
apply in other countries where small-scale capture fisheries aresignificant.
5.5. The way forward: Reducing vulnerabilities to enhanceresilience
Fisheries-related responses present an investigative and com-munication challenge in understanding how these responses mightimpact the coastal seas. Such impact is not readily apparent becauseof the submarine nature, mobile behavior, and complex life historyof the resource of concern as well as multispecies interactions. Eval-uating the vulnerability of fisheries entails understanding linkages,patterns, habitat processes, and associated organisms in the con-text of VA (e.g., criteria proposed by the Intergovernmental Panelon Climate Change (2001) and adopted by Allison et al. (2009)).The development of criteria used in VA is guided by the need toclarify the definitions of the attributes of the system being stud-ied (Füssel, 2007). The VA–TURF upholds science-based rigor butis also simplified in a rubric approach to initiate its eventual useby local governments in coastal areas of the Philippines as well aspotentially other areas with similar socio-economic and physicalconditions.
Although this paper primarily presents the utility of VA–TURF,the subsequent process of identifying adaptation strategies hasbeen initiated. Furthermore, although outside the scope of thispaper, the tool has been rolled out in at least 18 other coastal townsin the Philippines where small-scale fisheries are a major part of theeconomy. In the workshops, aside from strategies for implementingenforcement activities to deter illegal fishing practices and estab-lishing marine protected areas, most of the towns also prioritizedsocio-economic strategies emphasizing on their latent capacities tobe enhanced where they are appropriate. These include seaweedfarming, milkfish pond and cage culture, mud crab fattening cul-ture, rabbitfish and grouper fry grow-out culture, sea cucumberculture, backyard-scale hog and goat raising, and hand-weavinghandicraft from Nipa. Other sources of income such as small-scalerice farming, coconut farming-related activities (e.g., copra andcharcoal from coconut shell), and other short-term labor-orientedjobs (e.g., factory work, carpentry, house construction jobs, publicwork, public transportation services) were also determined in eachsite, which is crucial for identifying alternative livelihood options.VA–TURF has potential for integration into current national povertyprograms such as the conditional cash transfer scheme, wherebythe poor beneficiaries (i.e., fishers) can receive financial assistanceon the condition that they undergo government-instituted socialmeasures in education, health, and reproduction. The workshopsalso served as opportunities to assist the local government units inincorporating the VA results and climate change adaptation in theirannual management plans.
The application of VA–TURF in the present study focuses on fish-eries associated with nearshore habitats (coral reefs, seagrasses,and mangroves) and serves as an entry framework. It is envisionedthat an integrated version of the VA tool combining demersals andpelagics together with the aquaculture component will providea more comprehensive management of coastal fisheries in thePhilippines.
Acknowledgments
The authors acknowledge the funding for the development ofVA–TURF from the Philippine Council for Agriculture, Aquatic, and
Natural Resources Research and Development of the Department ofScience and Technology (PCAARRD–DOST), Coral Triangle SupportPartnership (CTSP), and Conservation International–Philippines.We thank Prof. Dr. André Punt and the two anonymous reviewers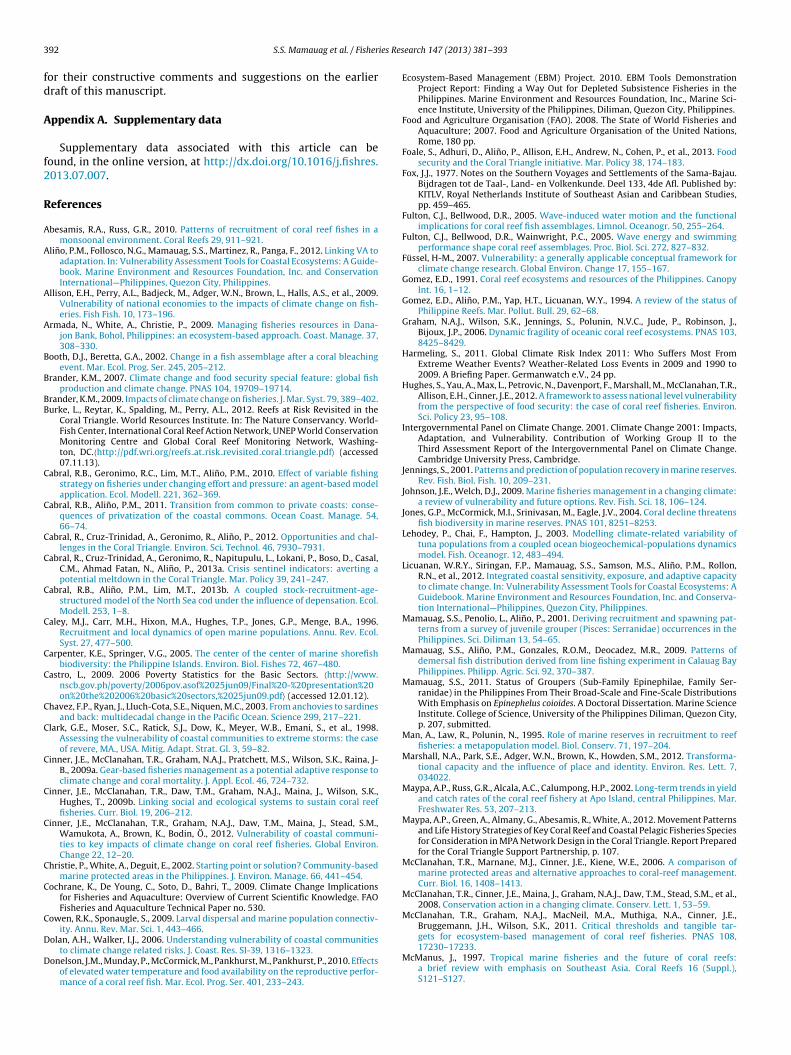
3 ies Res
fd
A
f2
R
A
A
A
A
B
B
BB
C
C
C
C
C
C
C
C
C
C
C
C
C
C
C
C
D
D
92 S.S. Mamauag et al. / Fisher
or their constructive comments and suggestions on the earlierraft of this manuscript.
ppendix A. Supplementary data
Supplementary data associated with this article can beound, in the online version, at http://dx.doi.org/10.1016/j.fishres.013.07.007.
eferences
besamis, R.A., Russ, G.R., 2010. Patterns of recruitment of coral reef fishes in amonsoonal environment. Coral Reefs 29, 911–921.
lino, P.M., Follosco, N.G., Mamauag, S.S., Martinez, R., Panga, F., 2012. Linking VA toadaptation. In: Vulnerability Assessment Tools for Coastal Ecosystems: A Guide-book. Marine Environment and Resources Foundation, Inc. and ConservationInternational—Philippines, Quezon City, Philippines.
llison, E.H., Perry, A.L., Badjeck, M., Adger, W.N., Brown, L., Halls, A.S., et al., 2009.Vulnerability of national economies to the impacts of climate change on fish-eries. Fish Fish. 10, 173–196.
rmada, N., White, A., Christie, P., 2009. Managing fisheries resources in Dana-jon Bank, Bohol, Philippines: an ecosystem-based approach. Coast. Manage. 37,308–330.
ooth, D.J., Beretta, G.A., 2002. Change in a fish assemblage after a coral bleachingevent. Mar. Ecol. Prog. Ser. 245, 205–212.
rander, K.M., 2007. Climate change and food security special feature: global fishproduction and climate change. PNAS 104, 19709–19714.
rander, K.M., 2009. Impacts of climate change on fisheries. J. Mar. Syst. 79, 389–402.urke, L., Reytar, K., Spalding, M., Perry, A.L., 2012. Reefs at Risk Revisited in the
Coral Triangle. World Resources Institute. In: The Nature Conservancy. World-Fish Center, International Coral Reef Action Network, UNEP World ConservationMonitoring Centre and Global Coral Reef Monitoring Network, Washing-ton, DC.〈http://pdf.wri.org/reefs at risk revisited coral triangle.pdf〉 (accessed07.11.13).
abral, R.B., Geronimo, R.C., Lim, M.T., Alino, P.M., 2010. Effect of variable fishingstrategy on fisheries under changing effort and pressure: an agent-based modelapplication. Ecol. Modell. 221, 362–369.
abral, R.B., Alino, P.M., 2011. Transition from common to private coasts: conse-quences of privatization of the coastal commons. Ocean Coast. Manage. 54,66–74.
abral, R., Cruz-Trinidad, A., Geronimo, R., Alino, P., 2012. Opportunities and chal-lenges in the Coral Triangle. Environ. Sci. Technol. 46, 7930–7931.
abral, R., Cruz-Trinidad, A., Geronimo, R., Napitupulu, L., Lokani, P., Boso, D., Casal,C.M., Ahmad Fatan, N., Alino, P., 2013a. Crisis sentinel indicators: averting apotential meltdown in the Coral Triangle. Mar. Policy 39, 241–247.
abral, R.B., Alino, P.M., Lim, M.T., 2013b. A coupled stock-recruitment-age-structured model of the North Sea cod under the influence of depensation. Ecol.Modell. 253, 1–8.
aley, M.J., Carr, M.H., Hixon, M.A., Hughes, T.P., Jones, G.P., Menge, B.A., 1996.Recruitment and local dynamics of open marine populations. Annu. Rev. Ecol.Syst. 27, 477–500.
arpenter, K.E., Springer, V.G., 2005. The center of the center of marine shorefishbiodiversity: the Philippine Islands. Environ. Biol. Fishes 72, 467–480.
astro, L., 2009. 2006 Poverty Statistics for the Basic Sectors. 〈http://www.nscb.gov.ph/poverty/2006pov.asof%2025jun09/Final%20-%20presentation%20on%20the%202006%20basic%20sectors,%2025jun09.pdf〉 (accessed 12.01.12).
havez, F.P., Ryan, J., Lluch-Cota, S.E., Niquen, M.C., 2003. From anchovies to sardinesand back: multidecadal change in the Pacific Ocean. Science 299, 217–221.
lark, G.E., Moser, S.C., Ratick, S.J., Dow, K., Meyer, W.B., Emani, S., et al., 1998.Assessing the vulnerability of coastal communities to extreme storms: the caseof revere, MA., USA. Mitig. Adapt. Strat. Gl. 3, 59–82.
inner, J.E., McClanahan, T.R., Graham, N.A.J., Pratchett, M.S., Wilson, S.K., Raina, J-B., 2009a. Gear-based fisheries management as a potential adaptive response toclimate change and coral mortality. J. Appl. Ecol. 46, 724–732.
inner, J.E., McClanahan, T.R., Daw, T.M., Graham, N.A.J., Maina, J., Wilson, S.K.,Hughes, T., 2009b. Linking social and ecological systems to sustain coral reeffisheries. Curr. Biol. 19, 206–212.
inner, J.E., McClanahan, T.R., Graham, N.A.J., Daw, T.M., Maina, J., Stead, S.M.,Wamukota, A., Brown, K., Bodin, Ö., 2012. Vulnerability of coastal communi-ties to key impacts of climate change on coral reef fisheries. Global Environ.Change 22, 12–20.
hristie, P., White, A., Deguit, E., 2002. Starting point or solution? Community-basedmarine protected areas in the Philippines. J. Environ. Manage. 66, 441–454.
ochrane, K., De Young, C., Soto, D., Bahri, T., 2009. Climate Change Implicationsfor Fisheries and Aquaculture: Overview of Current Scientific Knowledge. FAOFisheries and Aquaculture Technical Paper no. 530.
owen, R.K., Sponaugle, S., 2009. Larval dispersal and marine population connectiv-ity. Annu. Rev. Mar. Sci. 1, 443–466.
olan, A.H., Walker, I.J., 2006. Understanding vulnerability of coastal communitiesto climate change related risks. J. Coast. Res. SI-39, 1316–1323.
onelson, J.M., Munday, P., McCormick, M., Pankhurst, M., Pankhurst, P., 2010. Effectsof elevated water temperature and food availability on the reproductive perfor-mance of a coral reef fish. Mar. Ecol. Prog. Ser. 401, 233–243.
earch 147 (2013) 381– 393
Ecosystem-Based Management (EBM) Project. 2010. EBM Tools DemonstrationProject Report: Finding a Way Out for Depleted Subsistence Fisheries in thePhilippines. Marine Environment and Resources Foundation, Inc., Marine Sci-ence Institute, University of the Philippines, Diliman, Quezon City, Philippines.
Food and Agriculture Organisation (FAO). 2008. The State of World Fisheries andAquaculture; 2007. Food and Agriculture Organisation of the United Nations,Rome, 180 pp.
Foale, S., Adhuri, D., Alino, P., Allison, E.H., Andrew, N., Cohen, P., et al., 2013. Foodsecurity and the Coral Triangle initiative. Mar. Policy 38, 174–183.
Fox, J.J., 1977. Notes on the Southern Voyages and Settlements of the Sama-Bajau.Bijdragen tot de Taal-, Land- en Volkenkunde. Deel 133, 4de Afl. Published by:KITLV, Royal Netherlands Institute of Southeast Asian and Caribbean Studies,pp. 459–465.
Fulton, C.J., Bellwood, D.R., 2005. Wave-induced water motion and the functionalimplications for coral reef fish assemblages. Limnol. Oceanogr. 50, 255–264.
Fulton, C.J., Bellwood, D.R., Wainwright, P.C., 2005. Wave energy and swimmingperformance shape coral reef assemblages. Proc. Biol. Sci. 272, 827–832.
Füssel, H-M., 2007. Vulnerability: a generally applicable conceptual framework forclimate change research. Global Environ. Change 17, 155–167.
Gomez, E.D., 1991. Coral reef ecosystems and resources of the Philippines. CanopyInt. 16, 1–12.
Gomez, E.D., Alino, P.M., Yap, H.T., Licuanan, W.Y., 1994. A review of the status ofPhilippine Reefs. Mar. Pollut. Bull. 29, 62–68.
Graham, N.A.J., Wilson, S.K., Jennings, S., Polunin, N.V.C., Jude, P., Robinson, J.,Bijoux, J.P., 2006. Dynamic fragility of oceanic coral reef ecosystems. PNAS 103,8425–8429.
Harmeling, S., 2011. Global Climate Risk Index 2011: Who Suffers Most FromExtreme Weather Events? Weather-Related Loss Events in 2009 and 1990 to2009. A Briefing Paper. Germanwatch e.V., 24 pp.
Hughes, S., Yau, A., Max, L., Petrovic, N., Davenport, F., Marshall, M., McClanahan, T.R.,Allison, E.H., Cinner, J.E., 2012. A framework to assess national level vulnerabilityfrom the perspective of food security: the case of coral reef fisheries. Environ.Sci. Policy 23, 95–108.
Intergovernmental Panel on Climate Change. 2001. Climate Change 2001: Impacts,Adaptation, and Vulnerability. Contribution of Working Group II to theThird Assessment Report of the Intergovernmental Panel on Climate Change.Cambridge University Press, Cambridge.
Jennings, S., 2001. Patterns and prediction of population recovery in marine reserves.Rev. Fish. Biol. Fish. 10, 209–231.
Johnson, J.E., Welch, D.J., 2009. Marine fisheries management in a changing climate:a review of vulnerability and future options. Rev. Fish. Sci. 18, 106–124.
Jones, G.P., McCormick, M.I., Srinivasan, M., Eagle, J.V., 2004. Coral decline threatensfish biodiversity in marine reserves. PNAS 101, 8251–8253.
Lehodey, P., Chai, F., Hampton, J., 2003. Modelling climate-related variability oftuna populations from a coupled ocean biogeochemical-populations dynamicsmodel. Fish. Oceanogr. 12, 483–494.
Licuanan, W.R.Y., Siringan, F.P., Mamauag, S.S., Samson, M.S., Alino, P.M., Rollon,R.N., et al., 2012. Integrated coastal sensitivity, exposure, and adaptive capacityto climate change. In: Vulnerability Assessment Tools for Coastal Ecosystems: AGuidebook. Marine Environment and Resources Foundation, Inc. and Conserva-tion International—Philippines, Quezon City, Philippines.
Mamauag, S.S., Penolio, L., Alino, P., 2001. Deriving recruitment and spawning pat-terns from a survey of juvenile grouper (Pisces: Serranidae) occurrences in thePhilippines. Sci. Diliman 13, 54–65.
Mamauag, S.S., Alino, P.M., Gonzales, R.O.M., Deocadez, M.R., 2009. Patterns ofdemersal fish distribution derived from line fishing experiment in Calauag BayPhilippines. Philipp. Agric. Sci. 92, 370–387.
Mamauag, S.S., 2011. Status of Groupers (Sub-Family Epinephilae, Family Ser-ranidae) in the Philippines From Their Broad-Scale and Fine-Scale DistributionsWith Emphasis on Epinephelus coioides. A Doctoral Dissertation. Marine ScienceInstitute. College of Science, University of the Philippines Diliman, Quezon City,p. 207, submitted.
Man, A., Law, R., Polunin, N., 1995. Role of marine reserves in recruitment to reeffisheries: a metapopulation model. Biol. Conserv. 71, 197–204.
Marshall, N.A., Park, S.E., Adger, W.N., Brown, K., Howden, S.M., 2012. Transforma-tional capacity and the influence of place and identity. Environ. Res. Lett. 7,034022.
Maypa, A.P., Russ, G.R., Alcala, A.C., Calumpong, H.P., 2002. Long-term trends in yieldand catch rates of the coral reef fishery at Apo Island, central Philippines. Mar.Freshwater Res. 53, 207–213.
Maypa, A.P., Green, A., Almany, G., Abesamis, R., White, A., 2012. Movement Patternsand Life History Strategies of Key Coral Reef and Coastal Pelagic Fisheries Speciesfor Consideration in MPA Network Design in the Coral Triangle. Report Preparedfor the Coral Triangle Support Partnership, p. 107.
McClanahan, T.R., Marnane, M.J., Cinner, J.E., Kiene, W.E., 2006. A comparison ofmarine protected areas and alternative approaches to coral-reef management.Curr. Biol. 16, 1408–1413.
McClanahan, T.R., Cinner, J.E., Maina, J., Graham, N.A.J., Daw, T.M., Stead, S.M., et al.,2008. Conservation action in a changing climate. Conserv. Lett. 1, 53–59.
McClanahan, T.R., Graham, N.A.J., MacNeil, M.A., Muthiga, N.A., Cinner, J.E.,Bruggemann, J.H., Wilson, S.K., 2011. Critical thresholds and tangible tar-
gets for ecosystem-based management of coral reef fisheries. PNAS 108,17230–17233.McManus, J., 1997. Tropical marine fisheries and the future of coral reefs:a brief review with emphasis on Southeast Asia. Coral Reefs 16 (Suppl.),S121–S127.
ies Res
M
M
M
M
M
M
M
N
PP
P
R
S
S
S.S. Mamauag et al. / Fisher
uallil, R.N., Geronimo, R.C., Cleland, D., Cabral, R.B., Doctor, M.V., Cruz-Trinidad,A., Alino, P.M., 2011. Willingness to exit the artisanal fishery as a response toscenarios of declining catch or increasing monetary incentives. Fish. Res. 111,74–81.
uallil, R.N., Cabral, R., Mamauag, S., Alino, P., 2012. Status, trend andsustainability of small-scale fisheries in the Philippines. In: Yellowlees,D., Hughes, T. (Eds.), Proceedings of the 12th International Coral ReefSymposium, Cairns, Australia, 9–13 July 2012. 〈http://www.icrs2012.com/proceedings/manuscripts/ICRS2012 13E 2.pdf〉 (accessed 07.11.13.).
uallil, R.N., Cleland, D., Alino, P., 2013. Socioeconomic factors associated with fish-ing pressure in small-scale fisheries along the West Philippine Sea biogeographicregion. Ocean Coast. Manage. 82, 27–33.
umby, P.J., 2006. Connectivity of reef fish between mangroves and coral reefs:algorithms for the design of marine reserves at seascape scales. Biol. Conserv.128, 215–222.
unday, P.L., Leis, J.M., Lough, J.M., Paris, C.B., Kingsford, M.J., Berumen, M.L., Lam-brechts, J., 2009. Climate change and coral reef connectivity. Coral Reefs 28,379–395.
unday, P.L., 2004. Habitat loss, resource specialization, and extinction on coralreefs. Global Change Biol. 10, 1642–1647.
unday, P.L., Jones, G.P., Pratchett, M.S., Williams, A.J., 2008. Climate change andthe future for coral reef fishes. Fish Fish. 9, 261–285.
agelkerken, I., 2009. Evaluation of nursery function of mangroves and seagrassbeds for tropical decapods and reef fishes: patterns and underlying mechanisms.In: Nagelkerken (Ed.), Ecological Connectivity among Tropical Ecosystems.Springer, New York, Heidelberg, pp. 357–399.
auly, D., 1990. On Malthusian overfishing. Naga—the ICLARM Q. 13, 3–4.auly, D., Christensen, V., Dalsgaard, J., Froese, R., Torres Jr., F., 1998. Fishing down
marine food webs. Science 279, 860–863.ratchett, M., Munday, P., Wilson, K., Jones, G.P., McClanahan, T.R., 2008. Effects of
climate-induced coral bleaching on coral reef fishes—ecological and economicconsequences. Oceanogr. Mar. Biol. 46, 251–296.
emote Sensing Information for Living Environments and Nationwide Tools forSentinel Ecosystems in Our Archipelagic Seas (RESILIENT SEAS) Program, 2012.Project Report. Philippine Council for Agriculture, Aquatic and Natural ResourcesResearch and Development, Department of Science and TechnologyMetroManila, Philippines, submitted.
adovy, Y., 1996. Reproduction of reef fishery species. In: Polunin, N.V.C., Roberts,
C.M. (Eds.), Reef Fisheries. Chapman and Hall, UK, pp. 15–59.alamante, E., Villanoy, C., 2012. Developing GIS-Based Philippine Coastal Municipaland Barangay Level Climate Exposure Maps. A Report to the US Coral Trian-gle Initiative Program Integrator Through the Project Initiating the CTI—CoastalLearning Adaptation Network, submitted.
earch 147 (2013) 381– 393 393
SCTR-Philippines. 2012. State of the Coral Triangle Report—Philippines. 〈http://www.coraltriangleinitiative.net/knowledge-hub/document-library/member-countries/philippines/full-sctr〉 (accessed 01.09.13).
Sheaves, M., 2005. Nature and consequences of biological connectivity in mangrovesystems. Mar. Ecol. Prog. Ser. 302, 293–305.
Soliman, V., Yamaoka, K., 2010a. Assessment of the fishery of siganid juveniles caughtby bagnet in Lagonoy Gulf, Southeastern Luzon, Philippines. J. Appl. Ichthyol. 26,561–567.
Soliman, V., Yamada, H., Yamaoka, K., 2010b. Early life-history of the spiny siganidSiganus spinus (Linnaeus 1758) inferred from otolith microstructure. J. Appl.Ichthyol. 26, 540–545.
Sponaugle, S., Grorud-Colvert, K., Pinkard, D., 2006. Temperature-mediated vari-ation in early life history traits and recruitment success of the coral reeffish Thalassoma bifasciatum in the Florida Keys. Mar. Ecol. Prog. Ser. 308,1–15.
Srinivasan, M., Jones, G.P., 2006. Extended breeding and recruitment periods of fisheson a low latitude coral reef. Coral Reefs 25, 673–682.
Takemura, A., Rahman, M.S., Nakamura, S., Park, Y.J., Takano, K., 2004. Lunar cyclesand reproductive activity in reef fishes with particular attention to rabbitfishes.Fish Fish. 5, 317–328.
Villanoy, C.L., Cabrera, O.C., Yniguez, A., Camoying, M., de Guzman, A., David, L.T.,Flament, P., 2011. Monsoon-driven coastal upwelling off Zamboanga Peninsula,Philippines. Oceanography 24, 156–165.
Villanoy, C.L., Salamante, E., Cabrera, O., 2012. Exposure: waves and stormsurges. In: Vulnerability Assessment Tools for Coastal Ecosystems: A Guide-book. Marine Environment and Resources Foundation, Inc. and ConservationInternational—Philippines, Quezon City, Philippines.
Webster, P.J., Holland, G.J., Curry, J.A., Chang, H-R., 2005. Changes in tropicalcyclone number, duration, and intensity in a warming environment. Science309, 1844–1846.
Weeks, R., Russ, G., Alcala, A., White, A., 2009. Effectiveness of marine protected areasin the Philippines for biodiversity conservation. Conserv. Biol. 24, 531–540.
Wilson, S., Graham, N., Pratchett, M., Jones, G., Polunin, N., 2006. Multiple dis-turbances and the global degradation of coral reefs: are reef fishes at risk orresilient? Glob. Change Biol. 12, 2220–2234.
Wilson, S., Fisher, R., Pratchett, M., Graham, N., Dulvy, K., Turner, R., Cakacaka, A.,Polunin, N., Rushton, P., 2008. Exploitation and habitat degradation as agents ofchange within coral reef fish communities. Glob. Change Biol. 14, 2796–2809.
Zeller, D.C., 1997. Home range and activity patterns of the coral trout Plectropomusleopardus (Serranidae). Mar. Ecol. Prog. Ser. 154, 65–77.
Zeller, D.C., 1998. Spawning aggregations: patterns of movement of the coral troutPlectropomus leopardus (Serranidae) as determined by ultrasonic telemetry. Mar.Ecol. Prog. Ser. 162, 253–263.