Coastal Flood Vulnerability Assessment
35
Coastal Flood Vulnerability Assessment Town of Palm Beach PREPARED BY: Woods Hole Group, Inc. A CLS Company 107 Waterhouse Road Bourne, MA 02532 USA July 2019 PREPARED FOR: Town of Palm Beach Palm Beach, FL
Transcript of Coastal Flood Vulnerability Assessment
Coastal Flood Vulnerability Assessment
Town of Palm Beach
PREPARED BY: Woods Hole Group, Inc. A CLS Company 107 Waterhouse Road Bourne, MA 02532 USA
July 2019 PREPARED FOR: Town of Palm Beach Palm Beach, FL
This document contains confidential information that is proprietary to the Woods Hole Group, Inc. Neither the entire document nor any of the information contained therein should be disclosed or reproduced in whole or in part, beyond the intended purpose of this submission without the express written consent of the Woods Hole Group, Inc.
Coastal Flood Vulnerability Assessment
July 16, 2019
Prepared for: Town of Palm Beach
Palm Beach, FL
Prepared by: Woods Hole Group A CLS Company
107 Waterhouse Road Bourne, MA 02532 USA
(508) 540‐8080
Woods Hole Group, Inc. • A CLS Company
Coastal Flood Vulnerability Assessment ES‐i ‐ July 2019 Town of Palm Beach 2017‐0014‐00
See Proprietary Note on Title Page
EXECUTIVE SUMMARY
The Town of Palm Beach (TOPB) has tremendously valuable infrastructure. Recognizing the threat that coastal storms pose to infrastructure in the Town, and the potential increases in risk due to projected future changes in storm intensity and sea water levels, Town leaders undertook a coastal vulnerability assessment. This vulnerability assessment was included in the scope of the ongoing 10‐year coastal management program. The assessment is intended to provide guidance to the Town for prioritizing and planning future flood mitigation projects and adaptations to improve coastal resilience now and into the future. Since public infrastructure projects are designed to last decades or more, there is a need to factor future risk into design criteria where coastal flooding is a risk. Ultimately, this assessment will help the Town improve its coastal resilience, and help save money as projects are implemented to minimize costly flood damage and future repairs. Properly designed projects that consider future risk can also last longer, thereby helping to reduce future infrastructure investments in failed projects.
This report documents the technical approach and basis. The assessment is consistent with the framework developed in The Florida Adaptation Planning Guidebook (2018). The methods applied are based on an award‐winning, innovative and quantitatively advanced probabilistic vulnerability model. The methodology was developed by Woods Hole Group, in collaboration with more than 20 partners and peer reviewers, including Federal Highway Administration, Massachusetts Department of Transportation (Mass DOT), University of Massachusetts ‐ Boston (UMass Boston), US Army Corps of Engineers (USACE), US Environmental Protection Agency (USEPA), U.S. Geological Survey (USGS), National Oceanic and Atmospheric Administration (NOAA), Woods Hole Oceanographic Institution (WHOI), and others. The team received a 2017 Federal Highway Administration Environmental Excellence Award, which recognized the method as “a gold standard for coastal resiliency work,” and “a blueprint that national and international agencies can mirror to better assess and design resiliency options”. In its vision within the ongoing 10‐year coastal management program, the TOPB is proactively planning to protect the citizens and community infrastructure.
The objectives of the assessment were to determine:
What are the chances infrastructure will flood today and in the future?
What assets are vulnerable and what is the priority?
What are potential interventions to manage risk and improve coastal resiliency, and when should they be implemented?
For readers not requiring the extensive background and explanation, the primary deliverables from this flood risk vulnerability assessment are contained in attachments and include:
Woods Hole Group, Inc. • A CLS Company
Coastal Flood Vulnerability Assessment ES‐ii July 2019 Town of Palm Beach 2017‐0014‐00
See Proprietary Note on Title Page
Town‐wide maps of flood risk probability and associated depths of flooding (at specific return period levels) for present day conditions and a future scenario for a higher sea level in a more energetic coastal storm climate. These maps also are provided to the Town in a format compatible with Town geographic information system (GIS), and can be used to identify regional areas at risk, as well as specific assets subject to flooding.
Tables of Town public assets, along with the consequence score for each asset and the coastal vulnerability index (CVI). Tables are included for each asset type so the relative CVI can be compared for like‐assets, as well as for the entire list of Town assets as a whole. These tables also are provided in raw form so they can be refined by Town officials as more is learned about asset values or as priorities evolve.
Completion of the coastal vulnerability assessment establishes the Town of Palm Beach as a leader in the State of Florida related to flood protection, adaptation and resilience building, and provides the foundation from which future planning and budgeting can be most effectively targeted to protect the Town into the future.
The assessment relied on a probabilistic, dynamic model developed specifically for the Town of Palm Beach. This Palm Beach Flood Risk Model (PB‐FRM) is a physics‐based coastal flood model developed to determine the probability of flooding based on hundreds to thousands of storm scenarios. The model outputs include the probabilities of inundation along with depth of flooding under present day conditions and a future scenario. The model also provides numerous other quantitative parameters, such as wave information, wind information, currents, and flooding times based on the passage of coastal storm events.
Estimating the vulnerability of inundation at different locations in the TOPB is important to prioritize adaptations for key public assets. The first step is identifying the assets to be evaluated. Town staff provided specific information for more than 2,200 Town‐owned buildings, streets, parks, beach access ways, sewer pump/lift stations, stormwater basins and stormwater pumps. In a coastal vulnerability assessment, each asset considered is given a consequence score reflecting the value of an asset with respect to the impact on the community should it be damaged by flooding. A standardized scoring approach was developed using six (6) criteria to produce a total consequence score for each asset. The criteria utilized to determine the consequence score included: impacts to public health & environment, cost of damage, impacts to economic activities, impacts to public safety services, area of service loss and duration of service loss. Town staff also provided baseline guidance for developing the consequence scores for the assets, which was reviewed and modified by Woods Hole Group for consistency.
Combining the probability of inundation with the consequence score results in a coastal vulnerability index (CVI). Each of the 2,200+ Town public assets has a CVI, and the assets can be ranked from largest (most valued and most vulnerable) to smallest CVI.
Woods Hole Group, Inc. • A CLS Company
Coastal Flood Vulnerability Assessment ES‐iii July 2019 Town of Palm Beach 2017‐0014‐00
See Proprietary Note on Title Page
With a comprehensive analysis of the probability of inundation for two time periods, depth of inundation for the same two time periods, standardized consequence scores for each asset and CVIs, the TOPB is positioned to make informed, defensible, efficient and effective decisions for managing risk to TOPB public assets during present and future flooding events. With the results of the vulnerability assessment, the Town has information to identify public assets at most risk now and in the future, which assets are most highly valued, and can identify public works projects to manage this risk.
It is important to recognize that if an asset has potential for flooding now or in the future, it does not necessarily warrant action. Some assets are resilient to flooding and can keep operating. Other assets may not function during a flooding event, but this may be acceptable for short durations. The degree to which an asset is affected by flooding may also depend upon the depth of flooding (e.g., 6 inches or 1 foot of water during a storm may be acceptable in some cases). Other assets, however, may be critical enough to Town health and safety or other values, that specific action is warranted at that asset location to minimize flood risk regardless of the depth. Groups of assets may also be subject to flooding from the same source; thereby, warranting a regional solution to block the flood pathway itself.
Town staff can make and prioritize these types of decisions using the maps and tables provided by this coastal flood vulnerability assessment. An Implementation Plan also can help clearly define the path forward, and builds directly off the coastal vulnerability assessment by using the output to define specific action items and timing to optimize resilience and cost‐effectiveness. Implementation plans include both adaptations made in the short‐term for particularly vulnerable and valued assets, as well as longer‐term planning including monitoring, developing trigger points for action and conceptualizing future adaptations. An Implementation Plan also considers a range of possible adaptations at different scales, such as individual adaptations for a single asset (e.g., Town Hall; a Police or Fire Station), adaptations for a category of assets (e.g., all sewer lift stations), or regional adaptations for areas where key flood pathways are impacting multiple, different assets.
Woods Hole Group, Inc. • A CLS Company
Coastal Flood Vulnerability Assessment i July 2019 Town of Palm Beach 2017‐0014‐00
See Proprietary Note on Title Page
Table of Contents EXECUTIVE SUMMARY .......................................................................................................... ES‐I
1.0 INTRODUCTION .............................................................................................................. 1
1.1 BACKGROUND ........................................................................................................................ 2
1.2 OVERVIEW ............................................................................................................................. 3
1.3 ORGANIZATION OF THE REPORT .................................................................................................. 3
1.4 PURPOSE OF STUDY .................................................................................................................. 4
2.0 MODEL OVERVIEW ......................................................................................................... 4
2.1 ADCIRC AND SWAN MODELS ...................................................................................................... 4
2.2 ASSET INUNDATION DATA EXTRACTION ........................................................................................ 6
3.0 CONSEQUENCE SCORING ............................................................................................... 7
3.1 OVERVIEW OF PROCESS ............................................................................................................ 8
3.2 SCORING CRITERIA ................................................................................................................... 8
3.3 SCORING PROCESS ................................................................................................................... 9
3.4 CONSEQUENCE SCORING RESULTS ............................................................................................. 10
4.0 COASTAL FLOOD VULNERABILITY ASSESSMENT RESULTS ............................................. 11
4.1 PROBABILITY OF INUNDATION AND INUNDATION DEPTH ................................................................ 11
4.2 COASTAL VULNERABILITY INDEX ................................................................................................ 13
4.3 INFLUENCE OF UPLAND FRESHWATER DISCHARGE TO LAKE WORTH ................................................... 14
5.0 ADAPTATIONS .............................................................................................................. 16
5.1 OVERVIEW ........................................................................................................................... 16
5.2 ADAPTATION EXAMPLES .......................................................................................................... 17
5.2.1 Deployable Flood Barrier Example. ...................................................................... 17
5.2.2 Beach Access Mats and Terracing ......................................................................... 20
5.2.3 Living shoreline adaptations to build resiliency on Worth Avenue (Regional
Adaptation) ........................................................................................................... 23
6.0 IMPLEMENTATION PLAN .............................................................................................. 25
7.0 REFERENCES ................................................................................................................. 27
Woods Hole Group, Inc. • A CLS Company
Coastal Flood Vulnerability Assessment ii July 2019 Town of Palm Beach 2017‐0014‐00
See Proprietary Note on Title Page
List of Figures Figure 1‐1. Four‐step process outlined in the Florida Adaptation Planning Guidebook (2018) ........... 1
Figure 2‐1. Example of model grid developed for midtown portion of the TOPB ................................ 5
Figure 4‐9. Comparison of water surface elevation in Lake Worth for a storm surge event with and without extreme freshwater input to Lake Worth from the western watershed. ........... 15
Figure 5‐2. Beach access way location. ............................................................................................... 18
Figure 5‐3. View of access way. .......................................................................................................... 18
Figure 5‐4. Example of deployable flood barriers ............................................................................... 19
Figure 5‐5. Flood gate. ........................................................................................................................ 20
Figure 5‐6. Adaptation location for beach mats and terracing. .......................................................... 20
Figure 5‐7. Existing sitting area and beach access way. ...................................................................... 21
Figure 5‐8. Conceptual overview of access way with added sand and use of a Mobi‐mat to stabilize sand in beach access way ................................................................................................. 22
Figure 5‐9. Conceptual overview of added elevated terracing to build resilience in this beach front area. .................................................................................................................................. 23
Figure 5‐10. The embayment ................................................................................................................ 24
Figure 5‐11. Summary of embayment adaptations .............................................................................. 25
[See Attached Figure Section]
Figure 3‐1. Town of Palm Beach Assets ..................................................................................................
Figure 4‐1a. Present Day Coastal Vulnerability – Section 1 ......................................................................
Figure 4‐1b. Future Coastal Vulnerability – Section 1 ...............................................................................
Figure 4‐2a. Present Day Coastal Vulnerability – Section 2 ......................................................................
Figure 4‐2b. Future Coastal Vulnerability – Section 2 ...............................................................................
Figure 4‐3a. Present Day Coastal Vulnerability – Section 3 ......................................................................
Figure 4‐3b. Future Coastal Vulnerability – Section 3 ...............................................................................
Figure 4‐4a. Present Day Coastal Vulnerability – Section 4 ......................................................................
Figure 4‐4b. Future Coastal Vulnerability – Section 4 ...............................................................................
Figure 4‐5a. Present Day Coastal Vulnerability – Section 5 ......................................................................
Figure 4‐5b. Future Coastal Vulnerability – Section 5 ...............................................................................
Figure 4‐6a. Present Day Coastal Vulnerability – Section 6 ......................................................................
Figure 4‐6b. Future Coastal Vulnerability – Section 6 ...............................................................................
Woods Hole Group, Inc. • A CLS Company
Coastal Flood Vulnerability Assessment iii July 2019 Town of Palm Beach 2017‐0014‐00
See Proprietary Note on Title Page
Figure 4‐7a. Present Day Coastal Vulnerability – Section 7 ......................................................................
Figure 4‐7b. Future Coastal Vulnerability – Section 7 ...............................................................................
Figure 4‐8a. Combined CVI Assets – Top 30 .............................................................................................
Figure 4‐8b. Combined CVI Assets – Top 30– Inset ...................................................................................
Figure 5‐1. Adaptation Locus Map………………..………………………………………………………… ...........................
List of Tables (See Attached Table Section)
Table 3‐1. Consequence Score and Coastal Vulnerability Index Summary ASSET GROUP: Parks .........
Table 3‐2. Consequence Score and Coastal Vulnerability Index Summary ASSET GROUP: Streets………………………..…………
Table 3‐3. Consequence Score and Coastal Vulnerability Index Summary ASSET GROUP: Beach Access………………… ................................................................................................................
Table 3‐4. Consequence Score and Coastal Vulnerability Index Summary ASSET GROUP: Buildings……………………………….
Table 3‐5. Consequence Score and Coastal Vulnerability Index Summary ASSET GROUP: Sewer Lift……………………………..
Table 3‐6. Consequence Score and Coastal Vulnerability Index Summary ASSET GROUP: Stormwater Basin Inlets……….
Table 3‐7. Consequence Score and Coastal Vulnerability Index Summary ASSET GROUP: Stormwater Pump Stations …..
Table 3‐8. Ranked Consequence Scores – All Assets ............................................................................
Table 4‐9. Combined Coastal Vulnerability Index Summary .................................................................
Acronyms
ADCIRC ADvanced CIRCulation model CVI Coastal Vulnerability Index DEP Department of Environmental Protection FEMA Federal Emergency Management Agency FIRM Flood Insurance Rate Maps NACCS North Atlantic Coast Comprehensive Study NOAA National Oceanic and Atmospheric Administration SLR Sea level rise UNSWAN Unstructured Simulating WAves Nearshore TOPB Town of Palm Beach USACE United States Army Corps of Engineers
Woods Hole Group, Inc. • A CLS Company
Coastal Flood Vulnerability Assessment 1 July 2019 Town of Palm Beach 2017‐0014‐00
See Proprietary Note on Title Page
1.0 INTRODUCTION
Coastal storms threaten infrastructure in the Town of Palm Beach (TOPB), a risk expected to increase in the future with changing sea levels and increasing storm intensities. Interruptions in community services are an inconvenience, and impact the health and safety of the citizens. Predicting the most vulnerable assets under different future scenarios offers the opportunity to develop adaptations now to minimize damage and build coastal resilience against disruption in services that may occur in the future (or, in some cases, in the present day). Additionally, completing a vulnerability assessment meets the statutory requirement for designating Adaptation Action Areas, and forms the basis for complying with the “Peril of Flood” comprehensive plan requirements as found in Section 163.3178(2)(f)(1‐6), Florida Statues (Florida Coastal Management Program, Florida DEP, NOAA, 2018).
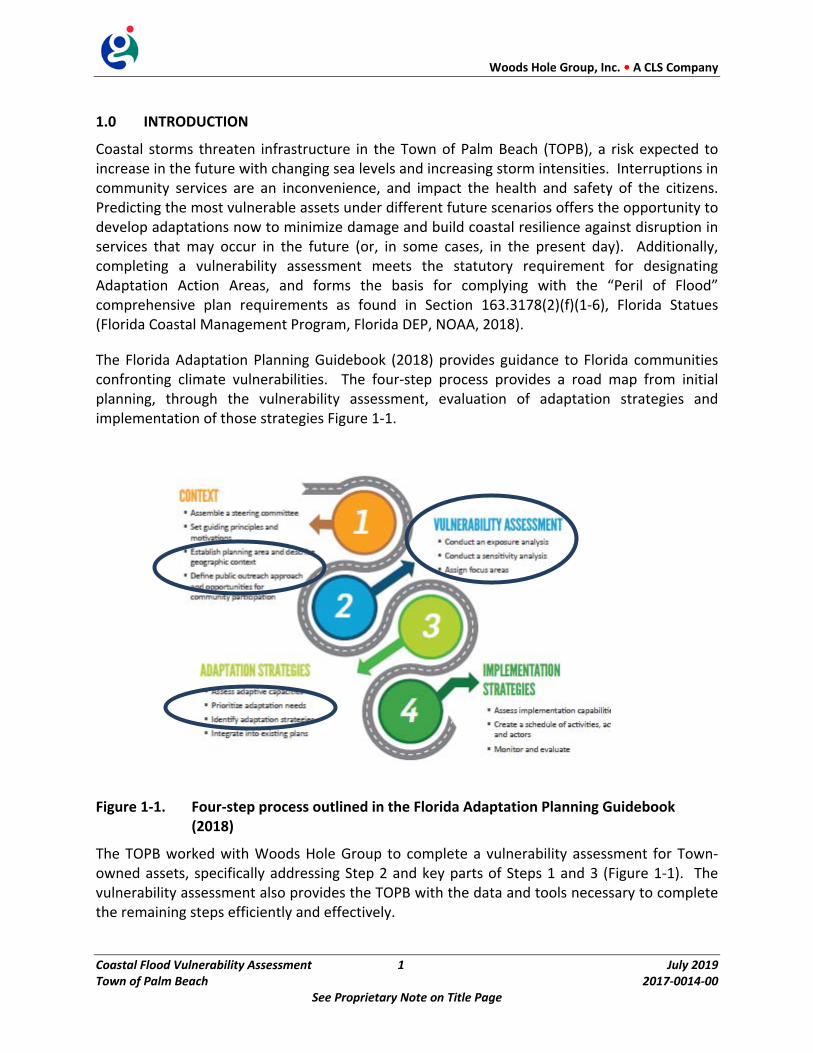
The Florida Adaptation Planning Guidebook (2018) provides guidance to Florida communities confronting climate vulnerabilities. The four‐step process provides a road map from initial planning, through the vulnerability assessment, evaluation of adaptation strategies and implementation of those strategies Figure 1‐1.
Figure 1‐1. Four‐step process outlined in the Florida Adaptation Planning Guidebook (2018)
The TOPB worked with Woods Hole Group to complete a vulnerability assessment for Town‐owned assets, specifically addressing Step 2 and key parts of Steps 1 and 3 (Figure 1‐1). The vulnerability assessment also provides the TOPB with the data and tools necessary to complete the remaining steps efficiently and effectively.
Woods Hole Group, Inc. • A CLS Company
Coastal Flood Vulnerability Assessment 2 July 2019 Town of Palm Beach 2017‐0014‐00
See Proprietary Note on Title Page
1.1 BACKGROUND
Coastal infrastructure is under threat from storms and associated waves, overtopping and surge, which in the future is forecast to include sea level change and larger, more intense, and potentially more frequent storms. The planning tools for forecasting vulnerabilities and planning adaptations have changed over the years. Coastal residents are familiar with the Federal Emergency Management Agency (FEMA) Flood Insurance Rate Maps (FIRM) and their use in identifying areas subject to inundation. FEMA flood zones (VE and AE) serve a regulatory role, but because they are ‘backward looking’ and only consider a ‘100‐year storm’, they are not effective tools for identifying future vulnerabilities and prioritizing or developing engineering adaptations to manage risk. Another commonly applied approach for evaluating the impact of changing sea levels combined with storm events is simply increasing the water surface elevation and comparing the new water elevation with the topographic elevations of the land. While this rudimentary “bathtub” approach may be a viable approach for providing a first order identification of potentially vulnerable areas, it does not accurately represent the dynamic nature of coastal storm events needed for a comprehensive analysis. It also does not account for tidal influences or the impacts of infrastructure on flooding. Additionally, the bathtub approach is of limited value for prioritizing adaptation projects since it does not directly provide a probability‐based assessment.
A pilot project funded by the Federal Highway Administration set the standard for probabilistic and dynamic vulnerability assessments. The project focused on characterizing the vulnerability to the Massachusetts Department of Transportation’s Boston Central Artery/Tunnel Project from sea level rise and extreme storm flooding. One of the most valuable outputs of the project was the advanced probabilistic inundation model. The approach won a 2017 Federal Highway Administration Environmental Excellence Award, and was identified as “a blueprint that national and international agencies can mirror to better assess and design resiliency options.” The model has subsequently been applied to other Towns and conservation lands to evaluate vulnerabilities. For the first time, the model is being applied to the vulnerability assessment for the TOPB.
The coastal vulnerability of community infrastructure is assessed by evaluating the exposure, sensitivity and adaptive capacity of a Town and the individual assets. Exposure considers the potential for flooding due to coastal storm surge and wave action resulting from extreme coastal storms (e.g., hurricanes) and the impact of that flooding. For example, it addresses key questions, such as: what is the probability that a given road will flood this year, and if it does flood, what is the likely depth of flooding? Sensitivity refers to how the system responds to the identified impacts. For instance, if the roadway is flooded, how does this impact access; is the roadway completely impassable or will closure of one lane suffice? Adaptive capacity refers to the ability of the system to accommodate impacts and/or recover from the impacts. For instance, if a roadway is flooded, does the roadway drainage system have the capacity to drain the flood waters from the road quickly so that traffic flow is minimally impacted or are there alternative routes?
Woods Hole Group, Inc. • A CLS Company
Coastal Flood Vulnerability Assessment 3 July 2019 Town of Palm Beach 2017‐0014‐00
See Proprietary Note on Title Page
Planners not only require vulnerability predictions, but also need to consider the value of the assets, called the consequence score. While an asset may be extremely vulnerable to flooding, it may be a low value asset (or have a low consequence of loss) when compared to other assets.
Once the current and future vulnerabilities are calculated and the consequence of loss is considered, the next step is to develop conceptual adaptation strategies to reduce vulnerability and improve recovery under current and future extreme conditions.
1.2 OVERVIEW
Woods Hole Group conducted a dynamic, probabilistic climate vulnerability assessment with a focus on evaluating the vulnerability of hard infrastructure (e.g., roads, schools, sewers, police and fire department buildings, beach access) and assisting the TOPB in prioritizing investments in adaptations to protect its most vulnerable and valued assets.
Central to the overall goal of prioritizing adaptations is determining the value of the assets (e.g., buildings, roads, access points, utility infrastructure). Working with the Town, categories of public assets vulnerable to flooding were compiled in a GIS database. The comparative value of each asset was determined using a set of criteria.
The climate change inundation model provides probability of flooding estimates for all of the TOPB. Probabilities of inundation allow managers to compare vulnerabilities based on a diversity of influencing forces such as tides, winds, elevation of coastal areas, varying sea level estimates, storm surge and waves. In contrast to assuming a fixed sea level elevation change, probabilities provide a distribution of inundation probabilities, from which the most vulnerable and least vulnerable areas can be identified.
Ultimately, a coastal vulnerability index (CVI) is calculated for every mapped asset for present day and for a future case. The CVI is the result of a two‐step process: vulnerability modeling (probability of inundation) and consequence scoring.
1.3 ORGANIZATION OF THE REPORT
The report provides background on conditions in the TOPB followed by an introduction to the analytical framework. The two components of the analysis, probability of inundation modeling and consequence scoring, are described in detail. The primary results are the consequence scores for each asset, the present and future inundation probabilities for each asset, and CVI for each asset. Detailed maps of inundation probabilities for the entire Town are provided in the attachment. CVI maps of the most vulnerable (top 30 for example) and valued assets at risk from inundation also are provided. The report concludes with an overview of the adaptation process for a few higher CVI assets. The Town also will be provided electronic copies of the asset scoring and CVI tables, so they can be refined as needed. And, GIS‐compatible maps of
Woods Hole Group, Inc. • A CLS Company
Coastal Flood Vulnerability Assessment 4 July 2019 Town of Palm Beach 2017‐0014‐00
See Proprietary Note on Title Page
the inundation probabilities will be provided as well so the Town can readily access the information, and evaluate at Town‐wide and asset specific scales as needed.1
1.4 PURPOSE OF STUDY
The study is designed to provide the TOPB with the data to answer the following planning questions:
a. What are the chances that roads, buildings, streets, access points and water infrastructure will flood today and in the future?
b. What assets are vulnerable and what is the priority for protecting vulnerable assets? c. What are potential interventions to manage risk and improve coastal resiliency, and
what is the implementation plan? These questions are answered using a prioritized list of public asset vulnerabilities, as well as an island‐wide overview of inundation. Maps are produced to illustrate the vulnerabilities and how engineering adaptations can be implemented to manage some of those vulnerabilities and improve coastal resiliency. Ultimately, the project illustrates the risks posed by changing sea levels and stronger storms, and identifies the most vulnerable and valued assets as a starting point for adaptation planning.
2.0 MODEL OVERVIEW
The hydrodynamic modeling utilized for this study is based on mathematical representations of natural processes affecting coastal water levels, such as tides, waves, winds, storm surge, sea level, and wave set‐up, at a fine enough resolution to identify site‐specific locations that may require adaptation alternatives.
2.1 ADCIRC AND SWAN MODELS
Central to the modeling process is capturing water circulation from hydrodynamic forces such as tides, waves, winds, storm surge, and sea level. The ADvanced CIRCulation model (ADCIRC) was selected because of its ability to accommodate complex geometries and bathymetries and heterogeneous parameter values. ADCIRC includes a wide variety of meteorological forcings, and is a model commonly used to predict coastal inundation caused by storm surge. Storm‐induced waves were simulated in concert with the hydrodynamics by coupling the Unstructured Simulating WAves Nearshore (UNSWAN) Model with ADCIRC. Specific updates to the model were made specifically for the Town of Palm Beach and are referred to as the Palm Beach Flood Risk Model (PB‐FRM).
The first step in building the PB‐FRM was constructing the modeling grid or mesh, the digital characterization of the water and land on which the model equations are solved. The mesh was developed at three resolutions: 1) a regional‐scale mesh (ec95d ADCIRC mesh), which is a
1 Deliverables include‐ ArcGIS raster and layer files for probability of inundation and depth, asset file geo‐database, and final excel workbook of CVI ranked assets.
Woods Hole Group, Inc. • A CLS Company
Coastal Flood Vulnerability Assessment 5 July 2019 Town of Palm Beach 2017‐0014‐00
See Proprietary Note on Title Page
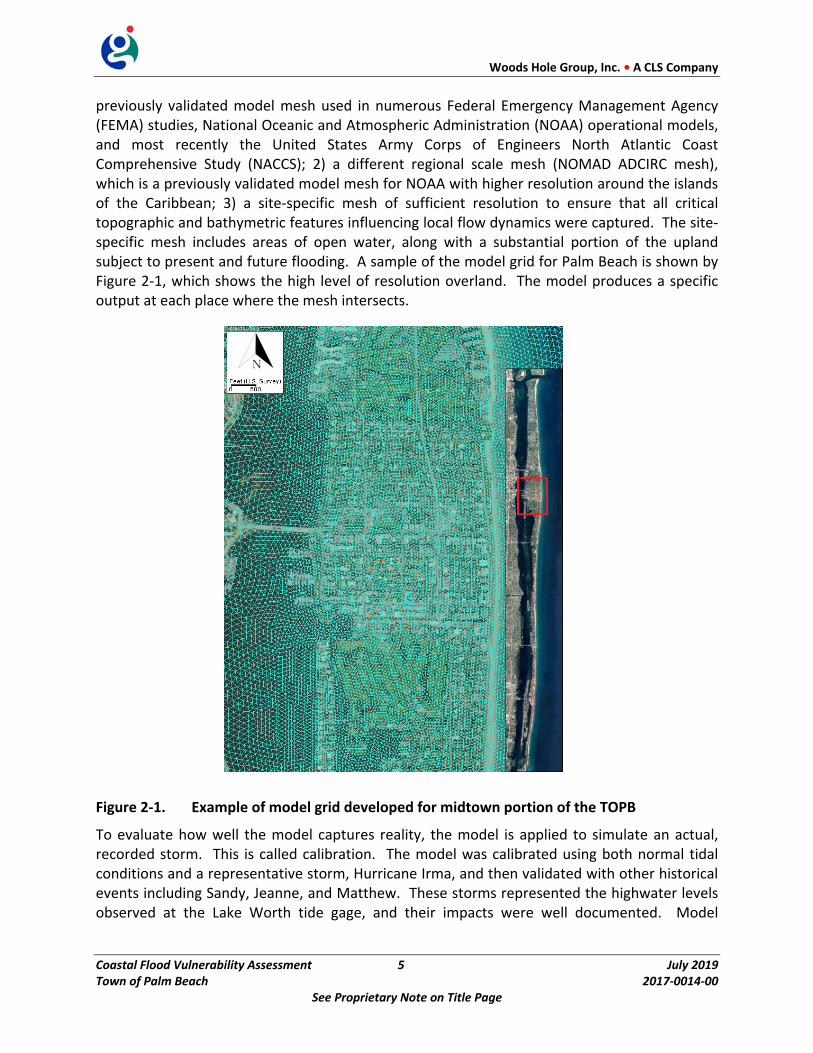
previously validated model mesh used in numerous Federal Emergency Management Agency (FEMA) studies, National Oceanic and Atmospheric Administration (NOAA) operational models, and most recently the United States Army Corps of Engineers North Atlantic Coast Comprehensive Study (NACCS); 2) a different regional scale mesh (NOMAD ADCIRC mesh), which is a previously validated model mesh for NOAA with higher resolution around the islands of the Caribbean; 3) a site‐specific mesh of sufficient resolution to ensure that all critical topographic and bathymetric features influencing local flow dynamics were captured. The site‐specific mesh includes areas of open water, along with a substantial portion of the upland subject to present and future flooding. A sample of the model grid for Palm Beach is shown by Figure 2‐1, which shows the high level of resolution overland. The model produces a specific output at each place where the mesh intersects.
Figure 2‐1. Example of model grid developed for midtown portion of the TOPB
To evaluate how well the model captures reality, the model is applied to simulate an actual, recorded storm. This is called calibration. The model was calibrated using both normal tidal conditions and a representative storm, Hurricane Irma, and then validated with other historical events including Sandy, Jeanne, and Matthew. These storms represented the highwater levels observed at the Lake Worth tide gage, and their impacts were well documented. Model
Woods Hole Group, Inc. • A CLS Company
Coastal Flood Vulnerability Assessment 6 July 2019 Town of Palm Beach 2017‐0014‐00
See Proprietary Note on Title Page
calibration and validation demonstrated that the PB‐FRM was effective at simulating important coastal storm processes and impacts.
Two time periods are assessed (present day and a future case). The other inputs used for flood modeling include:
Land cover data: This was used to develop the manning’s n frictional value for the model grid.
o C‐CAP Florida Region 2010‐Era Land Cover
Elevation Information: this was a combination of the following datasets to give a completed look at the elevations in and around Palm Beach. The elevations were combined with the priority to the more recent data.
o 2017 USACE FEMA Topobathy Lidar
o 2016 USACE NCMP
o 2016 USACE post Matthew Topobathy Lidar
o 2010 NGDC Coastal DEM
Hurricane Information: These are the sources for the storms that were used. The Hurdat and world winds are for the historical storms and the synthetic events were from MIT Professor Kerry Emanuel.
o Hurdat NOAA national hurricane center atcf files
o Hurricane Irene World winds
o Synthetic storm events from Dr. Kerry Emanuel
Sea Level Rise assumption: The future case model simulations incorporated a sea level that is 1.45 ft higher than present day. This was based on a high emissions curve / projection for the year 2050, which also corresponds to an intermediate high curve / projection scenario for the year 2065, or an intermediate low emission curve / projection for the year 2110. This approach helps bracket the uncertainty associated with predictions of future ocean level response to emissions and a changing climate. This estimate using the high emission projection was used to be consistent with the equations used in the SE FL Climate Compact Unified SLR project (recommended for critical infrastructure). That value was adjusted using a start date of 2018 instead of 1992 and includes the impact of land movement (e.g., subsidence).
o Present day: 0 ft of SLR
o Future case: 1.45 ft of SLR
2.2 ASSET INUNDATION DATA EXTRACTION
In addition to the probability of inundation and depth maps covering the entire TOPB, the results are evaluated in detail for a group of the primary Town assets. These are Town‐owned and operated facilities, infrastructure or access ways deemed important to the functioning of the TOPB. The Town‐owned assets evaluated include:
Woods Hole Group, Inc. • A CLS Company
Coastal Flood Vulnerability Assessment 7 July 2019 Town of Palm Beach 2017‐0014‐00
See Proprietary Note on Title Page
Buildings
Parks
Beach Access Ways
Streets
Sewer Lift Stations
Stormwater Basins
Stormwater Pump Stations. In total, probability of inundation was assessed for over 2,250 different assets.
The model results for present day and the future case were used to develop inundation probability maps for all assets in this assessment. These maps are helpful in understanding the potential impact and pathways of flooding, but also provide data to inform the assessment of individual asset vulnerabilities at each property. The determination of the probability of inundation is dependent on how each asset is represented on the ArcGIS map. The approach is as follows for the assets:
Buildings, Beach Access Ways, Sewer Lift Stations, Stormwater Basins and Stormwater Pump Stations: Each is represented by a point on the map and the probability of inundation is the value at that point.
Parks: Parks have an area large enough that there may be different probabilities of inundation for different sections of the park. As a result, the probability of inundation is presented as maximum.
Streets: Because a street becomes impassable once the lowest stretch of a street is underwater, the probability of inundation for each street segment is calculated for the lowest point.
The result of this process is maps that illustrate (See Section 4):
Probability of inundation for present day and future case;
Depth of flooding under different probability of storms (1%, 10%, 25%); and,
Table of present day and future case probability of inundation by individual assets.
3.0 CONSEQUENCE SCORING
The probability of inundation is one component of the coastal vulnerability assessment. Different assets have different probabilities of inundation, and these data help to identify assets most likely to be inundated under different scenarios. However, an asset vulnerable to flooding may not necessarily require immediate protection. In fact, inherent in Town Planning,
Woods Hole Group, Inc. • A CLS Company
Coastal Flood Vulnerability Assessment 8 July 2019 Town of Palm Beach 2017‐0014‐00
See Proprietary Note on Title Page
different assets have varying importance to the Town’s mission. Given limited resources, protecting everything is not a realistic option, nor should it be.
In coastal vulnerability assessment, the value of an asset is called the consequence score which refers to the consequence of inundation. A consequence score defines how flooding of a given asset will impact Town services. A higher score indicates a more highly valued asset with important implications if it is flooded. Assigning a value to an asset reflecting the relative importance for meeting an organization’s mission is a challenging process, requiring a transparent and logical approach.
3.1 OVERVIEW OF PROCESS
The goal of consequence scoring is to evaluate and rank the characteristics of an asset that influence the asset’s value and its services to the community. Criteria are scored through an iterative process for each asset with inputs from multiple contributors. Each asset has a total consequence score calculated based on the scores for the six (6) criteria. In combination with the probability of inundation, the consequence scores are used to rank assets based on vulnerability to inundation and value to the TOPB. Town staff provided meaningful contributions to this effort for the baseline scoring, and then modifications were made to the baseline scores by the Woods Hole Group team as appropriate for consistency.
3.2 SCORING CRITERIA
Consequence scores are calculated using criteria describing the importance of an asset in different ways. In this case six (6) criteria are employed. They include:
Impacts to Public Health & Environment: Evaluate how the asset contributes to health and environment in TOPB. For example, compare how a beach contributes to public health & environment to a catch basin or section of road. A sewer lift station/pump is given the highest score for this criterion because failure could result in the inability to pump sewage to the off‐island treatment facility. In a worst‐case, there could be sewage release and public exposure.
Cost of Damage: Consider how complex an asset is, the cost to build or maintain the asset, and the replacement cost to fix the asset. Also, the cost resulting from failure of an asset to fulfill its function due to flooding. For example, compare the cost of damage to a beach access point to the cost of damage to the fire station. While flooding of a street section may result in minimal costs, a damaged sewer lift station pump could release sewage in the environment and buildings leading to extensive cleanup costs.
Impacts to Economic Activities: Not all assets have a clear connection to economic activities in the TOPB; however, most will have at minimum an indirect impact (e.g., roadways). The economic activities vary from activities that may result in loss of direct income from a service (e.g., access fees) to the Town Office from which the TOPB is managed and decisions impacting economic exchange are made. Failure of assets
Woods Hole Group, Inc. • A CLS Company
Coastal Flood Vulnerability Assessment 9 July 2019 Town of Palm Beach 2017‐0014‐00
See Proprietary Note on Title Page
located in commercial zones may have a larger economic impact than assets located in non‐commercial zones.
Impacts to Public Safety Services: Maintaining public safety is one of the central responsibilities of the TOPB. Understanding which assets most directly impact safety in the Town is necessary to evaluate how flooding might threaten safety.
Area of Service Loss: The size of an asset and the larger the area of influence of an asset are important criteria for determining the value of an asset to the TOPB. A pump may occupy a small area, but provide service to an entire neighborhood or condominium complex, for example. Some assets such as Town Hall provide services for the entire TOPB, while a beach access way may serve a small section of beach.
Duration of Service Loss: Flooding impacts to different assets can be very different. A roadway may be flooded during an event, but be undamaged after draining. In contrast, if flooding depth exceeds the critical elevation of a building, an electrical system may be lost and require extensive and time‐consuming repairs.
This process requires careful consideration of the characteristics of the assets.
3.3 SCORING PROCESS
The asset classes to be scored include:
Parks
Streets
Beach Access Points
Buildings
Sewer Lifts
Stormwater Basin Inlets
Stormwater Pump Stations. A map of the assets evaluated is provided in Figure 3‐1.
When scoring each criterion for a given asset, the scorer considers what impact loss of the asset would have on the TOPB. Each of the six criteria are scored from 1‐5 with 5 representing the most valuable/impactful asset (=loss having the most profound impact for that criteria category) and 1 representing an asset of lower value. There is not one correct score, but the most useful scores result from a thoughtful process with multiple contributors, careful reviews and clearly stated assumptions. Also, the process may be updated as more information is available and views of different assets evolve.
Woods Hole Group, Inc. • A CLS Company
Coastal Flood Vulnerability Assessment 10 July 2019 Town of Palm Beach 2017‐0014‐00
See Proprietary Note on Title Page
Once scores are assigned for each criterion and all assets, the scores for each asset are summed to arrive at a total consequence score for a given asset. The total scores for each asset are normalized to a scale of 0‐100 as follows:
Sum of Asset Score Criteria X 100 Maximum Possible Asset Score
The maximum possible asset score is: 6 criteria x maximum score of 5/criterion = 30. However, the score is normalized and multiplied by 100 to result in a consequence score that is convenient for comparison. Therefore, the maximum normalized consequence score possible is 100.
3.4 CONSEQUENCE SCORING RESULTS
A primary deliverable of this study is the consequence scoring results. Each of the ~2,200 individual Town assets was assigned a consequence score. These scores provide the initial basis for the vulnerability study and prioritization. With so many Town assets, there are voluminous tables summarizing the results. For purposes of this report, the information is attached as a hard copy. The Town also is provided with the raw data and spreadsheets, which can be refined by Town staff as appropriate. Other clients have used these tables to add future assets, and/or to refine the scores as more is learned about the different assets. As explained further in Section 4, the tables also include the other data elements necessary to compute the CVI to help prioritize Town assets for actions to increase coastal resilience.
The individual criteria scores and consequence scores are provided in Tables 3‐1 through 3‐7 (by asset category and asset), and again in Table 3‐8 for all assets combined. These different formats help facilitate review. For instance, the individual categories of assets can be reviewed independently using Tables 3‐1 through 3‐7, whereas Table 3‐8 provides a full list of all the Town assets ranked by descending consequence score. This is particularly helpful when trying to compare individual buildings that fit on one single table (Table 3‐4). By contrast, the data for the 1,700 stormwater basin inlets (Table 3‐6) requires almost a 30‐page table. To understand the relative consequence scores for all Town assets types, Table 3‐8 listed them in descending order by consequence score, comprising more than 50 pages. To facilitate review, the attached section of tables contains an upfront index of the contents to guide the reader, as well as color‐coded page breaks between different tables.
General assumptions and findings:
Over 2,200 TOPB assets were given a consequence score with the vast majority (1,700) of those assets being stormwater basin inlets;
Town government and emergency services buildings were given relatively high overall consequence scores (note this is value‐based only, independent from vulnerability);
Woods Hole Group, Inc. • A CLS Company
Coastal Flood Vulnerability Assessment 11 July 2019 Town of Palm Beach 2017‐0014‐00
See Proprietary Note on Title Page
A subset of sewer lift stations were also scored high because if they fail, pumping of sewage to the off‐island treatment facility would be limited, and sewage could be spread in the Town presenting a health issue;
A subset of stormwater pumps, though scoring lower than sewer pumps given that the health concerns are lower, are also in the top 100 highest consequence scores since failure of pumping systems exacerbates flooding and associated damage to other Town assets;
Major roadways, evacuation routes, bridge access roads are also given high consequence scores due to the need to preserve the ability to transit to/from the Island;
In contrast, beach access points, parks, secondary roads, stormwater basins (because they are passive), and recreational buildings are scored comparatively lower than the other assets.
The scoring process requires assumptions regarding areas served. For assets such as the sewer lift station and stormwater pumps, resolution of service area for each individual pump is low. If there is information for differentiating among individual pumps, the scoring can be updated. Based on consultations with the Town, it is not presently appropriate to distinguish the importance of flood risk from one area of Town to another.
4.0 COASTAL FLOOD VULNERABILITY ASSESSMENT RESULTS
The results of the coastal vulnerability assessment are organized to facilitate implementation plan development and adaptations. The analysis provides the following outputs:
Probability of flooding and depth of flooding for present day and a future scenario;
Determination of critical assets subject to flooding;
Initial assignment of consequence (of failure) score (asset valuation); and
Calculation of Coastal Vulnerability Index (CVI risk scores). These results are used directly to develop and prioritize asset‐specific adaptation recommendations, and ultimately to inform the next phase of this work. For Town‐wide planning, the next phases may be development of an implementation plan. More immediately, highest priority assets at most risk of flooding may warrant more immediate action.
4.1 PROBABILITY OF INUNDATION AND INUNDATION DEPTH
A primary deliverable from this vulnerability assessment is the model output. From all the storms simulated, maps of the Town were generated illustrating the probability of inundation. For purposes of this assessment, probability of inundation is defined as the percent probability
Woods Hole Group, Inc. • A CLS Company
Coastal Flood Vulnerability Assessment 12 July 2019 Town of Palm Beach 2017‐0014‐00
See Proprietary Note on Title Page
that a specific location will be covered by at least 5 cm of water in a given year. These results are provided in hard copy in the attached set of figures, specifically Figures 4‐1A through 4‐7A (for Present Day) and Figures 4‐1B through 4‐7B (for the Future scenario). The top panel on each of these figures maps the probability of inundation for the whole Town, along with a black box surrounding the zoomed area shown in more detail on the remaining 4 panels across the bottom of each figure. The left most vertical panel illustrates the inundation probability in more detail for the zoomed section. The probability of inundation map scale is shown by the color bar, which ranges from white (dry or 0% inundation probability) to black (100% inundation probability). The scale is not linear; rather, finer increments are shown at lower probabilities. For example, Figure 4‐1A shows for present day conditions that the northernmost portion of the island is mostly light green (5% inundation probability) and yellow (1% inundation probability).
The probability of inundation model results is useful for gaining an understanding of the patterns of flooding vulnerability. In addition, it is helpful to understand the depth of flooding corresponding to certain inundation probabilities. Depending upon the asset in question, some may tolerate several feet of sustained flooding, whereas others may be at risk from less than one foot of water (particularly salty coastal storm surge water) even for a short period. To present this detail, the inundation maps (Figures 4‐1 through 4‐7) also serve as depth maps to help determine whether adaptations are needed now or in the future. These depths of inundation are shown in the remaining three panels across the bottom of each Figure. Depth maps are provided for a 1% probability scenario, 10% probability scenario, and 25% probability scenario. The color bar transitions from red to blue ranging from a peak flood depth of 1 ft to more than 9 ft. If there is no color, then the flood depth is less than 5 centimeters for that scenario. Again, using Figure 4‐1A as the example, the right‐most panel shows only the coastal fringe is expected to have even 1 ft of flooding in the present day for a 25% annual event. By contrast, the depth associated with a 1% inundation probability event (100‐year storm) can be several feet. These are interpreted as the depth of flooding that would result from a storm having a particular probability of occurrence in a given year.
Probability of inundation is valuable for identifying spatial patterns and vulnerabilities at different scales, and the maps provide an understanding of how those vulnerabilities change from present day to a future scenario. For instance, comparing Figures 4‐1A for present case and 4‐1B for future case is instructive.
This information is also provided to the Town in the form of GIS compatible raster (.tif) formatted files for on‐screen planning work by Town staff.
General observations include:
The backside of the island has higher probabilities of inundation than the front side under present day and future conditions;
Woods Hole Group, Inc. • A CLS Company
Coastal Flood Vulnerability Assessment 13 July 2019 Town of Palm Beach 2017‐0014‐00
See Proprietary Note on Title Page
Some areas are at low risk with a probability of inundation less than 0.1% under the present‐day and even the future scenario;
As expected, the probability of inundation and depth of inundation increases from present day to the future scenario. Areas subject to a 40%+ probability of inundation increase noticeably in the future.
There are specific flood pathways from the Lake Worth side contributing to the highest inundation probabilities in specific areas. There are some areas of overtopping from the ocean side as well. The sources of water leading to these pathways offers natural opportunities for regional solutions that can intercept flood water and manage flood risk for multiple Town assets.
4.2 COASTAL VULNERABILITY INDEX
Another primary deliverable from this assessment is the ranked assets, using the combination of consequence scores for each asset along with the probabilities of flooding in present day and the future. This coastal vulnerability index (or CVI) combines the vulnerability estimates (probability of inundation) and the consequence score for Town‐owned/managed assets to provide a comparative index for purposes of prioritizing assets for adaptation projects. The CVI is calculated using this equation:
CVI = probability of flooding x consequence score As summarized in Section 3.3, the asset scores range (normalized) is from 0 ‐ 100. As summarized in Section 4.1, inundation probabilities vary from 0‐1 (0% ‐ 100%). The CVI is the product of those values, (i.e., the maximum possible score is 100 x 1 = 100). The CVIs are also presented on Tables 3‐1 through 3‐7 along with the asset consequence scores. The tables include a CVI for present day vulnerabilities, a CVI for future vulnerability, and a Total CVI capturing a combined present/future vulnerablity. For purposes of this assessment, the Total CVI was computed based on 70% of the Present Day CVI and 30% of the Future Case CVI. The raw data and Excel‐compatible files are provided to the Town in case a different calculation method is desired (e.g., to reduce or raise influence of the future case CVI).
The CVI calculation also is presented graphically in the form of maps based on flood risk vulnerability percentage, consequence score, and CVI. For instance, the maps in Figures 4‐8A and 4‐8B show these three parameters graphically for the 30 assets with the highest combined CVI (present day and future)2. This subset was extracted for presentation purposes. A full list of ranked combined CVIs for all assets is provided in Table 4‐9.
2 Note: the scale for the CVI Figure captures the minimum and maximum (~0‐60) of the calculated CVIs (rather than the full scale of possible scores 0‐100). The scores are comparative only.
Woods Hole Group, Inc. • A CLS Company
Coastal Flood Vulnerability Assessment 14 July 2019 Town of Palm Beach 2017‐0014‐00
See Proprietary Note on Title Page
It should be emphasized that CVIs are not absolute scores. They are useful for comparing the relative risk of assets, but there is no specific breakpoint above which some action is required. Buildings, park infrastructure (municipal dock, park and causeway), sewers and main roadways have the highest CVIs, reflecting the combined high probability of inundation and high consequence of failure scores. As illustrated in Figure 4‐8B, there is a grouping of assets with high CVIs around the embayment adjacent to Worth Avenue on the Lake Worth side. This represents a vulnerable and valued region that would benefit from a regional adaptation (e.g., see Section 5 for further discussion about local site‐specific and regional adaptations).
4.3 INFLUENCE OF UPLAND FRESHWATER DISCHARGE TO LAKE WORTH
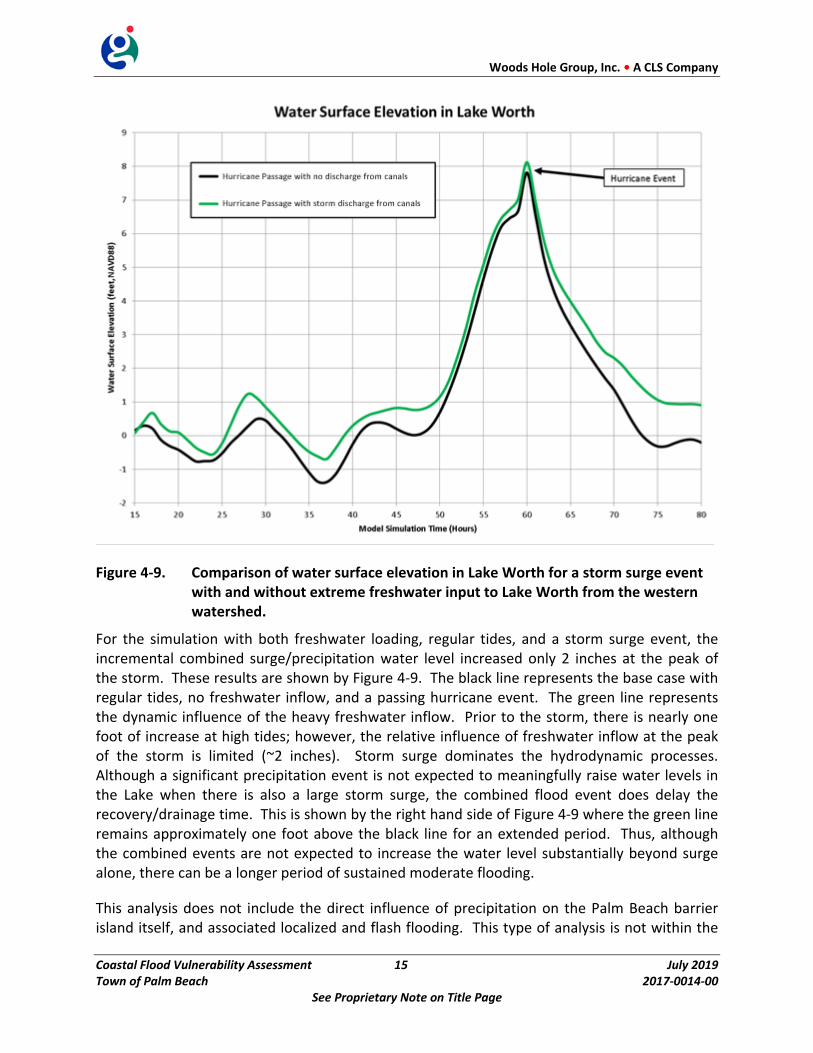
Lake Worth is known to receive substantial freshwater loads from the upland watershed and drainage system to the west. A sensitivity analysis was conducted to determine the relative influence of this freshwater loading as compared to coastal storm surge and associated flooding. Freshwater discharge records from USGS and other sources were reviewed, and an actual large precipitation event from 1999 was selected for analysis. For this event, USGS recorded stream flow observations for three major canals entering Lake Worth. Preliminary extremal analysis suggests this event matched or exceeded what is believed to be a 100‐year, 24‐hour precipitation‐based event for the region.
Model simulations were conducted including this freshwater input volume for regular tides with and without a hurricane storm surge. For the simulation with the freshwater loading, regular tides, and no storm surge, the maximum water level in Lake Worth increased by just under one foot compared to the regular tides. This demonstrated that during a heavy precipitation event with no associated storm surge, there is a relatively significant influence on the water levels in Lake Worth as water is delivered from the western watershed.
Woods Hole Group, Inc. • A CLS Company
Coastal Flood Vulnerability Assessment 15 July 2019 Town of Palm Beach 2017‐0014‐00
See Proprietary Note on Title Page
Figure 4‐9. Comparison of water surface elevation in Lake Worth for a storm surge event with and without extreme freshwater input to Lake Worth from the western watershed.
For the simulation with both freshwater loading, regular tides, and a storm surge event, the incremental combined surge/precipitation water level increased only 2 inches at the peak of the storm. These results are shown by Figure 4‐9. The black line represents the base case with regular tides, no freshwater inflow, and a passing hurricane event. The green line represents the dynamic influence of the heavy freshwater inflow. Prior to the storm, there is nearly one foot of increase at high tides; however, the relative influence of freshwater inflow at the peak of the storm is limited (~2 inches). Storm surge dominates the hydrodynamic processes. Although a significant precipitation event is not expected to meaningfully raise water levels in the Lake when there is also a large storm surge, the combined flood event does delay the recovery/drainage time. This is shown by the right hand side of Figure 4‐9 where the green line remains approximately one foot above the black line for an extended period. Thus, although the combined events are not expected to increase the water level substantially beyond surge alone, there can be a longer period of sustained moderate flooding.
This analysis does not include the direct influence of precipitation on the Palm Beach barrier island itself, and associated localized and flash flooding. This type of analysis is not within the
Woods Hole Group, Inc. • A CLS Company
Coastal Flood Vulnerability Assessment 16 July 2019 Town of Palm Beach 2017‐0014‐00
See Proprietary Note on Title Page
scope of this investigation, and is specifically related to the function and capacity of the storm water management system. Point of emphasis relative to this coastal flood vulnerability assessment is when there is a surge event that raises water levels above the elevation of the storm water discharge pipes, there is limited ability to pump water off of the island into the Lake for the period of time when the surge is present. At times when the coastal surge causes flooding, these coastal flood volumes dwarf the volumes of water derived on land from precipitation, and thus are the dominant factor for coastal resilience planning as addressed by this assessment.
5.0 ADAPTATIONS
5.1 OVERVIEW
With a prioritized list of the assets of varying value and vulnerability to flooding, the next step in the process is to narrow the focus to the most vulnerable and valued assets for adaptation planning. The process of developing adaptation priorities is iterative and based on multiple lines of evidence. The primary screening tool to identify candidate areas for adaptation projects is the CVI assessment. High CVI scores are associated with assets at particularly high risk. Ultimately, the concurrence of high value and high vulnerability indicates adaptations are needed for a given asset(s). Consideration of adaptations leads to important planning questions:
Which assets are vulnerable and where are they located?
Which assets (high value/high vulnerability) have a projected depth of inundation that exceeds a critical elevation (specific to each asset)?
Is there a convergence of vulnerable assets (i.e. adaptations that protect multiple assets are more efficient) in a location?
What adaptation approach is most effective for each asset group, e.g. protect, accommodate or retreat?
When considering adaptations, it is important to account for two different types of flooding. Episodic flooding occurs from storm events, while periodic nuisance flooding is more regular and can be tidal. Some assets, such as infrastructure, may be particularly vulnerable to episodic flooding because the high water can limit access and functionality and even cause permanent damage (e.g., erosion, salt water fouling of equipment, damage to culverts). Other assets, such as parks and roads, may be able to accommodate and/or recover from episodic inundation. Similar consideration was given to the resiliency of assets exposed to future periodic (tidal) flooding. In all cases, the adaptive capacity of the asset is considered when developing adaptation strategies. Adaptation strategies that address episodic flooding typically fall on the Protect‐Accommodate portion of the spectrum, while strategies that address periodic flooding typically fall on the Accommodate‐Retreat portion.
Woods Hole Group, Inc. • A CLS Company
Coastal Flood Vulnerability Assessment 17 July 2019 Town of Palm Beach 2017‐0014‐00
See Proprietary Note on Title Page
Woods Hole group sought to identify example opportunities for maximizing the economy of intervention in the development of adaptation strategies. There are many ways to achieve this when planning adaptation interventions. The most direct way in this assessment was concentrating on areas where assets with high CVIs are co‐located. Another way to achieve economy of intervention is to identify projects that build resiliency in infrastructure over time and/or space to reduce vulnerability for other assets. For instance, a beach nourishment project and seawalls provide a buffer protecting adjacent infrastructure from inundation and erosion, and, by design, protect vulnerable assets behind the beach.
In the section that follows, three sample adaptations are introduced. These are not by any means the only areas where adaptations are possible to limit flood risk and build coastal resilience. These also are not recommendations, per se. Rather, the descriptions are conceptual in this analysis for demonstration purposes. The Town will have to prioritize the projects and assets before taking action, and detailed plans would be developed following the completion of an implementation plan that lays out a cost‐effective path forward to build resilience for the TOPB.
5.2 ADAPTATION EXAMPLES
In this Section, three (3) example adaptations are reviewed (Figure 5‐1). Examples are presented at specific locations throughout the Town that are regional entry points of flooding. Cross‐sections of potential adaptation options are presented for these specific examples to provide an idea of the range of adaptation approaches and concepts that could be developed as part of an overall implementation planning process. These examples also would be supplemented with a timeline focusing on when certain adaptations should be considered.
5.2.1 Deployable Flood Barrier Example.
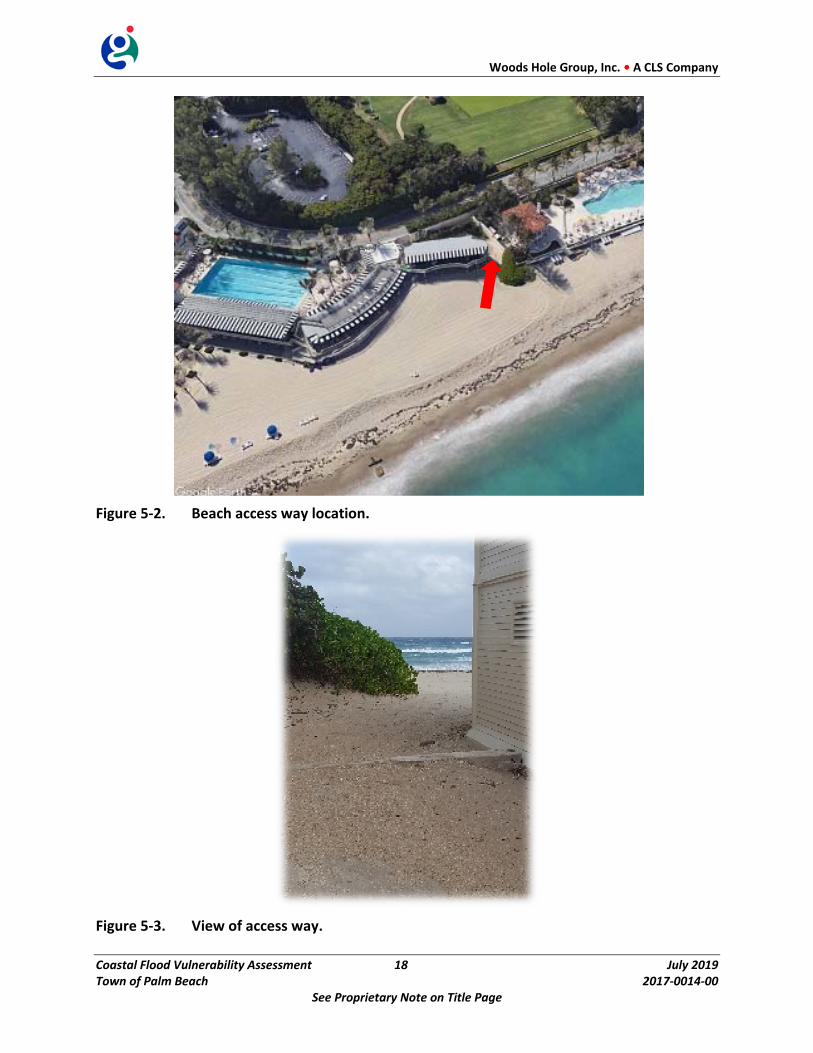
Some beach access ways are particularly vulnerable to both episodic and periodic flooding. They are also important flood pathways to areas behind the beach sea walls. They provide an important function, access to beach recreation for tourists and residents. For example, Figures 5‐2 and 5‐3 show a beach access way that may be vulnerable to coastal flooding.
Woods Hole Group, Inc. • A CLS Company
Coastal Flood Vulnerability Assessment 18 July 2019 Town of Palm Beach 2017‐0014‐00
See Proprietary Note on Title Page
Figure 5‐2. Beach access way location.
Figure 5‐3. View of access way.
Woods Hole Group, Inc. • A CLS Company
Coastal Flood Vulnerability Assessment 19 July 2019 Town of Palm Beach 2017‐0014‐00
See Proprietary Note on Title Page
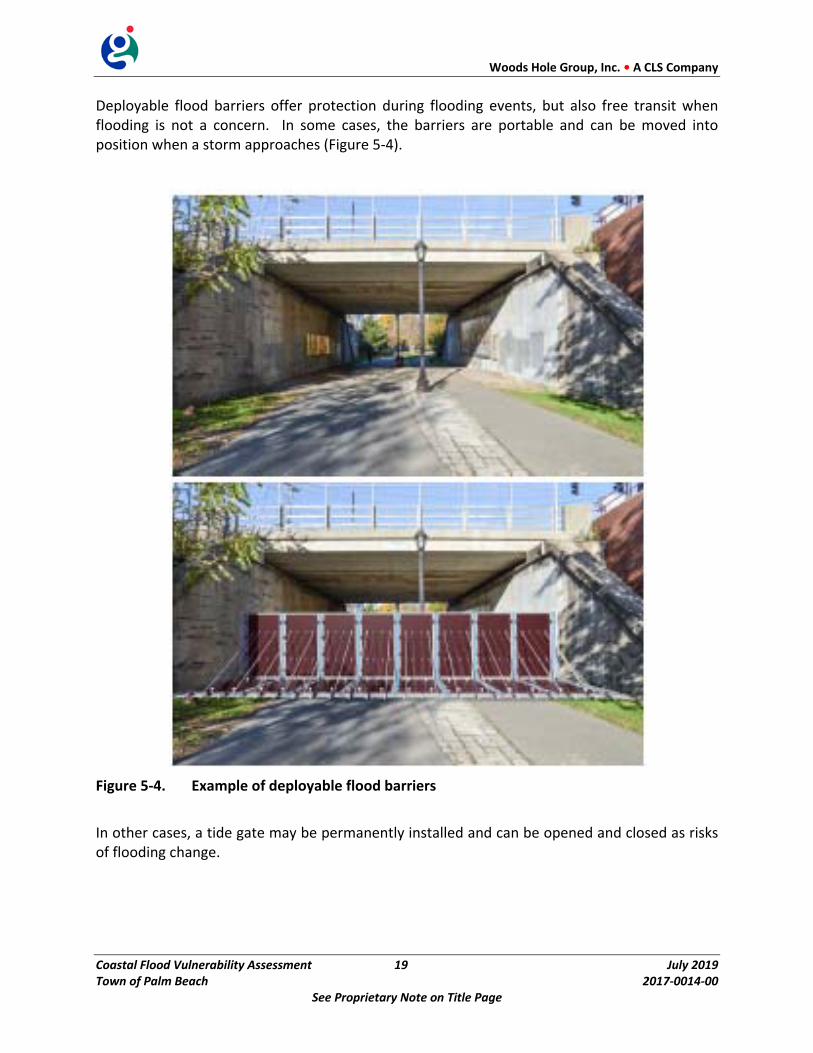
Deployable flood barriers offer protection during flooding events, but also free transit when flooding is not a concern. In some cases, the barriers are portable and can be moved into position when a storm approaches (Figure 5‐4).
Figure 5‐4. Example of deployable flood barriers
In other cases, a tide gate may be permanently installed and can be opened and closed as risks of flooding change.
Woods Hole Group, Inc. • A CLS Company
Coastal Flood Vulnerability Assessment 20 July 2019 Town of Palm Beach 2017‐0014‐00
See Proprietary Note on Title Page
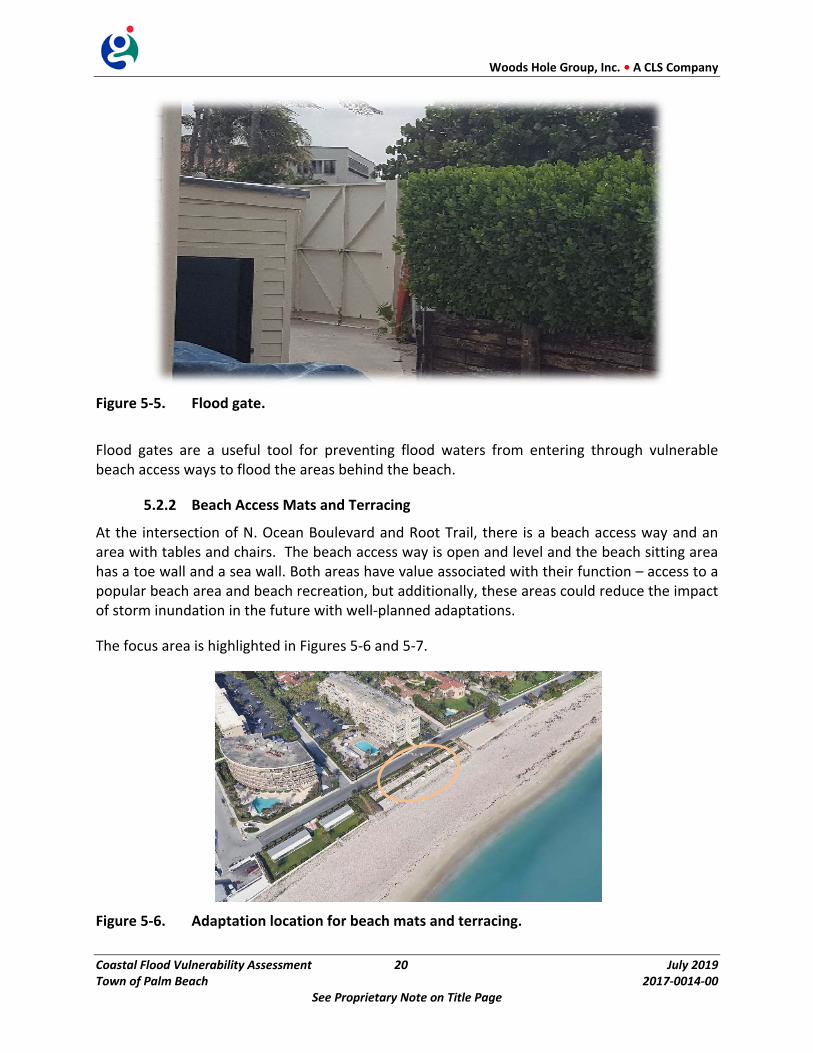
Figure 5‐5. Flood gate.
Flood gates are a useful tool for preventing flood waters from entering through vulnerable beach access ways to flood the areas behind the beach.
5.2.2 Beach Access Mats and Terracing
At the intersection of N. Ocean Boulevard and Root Trail, there is a beach access way and an area with tables and chairs. The beach access way is open and level and the beach sitting area has a toe wall and a sea wall. Both areas have value associated with their function – access to a popular beach area and beach recreation, but additionally, these areas could reduce the impact of storm inundation in the future with well‐planned adaptations.
The focus area is highlighted in Figures 5‐6 and 5‐7.
Figure 5‐6. Adaptation location for beach mats and terracing.
Woods Hole Group, Inc. • A CLS Company
Coastal Flood Vulnerability Assessment 21 July 2019 Town of Palm Beach 2017‐0014‐00
See Proprietary Note on Title Page
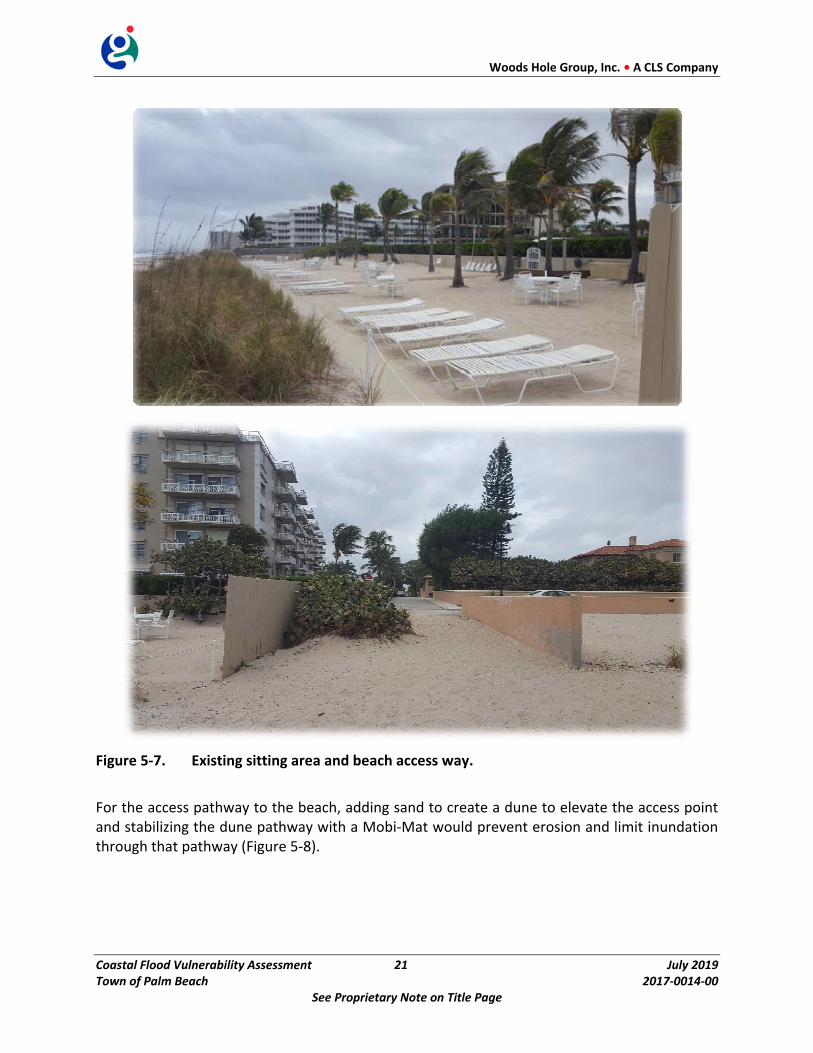
Figure 5‐7. Existing sitting area and beach access way.
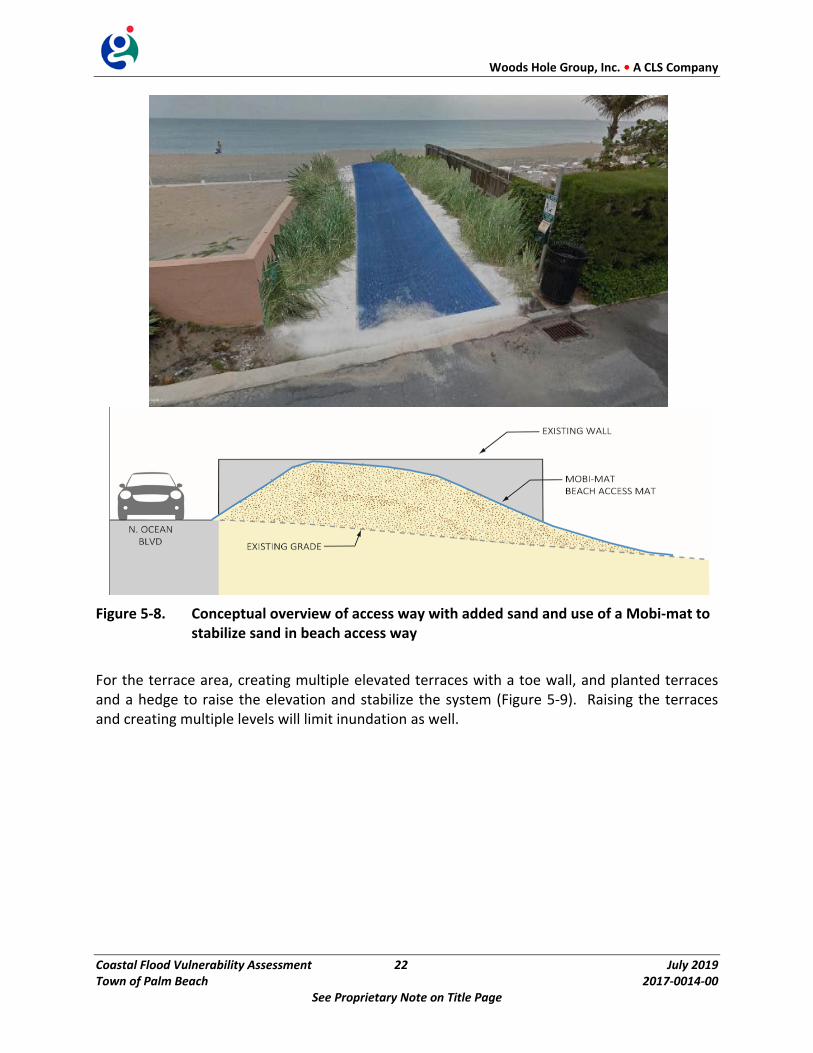
For the access pathway to the beach, adding sand to create a dune to elevate the access point and stabilizing the dune pathway with a Mobi‐Mat would prevent erosion and limit inundation through that pathway (Figure 5‐8).
Woods Hole Group, Inc. • A CLS Company
Coastal Flood Vulnerability Assessment 22 July 2019 Town of Palm Beach 2017‐0014‐00
See Proprietary Note on Title Page
Figure 5‐8. Conceptual overview of access way with added sand and use of a Mobi‐mat to stabilize sand in beach access way
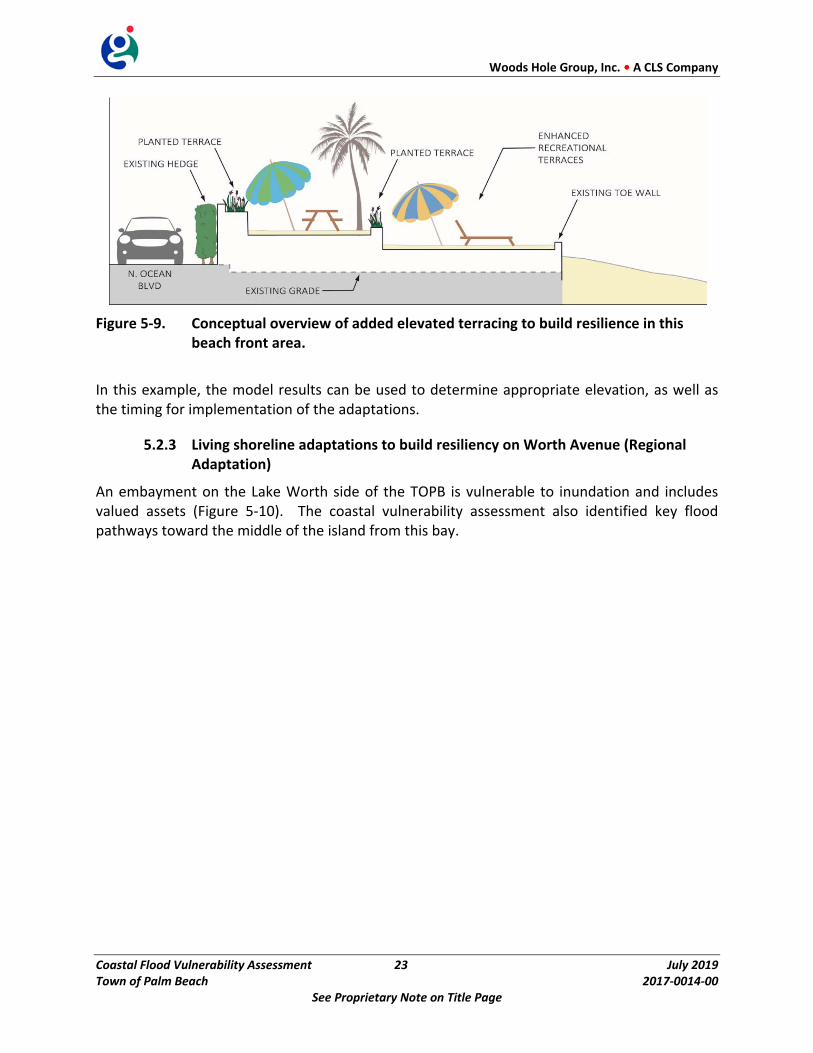
For the terrace area, creating multiple elevated terraces with a toe wall, and planted terraces and a hedge to raise the elevation and stabilize the system (Figure 5‐9). Raising the terraces and creating multiple levels will limit inundation as well.
Woods Hole Group, Inc. • A CLS Company
Coastal Flood Vulnerability Assessment 23 July 2019 Town of Palm Beach 2017‐0014‐00
See Proprietary Note on Title Page
Figure 5‐9. Conceptual overview of added elevated terracing to build resilience in this beach front area.
In this example, the model results can be used to determine appropriate elevation, as well as the timing for implementation of the adaptations.
5.2.3 Living shoreline adaptations to build resiliency on Worth Avenue (Regional Adaptation)
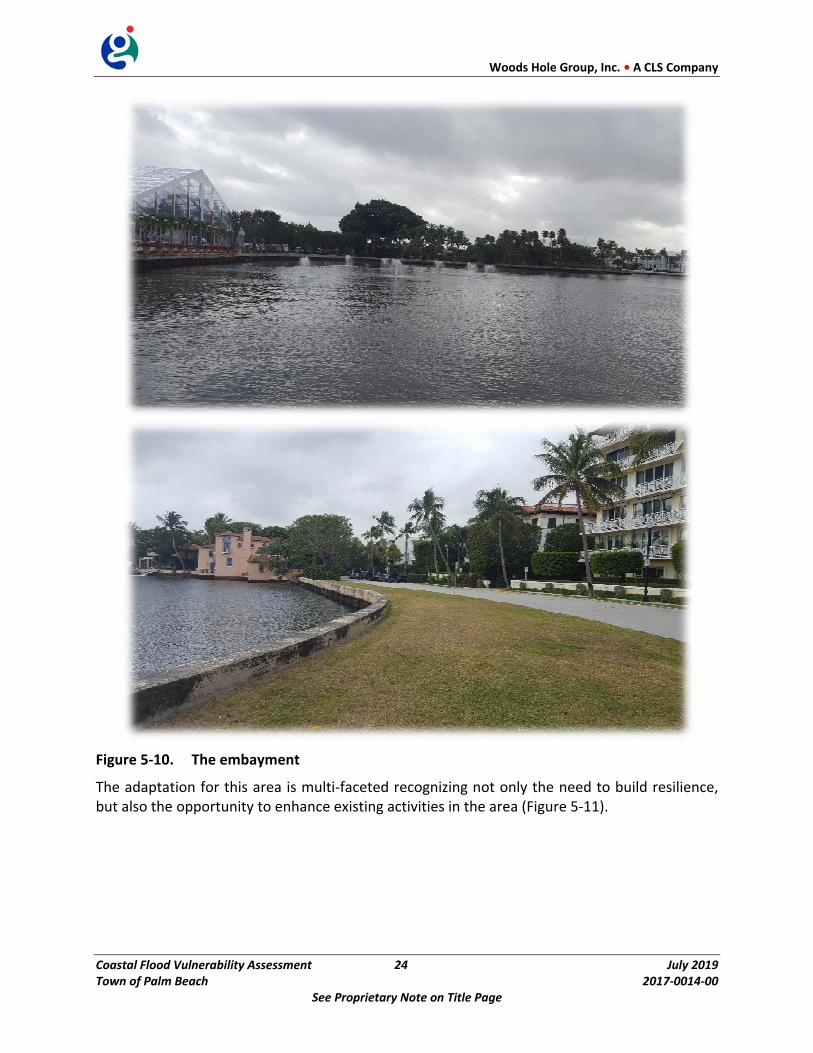
An embayment on the Lake Worth side of the TOPB is vulnerable to inundation and includes valued assets (Figure 5‐10). The coastal vulnerability assessment also identified key flood pathways toward the middle of the island from this bay.
Woods Hole Group, Inc. • A CLS Company
Coastal Flood Vulnerability Assessment 24 July 2019 Town of Palm Beach 2017‐0014‐00
See Proprietary Note on Title Page
Figure 5‐10. The embayment
The adaptation for this area is multi‐faceted recognizing not only the need to build resilience, but also the opportunity to enhance existing activities in the area (Figure 5‐11).
Woods Hole Group, Inc. • A CLS Company
Coastal Flood Vulnerability Assessment 25 July 2019 Town of Palm Beach 2017‐0014‐00
See Proprietary Note on Title Page
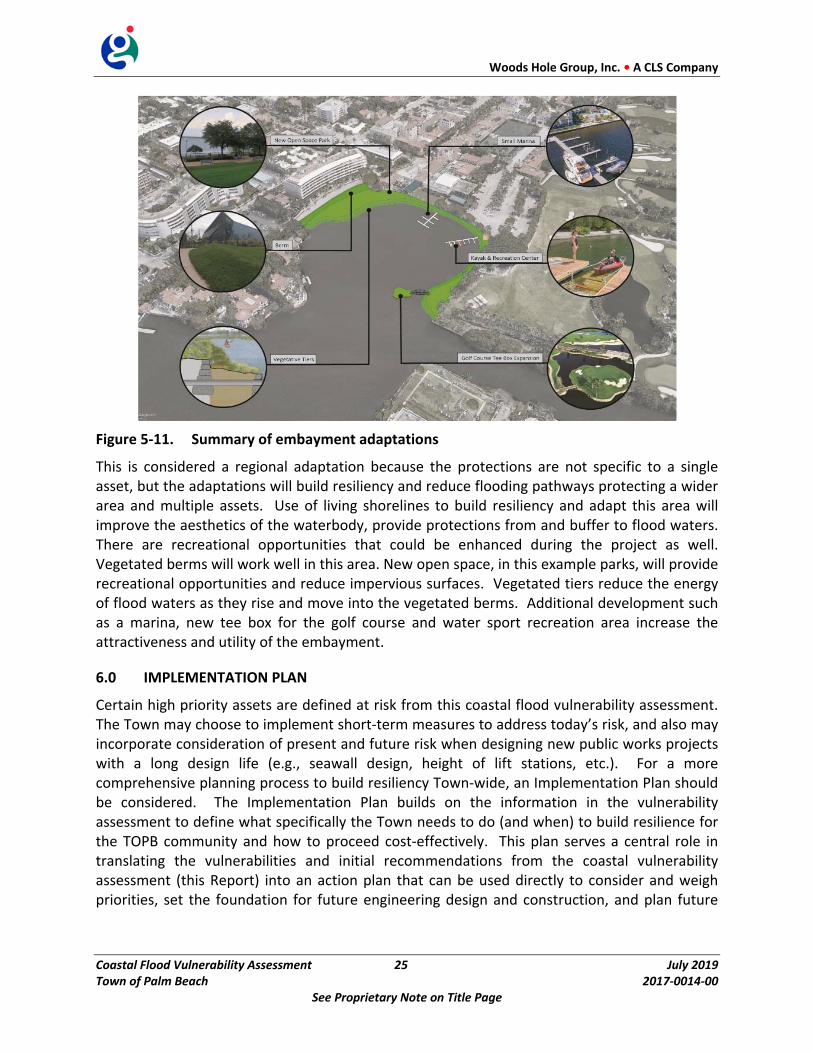
Figure 5‐11. Summary of embayment adaptations
This is considered a regional adaptation because the protections are not specific to a single asset, but the adaptations will build resiliency and reduce flooding pathways protecting a wider area and multiple assets. Use of living shorelines to build resiliency and adapt this area will improve the aesthetics of the waterbody, provide protections from and buffer to flood waters. There are recreational opportunities that could be enhanced during the project as well. Vegetated berms will work well in this area. New open space, in this example parks, will provide recreational opportunities and reduce impervious surfaces. Vegetated tiers reduce the energy of flood waters as they rise and move into the vegetated berms. Additional development such as a marina, new tee box for the golf course and water sport recreation area increase the attractiveness and utility of the embayment.
6.0 IMPLEMENTATION PLAN
Certain high priority assets are defined at risk from this coastal flood vulnerability assessment. The Town may choose to implement short‐term measures to address today’s risk, and also may incorporate consideration of present and future risk when designing new public works projects with a long design life (e.g., seawall design, height of lift stations, etc.). For a more comprehensive planning process to build resiliency Town‐wide, an Implementation Plan should be considered. The Implementation Plan builds on the information in the vulnerability assessment to define what specifically the Town needs to do (and when) to build resilience for the TOPB community and how to proceed cost‐effectively. This plan serves a central role in translating the vulnerabilities and initial recommendations from the coastal vulnerability assessment (this Report) into an action plan that can be used directly to consider and weigh priorities, set the foundation for future engineering design and construction, and plan future
Woods Hole Group, Inc. • A CLS Company
Coastal Flood Vulnerability Assessment 26 July 2019 Town of Palm Beach 2017‐0014‐00
See Proprietary Note on Title Page
budgets. An Implementation Plan may define specific triggers that, if exceeded, lead to direct actions.
As an example, there may be a specific Town asset at risk today that needs to be addressed in the short‐term with a relatively localized and inexpensive measure (e.g., deployable flood barrier around a sensitive building or utility). Something like this would be a local solution and recommended right away. In the mid‐term, though, say within the 10‐year planning cycle, a more regional solution might be recommended to intercept the flooding pathway. This could be more of a regional solution that would minimize the source flooding for specific asset(s) at risk, plus many others (e.g., living shoreline adaptations to the embayment described above).
In the longer‐term, there are Town assets in the analysis that will show minimal or an acceptable level of risk today, but that show serious potential for increased risk in the future.
In the context of the Town’s planning cycle, the vulnerability assessment was in the 10‐year plan; the implementation plan was not included in the 10‐year plan. Adding implementation to the 10‐year plan in the short‐term will allow the team to define specific projects and actions to include in the next planning cycle. Some specific actions in the Implementation Plan will be short‐term (i.e., to address today’s risk), some will be less urgent (or more complex) within the next 10‐year planning horizon, and some frankly will look beyond 10‐years. For these longer‐term considerations, the Implementation Plan will define the specific areas of future risk, certain monitoring and observations to conduct in the interim to determine whether the potential risk is actually materializing, and trigger points for taking action. The Implementation Plan will also consider costs‐benefits for what is recommended (e.g., consequence of not taking action today, compared to waiting).
Woods Hole Group, Inc. • A CLS Company
Coastal Flood Vulnerability Assessment 27 July 2019 Town of Palm Beach 2017‐0014‐00
See Proprietary Note on Title Page
7.0 REFERENCES
SE Florida Regional Climate Change Compact: Regional Climate Action Plan 2.0 (December 2017).
Florida Coastal Management Program, Florida DEP, NOAA. 2018. Florida Adaptation Planning Guidebook. June 2018.