A Computational Solution to Automatically Map …€¦ · INTRODUCTION. Metabolomics is the ......
12
METHODS published: 16 February 2016 doi: 10.3389/fmolb.2016.00002 Frontiers in Molecular Biosciences | www.frontiersin.org 1 February 2016 | Volume 3 | Article 2 Edited by: Wolfram Weckwerth, University of Vienna, Austria Reviewed by: Atsushi Fukushima, RIKEN, Japan Xue-Xian Zhang, Massey University, New Zealand *Correspondence: Franck Giacomoni [email protected]; Fabien Jourdan [email protected] Specialty section: This article was submitted to Metabolomics, a section of the journal Frontiers in Molecular Biosciences Received: 31 October 2015 Accepted: 25 January 2016 Published: 16 February 2016 Citation: Merlet B, Paulhe N, Vinson F, Frainay C, Chazalviel M, Poupin N, Gloaguen Y, Giacomoni F and Jourdan F (2016) A Computational Solution to Automatically Map Metabolite Libraries in the Context of Genome Scale Metabolic Networks. Front. Mol. Biosci. 3:2. doi: 10.3389/fmolb.2016.00002 A Computational Solution to Automatically Map Metabolite Libraries in the Context of Genome Scale Metabolic Networks Benjamin Merlet 1 , Nils Paulhe 2 , Florence Vinson 1 , Clément Frainay 1 , Maxime Chazalviel 1 , Nathalie Poupin 1 , Yoann Gloaguen 3 , Franck Giacomoni 2 * and Fabien Jourdan 1 * 1 TOXALIM (Research Centre in Food Toxicology), Institut National de la Recherche Agronomique, UMR1331, Université de Toulouse, Toulouse, France, 2 Nutrition Humaine, Plateforme d’Exploration du Métabolisme, Institut National de la Recherche Agronomique, Centre Clermont-Ferrand–Theix, UMR 1019, Saint-Genès-Champanelle, France, 3 Glasgow Polyomics, College of Medical, Veterinary and Life Sciences, University of Glasgow, Glasgow, UK This article describes a generic programmatic method for mapping chemical compound libraries on organism-specific metabolic networks from various databases (KEGG, BioCyc) and flat file formats (SBML and Matlab files). We show how this pipeline was successfully applied to decipher the coverage of chemical libraries set up by two metabolomics facilities MetaboHub (French National infrastructure for metabolomics and fluxomics) and Glasgow Polyomics (GP) on the metabolic networks available in the MetExplore web server. The present generic protocol is designed to formalize and reduce the volume of information transfer between the library and the network database. Matching of metabolites between libraries and metabolic networks is based on InChIs or InChIKeys and therefore requires that these identifiers are specified in both libraries and networks. In addition to providing covering statistics, this pipeline also allows the visualization of mapping results in the context of metabolic networks. In order to achieve this goal, we tackled issues on programmatic interaction between two servers, improvement of metabolite annotation in metabolic networks and automatic loading of a mapping in genome scale metabolic network analysis tool MetExplore. It is important to note that this mapping can also be performed on a single or a selection of organisms of interest and is thus not limited to large facilities. Keywords: chemical library, metabolic networks, metabolome mapping, web services, SaaS (Software As A Service) INTRODUCTION Metabolomics is the real-time outcome of the organism metabolism. To provide physiological interpretations and new hypotheses based on metabolomics datasets obtained on biofluids, tissue, or cellular extracts; it is of outmost importance to put the identified metabolites in a biological context. However, the analytical methods used in metabolomics do not allow coverage of the whole range of small molecules, introducing possible bias in the interpretation of whole- organism metabolism. Identifying which part of the metabolism can be detected in a metabolomics experiment could lead to more robust metabolomics studies.
Transcript of A Computational Solution to Automatically Map …€¦ · INTRODUCTION. Metabolomics is the ......
METHODSpublished: 16 February 2016
doi: 10.3389/fmolb.2016.00002
Frontiers in Molecular Biosciences | www.frontiersin.org 1 February 2016 | Volume 3 | Article 2
Edited by:
Wolfram Weckwerth,
University of Vienna, Austria
Reviewed by:
Atsushi Fukushima,
RIKEN, Japan
Xue-Xian Zhang,
Massey University, New Zealand
*Correspondence:
Franck Giacomoni
Fabien Jourdan
Specialty section:
This article was submitted to
Metabolomics,
a section of the journal
Frontiers in Molecular Biosciences
Received: 31 October 2015
Accepted: 25 January 2016
Published: 16 February 2016
Citation:
Merlet B, Paulhe N, Vinson F,
Frainay C, Chazalviel M, Poupin N,
Gloaguen Y, Giacomoni F and
Jourdan F (2016) A Computational
Solution to Automatically Map
Metabolite Libraries in the Context of
Genome Scale Metabolic Networks.
Front. Mol. Biosci. 3:2.
doi: 10.3389/fmolb.2016.00002
A Computational Solution toAutomatically Map MetaboliteLibraries in the Context of GenomeScale Metabolic NetworksBenjamin Merlet 1, Nils Paulhe 2, Florence Vinson 1, Clément Frainay 1, Maxime Chazalviel 1,
Nathalie Poupin 1, Yoann Gloaguen 3, Franck Giacomoni 2* and Fabien Jourdan 1*
1 TOXALIM (Research Centre in Food Toxicology), Institut National de la Recherche Agronomique, UMR1331, Université de
Toulouse, Toulouse, France, 2Nutrition Humaine, Plateforme d’Exploration du Métabolisme, Institut National de la Recherche
Agronomique, Centre Clermont-Ferrand–Theix, UMR 1019, Saint-Genès-Champanelle, France, 3Glasgow Polyomics,
College of Medical, Veterinary and Life Sciences, University of Glasgow, Glasgow, UK
This article describes a generic programmatic method for mapping chemical compound
libraries on organism-specific metabolic networks from various databases (KEGG,
BioCyc) and flat file formats (SBML and Matlab files). We show how this pipeline was
successfully applied to decipher the coverage of chemical libraries set up by two
metabolomics facilities MetaboHub (French National infrastructure for metabolomics
and fluxomics) and Glasgow Polyomics (GP) on the metabolic networks available in
the MetExplore web server. The present generic protocol is designed to formalize and
reduce the volume of information transfer between the library and the network database.
Matching of metabolites between libraries and metabolic networks is based on InChIs
or InChIKeys and therefore requires that these identifiers are specified in both libraries
and networks. In addition to providing covering statistics, this pipeline also allows
the visualization of mapping results in the context of metabolic networks. In order to
achieve this goal, we tackled issues on programmatic interaction between two servers,
improvement of metabolite annotation in metabolic networks and automatic loading of a
mapping in genome scale metabolic network analysis tool MetExplore. It is important to
note that this mapping can also be performed on a single or a selection of organisms of
interest and is thus not limited to large facilities.
Keywords: chemical library, metabolic networks, metabolome mapping, web services, SaaS (Software As A
Service)
INTRODUCTION
Metabolomics is the real-time outcome of the organism metabolism. To provide physiologicalinterpretations and new hypotheses based on metabolomics datasets obtained on biofluids,tissue, or cellular extracts; it is of outmost importance to put the identified metabolites in abiological context. However, the analytical methods used in metabolomics do not allow coverageof the whole range of small molecules, introducing possible bias in the interpretation of whole-organismmetabolism. Identifying which part of the metabolism can be detected in a metabolomicsexperiment could lead to more robust metabolomics studies.
Merlet et al. Mapping Metabolite Libraries in Networks
The chemical diversity of small molecules is vast asevidenced by the massive size of current databases suchas PubChem (60,870,896 compounds, October 2015; Kimet al., 2016), eMolecules (4,840,559 compounds referencedin ChemSpider, October 2015; Pence and Williams, 2010),or MolPort (5,292,051 compounds referenced in ChemSpider,October 2015). Nevertheless, most of these compounds are drugsor synthetic compounds and are thus not necessarily related tothe endogenous metabolism (in which metabolites are createdor consumed by cellular processes). Since, metabolomics aimsat deciphering metabolic modulations induced by environmentalor genetic factors on this intracellular metabolism (Nicholsonet al., 1999; Fiehn et al., 2000), researchers generally focuson endogenous metabolites and only monitor a small portionof these databases (Ramautar et al., 2013). This explains thesuccess of biology-oriented chemical databases such as theHuman Metabolome Database (HMDB, 41,993 compounds,October 2015; Wishart et al., 2013). These databases are largelyused for metabolite annotation purpose, for instance to assignputative names to masses obtained using high resolution massspectrometry. However, annotation can lead to ambiguities andrequires a final identification step (to reach level 1 as described inSumner et al., 2007) to provide high quality metabolite lists.
The last processing step in annotation is achieved bycomparing experimental spectra to those obtained usingstandard compounds (Creek et al., 2014). In order to increasethe number of possibly-identified compounds, metabolomicsfacilities are building libraries of these standard molecularfingerprints. These libraries are currently gathering hundreds ofstandards and corresponding spectra (proton Nuclear MagneticResonance [NMR) or Gas/Liquid Mass Spectrometry (LC/GCMS)]. In this article, we will consider two libraries as a proofof concept: the MetaboHub (French National infrastructure formetabolomics and fluxomics) PeakForest database and the oneassembled by Glasgow Polyomics facility (GP).
Biological variability implies that metabolism (and relatedmetabolome) differs from one organism to the other.Consequently, the number of metabolites referenced in thechemical library which can be detected in a given organismwill highly depend on the organism. This discrepancy incoverage of organism metabolomes has to be taken into accountby metabolomics facilities since, they will have to deal withsamples coming from a large range of organisms. The proposedcomputational solution aims at identifying how much of aspecific organism metabolome is covered by a library and whichparts of the metabolism can be monitored.
This metabolic information on each organism can be retrievedby using genome scale metabolic networks since they aim atgathering all metabolic reactions an organism can perform(Thiele and Palsson, 2010). A genome scale metabolic network isbuilt based on genome annotation, looking for encoded proteins(enzymes) catalyzing metabolic reactions. Several reconstructionplatforms are available (e.g., Pathway tools, Karp et al., 2015or model Seed, Devoid et al., 2013) and allow generatingnetworks containing thousands of reactions and metabolites.These networks can also be found under various file formats,the main one being Systems Biology Markup Language (SBML)
(Hucka et al., 2003). Repositories like BioModels (Wimalaratneet al., 2014), BIGG (Schellenberger et al., 2010), or MetExplore(Cottret et al., 2010) were created to warehouse these networks.Hence, the challenge is to link chemical libraries and theserepositories in order to find in which extent libraries’ contentscover the metabolic network of various organisms.
One of the main challenges in mapping metabolite lists onmetabolic networks is the weak consensus betweenmetabolomicsand modeling fields on the identifiers to be used to namemetabolites. In fact, there is a wide range of identifiers (ChEBI,InChI, SMILES, KEGG) available but they are not necessarilyused in network descriptions. Fortunately, some tools includingCTS (Chemical Translation Service; Wohlgemuth et al., 2010),MetMask (Redestig et al., 2010), or MNXRef (Bernard et al.,2014) of MetaNetX platform (Ganter et al., 2013) are designed toperform single or batch conversions between various identifiers(see also Haraldsdóttir et al., 2014 for a discussion on this topic).We propose in this article to use InChIs and InChIKeys as sharedidentifiers (Heller and McNaught, 2006; Heller et al., 2013).
This article describes a novel protocol designed to performchemical library mapping on genome-scale metabolic networks.This protocol makes it possible for a chemical library to senda list of identifiers to a network database and then receivestatistics on the coverage of this list on metabolic networks. Wepropose an overall architecture to establish a remote dialoguebetween chemical library and network repository. We use twochemical libraries (PeakForest, GP library) and a metabolicnetwork repository (MetExplore) as data sources, and highlighthow to deal with some specific issues such as the identifiers usedto perform the mapping.
MATERIALS AND METHODS
Overall Architecture for Remote AccessWe used the concept of “Software As A Service” (SaaS)introduced by Dai et al. (2012) and defined as online-softwareservices and remote access facilities which make bioinformaticstools available through the web. With this approach, existingapplications, resources and/or algorithms are wrapped in asystem which can run massive jobs online with a high frequencycycle. Such SaaS architecture is thus very well suited formetabolome mapping on metabolic networks. This solutionhas the advantage of being more flexible and versatile thanother bioinformatics approaches such as developing a stand-alone functional package or binary software application. Anothersolution would be to offer web forms on top of the servercontainingmetabolic networks to query the database with a list ofmetabolites and get a mapping back, but this solution would lackflexibility, and in particular it would not allow complex queries(for more detailed description, please refer to Section “The SaaScode of conduct” in Supplemental Data Sheet 1).
Mapping requires accessing both the network database andthe chemical library which are often stored on different systemsand in different locations (see Figure 1). A way to connect thesetwo data sources, shown on the left of Figure 1, consists incopying the resource (e.g., a copy of the network database) in
Frontiers in Molecular Biosciences | www.frontiersin.org 2 February 2016 | Volume 3 | Article 2

Merlet et al. Mapping Metabolite Libraries in Networks
FIGURE 1 | Overall concept of the protocol. The aim of this study is to
advance the networking of resources (Resource Network) by proposing a way
to interconnect two independent resources: a GEM’s database and a chemical
library (Relationships in the network). This is achieved through a framework of
web services that will mutually enrich each side Graphical User Interface (GUI).
the in-house system (the chemical library). Requests are thenperformed locally and return the same results for the copiedrelease. The major drawback is that it requires maintaining theresource up-to-date by regularly importing the entire networkdatabase. In the second option, right part of Figure 1, theresource is stored on the remote server and accessed throughthe web when necessary. We chose this option since it has theadvantage of not needing to manage any database update.
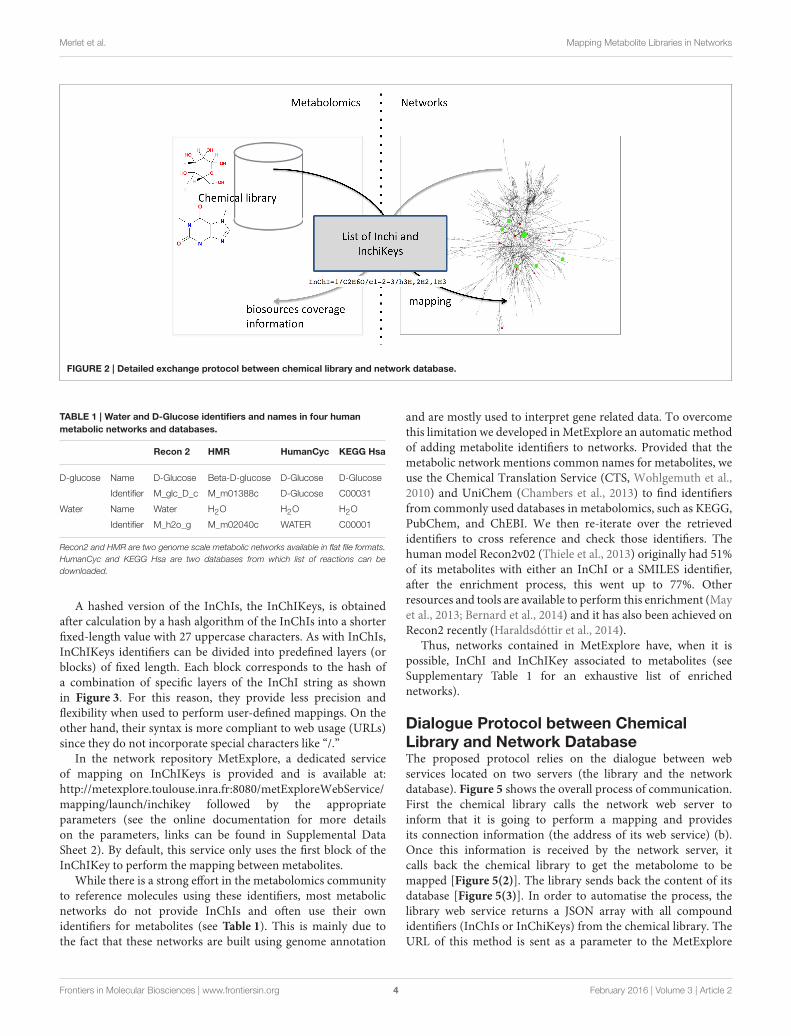
Principle of Web ServicesThe automatic mapping of a chemical library is establishedthrough a programmatic interaction between the library and thenetwork database (see Figure 2 for an overview). To allow dataexchange between both components, we use web services (i.e.,“a software system designed to support interoperable machine-to-machine interaction over a network,” W3C, World Wide WebConsortium, definition), and structured files. One advantage ofweb services is that they allow exchanges between two serversworking on different configurations (e.g., two operating systems).As result of W3C specifications and standards, web servicesare built on a “language transparency” policy: each side (clientand server) can use different technologies and programminglanguages and accesses (consumes) other services written in anykind of language.
In our computational method, we use the REST(Representational State Transfer) protocol which has theadvantage of handling various file formats like XML or JSON(JavaScript Object Notation). More importantly, REST does notrequire predefined methods for interactions with clients. REST
was chosen over the alternative solution called SOAP (SimpleObject Access Protocol) because SOAP does not offer these twofeatures.
Common Descriptors for Metabolites inLibraries and Network DatabasesMost metabolic networks are created for mathematicalsimulation purposes and are not necessarily built with theaim of importing “omics” data. This implies that metabolicnetworks often contain specific identifiers for metabolites. As anexample, D-glucose and water are present in most networks butmay have a specific and different identifier in each network (seeTable 1).
Metabolomics community is putting some efforts in order toreference metabolites using controlled vocabularies and specificidentifiers (Salek et al., 2015). Among them, most commonlyused ones are ChEBI (Hastings et al., 2013), KEGG (Kanehisaet al., 2014), and PubChem (Kim et al., 2016) identifiers.Nevertheless, these identifiers do not provide any structuralinformation on compounds and when dealing with compoundswhich are not referenced in any database, one needs neverthelessa way to identify these compounds. To overcome this issue,identifiers describing chemical structure, and thus independentfrom any database, are increasingly used in metabolomics. TheIUPAC Organic Nomenclature provides this information butthis naming convention generates long and complex names. Forexample, the IUPAC name of the D-Glucose is: (3R,4S,5S,6R)-6-(hydroxymethyl)oxane-2,3,4,5-tetrol. To ensure consistency andinclude structural information in our computational method, wechose the InChI (IUPAC International Chemical Identifier) andthe InChIKey which are two other structural identifiers receivinga lot of interest in the field (Heller and McNaught, 2006; Helleret al., 2013; Galgonek and Vondrášek, 2014).
InChI identifiers provide a formal and non-ambiguousidentification of compounds (see Figure 3 for examples). InChIsare layered identifiers, in which each successive layer providesmore detailed information about the structure of the molecule(formula, carbon backbone, protonation. see http://www.inchi-trust.org/technical-faq/ for a detailed description of theselayers). This layered structure allows flexibility when establishingcorrespondence between twometabolites. Moreover, using InChIidentifiers has the advantage that it is possible to detect that twocompounds are in two different forms (acid and base) of the samemolecule by taking into account the information of a specificlayer (Figure 3).
A methodological complication when using InChIs tocompare molecules is the parsing (automatic computationalreading) and analysis of the InChI string itself. In fact, if somelayers of the identifiers are empty, the single letter tag of that layerwill be completely discarded from the string [see Figure 4(1)].Moreover, some layers, and their tags, can be present severaltimes in the identifier as shown in Figure 4(2).
To address these issues, we implemented a method on theMetExplore web server to compare two InChIs. Layers areconsidered as parameters in the comparison and a Boolean valueis returned if the two InChIs match.
Frontiers in Molecular Biosciences | www.frontiersin.org 3 February 2016 | Volume 3 | Article 2
Merlet et al. Mapping Metabolite Libraries in Networks
FIGURE 2 | Detailed exchange protocol between chemical library and network database.
TABLE 1 | Water and D-Glucose identifiers and names in four human
metabolic networks and databases.
Recon 2 HMR HumanCyc KEGG Hsa
D-glucose Name D-Glucose Beta-D-glucose D-Glucose D-Glucose
Identifier M_glc_D_c M_m01388c D-Glucose C00031
Water Name Water H2O H2O H2O
Identifier M_h2o_g M_m02040c WATER C00001
Recon2 and HMR are two genome scale metabolic networks available in flat file formats.
HumanCyc and KEGG Hsa are two databases from which list of reactions can be
downloaded.
A hashed version of the InChIs, the InChIKeys, is obtainedafter calculation by a hash algorithm of the InChIs into a shorterfixed-length value with 27 uppercase characters. As with InChIs,InChIKeys identifiers can be divided into predefined layers (orblocks) of fixed length. Each block corresponds to the hash ofa combination of specific layers of the InChI string as shownin Figure 3. For this reason, they provide less precision andflexibility when used to perform user-defined mappings. On theother hand, their syntax is more compliant to web usage (URLs)since they do not incorporate special characters like “/.”
In the network repository MetExplore, a dedicated serviceof mapping on InChIKeys is provided and is available at:http://metexplore.toulouse.inra.fr:8080/metExploreWebService/mapping/launch/inchikey followed by the appropriateparameters (see the online documentation for more detailson the parameters, links can be found in Supplemental DataSheet 2). By default, this service only uses the first block of theInChIKey to perform the mapping between metabolites.
While there is a strong effort in the metabolomics communityto reference molecules using these identifiers, most metabolicnetworks do not provide InChIs and often use their ownidentifiers for metabolites (see Table 1). This is mainly due tothe fact that these networks are built using genome annotation
and are mostly used to interpret gene related data. To overcomethis limitation we developed inMetExplore an automatic methodof adding metabolite identifiers to networks. Provided that themetabolic network mentions common names for metabolites, weuse the Chemical Translation Service (CTS, Wohlgemuth et al.,2010) and UniChem (Chambers et al., 2013) to find identifiersfrom commonly used databases in metabolomics, such as KEGG,PubChem, and ChEBI. We then re-iterate over the retrievedidentifiers to cross reference and check those identifiers. Thehuman model Recon2v02 (Thiele et al., 2013) originally had 51%of its metabolites with either an InChI or a SMILES identifier,after the enrichment process, this went up to 77%. Otherresources and tools are available to perform this enrichment (Mayet al., 2013; Bernard et al., 2014) and it has also been achieved onRecon2 recently (Haraldsdóttir et al., 2014).
Thus, networks contained in MetExplore have, when it ispossible, InChI and InChIKey associated to metabolites (seeSupplementary Table 1 for an exhaustive list of enrichednetworks).
Dialogue Protocol between ChemicalLibrary and Network DatabaseThe proposed protocol relies on the dialogue between webservices located on two servers (the library and the networkdatabase). Figure 5 shows the overall process of communication.First the chemical library calls the network web server toinform that it is going to perform a mapping and providesits connection information (the address of its web service) (b).Once this information is received by the network server, itcalls back the chemical library to get the metabolome to bemapped [Figure 5(2)]. The library sends back the content of itsdatabase [Figure 5(3)]. In order to automatise the process, thelibrary web service returns a JSON array with all compoundidentifiers (InChIs or InChiKeys) from the chemical library. TheURL of this method is sent as a parameter to the MetExplore
Frontiers in Molecular Biosciences | www.frontiersin.org 4 February 2016 | Volume 3 | Article 2

Merlet et al. Mapping Metabolite Libraries in Networks
FIGURE 3 | Correspondence between chemical properties, InChI layers, and InChIKey blocks. (1) shows that the molecular skeleton of the compound
(formula, connectivity, and hydrogen bonds) is contained in the first block of the InChIKey, whereas the stereochemistry and the isotopic layers [as shown in (3)] are
contained in the InChIKey second block. (2) Shows the localization of the proton loss inside the InChI and InChIKey strings. (3) Shows that some layer identifiers can
be present multiple times inside a single InChI string. Here the “/t” layer is present a second time as a sub-layer of the isotopic layer. This is used to show the
asymmetric center created by the specification of the deuterium isotope. For each InChI, there is the corresponding InChIKey. We can see that the InChIKey’s first
block is always the same, this is because the molecular skeleton of the compound is the same in the three examples.
FIGURE 4 | Example of InChIs with no formula layer (1) or with isotopic
layer repeated (2). (adapted from InChI Technical Frequently Asked
Questions).
mapping web service. Finally, the network server replies with theresulting mapping and its corresponding identifier [Figure 5(4)].Each time the mapping web service is called, it retrieves a listof publicly available networks from the database (256 publicnetworks, 108 having been enriched with a sufficient number ofInChIs for mapping). It is important to note that each databaseand its web service exists on its own and is independent fromother services.
Returned Mapping ResultsMetExplore API sends back a JSON file containing informationon the mapping (see Supplementary Table 2 for detailed
FIGURE 5 | Dialogue protocol between chemical library and network
database.
description and Supplemental Data Sheet 3 for an example ofJSON results). The JSON is divided into sections, each onecorresponding to the mapping on a BioSource (network inMetExplore). A section contains general information relatedto the BioSource: name, strain, original source of information(KEGG, BioCyc, SBML), version number and MetExploreidentifier.
It also provides indicators of the network metabolome: totalnumber of metabolites present in the network, number ofmetabolites in the network which have an InChI (a compoundpresent in n compartments is counted n times) and the totalnumber of unique InChIs present in the network. These two
Frontiers in Molecular Biosciences | www.frontiersin.org 5 February 2016 | Volume 3 | Article 2
Merlet et al. Mapping Metabolite Libraries in Networks
last numbers are often different since, in network models,a metabolite is repeated each time it appears in a cellularcompartment. For example, D-glucose in Recon2 is present fivetimes corresponding to its localization in cytoplasm, endoplasmicreticulum, Golgi apparatus, lysosome, and extracellular space.So, it will be counted as five InChIs and one uniqueInChI.
Each section also contains mapping results, with the followinginformation:
• Total number of InChI from the network mapped in thelibrary.
• Total number of unique InChI from the network mapped inthe chemical library.
• Percentage based on the number of InChI found both inlibrary and network over the number of unique InChI in thenetwork.
• The network coverage (i.e., relative number of networkmetabolites that are present in the library).
• The library coverage (i.e., relative number of library InChIsthat are mapped into the network).
Finally, each section contains the MetExplore id of the mapping.This number will allow to accessing mapping directly inMetExplore as described in the next Section.
RESULTS
In this section, we present the pipeline implementation to mapthe content of two chemical libraries, MetaboHub PeakForest,and Glasgow Polyomics database. Files retrieved by theMetExplore web service were used as data sources to buildsummary tables of library coverage on a selection of modelorganisms or on an exhaustive list or organisms. Both librarieslink back to MetExplore allowing analyzing their content in thecontext of metabolic networks.
The MetaboHUB PeakForest database, through its metabolicprofiles storage and annotation services, hosts more than 1900metabolites (October 2015). The content of PeakForest hasbeen put together by a network of four French metabolomicfacilities: The Bordeaux Metabolome Platform (BMP) which isspecialized in metabolomics/lipidomics targeted or untargetedprofiling methods for plant samples and new plant compoundsidentification, the Clermont-Ferrand Metabolism ExplorationPlatform (PFEM) with its expertise on studying the effects of
nutrition on main the physiological functions in human andanimal models, the Paris Metabolome IDF, which brings itsknowledge and experience in mass spectrometry based analysisof human biofluids and cell extracts for biomarker discovery, andthe Toulouse MetaToul platform, which provides expertise inidentification and analysis of metabolic pathways and metabolicnetworks, measurement of metabolic fluxes, chemometrics,metabolic phenotyping, and biomarker identification.
This database encompasses substantial annotation andidentification work carried out on hundreds of metabolomicstudies with several models and phenotypes and confirmedby chemical standard analysis. Reference metabolites and theirfingerprints found in PeakForest cover several model speciesfrom a large taxonomic spectrum among which bacteria(Escherichia coli), plants (Arabidopsis thaliana), mammalian(Homo sapiens, Mus musculus).
PeakForest provides web service methods allowing remoteaccess to its chemical library. In addition to this possibilityof targeted queries (compound per compound), a web servicemethod was developed in order to send the whole chemicallibrary content to MetExplore mapping service. This additionalfeature did not require an extensive coding (e.g., 60 lines in Java,60 lines in Perl—The web services documentation URL withexamples is provided in the Supplemental Data Sheet 4) and wasfacilitated by the fact that an effort was performed by the fourfacilities to annotate all compounds using InChIs.
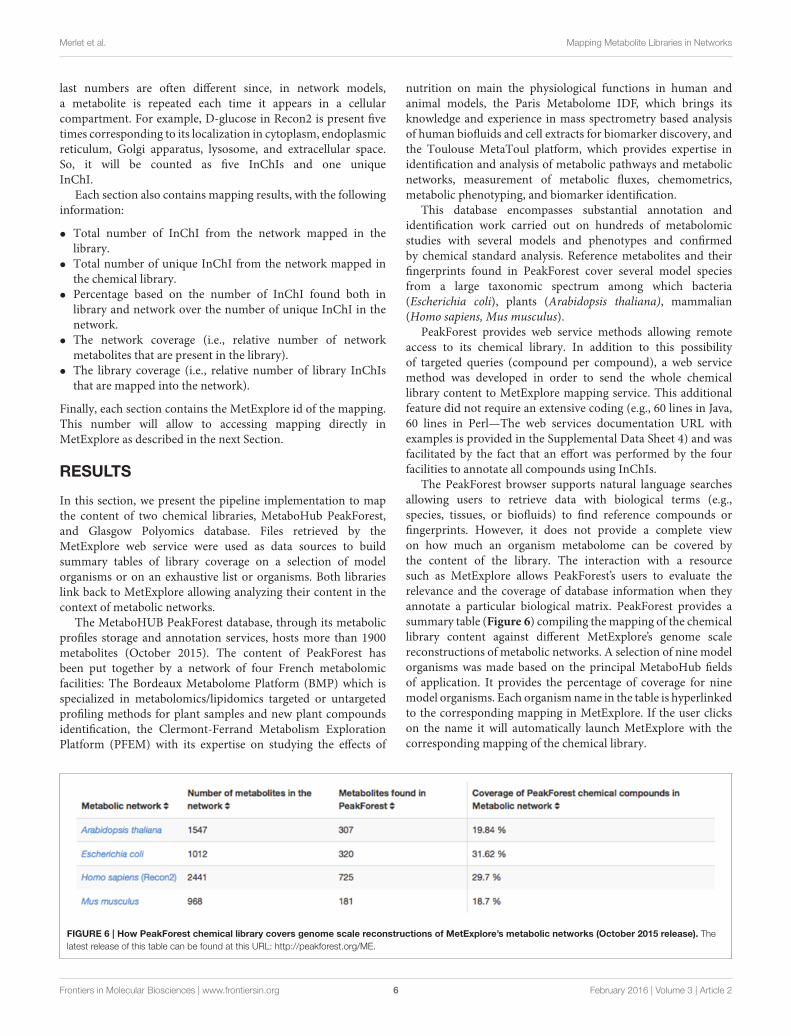
The PeakForest browser supports natural language searchesallowing users to retrieve data with biological terms (e.g.,species, tissues, or biofluids) to find reference compounds orfingerprints. However, it does not provide a complete viewon how much an organism metabolome can be covered bythe content of the library. The interaction with a resourcesuch as MetExplore allows PeakForest’s users to evaluate therelevance and the coverage of database information when theyannotate a particular biological matrix. PeakForest provides asummary table (Figure 6) compiling themapping of the chemicallibrary content against different MetExplore’s genome scalereconstructions of metabolic networks. A selection of nine modelorganisms was made based on the principal MetaboHub fieldsof application. It provides the percentage of coverage for ninemodel organisms. Each organism name in the table is hyperlinkedto the corresponding mapping in MetExplore. If the user clickson the name it will automatically launch MetExplore with thecorresponding mapping of the chemical library.
FIGURE 6 | How PeakForest chemical library covers genome scale reconstructions of MetExplore’s metabolic networks (October 2015 release). The
latest release of this table can be found at this URL: http://peakforest.org/ME.
Frontiers in Molecular Biosciences | www.frontiersin.org 6 February 2016 | Volume 3 | Article 2

Merlet et al. Mapping Metabolite Libraries in Networks
This mapping is automatically updated once a week to takeinto account potential changes in the library or in the networks.The table is also automatically updated every week by using theweb service pipeline.
GP compounds library contains a list of 240 metabolitesthat are routinely run as standard compounds for metabolomicanalyses. As GP contributes to a wide range of researchareas, it is meaningful to provide information to its user onthe coverage of a maximum number of organisms availablewithin MetExplore database. For this reason no filter onorganism is applied and the mapping is performed on allenriched organisms available in MetExplore database. Thelibrary coverage table is then built and made available toGP users. This table currently contains almost 60 differentmetabolic networks. Currently, the mapping has to be launchedmanually in order to update the coverage table; howeverPiMP constantly provides an open access to the list of InChIscorresponding to Glasgow Polyomics standard compound libraryand automatically parses the result sent back by MetExploreto generate the new table. This task is achieved using Django,a python web framework with which PiMP is developed. Thetable is made interactive to the user using javascript and allowssearch and filtering. The name is also clickable, allowing thevisualization in a new window of the web browser of the selectedmapping in MetExplore. Figure 7 shows the table createdin PiMP.
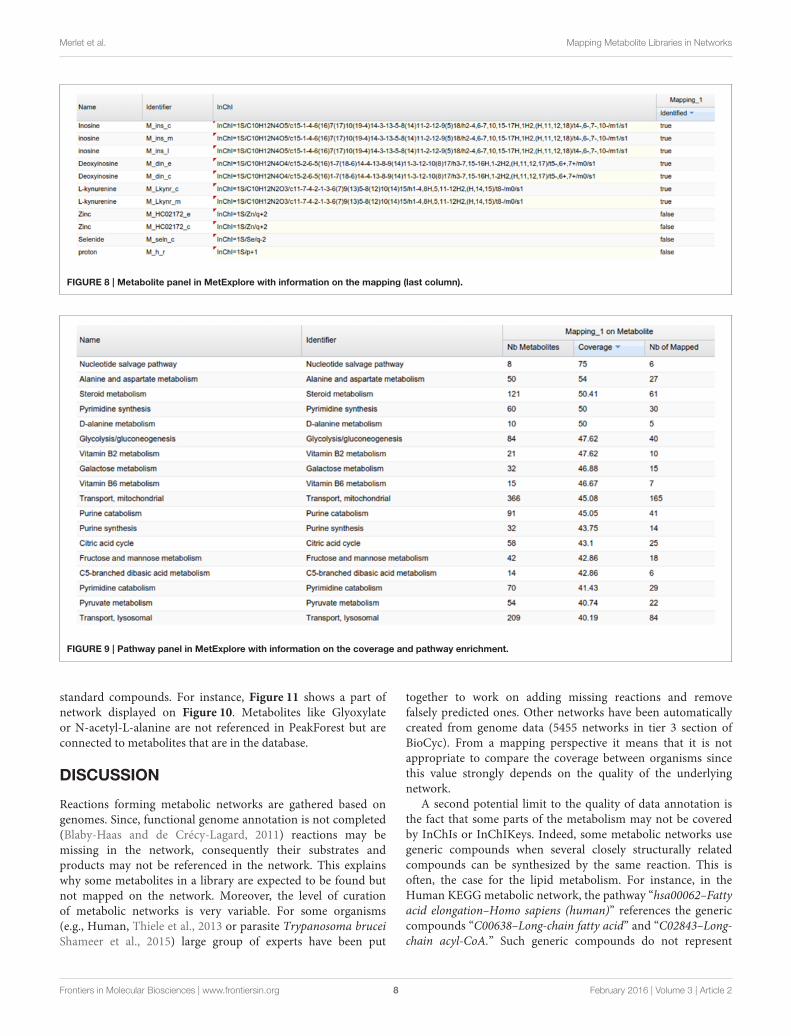
Visualizing Saved Mappings in MetexploreAs an example of the visual analysis, we use the mappingof PeakForest library on the Recon2 network. 294 metabolitesof the library were found among the 1177 unique InChIspresent in the network. As described earlier, MetExplore’s webservice sends back a mapping id (in this case, 27050) whichcan be used to create a URL (e. g., http://metexplore.toulouse.inra.fr/metexplore2/?idMapping=27050). Figure 8 shows howthis mapping is displayed in the MetExplore metabolite panel(containing all metabolites in the network). The last column,
called “identified,” contains a Boolean value indicating if themetabolite is found both in the network and in the chemicallibrary.
MetExplore also provides a view of all the metabolic pathwaysbelonging to the network (Figure 9). Output includes coveringpercentage of each pathway. It also provides the pathwayenrichment result (one-tailed Fisher’s Exact Test with Bonferronimultiple test correction). This test is generally used whenmapping biomarkers in order to detect which pathways aresignificantly overrepresented in the list (Xia and Wishart, 2010).Here, it tells which pathways the library is focused on.
One way of mining this large list of pathways involvesfiltering only those pathways highly covered by the mapping.MetExplore offers a filter facility which, based on a selectionof pathways (e.g., the ones with coverage over 50%), keepsin all the other panels (metabolites, reactions, genes) onlythe elements belonging to these pathways. For instance, inthe reaction panel, only reactions involved in the selectedpathways will be displayed. This set of reactions constitutesa sub-network that is highly covered by the chemicallibrary.
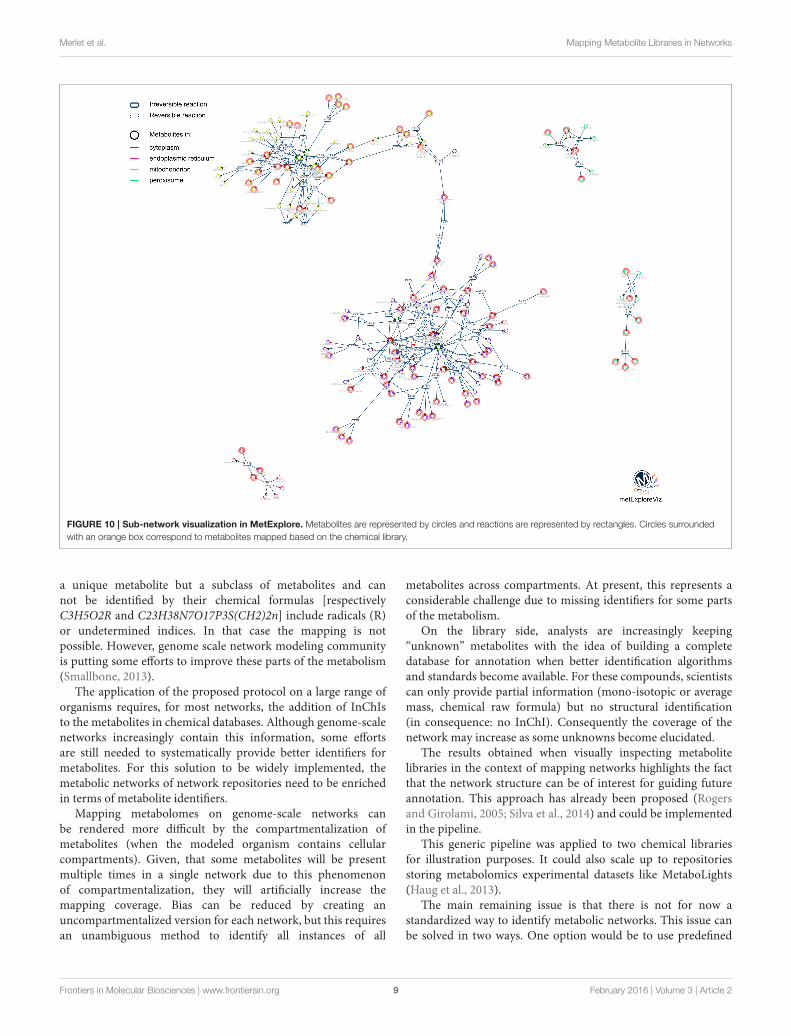
One of the main purposes of MetExplore is to provide aninteractive visualization of metabolic networks (or sub-networks)in order to mine metabolomics (and other “omics”) data. Oncethe mapping is performed, it is possible to visualize metabolitesin the context of the whole network, a specific pathway, aselection of pathways or a selection of reactions. For instance,based on the selection of reactions involved in pathways withcoverage higher than 50%, we extracted the network shownin Figure 10. The highlighted circles are the metabolites foundin the chemical library. One interesting point is to detectmetabolites in this sub-network that are not in the library andwhich may be of interest to complete the coverage of the sub-network.
One benefit of visualizing the mapping in the context ofthe network is, that it is then possible to detect potentialgaps in the library and orientate future analyses of specific
FIGURE 7 | Coverage of the first 10 metabolic networks (alphabetically sorted) by Glasgow Polyomics standard library. Latest and complete version of
this table can be found at this URL: http://polyomics.mvls.gla.ac.uk/polyomics_chemical_library/.
Frontiers in Molecular Biosciences | www.frontiersin.org 7 February 2016 | Volume 3 | Article 2
Merlet et al. Mapping Metabolite Libraries in Networks
FIGURE 8 | Metabolite panel in MetExplore with information on the mapping (last column).
FIGURE 9 | Pathway panel in MetExplore with information on the coverage and pathway enrichment.
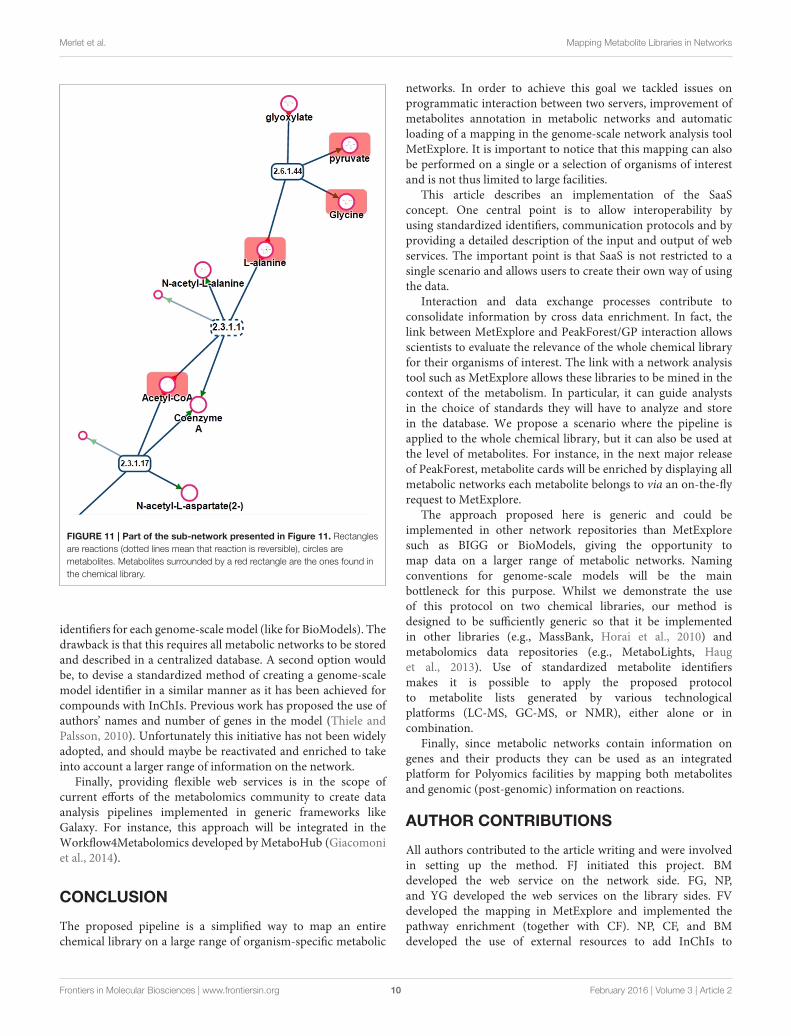
standard compounds. For instance, Figure 11 shows a part ofnetwork displayed on Figure 10. Metabolites like Glyoxylateor N-acetyl-L-alanine are not referenced in PeakForest but areconnected to metabolites that are in the database.
DISCUSSION
Reactions forming metabolic networks are gathered based ongenomes. Since, functional genome annotation is not completed(Blaby-Haas and de Crécy-Lagard, 2011) reactions may bemissing in the network, consequently their substrates andproducts may not be referenced in the network. This explainswhy some metabolites in a library are expected to be found butnot mapped on the network. Moreover, the level of curationof metabolic networks is very variable. For some organisms(e.g., Human, Thiele et al., 2013 or parasite Trypanosoma bruceiShameer et al., 2015) large group of experts have been put
together to work on adding missing reactions and removefalsely predicted ones. Other networks have been automaticallycreated from genome data (5455 networks in tier 3 section ofBioCyc). From a mapping perspective it means that it is notappropriate to compare the coverage between organisms sincethis value strongly depends on the quality of the underlyingnetwork.
A second potential limit to the quality of data annotation isthe fact that some parts of the metabolism may not be coveredby InChIs or InChIKeys. Indeed, some metabolic networks usegeneric compounds when several closely structurally relatedcompounds can be synthesized by the same reaction. This isoften, the case for the lipid metabolism. For instance, in theHuman KEGGmetabolic network, the pathway “hsa00062–Fattyacid elongation–Homo sapiens (human)” references the genericcompounds “C00638–Long-chain fatty acid” and “C02843–Long-chain acyl-CoA.” Such generic compounds do not represent
Frontiers in Molecular Biosciences | www.frontiersin.org 8 February 2016 | Volume 3 | Article 2
Merlet et al. Mapping Metabolite Libraries in Networks
FIGURE 10 | Sub-network visualization in MetExplore. Metabolites are represented by circles and reactions are represented by rectangles. Circles surrounded
with an orange box correspond to metabolites mapped based on the chemical library.
a unique metabolite but a subclass of metabolites and cannot be identified by their chemical formulas [respectivelyC3H5O2R and C23H38N7O17P3S(CH2)2n] include radicals (R)or undetermined indices. In that case the mapping is notpossible. However, genome scale network modeling communityis putting some efforts to improve these parts of the metabolism(Smallbone, 2013).
The application of the proposed protocol on a large range oforganisms requires, for most networks, the addition of InChIsto the metabolites in chemical databases. Although genome-scalenetworks increasingly contain this information, some effortsare still needed to systematically provide better identifiers formetabolites. For this solution to be widely implemented, themetabolic networks of network repositories need to be enrichedin terms of metabolite identifiers.
Mapping metabolomes on genome-scale networks canbe rendered more difficult by the compartmentalization ofmetabolites (when the modeled organism contains cellularcompartments). Given, that some metabolites will be presentmultiple times in a single network due to this phenomenonof compartmentalization, they will artificially increase themapping coverage. Bias can be reduced by creating anuncompartmentalized version for each network, but this requiresan unambiguous method to identify all instances of all
metabolites across compartments. At present, this represents aconsiderable challenge due to missing identifiers for some partsof the metabolism.
On the library side, analysts are increasingly keeping“unknown” metabolites with the idea of building a completedatabase for annotation when better identification algorithmsand standards become available. For these compounds, scientistscan only provide partial information (mono-isotopic or averagemass, chemical raw formula) but no structural identification(in consequence: no InChI). Consequently the coverage of thenetwork may increase as some unknowns become elucidated.
The results obtained when visually inspecting metabolitelibraries in the context of mapping networks highlights the factthat the network structure can be of interest for guiding futureannotation. This approach has already been proposed (Rogersand Girolami, 2005; Silva et al., 2014) and could be implementedin the pipeline.
This generic pipeline was applied to two chemical librariesfor illustration purposes. It could also scale up to repositoriesstoring metabolomics experimental datasets like MetaboLights(Haug et al., 2013).
The main remaining issue is that there is not for now astandardized way to identify metabolic networks. This issue canbe solved in two ways. One option would be to use predefined
Frontiers in Molecular Biosciences | www.frontiersin.org 9 February 2016 | Volume 3 | Article 2
Merlet et al. Mapping Metabolite Libraries in Networks
FIGURE 11 | Part of the sub-network presented in Figure 11. Rectangles
are reactions (dotted lines mean that reaction is reversible), circles are
metabolites. Metabolites surrounded by a red rectangle are the ones found in
the chemical library.
identifiers for each genome-scale model (like for BioModels). Thedrawback is that this requires all metabolic networks to be storedand described in a centralized database. A second option wouldbe, to devise a standardized method of creating a genome-scalemodel identifier in a similar manner as it has been achieved forcompounds with InChIs. Previous work has proposed the use ofauthors’ names and number of genes in the model (Thiele andPalsson, 2010). Unfortunately this initiative has not been widelyadopted, and should maybe be reactivated and enriched to takeinto account a larger range of information on the network.
Finally, providing flexible web services is in the scope ofcurrent efforts of the metabolomics community to create dataanalysis pipelines implemented in generic frameworks likeGalaxy. For instance, this approach will be integrated in theWorkflow4Metabolomics developed by MetaboHub (Giacomoniet al., 2014).
CONCLUSION
The proposed pipeline is a simplified way to map an entirechemical library on a large range of organism-specific metabolic
networks. In order to achieve this goal we tackled issues onprogrammatic interaction between two servers, improvement ofmetabolites annotation in metabolic networks and automaticloading of a mapping in the genome-scale network analysis toolMetExplore. It is important to notice that this mapping can alsobe performed on a single or a selection of organisms of interestand is not thus limited to large facilities.
This article describes an implementation of the SaaSconcept. One central point is to allow interoperability byusing standardized identifiers, communication protocols and byproviding a detailed description of the input and output of webservices. The important point is that SaaS is not restricted to asingle scenario and allows users to create their own way of usingthe data.
Interaction and data exchange processes contribute toconsolidate information by cross data enrichment. In fact, thelink between MetExplore and PeakForest/GP interaction allowsscientists to evaluate the relevance of the whole chemical libraryfor their organisms of interest. The link with a network analysistool such as MetExplore allows these libraries to be mined in thecontext of the metabolism. In particular, it can guide analystsin the choice of standards they will have to analyze and storein the database. We propose a scenario where the pipeline isapplied to the whole chemical library, but it can also be used atthe level of metabolites. For instance, in the next major releaseof PeakForest, metabolite cards will be enriched by displaying allmetabolic networks each metabolite belongs to via an on-the-flyrequest to MetExplore.
The approach proposed here is generic and could beimplemented in other network repositories than MetExploresuch as BIGG or BioModels, giving the opportunity tomap data on a larger range of metabolic networks. Namingconventions for genome-scale models will be the mainbottleneck for this purpose. Whilst we demonstrate the useof this protocol on two chemical libraries, our method isdesigned to be sufficiently generic so that it be implementedin other libraries (e.g., MassBank, Horai et al., 2010) andmetabolomics data repositories (e.g., MetaboLights, Hauget al., 2013). Use of standardized metabolite identifiersmakes it is possible to apply the proposed protocolto metabolite lists generated by various technologicalplatforms (LC-MS, GC-MS, or NMR), either alone or incombination.
Finally, since metabolic networks contain information ongenes and their products they can be used as an integratedplatform for Polyomics facilities by mapping both metabolitesand genomic (post-genomic) information on reactions.
AUTHOR CONTRIBUTIONS
All authors contributed to the article writing and were involvedin setting up the method. FJ initiated this project. BMdeveloped the web service on the network side. FG, NP,and YG developed the web services on the library sides. FVdeveloped the mapping in MetExplore and implemented thepathway enrichment (together with CF). NP, CF, and BMdeveloped the use of external resources to add InChIs to
Frontiers in Molecular Biosciences | www.frontiersin.org 10 February 2016 | Volume 3 | Article 2
Merlet et al. Mapping Metabolite Libraries in Networks
genome scale networks. MC and FJ developed the networkvisualization.
FUNDING
This work was supported by the FrenchMinistry of Research andNational Research Agency as part of the French MetaboHUB,the national metabolomics and fluxomics infrastructure (GrantANR-INBS-0010). YG was supported by the Wellcome Trust
grant 105614/Z/14/Z. This work was supported by PhenoMeNalproject, European Commission’s Horizon 2020 programme,grant agreement number 654241.
SUPPLEMENTARY MATERIAL
The Supplementary Material for this article can be foundonline at: http://journal.frontiersin.org/article/10.3389/fmolb.2016.00002
REFERENCES
Bernard, T., Bridge, A., Morgat, A., Moretti, S., Xenarios, I., and Pagni, M.
(2014). Reconciliation of metabolites and biochemical reactions for metabolic
networks. Brief. Bioinform. 15, 123–135. doi: 10.1093/bib/bbs058
Blaby-Haas, C. E., and de Crécy-Lagard, V. (2011). Mining high-throughput
experimental data to link gene and function. Trends Biotechnol. 29, 174–182.
doi: 10.1016/j.tibtech.2011.01.001
Chambers, J., Davies, M., Gaulton, A., Hersey, A., Velankar, S., Petryszak, R., et al.
(2013). UniChem: a unified chemical structure cross-referencing and identifier
tracking system. J. Cheminform. 5, 3. doi: 10.1186/1758-2946-5-3
Cottret, L., Wildridge, D., Vinson, F., Barrett, M. P., Charles, H., Sagot, M.-F.,
et al. (2010). MetExplore: a web server to link metabolomic experiments and
genome-scale metabolic networks. Nucleic Acids Res. 38, W132–W137. doi:
10.1093/nar/gkq312
Creek, D. J., Dunn, W. B., Fiehn, O., Griffin, J. L., Hall, R. D., Lei, Z., et al. (2014).
Metabolite identification: are you sure? And how do your peers gauge your
confidence?Metabolomics 10, 350–353. doi: 10.1007/s11306-014-0656-8
Dai, L., Gao, X., Guo, Y., Xiao, J., and Zhang, Z. (2012). Bioinformatics clouds
for big data manipulation. Biol. Direct 7, 43. discussion: 43. doi: 10.1186/1745-
6150-7-43
Devoid, S., Overbeek, R., DeJongh, M., Vonstein, V., Best, A. A., and Henry, C.
(2013). Automated genome annotation and metabolic model reconstruction in
the SEED and Model SEED. Methods Mol. Biol. 985, 17–45. doi: 10.1007/978-
1-62703-299-5_2
Fiehn, O., Kopka, J., Dörmann, P., Altmann, T., Trethewey, R. N., and Willmitzer,
L. (2000). Metabolite profiling for plant functional genomics. Nat. Biotechnol.
18, 1157–1161. doi: 10.1038/81137
Galgonek, J., and Vondrášek, J. (2014). On InChI and evaluating the quality of
cross-reference links. J. Cheminform. 6, 15. doi: 10.1186/1758-2946-6-15
Ganter, M., Bernard, T., Moretti, S., Stelling, J., and Pagni, M. (2013).
MetaNetX.org: a website and repository for accessing, analysing and
manipulating metabolic networks. Bioinformatics 29, 815–816. doi:
10.1093/bioinformatics/btt036
Giacomoni, F., Le Corguillé, G., Monsoor, M., Landi, M., Pericard, P.,
Pétéra, M., et al. (2014). Workflow4Metabolomics: a collaborative research
infrastructure for computational metabolomics. Bioinformatics. 31, 1493–1495.
doi: 10.1093/bioinformatics/btu813
Haraldsdóttir, H. S., Thiele, I., Fleming, R. M., Haraldsdottir, H. S., Thiele,
I., Fleming, R. M., et al. (2014). Comparative evaluation of open source
software for mapping between metabolite identifiers in metabolic network
reconstructions: application to Recon 2. J. Cheminform. 6:2. doi: 10.1186/1758-
2946-6-2
Hastings, J., de Matos, P., Dekker, A., Ennis, M., Harsha, B., Kale, N., et al.
(2013). The ChEBI reference database and ontology for biologically relevant
chemistry: enhancements for 2013. Nucleic Acids Res. 41, D456–D463. doi:
10.1093/nar/gks1146
Haug, K., Salek, R. M., Conesa, P., Hastings, J., de Matos, P., Rijnbeek, M.,
et al. (2013). MetaboLights–an open-access general-purpose repository for
metabolomics studies and associated meta-data. Nucleic Acids Res. 41, D781–
D786. doi: 10.1093/nar/gks1004
Heller, S., McNaught, A., Stein, S., Tchekhovskoi, D., and Pletnev, I. (2013). InChI -
the worldwide chemical structure identifier standard. J. Cheminform. 5:7. doi:
10.1186/1758-2946-5-7
Heller, S. R., and McNaught, A. D. (2006). The IUPAC International Chemical
Identifier, InChI. ACS Style Guid. 3, 101–102. doi: 10.1186/s13321-015-0068-4
Horai, H., Arita, M., Kanaya, S., Nihei, Y., Ikeda, T., Suwa, K., et al. (2010).
MassBank: a public repository for sharing mass spectral data for life sciences.
J. Mass Spectrom. 45, 703–714. doi: 10.1002/jms.1777
Hucka, M., Finney, A., Sauro, H. M., Bolouri, H., Doyle, J. C., Kitano, H.,
et al. (2003). The systems biology markup language (SBML): a medium for
representation and exchange of biochemical network models. Bioinformatics
19, 524–531. doi: 10.1093/bioinformatics/btg015
Kanehisa, M., Goto, S., Sato, Y., Kawashima, M., Furumichi, M., and Tanabe, M.
(2014). Data, information, knowledge and principle: back to metabolism in
KEGG. Nucleic Acids Res. 42, D199–D205. doi: 10.1093/nar/gkt1076
Karp, P. D., Latendresse, M., Paley, S. M., Krummenacker, M., Ong, Q. D.,
Billington, R., et al. (2015). Pathway Tools version 19.0 update: software
for pathway/genome informatics and systems biology. Brief. Bioinform. doi:
10.1093/bib/bbv079. [Epub ahead of print].
Kim, S., Thiessen, P. A., Bolton, E. E., Chen, J., Fu, G., Gindulyte, A., et al.
(2016). PubChem Substance and Compound databases. Nucleic Acids Res. 44,
D1202–D1213. doi: 10.1093/nar/gkv951
May, J. W., James, A. G., and Steinbeck, C. (2013). Metingear: a development
environment for annotating genome-scalemetabolicmodels. Bioinformatics 29,
2213–2215. doi: 10.1093/bioinformatics/btt342
Nicholson, J. K., Lindon, J. C., and Holmes, E. (1999). “Metabonomics”:
understanding the metabolic responses of living systems to pathophysiological
stimuli via multivariate statistical analysis of biological NMR spectroscopic
data. Xenobiotica 29, 1181–1189. doi: 10.1080/004982599238047
Pence, H. E., and Williams, A. (2010). ChemSpider: an online chemical
information resource. J. Chem. Educ. 87, 1123–1124. doi: 10.1021/ed1
00697w
Ramautar, R., Berger, R., van der Greef, J., and Hankemeier, T. (2013). Human
metabolomics: strategies to understand biology. Curr. Opin. Chem. Biol. 17,
841–846. doi: 10.1016/j.cbpa.2013.06.015
Redestig, H., Kusano, M., Fukushima, A., Matsuda, F., Saito, K., and Arita,
M. (2010). Consolidating metabolite identifiers to enable contextual and
multi-platform metabolomics data analysis. BMC Bioinformatics 11:214. doi:
10.1186/1471-2105-11-214
Rogers, S., and Girolami, M. (2005). A Bayesian regression approach to the
inference of regulatory networks from gene expression data. Bioinformatics 21,
3131–3137. doi: 10.1093/bioinformatics/bti487
Salek, R. M., Neumann, S., Schober, D., Hummel, J., Billiau, K., Kopka, J.,
et al. (2015). COordination of Standards in MetabOlomicS (COSMOS):
facilitating integrated metabolomics data access. Metabolomics 11, 1587–1597.
doi: 10.1007/s11306-015-0822-7
Schellenberger, J., Park, J. O., Conrad, T. M., and Palsson, B. Ø. (2010). BiGG:
a Biochemical Genetic and Genomic knowledgebase of large scale metabolic
reconstructions. BMC Bioinformatics 11:213. doi: 10.1186/1471-2105-11-213
Shameer, S., Logan-Klumpler, F. J., Vinson, F., Cottret, L., Merlet, B., Achcar,
F., et al. (2015). TrypanoCyc: a community-led biochemical pathways
database for Trypanosoma brucei. Nucleic Acids Res. 43, D637–D644. doi:
10.1093/nar/gku944
Silva, R. R., Jourdan, F., Salvanha, D. M., Letisse, F., Jamin, E. L., Guidetti-
Gonzalez, S., et al. (2014). ProbMetab: an R package for Bayesian probabilistic
annotation of LC-MS based metabolomics. Bioinformatics 30, 1336–1337. doi:
10.1093/bioinformatics/btu019
Frontiers in Molecular Biosciences | www.frontiersin.org 11 February 2016 | Volume 3 | Article 2

Merlet et al. Mapping Metabolite Libraries in Networks
Smallbone, K. (2013). Striking a Balance with Recon 2.1. Manchester.
arXiv:1311.5696v2.
Sumner, L. W., Amberg, A., Barrett, D., Beale, M. H., Beger, R., Daykin, C.
A., et al. (2007). Proposed minimum reporting standards for chemical
analysis Chemical Analysis Working Group (CAWG) Metabolomics
Standards Initiative (MSI).Metabolomics 3, 211–221. doi: 10.1007/s11306-007-
0082-2
Thiele, I., and Palsson, B. Ø. (2010). A protocol for generating a high-
quality genome-scale metabolic reconstruction. Nat. Protoc. 5, 93–121. doi:
10.1038/nprot.2009.203
Thiele, I., Swainston, N., Fleming, R. M. T., Hoppe, A., Sahoo, S., Aurich, M. K.,
et al. (2013). A community-driven global reconstruction of humanmetabolism.
Nat. Biotechnol. 31, 419–425. doi: 10.1038/nbt.2488
Wimalaratne, S. M., Grenon, P., Hermjakob, H., Le Novère, N., and Laibe, C.
(2014). BioModels linked dataset. BMC Syst. Biol. 8:91. doi: 10.1186/s12918-
014-0091-5
Wishart, D. S., Jewison, T., Guo, A. C., Wilson, M., Knox, C., Liu, Y., et al. (2013).
HMDB 3.0–The Human Metabolome Database in 2013. Nucleic Acids Res. 41,
D801–D807. doi: 10.1093/nar/gks1065
Wohlgemuth, G., Haldiya, P. K., Willighagen, E., Kind, T., and Fiehn, O.
(2010). The Chemical Translation Service–a web-based tool to improve
standardization of metabolomic reports. Bioinformatics 26, 2647–2648. doi:
10.1093/bioinformatics/btq476
Xia, J., and Wishart, D. S. (2010). MetPA: a web-based metabolomics tool
for pathway analysis and visualization. Bioinformatics 26, 2342–2344. doi:
10.1093/bioinformatics/btq418
Conflict of Interest Statement: The authors declare that the research was
conducted in the absence of any commercial or financial relationships that could
be construed as a potential conflict of interest.
Copyright © 2016 Merlet, Paulhe, Vinson, Frainay, Chazalviel, Poupin, Gloaguen,
Giacomoni and Jourdan. This is an open-access article distributed under the terms
of the Creative Commons Attribution License (CC BY). The use, distribution or
reproduction in other forums is permitted, provided the original author(s) or licensor
are credited and that the original publication in this journal is cited, in accordance
with accepted academic practice. No use, distribution or reproduction is permitted
which does not comply with these terms.
Frontiers in Molecular Biosciences | www.frontiersin.org 12 February 2016 | Volume 3 | Article 2


![[Bernhard Ø. Palsson] Systems Biology Simulation](https://static.fdocuments.us/doc/165x107/577c7ebf1a28abe054a24a97/bernhard-o-palsson-systems-biology-simulation.jpg)