A Clustering-Classification Two-Phase Model on Service ... · scientist Kano proposed Kano model to...
8
Abstract—Service modulation is often implemented to provide customized and standardized service in service industries. And Kano model can help to classify customer requirements in response to rapidly-changing and differential requirements. However, the subjectivity and ambiguity of Kano model may affect the accuracy of the results. By taking account of the customer satisfaction in this paper, a two-phase method based on fuzzy Kano model for partitioning service module is presented. Firstly, an entropy weight method is introduced into the fuzzy Kano model to determine the importance of service requirements. Then fuzzy clustering is utilized to cluster modules based on correlation analysis results of service process. Secondly, an edge transformation model is introduced into Kano model to transfer the fuzzy indifference requirements. Thus a nonlinear programming method considering service time constraints and satisfaction is utilized to reclassify the service modules. A “clustering-classify” two-phase service partition model, in turn, is presented. A typical example such as online shopping logistics service is analyzed to verify the presented method. The results show this method a good validity and feasibility. Index Terms—Service module, Fuzzy kano model, Fuzzy clustering, Nonlinear programming I. INTRODUCTION ITH the continuous development of the service economy, providing customers with satisfied, personalized and standardized service has become the key to enhance customer’s experience and enterprise competitiveness. Customer requirement is not only the driving force of service, but also the goal of service. However, the instability of the market and the uncertainty of customer requirement pose a great challenge to the control of the service, which is particularly evident in the online shopping Manuscript received June 02, 2017; revised September 30, 2017. This work was supported in part by National Key Technology Research and Development Program of the Ministry of Science and Technology of China (2015BAH46F01), Chongqing Science and Technology Plan Projects Application Development Planning Major Project (cstc2015yykfC60002), Chongqing key industrial generic key technological innovation projects (cstc2015zdcy-ztzx60009). Fundamental Research Funds for the Central Universities(2016CDJXZ). Lu Li, Yun Lin, Xu Wang, Tian Guo, Jie Zhang, Hua Lin are with the College of Mechanical Engineering, Chongqing University, Chongqing 400030,P.R.China.(phone:+86-15683695380;email:[email protected]; [email protected];[email protected];[email protected];zhang_ [email protected]; [email protected]). Fuqian Nan is with the Chongqing Sokon New Energy Vehicle Design Institute Co., Ltd. phone:+86-18580389656;email: [email protected]. logistics services. China's online shopping logistics business volume reached 31.28 billion in 2016, an increase of 45.7% than last year, and the business income were 397.44 billion yuan, but the number of complaints were as high as 263,000. With the development of the online shopping scale, customer requirement for logistics services continue to upgrade which shows the features of high quality, high frequency, decentralized and multiple categories. Traditional service model was difficult to meet the large-scale, diversified needs. Service modularity makes it possible to break down the service into standard sub-processes and customization sub-processes, and to place the standard sub-processes before the customization sub-processes to achieve maximum flexibility [1]. Mak produced multiple families of products to meet different needs of customers [2]. In the same way, service modularity can achieve the diversity choices and break the traditional organizational boundaries. And it also can improve the organization's agility and flexibility by scheduling, assembling and controlling modular [3]. In conclusion service modularity is an effective way to realize standardization and personalization of service. Sundbo [4] firstly proposed the concept of service modularity: Divide service into different standard service modules in the process of service design, and provide a variety of service products for the customer through the module selection. The representative research of service module are as follows: Teng [5], Xiao [6] and Ge [7] proposed a modular design method based on Fuzzy Clustering. Seung [8] came up with a service process model based on a sequence using a graph model and object-oriented concepts. Song [9] proposed a modularization approach based on modified service blueprint and fuzzy graph to realize the modularization of product-extension service. Xiong [10] established a service modular approach by coupling matrix. Liu [11] decomposed the product into a number of structural and functional independent service units from the perspective of customer demand and differences of category. Amaya [12] proposed life-cycle model comparing the environmental consequences of different PSS design alternatives. Geum [13] proposed a solid framework for service modularization, by employing and modifying the House of Quality (HoQ) structure in Quality Function Deployment (QFD). In addition, this concept was used in variety fields such as supply chain and library service [14]. The heterogeneity of customer requirements should be taken into account in the design of service modularity to maximize customer satisfaction. Japanese management A Clustering-Classification Two-Phase Model on Service Module Partition Oriented to Customer Satisfaction Lu Li, Yun Lin, Xu Wang, Tian Guo, Jie Zhang, Hua Lin, Fuqian Nan W Engineering Letters, 26:1, EL_26_1_09 (Advance online publication: 10 February 2018) ______________________________________________________________________________________
Transcript of A Clustering-Classification Two-Phase Model on Service ... · scientist Kano proposed Kano model to...

Abstract—Service modulation is often implemented to
provide customized and standardized service in service
industries. And Kano model can help to classify customer
requirements in response to rapidly-changing and differential
requirements. However, the subjectivity and ambiguity of Kano
model may affect the accuracy of the results. By taking account
of the customer satisfaction in this paper, a two-phase method
based on fuzzy Kano model for partitioning service module is
presented. Firstly, an entropy weight method is introduced into
the fuzzy Kano model to determine the importance of service
requirements. Then fuzzy clustering is utilized to cluster
modules based on correlation analysis results of service process.
Secondly, an edge transformation model is introduced into Kano
model to transfer the fuzzy indifference requirements. Thus a
nonlinear programming method considering service time
constraints and satisfaction is utilized to reclassify the service
modules. A “clustering-classify” two-phase service partition
model, in turn, is presented. A typical example such as online
shopping logistics service is analyzed to verify the presented
method. The results show this method a good validity and
feasibility.
Index Terms—Service module, Fuzzy kano model, Fuzzy
clustering, Nonlinear programming
I. INTRODUCTION
ITH the continuous development of the service
economy, providing customers with satisfied,
personalized and standardized service has become the key to
enhance customer’s experience and enterprise
competitiveness. Customer requirement is not only the
driving force of service, but also the goal of service. However,
the instability of the market and the uncertainty of customer
requirement pose a great challenge to the control of the
service, which is particularly evident in the online shopping
Manuscript received June 02, 2017; revised September 30, 2017. This
work was supported in part by National Key Technology Research and
Development Program of the Ministry of Science and Technology of China
(2015BAH46F01), Chongqing Science and Technology Plan Projects
Application Development Planning Major Project (cstc2015yykfC60002),
Chongqing key industrial generic key technological innovation projects
(cstc2015zdcy-ztzx60009). Fundamental Research Funds for the Central
Universities(2016CDJXZ).
Lu Li, Yun Lin, Xu Wang, Tian Guo, Jie Zhang, Hua Lin are with the
College of Mechanical Engineering, Chongqing University, Chongqing
400030,P.R.China.(phone:+86-15683695380;email:[email protected];
[email protected];[email protected];[email protected];zhang_
[email protected]; [email protected]). Fuqian Nan is with the
Chongqing Sokon New Energy Vehicle Design Institute Co., Ltd.
phone:+86-18580389656;email: [email protected].
logistics services. China's online shopping logistics business
volume reached 31.28 billion in 2016, an increase of 45.7%
than last year, and the business income were 397.44 billion
yuan, but the number of complaints were as high as 263,000.
With the development of the online shopping scale, customer
requirement for logistics services continue to upgrade which
shows the features of high quality, high frequency,
decentralized and multiple categories. Traditional service
model was difficult to meet the large-scale, diversified needs.
Service modularity makes it possible to break down the
service into standard sub-processes and customization
sub-processes, and to place the standard sub-processes before
the customization sub-processes to achieve maximum
flexibility [1]. Mak produced multiple families of products to
meet different needs of customers [2]. In the same way,
service modularity can achieve the diversity choices and
break the traditional organizational boundaries. And it also
can improve the organization's agility and flexibility by
scheduling, assembling and controlling modular [3]. In
conclusion service modularity is an effective way to realize
standardization and personalization of service.
Sundbo [4] firstly proposed the concept of service
modularity: Divide service into different standard service
modules in the process of service design, and provide a
variety of service products for the customer through the
module selection. The representative research of service
module are as follows: Teng [5], Xiao [6] and Ge [7]
proposed a modular design method based on Fuzzy Clustering.
Seung [8] came up with a service process model based on a
sequence using a graph model and object-oriented concepts.
Song [9] proposed a modularization approach based on
modified service blueprint and fuzzy graph to realize the
modularization of product-extension service. Xiong [10]
established a service modular approach by coupling matrix.
Liu [11] decomposed the product into a number of structural
and functional independent service units from the perspective
of customer demand and differences of category. Amaya [12]
proposed life-cycle model comparing the environmental
consequences of different PSS design alternatives. Geum [13]
proposed a solid framework for service modularization, by
employing and modifying the House of Quality (HoQ)
structure in Quality Function Deployment (QFD). In addition,
this concept was used in variety fields such as supply chain
and library service [14].
The heterogeneity of customer requirements should be
taken into account in the design of service modularity to
maximize customer satisfaction. Japanese management
A Clustering-Classification Two-Phase Model
on Service Module Partition Oriented to
Customer Satisfaction
Lu Li, Yun Lin, Xu Wang, Tian Guo, Jie Zhang, Hua Lin, Fuqian Nan
W
Engineering Letters, 26:1, EL_26_1_09
(Advance online publication: 10 February 2018)
______________________________________________________________________________________

scientist Kano proposed Kano model to elaborate the
relationship between customer needs and satisfaction. Most of
the studies combination with various methods: Geng [15],
Yuan [16] combined Kano with QFD to translate customer
requirements into functional attributes of service modules.
Chen [17] and Çıkış [18] respectively combined the Kano
model with TRIZ and IPA to get the importance of product
attributes. Rahmana [19] and Basfirinci [20] used integration
of SERVQUAL and KANO Models respectively to help
training provider to evaluate trainee satisfaction and
examined the service quality attributes of airlines with regard
to their effect on customer satisfaction. Wang [21] proposed a
hybrid framework that combines fuzzy analytical hierarchy
process, fuzzy Kano model with zero-one integer
programming to incorporate customer preferences. Some
researchers tried to improve Kano model. Chen [22]
considered the non-linear relationships in the Kano model.
Chen [23] proposed a Kano-CKM model to provide an
innovative product development. Lee [24], Meng [25] came
up with the fuzzy Kano model based on the uncertainty and
fuzziness of customer’s perception. Yang [26] proposed a
Kano model to reclassify the classification results of Kano
model which is based on the degree of importance and
customer satisfaction. Zhou and Lee [27] proposed a
Lagrangian relaxation-based method to minimize greenhouse
gas emissions for green logistics. Recently Das et al. [28]
presented a logistics model considering rough interval where
they discussed about the complete and rather satisfactory
solutions.
Many scholars have made the qualitative research on
service modularity, only little work have been done on
quantitative research. The fuzzy clustering method and the
structural matrix method were used but few researches take
customer requirements into account in quantitative studies.
And the granularity of the service module is too large to adapt
to the dynamic and personalized customer requirements. In
terms of improving Kano model, scholars rarely eliminate the
subjectivity and ambiguity of the model at the same time.
Accordingly, this paper presents a quantitative method of
partitioning service modules to meet customer personalized
requirements. This method aims at partitioning
small-granularity service module to overcome the subjectivity
and ambiguity of Kano model. Additionally, this paper
introduces an online shopping logistics service case, which
demonstrates the application of the presented method.
Furthermore, this research could serve as a useful guideline to
provide personalized services considering the customer
requirements.
II. CUSTOMER REQUIREMENTS ANALYSIS BASED ON FUZZY
KANO MODEL
The module partition model is constructed to realize the
modularization of service and to meet customer personalized
requirements. The customer requirement is considered as the
starting point. And the “clustering-classification” process is
conducted on the basis of service requirement importance
calculation. At the same time, this paper puts forward the edge
transformation model (ET-M) to classify the service
requirement to realize the quantitative calculation of customer
satisfaction and the classification of module.
A. Classification of service requirements based on edge
transformation model
In traditional classification table, there are five kinds of
requirements: attractive requirement, one-dimensional
requirement, must-be requirement, indifference requirement
and reverse requirement. For the reason that customers will
tend to choose indifference requirement, we defined the
marginal requirement as fuzzy indifference requirement based
on the Kano requirements classification table. the service
requirements based on the fuzzy Kano questionnaire are
classified which is show in TABLE I and classification matrix
which is shown in Fig. 1.
The meaning of the letters in Fig. 1 are as follows:
A–attractive requirement; O–one-dimensional requirement;
M–must-be requirement; I1–fuzzy indifference requirement;
I2– indifference requirement; R–reverse requirement;
Q–problem answer.
The fuzzy indifference requirements are transformed into
the corresponding service requirement type to avoid the
subjective classification. The transform depends on the
average coordinate value distance to A, O and M areas.
( , )s s
i i iG x y represents the evaluation of service requirement
iF from customer ( 1,2,..., )iG i Q . s
ix 、 s
iy represents the
coordinate value of customer evaluation to s , s means A
、O、M、I1. AG 、 OG 、 MG 、 1IG represent the average
coordinate of each requirement as shown in TABLE Ⅱ.
TABLE I
FUZZY KANO QUESTIONNAIRE
requirement Satisfied Must be neutral Bearable dissatisfied
achieved (0.8,1] (0.6,0.8] (0.4,0.6] (0.2,0.4] [0,0.2]
not achieved [0,0.2] (0.2,0.4] (0.4,0.6] (0.6,0.8] (0.8,1]
Fig. 1. Classification matrix based on fuzzy Kano.
TABLE Ⅱ
THE AVERAGE COORDINATE CALCULATION TABLE
Requirement Quantity Average coordinate value
A AQ 1 1
( / , / )A AQ Q
A A A
i A i A
i i
G x Q y Q
O OQ 1 1
( / , / )O OQ Q
O O O
i O i O
i i
G x Q y Q
M MQ 1 1
( / , / )M MQ Q
M M M
i M i M
i i
G x Q y Q
I1 1IQ
1 1
1 1 1
1 1
1 1
( / , / )I IQ Q
I I I
i I i I
i i
G x Q y Q
Engineering Letters, 26:1, EL_26_1_09
(Advance online publication: 10 February 2018)
______________________________________________________________________________________
1
11 1 1
1
11 1 1
1
11 1 1
2
1
2 2 2
2
1
2 2 2
2
1
2 2 2
1 ( ) *=
1 ( ) 1 ( ) 1 ( )
1 ( ) *=
1 ( ) 1 ( ) 1 ( )
1 ( ) *=
1 ( ) 1 ( ) 1 ( )
I A
II I IA O M
I O
II I IA O M
I M
II I IA O M
G G IA
G G G G G G
G G IO
G G G G G G
G G IM
G G G G G G
(1)
1IA 、
1OI
、1
M IRespectively represent the quantity of
A、O、M which are transformed by 1I .
B. Determination of service requirement importance
Delphi method and entropy weight method (EW) are
introduced to derive the important weights ik of service
requirementiF . M experts are invited in the field to evaluate
the importance of indicators, ijw represents the importance of
iF evaluation by expert j .
1
/ , 1,2,3 ,m
ij ij ij
j
b w w i n
(2)
11 12 1
21 22 2
1 2
n
n
m m mn
b b b
b b bB
b b b
For service requirementiF , the entropy is defined as
iH , k
represents Boltzmann constant
1
ln , 1,2,3 ,m
i ij ij
t
H k f f i n
(3)
1
/ , =1/ lnm
ij ij ij
j
f b b k m
(4)
The entropy weight of iF can be defined as:
1
1 ,(0 1)n
i i i i
i
k H H k
( )/ (5)
Taking ik as the initial weight of service
requirementiF , the Kano model is used to modify the
importance of service requirements.
1
/n
i ij
j
Y d n
(7)
1
1 0/i i iIR Y Y
(8)
1
n
i i i i i
i
p k IR k IR
(9)
Where ijm represents the evaluation of service
requirement iF by customer j (
ijm =1,2,3,4,5); 1iY ,
0iY
represent satisfaction degree of service requirement iF for a
benchmarking enterprise and research enterprise. iIR is
modified rate, is Kano factor. The Kano factor value of
attractive requirement, one-dimensional requirement,
must-be requirement are respectively 2,1,0.5. ip is the
ultimate importance degree of service requirement iF .
III. CUSTOMER SATISFACTION-ORIENTED TWO PHASE
MODULE PARTITION MODEL
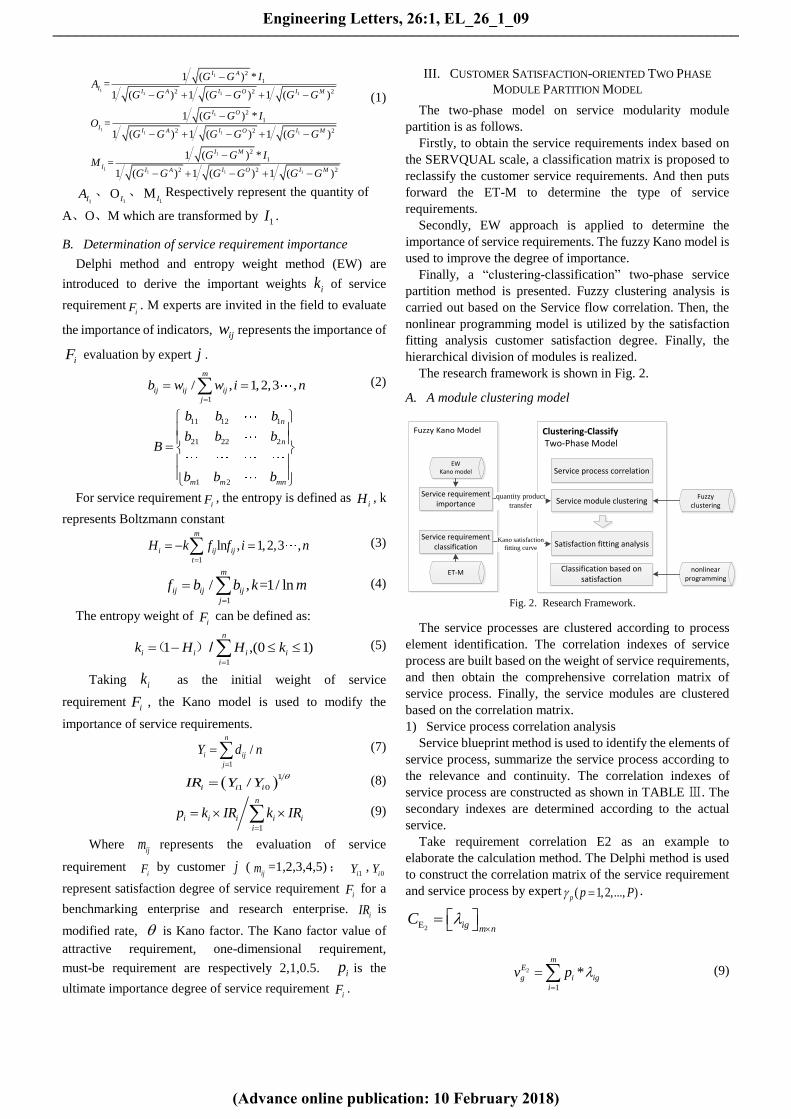
The two-phase model on service modularity module
partition is as follows.
Firstly, to obtain the service requirements index based on
the SERVQUAL scale, a classification matrix is proposed to
reclassify the customer service requirements. And then puts
forward the ET-M to determine the type of service
requirements.
Secondly, EW approach is applied to determine the
importance of service requirements. The fuzzy Kano model is
used to improve the degree of importance.
Finally, a “clustering-classification” two-phase service
partition method is presented. Fuzzy clustering analysis is
carried out based on the Service flow correlation. Then, the
nonlinear programming model is utilized by the satisfaction
fitting analysis customer satisfaction degree. Finally, the
hierarchical division of modules is realized.
The research framework is shown in Fig. 2.
A. A module clustering model
The service processes are clustered according to process
element identification. The correlation indexes of service
process are built based on the weight of service requirements,
and then obtain the comprehensive correlation matrix of
service process. Finally, the service modules are clustered
based on the correlation matrix.
1) Service process correlation analysis
Service blueprint method is used to identify the elements of
service process, summarize the service process according to
the relevance and continuity. The correlation indexes of
service process are constructed as shown in TABLE Ⅲ. The
secondary indexes are determined according to the actual
service.
Take requirement correlation E2 as an example to
elaborate the calculation method. The Delphi method is used
to construct the correlation matrix of the service requirement
and service process by expert ( 1,2,..., )p p P .
2E ig m nC
2
1
*m
E
g i ig
i
v p
(9)
Clustering-Classify Two-Phase Model
Fuzzy Kano Model
quantity product
transfer
Kano satisfaction
fitting curve
Service process correlation
Service module clustering
Satisfaction fitting analysis
Classification based on satisfaction
Fuzzy clustering
nonlinear programming
Service requirement importance
Service requirement classification
EWKano model
ET-M
Fig. 2. Research Framework.
Engineering Letters, 26:1, EL_26_1_09
(Advance online publication: 10 February 2018)
______________________________________________________________________________________

Where ig is the strength of correlation between service
requirement ( 1,2,..., )iF i m and service process
( 1,2,..., )gO j n . 0,1,3,6,9ig (1 indicates weak correlation,
3 is general correlation, 6 is strong correlation, 9 is
inseparable, 0 is irrelevant). 2E
gv is the weight of service
process gO under the influence of service requirement.
The correlation matrix of service process is influenced by
the service requirement. The matrix is calculated by
employing quantity product formula.
2 ( , )E g l n nD
( , )
1 1
1,
1, max
m mg l
i ig il i ig ilg l
i i
g l
p g l p
(10)
( , )g l represents the degree of association between service
processes which numbered (1 ,1 )g l g n l n 、 .
The correlation matrix 2EY 、
3EY and4EY are calculated under
the influence of functional factors, physical factors and
management factors. And then the weighted correlation
matrixEY is calculated:
1 1 2 2 3 3 4 4E E E E E E E E EY Y Y Y Y (11)
31 2 4
1 2 3 4
EE E E
g E g E g E g E gv v v v v (12)
glr is the comprehensive degree of service process
(1 ,1 )g lO O g n l n 、 . gv is the comprehensive weight
of service process.1 2 3 4
( , , , )E E E E E is the weight
matrix of the influence index which is scored by Delphi
approach , and 1 2 3 4
1E E E E .
2) Fuzzy clustering of service process
Fuzzy clustering approach clusters the service processes
into service module according to the principle of strong
coupling and weak coupling principles.
Suppose that there are n service processes in the set:
1 2, ,..., nsp sp sp sp
The service processes are affected by service requirement,
function, physics, and management factors. So, based on the
above analysis, the comprehensive correlation matrix of any
two service processes is shown as follows:
11 12 1
21 22 2
1 2
n
n
E gl n n
n n nn
r r r
r r rY r
r r r
Where 0 1( , 1,2,..., )glr g l n .
The minimum fuzzy equivalent matrix is constructed from
the fuzzy similarity matrix by the transitive closure method
which can be explained by: * 2
2,where log ( 1)R R R R R n
(13)
where *R is minimum fuzzy equivalent matrix ; R is
transitive closure “。”is Zadeh operator ∧∨,if 12 2R R
,
then * 2R R
*R is solved according to the comprehensive correlation
matrix YE. The appropriate threshold λ is selected according
to the granularity of the service module to get the service
process clustering.
B. A module classification model
The modules are classified after clustering the service
processes considering the impact of customer satisfaction.
Take the service time as constraint and find a service process
classification scheme to maximize customer satisfaction
based on the satisfaction fitting analysis.
1) Quantitative customer satisfaction analysis
A quantitative Kano model is used to analyze customer
satisfaction [29]. Fit the customer satisfaction fitting curve
(S-F curve) to obtain the formula of service requirement
realization and customer satisfaction: ( )i is af x b . The
curve is shown in Fig. 3.
Calculate the coordinate values of two points
(1, )iCS , (0, )iNS in the curve . Where iCS and
iNS are the
satisfaction and dissatisfaction with iF from Kano model.
is is the ordinate of customer satisfaction with iF , ix is the
realization degree of iF ; a and b represent the parameters
of the curve.
A Oi
A O M I
f fCS
f f f f
(14)
M Oi
A O M I
f fNS
f f f f
(15)
The expression of attractive, one-dimensional and must-be
S-F curves are1 1
ix
is a e b ,2 2i is a x b ,
3 3( )ix
is a e b
. The parameter values are as follows:
TABLE Ⅲ
CORRELATION INDEX OF SERVICE PROCESS
Correlation index Relationship description
Functional
correlation (E1) Whether to participate in the same function
Requirement
correlation (E2) Whether to participate in the same requirement
Physical
correlation (E3)
Whether the occurrence time is related
Whether in the same or similar place
Is there a public resource
Whether there is a common service personnel
Management
correlation (E4)
Whether the relevant personnel configuration
Complexity of management
Fig. 3. Customer satisfaction fitting curve.
Engineering Letters, 26:1, EL_26_1_09
(Advance online publication: 10 February 2018)
______________________________________________________________________________________

1 1,1 1
i i i iCS NS CS eNSa b
e e
(16)
2 2,i i ia CS NS b NS (17)
3 3
( ),
1 1
i i i ie CS NS eCS NSa b
e e
(18)
S-F curve fitting function are expressed as:
( )1 1
( ) ( )
( )( )
1 1
i
i
xi i i i
i i i i i
xi i i i
CS NS CS eNSe A
e e
s CS NS x NS O
e CS NS eCS NSe M
e e
(19)
2) Classification model of service process
The service time is treated as constrain and customer
satisfaction is treated as the goal to select the basic process.
And then the One-dimensional processes are selected in the
remaining processes. Finally, the charm processes remain.
Must-be process classify model:
1
1 1
/
1
( )max
1 1
n n
g g ig g ig
g g
m T v v
i i i ii
i
e CS NS eCS NSp e
e e
(20)
. .s t
1
0n
g
g
T
1
48 60n
g g
g
D T
1,service process is chosen
0 else
g
g
OT
,
One-dimensional process classify model: 2
1 1 1
max ( ) /m n n
i i i g g ig g ig i
i g g
p CS NS T v v NS
(21)
. .s t
1
0n
g
g
T
1
48n
g g
g
D T
1,service process is chosen
0 else
g
g
OT
,
Where m1 is the quantity of basic service requirement,
1(1,2,..., )i m ; m2 is the quantity of expected service
requirement, 2(1,2,..., )i m ;
gD is the time of gO ;
gT is 0-1
variable that indicates whether the service process is selected .
IV. CASE ANALYSIS
Y company is a famous logistics enterprise which mainly
provides online shopping logistics services. The dynamic and
uncertainty of online shopping, the rapid expansion of the
market scale, posed a great challenge to the logistics services.
To meet the individual needs of customers, take Y company
as an example, to study the modularization of online shopping
logistics service.
Based on the SEVERQUAL scale, related literature and the
characteristics of online shopping logistics, 27 customer
service requirements are constructed, as shown in TABLE Ⅳ.
A total of 200 Kano questionnaires were issued in which
168 were valid. The service requirements are classified based
on ET-M, and the type of service requirements are translated
by using equation (1). The final distribution is shown in
TABLE Ⅴ. Taking six service requirements as an example,
the contrast between classification of Kano model and the
classification after the edge transformation is shown in Fig. 4.
Finally, there were eight service requirements transferred into
other type of requirements, providing more data for
subsequent analysis. For example, F2、F15、F20 are transferred
into M which means they are must-be requirements. The lack
of these services will greatly affect customer satisfaction
The online shopping logistics service processes are
deconstructed by service blueprint. The process of receiving,
TABLE Ⅳ
CUSTOMER REQUIREMENT INDEX
Requirement
attribute No. Customer service requirement
Service product
requirement
F1 Accurate and timely delivery
F2 Complete and clear documents
F3 Cargo safety
F4 Safety packaging
F5 Quick response
F6 Fast response to claims
F7 Fast response to complaints
Information
requirement
F8 Order monitoring
F9 Information availability
F10 Information accuracy
Cost requirement F11 Reasonable freight
F12 Multiple payment methods
Convenience
requirement
F13 Pickup convenient
F14 Convenient equipment operation
F15 Simple procedure of Pickup
F16 Smooth communication channels
Individual
requirement
F17 Flexible dispatching location
F18 Time flexibility
F19 Booking pickup
F20 Insured transportation
F21 Key customer visits
F22 Installation service
Empathic
requirement
F23 friendly attitude
F24 Professional staff
F25 Logistics personnel neat
F26 Good reputation
F27 High level of enterprise management
F1 A-F1 F2 A-F2 F3 A-F3 F4 A-F4 F5 A-F5 F6 A-F6
168 168 168 168 168 168 168168 168 168 168168
34
26
1 8
102
32
25
76
36
4
70
39
55
411
66
37
50
8510
93
34
26
5
73
48
42
5
54
50
6
43
81
38
610
4051
34
25
814
47
76
23
84
98
37
2825
1
107
5
I2
I1
M
O
A
Fig. 4. Comparison of results before and after transformation.
Engineering Letters, 26:1, EL_26_1_09
(Advance online publication: 10 February 2018)
______________________________________________________________________________________

processing, transportation and delivery are identified then the
delivery process is taken as an example as shown in Fig.5.
The importance of service requirements is determined by
using equations (2) -(8) :
0.053,0.036,0.051,0.034,0.045,0.040,0.044,0.036,0.041,
0.043,0.037,0.032,0.048,0.037,0.034,0.036,0.044,0.041,
0.036,0.036,0.020,0.034,0.034,0.033,0.019,0.030,0. 6
(
)02
ik
0.063 0.026 0.042 0.028 0.055 0.040 0.065 0.029
0.061 0.064 0.033 0.020 0.043 0.023 0.041 0.067 0.032
0.034 0.026 0.028,0.024,0.051 0
( , , , , , , , ,
, ,
.049 0.012
, , , , , , ,
, 0.027, , , , ,0. 19)0
ip
The elements of four service processes are broken down
and then summarized to obtain 44 online shopping logistics
service processes which are shown in TABLE Ⅵ.
The secondary indexes of online shopping logistics
services are built based on literature search and research to
analyze the correlation of online shopping logistics service
process. Indexes are shown in TABLE Ⅶ.
The correlation degree of service process is solved under
the influence of service requirement by using equations (10) -
(11). And then find out the correlation degree of service
process under the influence of other first grade indexes.
Finally, the comprehensive correlation matrix is obtained
(Intercept some of the results).
TABLE Ⅴ
EVALUATION RESULTS OF SERVICE PROCESS
Requir
ement A O M I Q R type CS DS
F1 26 34 107 1 0 0 M 0.36 -0.84
F2 42 48 73 5 0 0 M 0.53 -0.72
F3 22 43 98 5 0 0 M 0.39 -0.84
F4 25 84 51 7 1 0 O 0.65 -0.80
F5 55 39 70 4 0 0 M 0.56 -0.65
F6 38 81 43 6 0 0 O 0.71 -0.74
F7 35 51 72 10 0 0 M 0.51 -0.73
F8 48 70 45 5 0 0 O 0.70 -0.68
F9 54 39 57 26 0 0 M 0.55 -0.62
F10 62 29 66 11 0 0 M 0.54 -0.57
F11 37 80 51 0 0 0 O 0.70 -0.78
F12 91 28 39 10 0 0 A 0.71 -0.40
F13 35 79 51 3 0 0 O 0.68 -0.77
F14 63 35 60 9 1 0 A 0.58 -0.57
F15 48 40 68 12 0 0 M 0.52 -0.64
F16 39 38 87 4 0 0 M 0.46 -0.74
F17 75 63 25 5 0 0 A 0.82 -0.52
F18 76 54 35 3 0 0 A 0.77 -0.53
F19 74 48 39 7 0 0 A 0.73 -0.52
F20 46 41 67 13 0 0 M 0.52 -0.65
F21 40 27 24 71 1 5 I 0.40 -0.30
F22 63 40 44 21 0 0 A 0.61 -0.50
F23 39 46 78 5 0 0 M 0.51 -0.74
F24 40 30 86 12 0 0 M 0.42 -0.69
F25 52 55 47 15 0 0 O 0.63 -0.60
F26 45 75 30 18 0 0 O 0.71 -0.63
F27 74 35 38 19 0 2 A 0.65 -0.43
Confirm the delivery mode
②Telephone ①SMS
①home delivery
Express transfer
Check
Unpacking and entering
Sorting section
Entrucking
②change delivery time and place
Verify identityproof of
identification
Check Express
customer inspection
Payment method
Confirm payment method
Payment Charge
SignGuide customer
signature
need installation
Provide installation service
express information
Request to return the document
Document transfer
Recheck
Information input
Upload information
Return document
financial management
information management
information management
information management
Customer behavior
Inte
ractiv
e
bo
un
dary
Front desk staff
Visu
al
bo
un
dary
Backstage staff
Support process
Fig.5. Delivery process service blueprint.
TABLE Ⅵ
LOGISTICS SERVICE FLOW CHART
No. Service process No. Service process
1 Receiving preparation 23 Automatic sorting
2 Receive and check
information
24 Manual sorting
3 Scheduling logistics
personnel
25 Make transportation plan
4 Packet service 26 Vehicle scheduling
5 Inspection Express 27 Route optimization
6 Provide safe packaging 28 Air transportation
7 Weighing charge 29 Train transportation
8 Labeling and marking 30 Vehicle transportation
9 Provide operational
guidance
31 Order monitoring
10 Insured transportation 32 Pre preparation
11 Marketing activities 33 Express receipt
12 Shift handover 34 Sorting section treatment
13 Information input 35 Receiving SMS
14 Upload information 36 Receiving method
coordination
15 Automatic address
matching
37 Provide home delivery
service
16 Goods classification 38 Change of time and place
17 Sealed delivery 39 Verify recipient
18 Loading shipment 40 Recipient payment
19 Pick up stand-by 41 collection on delivery
20 Unloading 42 installation service
21 Acceptance signature 43 Return document
22 Routing list 44 Service quality improvement
Engineering Letters, 26:1, EL_26_1_09
(Advance online publication: 10 February 2018)
______________________________________________________________________________________
The fuzzy clustering analysis is carried out by using the
comprehensive correlation matrix. Then, the service modules
are clustered by using MATLAB software to solve the model.
The value of threshold is 0.65.The results are shown in
TABLE Ⅷ. TABLE Ⅷ
CLUSTERING RESULTS OF SERVICE PROCESS
Modular Service process
Information module 2、11、13、14、25
Data analysis module 3、15、22、26、27、31
Client module 4、6、7、8、21、35、36、37、39、40
Transceiver module 1、12、16、17、18、32、33、34
Transport module 28、29、30
Sorting module 19、20、21、23、24
Personality module 9、10、11、41、42、43、44
The service process time Dg is obtained by investigating,
and the weight of service process is calculated by using
equations (9) and (12). The results are as follows:
(0.5,0.17,0.25,2.5,1,0.5,0.17,0.17,0.25,0.17,0.33,4.5,4,2,
0.17,1.5,2,1,0.5,1,1.5,0.33,0.75,3.5,1.5,0.25,0.25,10,17,28,0.25,
0.5,1.5,0.67,1,0.17,2.5,0.33,0.17,0.25,0.25,0.33,0.25,0.17)
gD
0.035 0.052 0.068 0.058 0.015 0.02 0.019 0.014 0.02
0.01 0.008 0.013 0.038 0.014,0.025 0.021 0.011 0.011 0.004
0.008 0.009 0.015 0.019 0.013 0.019 0.012 0.014 0.0
( , , , , , , , , ,
, , , , , , , , ,
, , , , , , , , ,12
0.008 0.007 0.0310.048 0.033 0, , ,
gv
, , .015,0.026 0.038 0.059 0.058
0.012 0.012 0.009 0.025 0.012
,
0.032)
,
, , , , ,
, ,
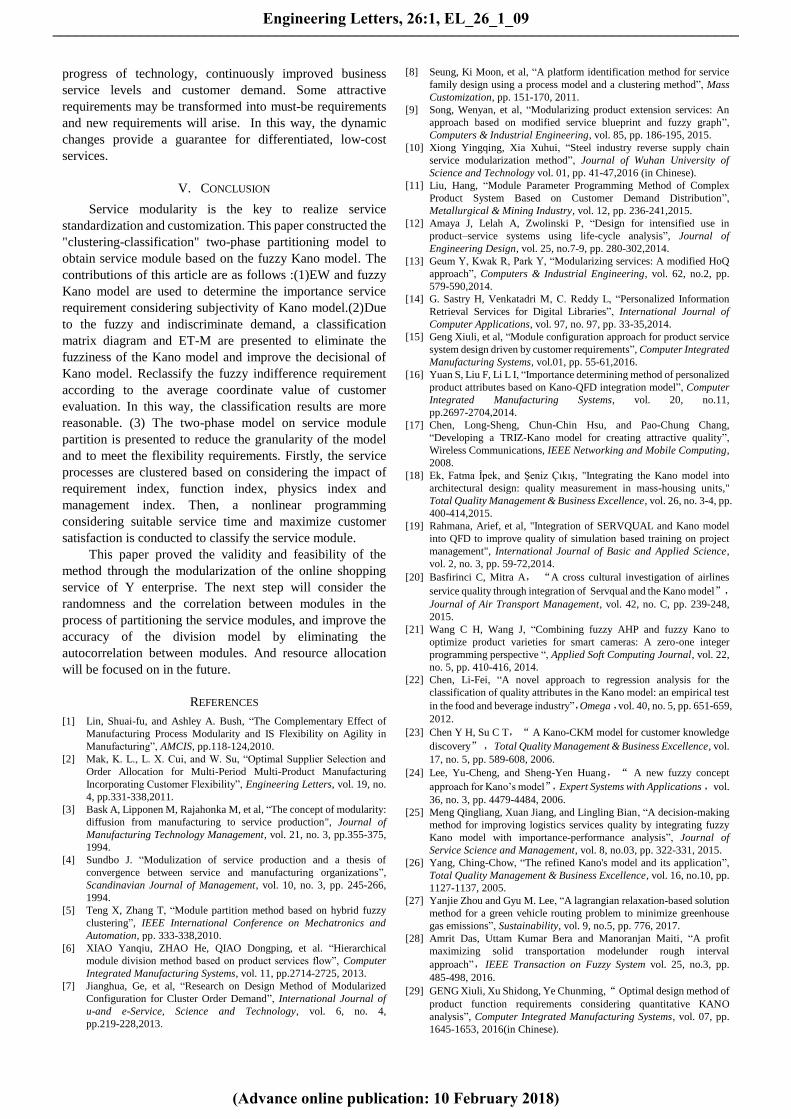
Service modules are classified by using equations (20)
-(21). Lingo11.0 software is used to solve the model. Finally,
the online shopping logistics service modules are obtained
and the results are shown in TABLE Ⅸ.
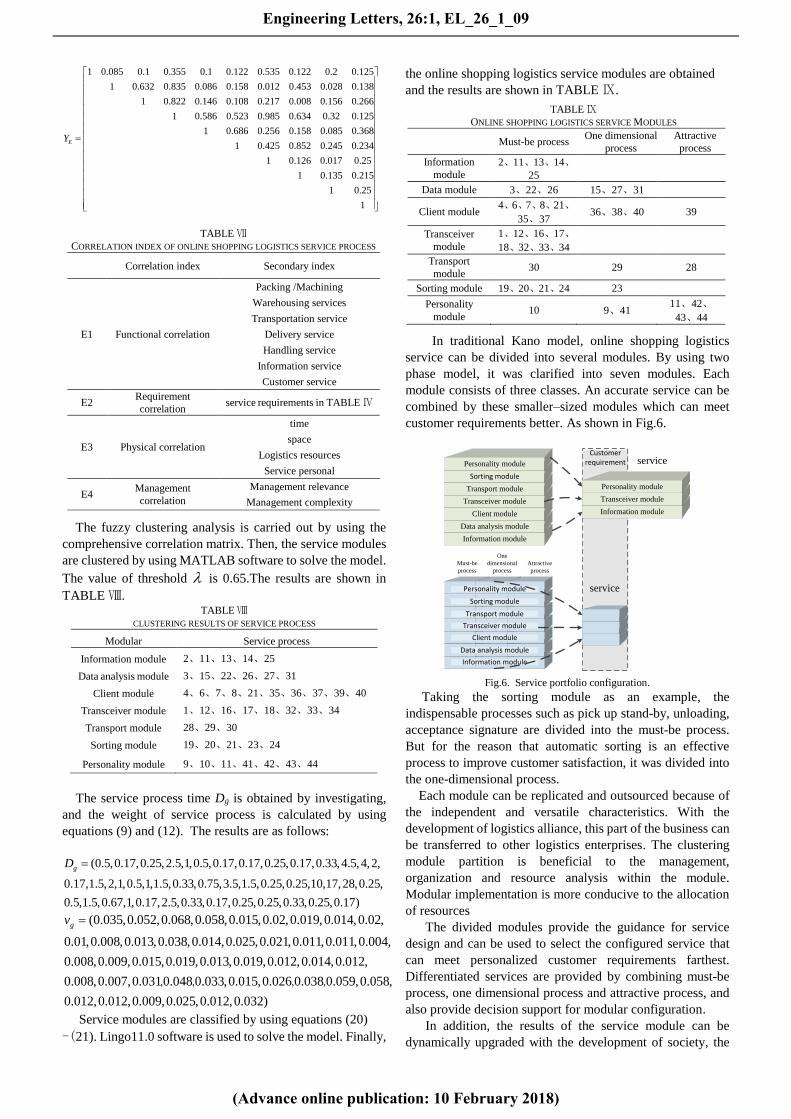
In traditional Kano model, online shopping logistics
service can be divided into several modules. By using two
phase model, it was clarified into seven modules. Each
module consists of three classes. An accurate service can be
combined by these smaller–sized modules which can meet
customer requirements better. As shown in Fig.6.
Information module
Data analysis module
Client module
Transceiver module
Transport module
Sorting module
Personality module
Information module
Transceiver module
Personality module
Information module
Data analysis module
Client module
Transceiver module
Transport module
Sorting module
Personality module
Must-be
process
One
dimensional
process
Attractive
process
service
service
Customer requirement
Fig.6. Service portfolio configuration.
Taking the sorting module as an example, the
indispensable processes such as pick up stand-by, unloading,
acceptance signature are divided into the must-be process.
But for the reason that automatic sorting is an effective
process to improve customer satisfaction, it was divided into
the one-dimensional process.
Each module can be replicated and outsourced because of
the independent and versatile characteristics. With the
development of logistics alliance, this part of the business can
be transferred to other logistics enterprises. The clustering
module partition is beneficial to the management,
organization and resource analysis within the module.
Modular implementation is more conducive to the allocation
of resources
The divided modules provide the guidance for service
design and can be used to select the configured service that
can meet personalized customer requirements farthest.
Differentiated services are provided by combining must-be
process, one dimensional process and attractive process, and
also provide decision support for modular configuration.
In addition, the results of the service module can be
dynamically upgraded with the development of society, the
TABLE Ⅶ
CORRELATION INDEX OF ONLINE SHOPPING LOGISTICS SERVICE PROCESS
Correlation index Secondary index
E1 Functional correlation
Packing /Machining
Warehousing services
Transportation service
Delivery service
Handling service
Information service
Customer service
E2 Requirement
correlation service requirements in TABLE Ⅳ
E3 Physical correlation
time
space
Logistics resources
Service personal
E4 Management
correlation
Management relevance
Management complexity
TABLE Ⅸ
ONLINE SHOPPING LOGISTICS SERVICE MODULES
Must-be process One dimensional
process
Attractive
process
Information
module
2、11、13、14、25
Data module 3、22、26 15、27、31
Client module 4、6、7、8、21、
35、37 36、38、40 39
Transceiver
module
1、12、16、17、
18、32、33、34
Transport
module 30 29 28
Sorting module 19、20、21、24 23
Personality
module 10 9、41
11、42、
43、44
1 0.085 0.1 0.355 0.1 0.122 0.535 0.122 0.2 0.125
1 0.632 0.835 0.086 0.158 0.012 0.453 0.028 0.138
1 0.822 0.146 0.108 0.217 0.008 0.156 0.266
1 0.586 0.523 0.985 0.634 0.32 0.125
1 0.686 0.256 0.158 0.085 0.368
1 0.425 0.852 0.245 0.234
1 0.
EY
126 0.017 0.25
1 0.135 0.215
1 0.25
1
Engineering Letters, 26:1, EL_26_1_09
(Advance online publication: 10 February 2018)
______________________________________________________________________________________
progress of technology, continuously improved business
service levels and customer demand. Some attractive
requirements may be transformed into must-be requirements
and new requirements will arise. In this way, the dynamic
changes provide a guarantee for differentiated, low-cost
services.
V. CONCLUSION
Service modularity is the key to realize service
standardization and customization. This paper constructed the
"clustering-classification" two-phase partitioning model to
obtain service module based on the fuzzy Kano model. The
contributions of this article are as follows :(1)EW and fuzzy
Kano model are used to determine the importance service
requirement considering subjectivity of Kano model.(2)Due
to the fuzzy and indiscriminate demand, a classification
matrix diagram and ET-M are presented to eliminate the
fuzziness of the Kano model and improve the decisional of
Kano model. Reclassify the fuzzy indifference requirement
according to the average coordinate value of customer
evaluation. In this way, the classification results are more
reasonable. (3) The two-phase model on service module
partition is presented to reduce the granularity of the model
and to meet the flexibility requirements. Firstly, the service
processes are clustered based on considering the impact of
requirement index, function index, physics index and
management index. Then, a nonlinear programming
considering suitable service time and maximize customer
satisfaction is conducted to classify the service module.
This paper proved the validity and feasibility of the
method through the modularization of the online shopping
service of Y enterprise. The next step will consider the
randomness and the correlation between modules in the
process of partitioning the service modules, and improve the
accuracy of the division model by eliminating the
autocorrelation between modules. And resource allocation
will be focused on in the future.
REFERENCES
[1] Lin, Shuai-fu, and Ashley A. Bush, “The Complementary Effect of
Manufacturing Process Modularity and IS Flexibility on Agility in
Manufacturing”, AMCIS, pp.118-124,2010.
[2] Mak, K. L., L. X. Cui, and W. Su, “Optimal Supplier Selection and
Order Allocation for Multi-Period Multi-Product Manufacturing
Incorporating Customer Flexibility”, Engineering Letters, vol. 19, no.
4, pp.331-338,2011.
[3] Bask A, Lipponen M, Rajahonka M, et al, “The concept of modularity:
diffusion from manufacturing to service production", Journal of
Manufacturing Technology Management, vol. 21, no. 3, pp.355-375,
1994.
[4] Sundbo J. “Modulization of service production and a thesis of
convergence between service and manufacturing organizations”,
Scandinavian Journal of Management, vol. 10, no. 3, pp. 245-266,
1994.
[5] Teng X, Zhang T, “Module partition method based on hybrid fuzzy
clustering”, IEEE International Conference on Mechatronics and
Automation, pp. 333-338,2010.
[6] XIAO Yanqiu, ZHAO He, QIAO Dongping, et al. “Hierarchical
module division method based on product services flow”, Computer
Integrated Manufacturing Systems, vol. 11, pp.2714-2725, 2013.
[7] Jianghua, Ge, et al, “Research on Design Method of Modularized
Configuration for Cluster Order Demand”, International Journal of
u-and e-Service, Science and Technology, vol. 6, no. 4,
pp.219-228,2013.
[8] Seung, Ki Moon, et al, “A platform identification method for service
family design using a process model and a clustering method”, Mass
Customization, pp. 151-170, 2011.
[9] Song, Wenyan, et al, “Modularizing product extension services: An
approach based on modified service blueprint and fuzzy graph”,
Computers & Industrial Engineering, vol. 85, pp. 186-195, 2015.
[10] Xiong Yingqing, Xia Xuhui, “Steel industry reverse supply chain
service modularization method”, Journal of Wuhan University of
Science and Technology vol. 01, pp. 41-47,2016 (in Chinese).
[11] Liu, Hang, “Module Parameter Programming Method of Complex
Product System Based on Customer Demand Distribution”,
Metallurgical & Mining Industry, vol. 12, pp. 236-241,2015.
[12] Amaya J, Lelah A, Zwolinski P, “Design for intensified use in
product–service systems using life-cycle analysis”, Journal of
Engineering Design, vol. 25, no.7-9, pp. 280-302,2014.
[13] Geum Y, Kwak R, Park Y, “Modularizing services: A modified HoQ
approach”, Computers & Industrial Engineering, vol. 62, no.2, pp.
579-590,2014.
[14] G. Sastry H, Venkatadri M, C. Reddy L, “Personalized Information
Retrieval Services for Digital Libraries”, International Journal of
Computer Applications, vol. 97, no. 97, pp. 33-35,2014.
[15] Geng Xiuli, et al, “Module configuration approach for product service
system design driven by customer requirements”, Computer Integrated
Manufacturing Systems, vol.01, pp. 55-61,2016.
[16] Yuan S, Liu F, Li L I, “Importance determining method of personalized
product attributes based on Kano-QFD integration model”, Computer
Integrated Manufacturing Systems, vol. 20, no.11,
pp.2697-2704,2014.
[17] Chen, Long-Sheng, Chun-Chin Hsu, and Pao-Chung Chang,
“Developing a TRIZ-Kano model for creating attractive quality”,
Wireless Communications, IEEE Networking and Mobile Computing,
2008.
[18] Ek, Fatma İpek, and Şeniz Çıkış, "Integrating the Kano model into
architectural design: quality measurement in mass-housing units,"
Total Quality Management & Business Excellence, vol. 26, no. 3-4, pp.
400-414,2015.
[19] Rahmana, Arief, et al, "Integration of SERVQUAL and Kano model
into QFD to improve quality of simulation based training on project
management", International Journal of Basic and Applied Science,
vol. 2, no. 3, pp. 59-72,2014.
[20] Basfirinci C, Mitra A, “A cross cultural investigation of airlines
service quality through integration of Servqual and the Kano model” ,
Journal of Air Transport Management, vol. 42, no. C, pp. 239-248,
2015.
[21] Wang C H, Wang J, “Combining fuzzy AHP and fuzzy Kano to
optimize product varieties for smart cameras: A zero-one integer
programming perspective “, Applied Soft Computing Journal, vol. 22,
no. 5, pp. 410-416, 2014.
[22] Chen, Li-Fei, “A novel approach to regression analysis for the
classification of quality attributes in the Kano model: an empirical test
in the food and beverage industry”,Omega ,vol. 40, no. 5, pp. 651-659,
2012.
[23] Chen Y H, Su C T,“ A Kano-CKM model for customer knowledge
discovery” ,Total Quality Management & Business Excellence, vol.
17, no. 5, pp. 589-608, 2006.
[24] Lee, Yu-Cheng, and Sheng-Yen Huang,“ A new fuzzy concept
approach for Kano’s model”,Expert Systems with Applications , vol.
36, no. 3, pp. 4479-4484, 2006.
[25] Meng Qingliang, Xuan Jiang, and Lingling Bian, “A decision-making
method for improving logistics services quality by integrating fuzzy
Kano model with importance-performance analysis”, Journal of
Service Science and Management, vol. 8, no.03, pp. 322-331, 2015.
[26] Yang, Ching-Chow, “The refined Kano's model and its application”,
Total Quality Management & Business Excellence, vol. 16, no.10, pp.
1127-1137, 2005.
[27] Yanjie Zhou and Gyu M. Lee, “A lagrangian relaxation-based solution
method for a green vehicle routing problem to minimize greenhouse
gas emissions”, Sustainability, vol. 9, no.5, pp. 776, 2017.
[28] Amrit Das, Uttam Kumar Bera and Manoranjan Maiti, “A profit
maximizing solid transportation modelunder rough interval
approach”,IEEE Transaction on Fuzzy System vol. 25, no.3, pp.
485-498, 2016.
[29] GENG Xiuli, Xu Shidong, Ye Chunming,“ Optimal design method of
product function requirements considering quantitative KANO
analysis”, Computer Integrated Manufacturing Systems, vol. 07, pp.
1645-1653, 2016(in Chinese).
Engineering Letters, 26:1, EL_26_1_09
(Advance online publication: 10 February 2018)
______________________________________________________________________________________