
96s21.q4cdn.com/281483445/files/doc_financials/Annual/Paycom-2016... · We continue to seize more...
109
Transcript of 96s21.q4cdn.com/281483445/files/doc_financials/Annual/Paycom-2016... · We continue to seize more...


ADJUSTED EBITDA GROWTH
Adjusted EBITDA grew to $94.5 million in 2016, representing a 96.5 percent increase from the prior year.*
* Net income grew to $43.8 million in 2016, representing a 109.3% increase from the prior year. For a reconciliation of net income to adjusted EBITDA, see Item 7, “Management’s Discussion and Analysis of Financial Condition and Results of Operations — Non-GAAP Financial Measures,” in the accompanying Annual Report on Form 10-K.
96.5%
80+ new knowledge base articlesin 2016
12,000+ webinar attendeesin 2016
119 Paycom University courses
REVENUE GROWTH IN 2016
2012
$329.1
$76.8
$107.6
$150.9
$224.7
2013 2014 2015 2016
44%COMPOUND ANNUAL GROWTH RATE (2012 – 2016)
46.5%REVENUE IN MILLIONS
PAYCOM FAST FACTS (AS OF DEC. 31, 2016)
2016HIGHLIGHTS
approximately
17,800clients including
3,000new clients
based on taxpayer
identification number
approximately
10,500clients including
1,600new clients based onparent companygrouping

PAYCOM 2016 ANNUAL REPORT 1
OVERVIEW
As a leading provider of an innovative, cloud-based, human capital management (HCM) software solution, Paycom helps organizations recruit, develop, empower and reward their em-ployees. Our solution equips businesses with the functionality and analytics needed to gain insight into their largest and most worthwhile asset: their people.
Built in the cloud before the popular term was coined, our pro-prietary solution requires no integration, thanks to a core system of record maintained within one database.
Paycom’s single-database suite effectively manages the com-plete employment life cycle, from recruitment to retirement, and includes tools for talent acquisition, time and labor management, payroll, talent management and human resource management.
In freeing businesses and their employees from low-value tasks such as re-keying information or logging into multiple HR ap-plications, our solution eliminates the need to integrate and replicate data among numerous, disparate vendors.
At the same time organizations benefit from our suite of prod-
ucts, their employees also have much to gain. Our application empowers employers to engage their workforce through perfor-mance reviews, surveys and e-learning courses, all while giving them anytime, anywhere access to their own HR data, including pay stubs, W-2s and benefits.
Leading in innovative technology and enhancing workplace cul-ture remains at the core of our mission. We leverage our talents to expand our thought leadership and cloud-based solution to meet the emerging demands of businesses across the country. We are committed to leading our clients, while listening to their needs. This formula helps us deliver ongoing software updates that are timely, practical and user-friendly.
Our research and development process is focused on the end user, from field employees to the data-driven executives in the C-suite. For feature-rich, cutting-edge HCM software dedicated to client satisfaction and excellence in security and data integrity, Paycom is the solution to which businesses increasingly look.
For more information about Paycom and our products, visit Paycom.com.
Nationwide, businesses and their HR departments have big things to accomplish.
Paycom’s full application suite effectively manages the complete employment life cycle, from recruitment to retirement, and includes talent acquisition, time and labor manage-ment, payroll, talent management and human resource management.
PAYCOM 2016 ANNUAL REPORT2
Thanks to the strong value proposition of our software, we con-cluded the year with our highest revenue to date, surpassing $329 million. We continue to seize more of the $26.5 billion total market for HCM applications and payroll services, of which Pay-com’s share currently represents approximately 1.2 percent.
BUILDING FOR TOMORROWInvesting in the future of our business is vital to our success. In 2016, we not only completed construction of a third building at our corporate headquarters, but also commenced construction
on a new, 250,000 square-foot structure that will provide comfortable and productive workspaces for our current and future team members and represent a foundation to support our continued growth for years to come.
We opened a record six offices in 2016, bringing our total to 42 sales teams across the country. Coupled with our five new offices from 2015, the 11 office openings over a two-year period is the most ever for Paycom. This growth reflects our strategic efforts to open sales offices in metropol-itan areas that are geographically new to us while also expanding our footprint in large markets that we believe have the potential to host several sales teams. For example, our new offices in Cleveland, Sacramento, San Antonio and Stamford repre-sented opportunities to tap into new markets, whereas we opened our second office in Chicago
as well as an office in Pasadena to increase our presence in the Los Angeles metropolitan area. These office openings demon-strate that we are committed to building opportunities for growth in the future, when it makes the most sense for the business.
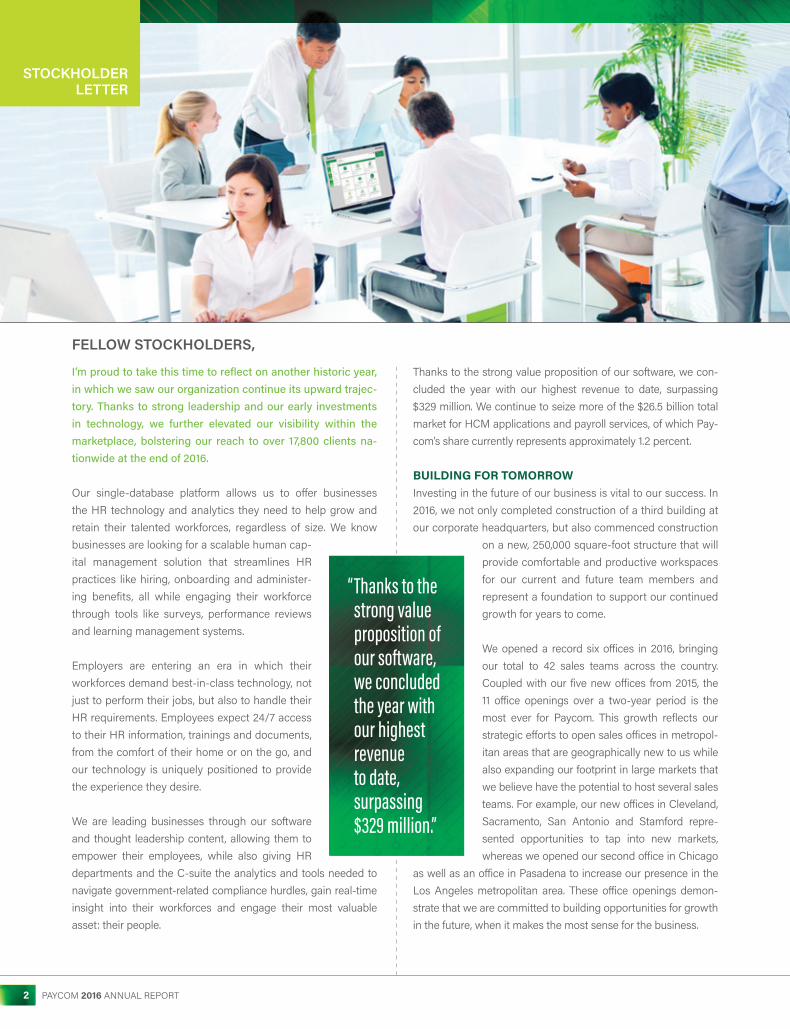
I’m proud to take this time to reflect on another historic year, in which we saw our organization continue its upward trajec-tory. Thanks to strong leadership and our early investments in technology, we further elevated our visibility within the marketplace, bolstering our reach to over 17,800 clients na-tionwide at the end of 2016.
Our single-database platform allows us to offer businesses the HR technology and analytics they need to help grow and retain their talented workforces, regardless of size. We know businesses are looking for a scalable human cap-ital management solution that streamlines HR practices like hiring, onboarding and administer-ing benefits, all while engaging their workforce through tools like surveys, performance reviews and learning management systems.
Employers are entering an era in which their workforces demand best-in-class technology, not just to perform their jobs, but also to handle their HR requirements. Employees expect 24/7 access to their HR information, trainings and documents, from the comfort of their home or on the go, and our technology is uniquely positioned to provide the experience they desire.
We are leading businesses through our software and thought leadership content, allowing them to empower their employees, while also giving HR departments and the C-suite the analytics and tools needed to navigate government-related compliance hurdles, gain real-time insight into their workforces and engage their most valuable asset: their people.
FELLOW STOCKHOLDERS,
“ Thanks to the strong value proposition of our software, we concluded the year with our highest revenue to date, surpassing $329 million.”
STOCKHOLDERLETTER

PAYCOM 2016 ANNUAL REPORT 3
(continued)
Beyond the physical expansion of our corporate headquarters and sales organization, we also increased our head count. As we have continued to invest in our workforce to support anticipat-ed growth, the Paycom staff stood at 2,075 as of Dec. 31, 2016. As a result, our highly scalable organization, extensive internal processes and proprietary technology all have the necessary bandwidth to aid our current trajectory.
RESEARCH AND PRODUCT DEVELOPMENTMost notably, we increased our research and development spend in 2016, growing it by 143 percent year over year.
When I analyze our research and development activities, I con-sider them as falling into three distinct categories: (i) ongoing compliance in both labor and tax; (ii) innovation in creating new products; and (iii) solidifying and expanding the product sets
that we have today. These efforts have allowed us to enrich our software and help us aid businesses across the country.
Providing our clients with the best possible solution is what drives the investments we’ve made in research and develop-ment. Just as we have always done, we will continue to look for additional opportunities for continued innovation in order to ensure our HCM product suite remains a leader among busi-nesses nationwide.
KEEPING A PULSE ON LEGISLATIVE CHANGESAn area of pride for our research and development is our fre-quent system updates to help our clients manage large and complex changes to government- and compliance-related is-sues. At Paycom, we excel at navigating these complexities. Maintaining the capability and nimbleness to lead in this area is
28,500 SFgym
500,000 SFall 4 office buildings
345,000 SFparking garage
42 sales teams

PAYCOM 2016 ANNUAL REPORT4
Chad RichisonPresident, Chief Executive Officer, Founder and Chairman of the Board of Directors
core to our value proposition and highly valued by our clients.It is the combination of Paycom’s expertise in HR regulations and tax laws, along with our proprietary single-database sys-tem, that helps our clients to not just achieve compliance, but obtain significant organizational efficiencies. These efficiencies, in turn, drive very compelling returns on our clients’ investments both in the Paycom system and also with their employees.
Every year we see an incredible amount of legislation pro-posed or enacted that would affect not only the payroll tax calculation, but also labor laws, and we are proud of our abil-ity to help businesses comply with these periodic and often sweeping changes.
LEADING OUR CLIENTSPaycom leads its clients when it comes to innovative software and government compliance, but we often help them put best practices in place that are facilitated by our system. These im-proved practices often drive significant efficiencies, and also increase client engagement with the Paycom solution across the entire organization, from front-line employees to C-suite executives. This increased engagement helps us deepen client relationships, which drives client retention.
We also gain insight into client usage by leveraging internal ana-lytics produced by our research and development teams. Using these key pieces of data, we identify scalable best practices for many solution sets we offer, thereby enriching the client and em-ployee experience. This information not only makes it easier on users, but positions our clients as technology-savvy employers.
Thanks to our leadership and direction, our team members exhibit a culture that celebrates cohesiveness and grit — an environment in which everyone is passionate about doing a great job — while leading our clients on a path to success.
SCALING SOLUTION HELPS LARGER CLIENTS Over the course of our last four earnings calls, I highlighted 12 new clients with head counts ranging from 2,000 to 8,000 employees, further demonstrating how our solution is scalable for businesses above our target range of companies with 50 to 2,000 employ-ees. Considering we added approximately 3,000 new clients last year, those highlighted were a rather small representation of our recent growth. One thing consistent among our new clients is
their desire for an easier HR and payroll platform that negates the need for system integration or multiple logins.
OUR FUTURE2016 brought many positive highlights for Paycom and we are optimistic about all that will unfold in 2017. We returned value to our stockholders by repur-chasing $50 million of common stock in 2016, representing over 1.1 million shares. We plan to continue this strategy in 2017 with the extension and $50 mil-lion increase of the repurchase plan, as announced in early Feb-ruary of this year. We believe that these repurchases speak to the power of our cash-generative business model and unfailing dedication to our investors.
In 2017, we enter our 20th year of leading organizations in their search for HR and payroll technology that streamlines process-es, engages workforces and makes their lives easier. Looking ahead, we will remain true to our core values and strategies as we continue to invest in our research and development efforts.
I am proud of the determination displayed by our 2,000-plus em-ployees. They are leading America’s businesses by providing the best technology and service possible.
We executed our goals, added sales teams and continued to capture market share in the outsourced payroll and HCM indus-try, and we plan to execute these same strategies in 2017.
Thank you for investing in Paycom.
STOCKHOLDERLETTER
“ We returned value to our stockholders by repurchasing $50 million of common stock in 2016, representing over 1.1 million shares.”

PAYCOM 2016 ANNUAL REPORT 5
CRAIG BOELTEChief Financial Officer
Mr. Boelte has served as Paycom’s Chief Financial Officer since Feb-ruary 2006, bringing more than 30 years of experience in various facets of the human resources and work-force management field. Before
joining us, Mr. Boelte owned an accounting practice that served Paycom. Prior to that, Mr. Boelte spent nine years at Deloitte & Touche, where he served as senior tax manager. A member of the Oklahoma Society of CPAs and the American Institute of CPAs, he received both his bachelor’s degree in business ad-ministration and master’s degree in accounting from Oklahoma State University.
JEFFREY YORK Chief Sales Officer
Mr. York has served as Paycom’s Chief Sales Officer since 2007, hav-ing opened our Dallas location in 2002 before joining the corporate executive team. He came to Paycom after 12 years at ADP, where he held
a variety of sales management positions, including vice pres-ident of sales for the major accounts division. Mr. York earned his MBA from Baylor University and his bachelor’s degree in business administration from Texas Tech University.
STACEY PEZOLDChief Learning Officer
Mrs. Pezold has served as Paycom’s Chief Learning Officer since March 2017. She previously served as Paycom’s Chief Operating Officer from March 2015 to March 2017 and Executive Vice President of
Operations from September 2012 to March 2015. Mrs. Pezold held various other positions after joining us in 2005, including Executive Vice President, Director of Corporate Training and Regional Manager. Mrs. Pezold has over 13 years of leadership and training experience and earned her bachelor’s degree in journalism and broadcasting from Oklahoma State University.
WILLIAM KERBER III Chief Information Officer
Mr. Kerber has served as Paycom’s Chief Information Officer since July 2007 and has been with Paycom since 1999. Mr. Kerber is a founding team member, bringing more than 20 years of software development
and network design experience. Prior to serving as Chief Infor-mation Officer, Mr. Kerber served as a lead software developer and network architect. He attended the Oklahoma School of Science and Mathematics and received his bachelor’s degree in computer science from the University of Oklahoma’s engineer-ing/computer science program, where he is currently a member of its board of advisors.
CHAD RICHISONPresident, Chief Executive Officer, Founder and Chairman of the Board of Directors
Mr. Richison has served as President and Chief Executive Officer since founding Paycom in 1998 and was appointed Chairman of the Board of Directors in August 2016. He has also served as a member of Paycom’s Board of Directors since 1998. Mr. Richison began his career in sales with a national payroll and human resources company and a regional payroll company prior to founding Paycom. Mr. Richison received his bachelor’s degree in mass communications – journalism from the University of Central Oklahoma.
LEADERSHIPTEAM
For information about the members of our Board of Directors, please refer to the section titled “Directors Skills, Experience and Background” in the accompanying proxy statement.
PAYCOM 2016 ANNUAL REPORT6
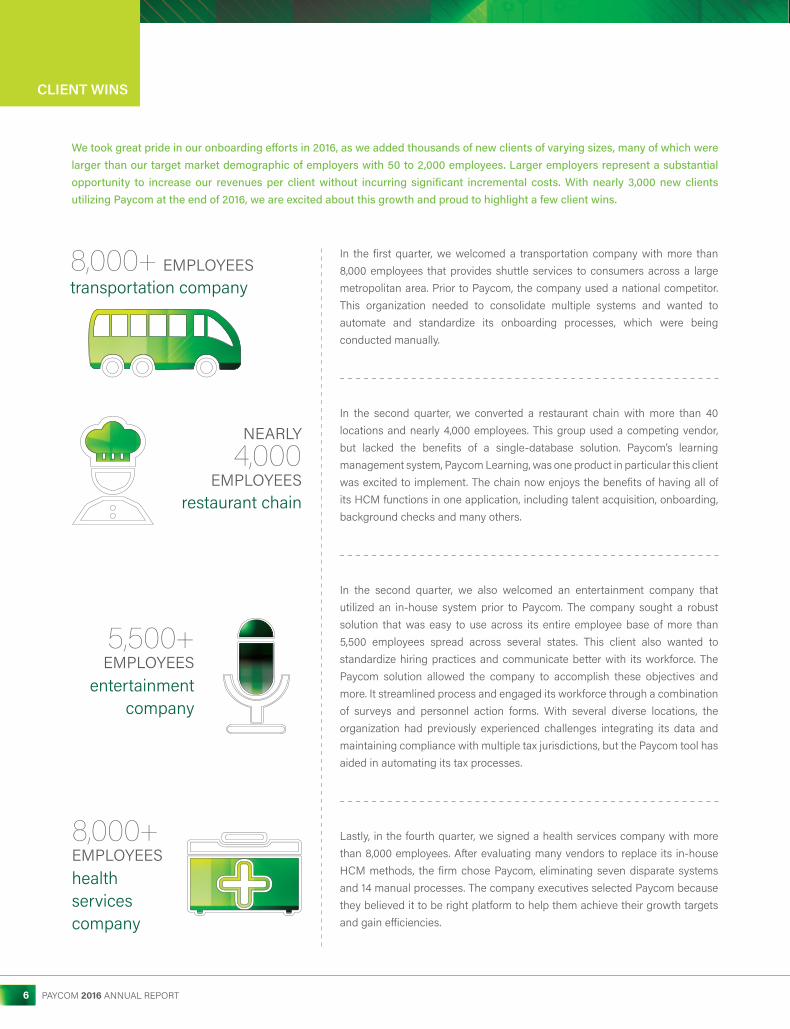
We took great pride in our onboarding efforts in 2016, as we added thousands of new clients of varying sizes, many of which were larger than our target market demographic of employers with 50 to 2,000 employees. Larger employers represent a substantial opportunity to increase our revenues per client without incurring significant incremental costs. With nearly 3,000 new clients utilizing Paycom at the end of 2016, we are excited about this growth and proud to highlight a few client wins.
8,000+ EMPLOYEEStransportation company
NEARLY
4,000 EMPLOYEES
restaurant chain
5,500+ EMPLOYEES
entertainment company
8,000+ EMPLOYEEShealth services company
In the first quarter, we welcomed a transportation company with more than 8,000 employees that provides shuttle services to consumers across a large metropolitan area. Prior to Paycom, the company used a national competitor. This organization needed to consolidate multiple systems and wanted to automate and standardize its onboarding processes, which were being conducted manually.
In the second quarter, we converted a restaurant chain with more than 40 locations and nearly 4,000 employees. This group used a competing vendor, but lacked the benefits of a single-database solution. Paycom’s learning management system, Paycom Learning, was one product in particular this client was excited to implement. The chain now enjoys the benefits of having all of its HCM functions in one application, including talent acquisition, onboarding, background checks and many others.
In the second quarter, we also welcomed an entertainment company that utilized an in-house system prior to Paycom. The company sought a robust solution that was easy to use across its entire employee base of more than 5,500 employees spread across several states. This client also wanted to standardize hiring practices and communicate better with its workforce. The Paycom solution allowed the company to accomplish these objectives and more. It streamlined process and engaged its workforce through a combination of surveys and personnel action forms. With several diverse locations, the organization had previously experienced challenges integrating its data and maintaining compliance with multiple tax jurisdictions, but the Paycom tool has aided in automating its tax processes.
Lastly, in the fourth quarter, we signed a health services company with more than 8,000 employees. After evaluating many vendors to replace its in-house HCM methods, the firm chose Paycom, eliminating seven disparate systems and 14 manual processes. The company executives selected Paycom because they believed it to be right platform to help them achieve their growth targets and gain efficiencies.
CLIENT WINS

PAYCOM 2016 ANNUAL REPORT 7
Leading in technologyLeading in culture
Leading our clients


UNITED STATESSECURITIES AND EXCHANGE COMMISSION
Washington, D.C. 20549
FORM 10-K(Mark One)È ANNUAL REPORT PURSUANT TO SECTION 13 OR 15(d) OF THE SECURITIES
EXCHANGE ACT OF 1934For the fiscal year ended December 31, 2016
or
‘ TRANSITION REPORT PURSUANT TO SECTION 13 OR 15(d) OF THE SECURITIESEXCHANGE ACT OF 1934
For the transition period from toCommission file number: 001-36393
Paycom Software, Inc.(Exact name of registrant as specified in its charter)
Delaware 80-0957485(State or other jurisdiction of
incorporation or organization)(I.R.S. Employer
Identification Number)
7501 W. Memorial RoadOklahoma City, Oklahoma 73142
(Address of registrant’s principal executive offices)Registrant’s telephone number, including area code: (405) 722-6900
Securities registered pursuant to Section 12(b) of the Act:Title of each class Name of each exchange on which registered
Common Stock, $0.01 par value New York Stock ExchangeSecurities registered pursuant to Section 12(g) of the Act:
None
Indicate by check mark if the registrant is a well-known seasoned issuer, as defined in Rule 405 of the SecuritiesAct. Yes È No ‘
Indicate by check mark if the registrant is not required to file reports pursuant to Section 13 or Section 15(d) of theAct. Yes ‘ No È
Indicate by check mark whether the registrant: (1) has filed all reports required to be filed by Section 13 or 15(d) of theSecurities Exchange Act of 1934 during the preceding 12 months (or for such shorter period that the registrant was required tofile such reports), and (2) has been subject to such filing requirements for the past 90 days. Yes È No ‘
Indicate by check mark whether the registrant has submitted electronically and posted on its corporate Web site, if any, everyInteractive Data File required to be submitted and posted pursuant to Rule 405 of Regulation S-T (§232.405 of this chapter)during the preceding 12 months (or for such shorter period that the registrant was required to submit and post suchfiles). Yes È No ‘
Indicate by a check mark if disclosure of delinquent filers pursuant to Item 405 of Regulation S-K (§229.405 of this chapter)is not contained herein, and will not be contained, to the best of registrant’s knowledge, in definitive proxy or informationstatements incorporated by reference in Part III of this Form 10-K or any amendment to this Form 10-K. È
Indicate by check mark whether the registrant is a large accelerated filer, an accelerated filer, a non-accelerated filer, or asmaller reporting company. See the definitions of “large accelerated filer,” “accelerated filer” and “smaller reportingcompany” in Rule 12b-2 of the Exchange Act. (Check one):Large accelerated filer È Accelerated filer ‘Non-accelerated filer ‘ (Do not check if a smaller reporting company) Smaller reporting company ‘
Indicate by check mark whether the registrant is a shell company (as defined in Rule 12b-2 of the ExchangeAct). Yes ‘ No È
As of February 6, 2017, 59,491,770 shares of the registrant’s common stock, $0.01 par value per share, were outstanding,including 2,145,436 shares of restricted stock. The aggregate market value of voting stock held by non-affiliates of theregistrant, as of June 30, 2016, the last day of registrant’s most recently completed second fiscal quarter, was approximately$2.1 billion (based on the closing price for shares of the registrant’s common stock as reported by the New York StockExchange on that date).
DOCUMENTS INCORPORATED BY REFERENCEPortions of the registrant’s Definitive Proxy Statement on Schedule 14A to be furnished to stockholders in connection
with its 2017 Annual Meeting of Stockholders are incorporated by reference in Part III, Items 10-14 of this Annual Report onForm 10-K.

PAYCOM SOFTWARE, INC.2016 ANNUAL REPORT ON FORM 10-K
TABLE OF CONTENTS
Page No.
PART I
Item 1. Business 1
Item 1A. Risk Factors 14
Item 1B. Unresolved Staff Comments 31
Item 2. Properties 32
Item 3. Legal Proceedings 32
Item 4. Mine Safety Disclosures 33
PART II
Item 5. Market for Registrant’s Common Equity, Related Stockholder Matters, and IssuerPurchases of Equity Securities 33
Item 6. Selected Financial Data 35
Item 7. Management’s Discussion and Analysis of Financial Condition and Results of Operations 35
Item 7A. Quantitative and Qualitative Disclosures About Market Risk 58
Item 8. Financial Statements and Supplementary Data 60
Item 9. Changes in and Disagreements with Accountants on Accounting and Financial Disclosure 87
Item 9A. Controls and Procedures 87
PART III
Item 10. Directors, Executive Officers and Corporate Governance 89
Item 11. Executive Compensation 89
Item 12. Security Ownership of Certain Beneficial Owners and Management and RelatedStockholder Matters 89
Item 13. Certain Relationships and Related Transactions, and Director Independence 89
Item 14. Principal Accounting Fees and Services 89
PART IV
Item 15. Exhibits, Financial Statement Schedules 89
Signatures 95

PART I
SPECIAL NOTE REGARDING FORWARD-LOOKING STATEMENTS
This Annual Report on Form 10-K (this “Form 10-K”) contains forward-looking statements within themeaning of Section 27A of the Securities Act of 1933, as amended (the “Securities Act”) and Section 21E of theSecurities Exchange Act of 1934, as amended (the “Exchange Act”). Forward-looking statements are anystatements that look to future events and include, but are not limited to, statements regarding our businessstrategy; anticipated future operating results and operating expenses, cash flows, capital resources, dividendsand liquidity; trends, opportunities and risks affecting our business, industry and financial results; futureexpansion or growth plans and potential for future growth; our ability to attract new clients to purchase oursolution; our ability to retain clients and induce them to purchase additional applications; our ability toaccurately forecast future revenues and appropriately plan our expenses; market acceptance of our solution andapplications; our expectations regarding future revenues generated by certain applications, including EnhancedACA; continued acceptance of Software–as-a-Service (“SaaS”) as an effective method for delivering humancapital management (“HCM”) solutions and other business management applications; our ability to attract andretain qualified employees and key personnel; future regulatory, judicial and legislative changes; how certainfactors affecting our performance correlate to improvement or deterioration in the labor market; our plan toopen additional sales offices and our ability to effectively execute such plan; the sufficiency of our existing cashand cash equivalents to meet our working capital and capital expenditure needs over the next 12 months; ourability to create additional jobs at our corporate headquarters; our ability to expand our corporate headquarterswithin an expected timeframe; our plans regarding our capital expenditures and investment activity as ourbusiness grows, including with respect to research and development; the expected impact on our consolidatedfinancial statements of new accounting pronouncements; and our plans to repurchase shares of our commonstock through a stock repurchase plan. In addition, forward-looking statements also consist of statementsinvolving trend analyses and statements including such words as “anticipate,” “believe,” “could,” “expect,”“may,” “might,” “plan,” “would,” and similar expressions or the negative of such terms or other comparableterminology. These forward-looking statements speak only as of the date of this Form 10-K and are subject tobusiness and economic risks. As such, our actual results could differ materially from those set forth in theforward-looking statements as a result of the factors set forth below in Part I, Item 1A, “Risk Factors,” and inour other reports filed with the Securities and Exchange Commission (the “SEC”). We do not undertake anyobligation to update or revise the forward-looking statements to reflect events that occur or circumstances thatexist after the date on which such statements were made, except to the extent required by law.
Item 1. Business
Unless we state otherwise or the context otherwise requires, the terms “Paycom,” “we,” “us,” “our” andthe “Company” refer to Paycom Software, Inc., a Delaware corporation, and its consolidated subsidiaries.
Overview
We are a leading provider of a comprehensive, cloud-based HCM software solution delivered as SaaS. Weprovide functionality and data analytics that businesses need to manage the complete employment life cycle fromrecruitment to retirement. Our solution requires virtually no customization and is based on a core system ofrecord maintained in a single database for all HCM functions, including talent acquisition, time and labormanagement, payroll, talent management and human resources (“HR”) management applications. Our user-friendly software allows for easy adoption of our solution by employees, enabling self-management of theirHCM activities in the cloud, which reduces the administrative burden on employers and increases employeeproductivity.
Organizations need sophisticated, flexible and intuitive applications that can quickly adapt to their evolvingHCM requirements, streamline their HR processes and systems and enable them to control costs. We believe that
1

the HCM needs of most organizations are currently served either by multiple providers that partner in an attemptto replicate a comprehensive SaaS product or by legacy providers offering outdated on-premise products. Theseapproaches often result in challenges with system integration, low scalability, high costs, extended delivery timesand large up-front capital requirements.
Because our solution was developed in-house and is based on a single platform, there is no need to integrate,update or access multiple databases, which are common issues with competitor offerings that use multiple third-party systems in order to link together their HCM offerings. Additionally, our solution maintains data integrityfor accurate, actionable and real-time analytics and business intelligence and helps clients minimize the risk ofcompliance errors due to inaccurate or missing information. We deliver feature-rich applications whilemaintaining excellence in information security and quality management standards as evidenced by ourInternational Organization for Standardization (“ISO”) certifications.
We sell our solution directly through our internally trained, client-focused and highly skilled sales forcebased in offices across the United States. As a part of our client retention effort, a specialist within a dedicatedteam is assigned to each client to provide industry-leading, personalized service. We have over 17,800 clients,none of which constituted more than one-half of one percent of our revenues for the year ended December 31,2016. We believe that as a result of our focus on client retention, we enjoy high client satisfaction as evidencedby an annual revenue retention rate of 91% from existing clients for each of the three years ended December 31,2016, 2015 and 2014. We believe our revenue retention rate understates our client loyalty because this rate alsoincludes former clients that were acquired or otherwise ceased operations.
We were founded in 1998. Since our founding, we have focused on providing an innovative SaaS HCMsolution. As of December 31, 2016, we had 2,075 employees across the United States. For the years endedDecember 31, 2016, 2015 and 2014, our revenues were $329.1 million, $224.7 million and $150.9 million,respectively, representing year-over-year growth in revenues of approximately 47% and 49%, respectively. Wecurrently derive the majority of our revenues from payroll processing. We are able to determine revenues frompayroll processing because all of our clients are required to utilize our payroll application in order to access ourother applications. We generally do not separately track our revenues across our other applications because weoften sell applications in various groupings and configurations for a single price. We realized net income of$43.8 million, $20.9 million and $5.7 million for the years ended December 31, 2016, 2015 and 2014,respectively.
According to the International Data Corporation (“IDC”), the U.S. market for HCM applications iscomprised of software that automates business processes covering the entire span of an employee’s relationshipwith his or her employer. IDC estimates that the U.S. market for HCM applications (excluding payroll servicesand expense management) will total $8.8 billion in 2017. These applications include maintenance of HR records,recruiting applications, performance management, time and labor management tracking, compliance,compensation management and other HR functions. According to IDC, the U.S. market for payroll services willbe an estimated $17.7 billion in 2017. The payroll services market includes transactional activities associatedwith paying employees, maintaining accounting records and administrating payroll taxes while payrollaccounting applications offer the functionality to effectively track these various payments and transfers.
The Paycom Solution
We offer an end-to-end SaaS HCM solution that provides our clients and their employees with immediateaccess to accurate and secure information and analytics at any time from any location. We believe that oursolution delivers the following benefits:
Comprehensive HCM Solution
Our solution offers functionality that manages the entire employment life cycle for employers andemployees, from recruitment to retirement. Our user-friendly applications streamline client processes and provide
2

clients and their employees with the ability to directly access and manage administrative processes, includingapplications that identify candidates, on-board employees, manage time and labor, administer payroll deductionsand benefits, manage performance, terminate employees and administer post-termination health benefits such asCOBRA. The widespread employee usage of our applications helps further integrate our solution into theadministrative processes of our clients. Our solution also has the advantage of being built in-house by our highlytrained and skilled team of software developers, thereby minimizing data integrity issues across applications.
Core System of Record
Our solution is based on a core system of record that contains payroll and HR information in one convenientdatabase, thereby reducing costs and eliminating the need for multiple software products and vendors and themaintenance of employee data in numerous databases. This core system of record enables our clients to inputemployee data one time and enjoy seamless functionality across our applications. When a revision is made to thefile of an employee, all appropriate personnel have access to the change in real time. In addition, our core systemof record helps clients minimize the risk of compliance errors due to inaccurate or missing information thatresults from maintaining multiple databases. Through accurate tracking and management of employee payrolland other HR data, such information can be compiled for comprehensive and consistent reporting for our clients.
Data Analytics
Our solution allows clients to analyze accurate employee information to make business decisions basedupon actionable, real-time, point-and-click analytics provided through our client dashboard. This functionalityhelps our clients operate with a more complete and accurate picture of their organization, as our solution’sembedded analytics capture the content and context of everyday business events, facilitating fast and informeddecision-making from any location.
Enhanced Employee Experience
The employees of our clients also benefit from our HCM applications. As workforces transition fromtechnology-savvy to technology-dependent, employees expect mobile technology and the resources necessary toreadily access information and control their professional development. Through our employee self-service portal,employees can view real-time HR information, including pay stubs, W-2s and benefits information, as well asmanage their schedules and vacation time and update W-4 contact information. Our system also allowsemployers to engage their workforce through learning management courses and training paths, surveys andperformance goals and reviews.
Personalized Support Provided by Trained Personnel
Our applications are supported by one-on-one personal assistance from trained specialists. Servicespecialists are assigned to specific clients and are trained across all of our applications, ensuring they providecomprehensive, expert-level service. Our client service is ISO 9001:2008 certified on the basis of its quality andconsistency. We strive to provide our clients with high levels of service and support to ensure their continued useof our solution for all of their HCM needs. We have maintained high client satisfaction, as evidenced by anannual revenue retention rate of 91% from existing clients for each of the three years ended December 31, 2016,2015 and 2014.
Software-as-a-Service Delivery Model
Our SaaS delivery model allows clients with geographically dispersed and mobile workforces to operatemore efficiently, and allows these clients to implement, access and use our client-oriented Internet solution ondemand and remotely through standard web browsers, smart phones, tablets and other web-enabled devices. OurSaaS solution reduces the time, risk, headcount and costs associated with installing and maintaining applicationsfor on-premise products within the information technology (“IT”) infrastructure of our clients.
3
Secure Cloud-Based Architecture
Our cloud-based architecture allows our solution to be implemented remotely with minimal clientinteraction. Updates such as software enhancements and newly developed applications can be deployed withoutclient interaction, disruption or involvement, allowing our clients to make a smaller investment in hardware,personnel, implementation time and consulting. Additionally, we own and maintain all of the infrastructuretechnology to host our solution and to maximize system availability for clients. Our focus and investment intechnology and data security has been recognized with ISO/IEC 27001:2013 certified security standards thatprovide our clients with a “best-in-class” level of data security.
Scalability to Grow with our Clients
Our solution is highly scalable. We serve a diversified client base ranging in size from one to over 8,000employees. We calculate the number of clients’ employees based on parent company grouping. Our clients areable to use the same solution while their businesses grow by deploying applications as-needed in real-time.Pricing is determined by employee headcount and the number of applications utilized, enabling our clients toalign HCM spending with their evolving HCM needs as compared to traditional HCM products that requireclients to migrate to new software as they grow but retain fixed costs even if the client shrinks in size.
Efficient and Productive Research and Development
We believe that we benefit from a competitive advantage with our research and development investments,people and processes. Early investments in our proprietary, cloud-based architecture enable us to develop anddeploy applications in a timely and cost-effective manner. We have also chosen to base our research anddevelopment team in Oklahoma and Texas, which we believe provides us with high-quality talent at a lower costcompared to other locations in the United States where there is more competition for technology talent. Thesestrategic decisions have enabled us to have a highly productive research and development function while ourresearch and development expenses grew 143%, 99% and 102% from the comparable year period, for 2016, 2015and 2014, respectively.
Our Strategy for Growth
Our strategy is to continue to establish our solution as the HCM industry standard. To accomplish this, weintend to:
Increase Our Presence in Existing Markets
We believe a significant market opportunity exists to increase our presence within markets where wecurrently have a sales office. Each sales office is typically staffed with one sales team, with each team comprisedof a sales manager and approximately six to eight other sales professionals. Although we have a sales office in 32of the 50 largest metropolitan statistical areas (“MSAs”) in the United States based on July 2015 U.S. CensusBureau estimates, only five of these MSAs are currently served by multiple Paycom sales teams. In addition toexpanding into new markets, we plan to further penetrate and more effectively capture existing markets byadding sales offices and increasing the number of sales teams in such markets. Since our initial public offering(“IPO”) in April 2014, we have expanded our presence within three MSAs that were already served by at leastone Paycom sales team by opening new sales offices in Brooklyn, Chicago and Pasadena.
Expand Into Additional Markets
We plan to continue expanding our sales capability by opening sales offices in certain metropolitan areaswhere we currently have no sales teams. Since our IPO in April 2014, we have expanded into eight new marketsby opening new sales offices in Cincinnati, Cleveland, Kansas City, Nashville, Pittsburgh, Sacramento, SanAntonio, and Stamford. We intend to open 10 to 14 additional sales offices over the next two years, as well aspotentially expand over the longer term into international markets.
4

We have historically selected new locations based on potential client and employee demographics as well asbusiness density. Our property management team handles the non-personnel aspects of new office openings,from securing an office lease through establishing information security infrastructure and procedures for theprospective office location. When opening a new sales office, we typically relocate a proven sales manager froman existing territory who then recruits a team of high performing sales representatives. It typically takes a newsales office 24 months to reach maturity.
Enlarge our Existing Client Relationships
We dedicate our resources to helping our clients facilitate their goals, whether through helping them executebetter hiring decisions, manage compensation more effectively or simply operate more efficiently. We believe asignificant growth opportunity exists in selling additional applications to our current clients. Many clients havesubsequently deployed additional applications as they recognize the benefits of our comprehensive solution. Aswe extend and enhance the functionality of our solution, we will continue to invest in initiatives to increase theadoption of our solution and maintain our high levels of client satisfaction.
Target Larger Clients
The average size of our clients has grown significantly as we have organically grown our operations andincreased the number of applications we offer. Based on our total revenues, we have grown at an approximately44% CAGR from January 1, 2012 through December 31, 2016. Our solution requires no adjustment to servelarger clients. We believe larger employers represent a substantial opportunity to increase the number of clientsand to increase our revenues per client, with limited incremental cost to us. To further capitalize on thisopportunity, we intend to target larger businesses opportunistically where our current sales model is effective.
Maintain Our Leadership in Innovation by Strengthening and Extending our Solution
Our ability to develop and deploy new applications and updates rapidly and cost-effectively has beenintegral to the results that we have achieved to date. We intend to continue extending the functionality and rangeof our solution in the future. Our development efforts are performed exclusively in-house and are heavily basedupon proactive research and client input. We are focusing our investments on the development of newapplications and enhancements that are responsive to the needs of our clients, which are garnered throughongoing client interaction and collaboration.
Our Applications
Our HCM solution offers a full suite of applications that generally fall within the following categories:talent acquisition, time and labor management, payroll, talent management and HR management.
Talent Acquisition
Applicant Tracking. Our applicant tracking application simplifies the recruiting processes neededto hire the most qualified employees. By using our all-in-one system, our clients can movecandidates from the application process through new employee on-boarding without re-keyingdata.
Candidate Tracker. Our candidate tracker application enables recruiters to track and stayconnected to potential talent through an online database of top candidates. This application helpsclients fill future positions faster without the cost of professional recruiting firms.
5

Background Checks. Our background check application helps to ensure that prospective new hiresare qualified candidates. We provide clients with the tools for authorizing background checks,creating pre-adverse and adverse action letters and securely store results as required by the FairCredit Reporting Act.
On-Boarding. Our on-boarding application streamlines the hiring and termination processes foremployees of our clients by creating online checklists of tasks to be assigned to an employee orgroup of employees.
E-Verify ®. Our E-Verify ® application automates employment verification and reduces ourclients’ exposure to audits and penalties that could result from I-9 violations.
Tax Credit Services. Our tax credit services application helps employers process and calculate theavailable federal tax credits associated with hiring employees who meet various qualifications.
Time and Labor Management
Time and Attendance. Our time and attendance application allows our clients to accurately andefficiently manage when, where and how employees report their hours worked. Clients can applycustomized rules, use batch editing and use timecard management tools to manage complex timeand attendance needs. Our Web Time Clock feature allows employees to clock in and out online,which automatically updates the payroll application when approved, eliminating the need tomanually calculate timesheets and re-key information into payroll systems. We also offer severaldifferent types of hardware that are ideal for single or multi-terminal environments.
Scheduling/Schedule Exchange. Our scheduling application helps managers with employeescheduling through automated functionality that provides for a seamless workflow with thepayroll and time and attendance applications. Our schedule exchange application allowsemployees and managers access to their schedules at any time and employees can approve, declineor swap their schedules and see what shifts are available for pickup.
Time-Off Requests. Our time-off requests application automates and standardizes the time-offrequest procedure and helps employers remain effectively staffed. Managers can view an onlinetime-off calendar to easily monitor and approve or deny time-off requests. Our employee self-service tool allows employees to view the time-off they have available, submit requests and viewblackout dates, the status of requests and any manager comments.
Labor Allocation. Our labor allocation application simplifies the process of setting up and trackingemployee hours based on the job the employee is working.
Labor Management Reports/Push Reporting. Our labor management reports application providesclients with access to up-to-the-minute reports on the information they need to better manage theirlabor force, such as overtime and labor distribution. Our push reporting application also givesclients the ability to set up recurring reports and to schedule them to be run automatically and sentto users on a daily, weekly, monthly, quarterly or yearly basis.
6

Geofencing/Geotracking. Enhancing our time and attendance solution, Paycom’s geofencing andgeotracking location-based technology assist our clients in managing the whereabouts ofemployees while on the job. Geofencing allows employers to establish geographical boundarieswithin which their employees are authorized to clock in and out when using our Web Time Clockon smartphones, tablets or other electronic devices. Once enabled, this time-theft-combatting toolsupersedes IP address restrictions, meaning the system first checks for authorized geographicallocations, rather than authorized IP addresses. In addition, the geotracking tool empowers clientsto track employees’ geographical locations upon clocking in and out. The coordinates collected bythe application can be entered into and viewed on a Google® display map.
Payroll
Payroll and Tax Management. Our payroll application is the foundation of our solution and all ofour clients are required to utilize this application in order to access our other applications. Ourpayroll application is automatically updated with changes in employee information and offers othertime saving functionality such as batch editing and effective dating. The application can beaccessed at any time to make changes, run payroll and generate custom reports. We also help ourclients by handling their payroll taxes and deposits, regulatory correspondence, amendments, andpenalty and interest disputes.
Paycom Pay. Our Paycom Pay application eliminates the tedious job of check reconciliation byissuing checks to our clients’ employees that clear from a Paycom bank account, which helpsclients eliminate potential liability and simplifies the reconciliation process.
Expense Management. Our expense management application eliminates the manual, paper-basedprocesses associated with employee expense reimbursement and allows employers to control andmonitor expenses by setting clearly defined rules and parameters for employee reimbursement.Employees can upload receipts when submitting their expenses and access an expense dashboardwhere they can view the status of their submitted expenses.
Garnishment Management. Our garnishment management application allows clients to handlecommunications with garnishment payees and agencies and to calculate and track garnishmentpayments.
GL Concierge. Our GL Concierge application offers organizations more control and transparencyinto their payroll general ledger and gives finance professionals intuitive reporting, enriched audittrails, customizable file layouts and real-time alerts. Clients of all sizes can utilize a wide varietyof general ledger maps along with an action-item alert system that improves the dynamics of theirdaily operations.
Talent Management
Employee Self-Service. Our employee self-service application improves employee engagement byempowering employees to self-manage certain transactions, obtain quick answers to frequentpayroll and HR questions, access their pay history and view performance goals and reviews andtotal compensation reports to review their compensation and benefits package. Benefitsinformation and paid time-off accruals also give employees the ability to make informed decisionsregarding their benefit selections and time-off requests.
Compensation Budgeting. Our compensation budgeting application provides compensation andperformance information in one system, providing clients valuable workforce insight to helpmanage and formulate salary budgets and establish merit-based compensation increases.
7

Performance Management. Our performance management application allows employees to setstandardized pay grades and performance goals for positions across an organization. It also helpsstreamline the performance review process with online facilitation of the review process.
Executive Dashboard. Our executive dashboard offers powerful workforce insight for executivesto access information on demand in a variety of report formats. Because we offer an all-in-onesolution in a single database, the comprehensive report data provides the workforce intelligenceneeded to drive human capital decisions at an executive level.
Paycom Learning. Our learning management application formalizes and standardizes our clients’training processes. Employers can create customized content utilizing videos, presentations,quizzes and surveys. It provides employees with “anytime, anywhere” access to a centralknowledge base where the employee can access content, share expertise and measure his or herprofessional development progress. Our clients can track the activity and success of their trainingprograms with pre-defined reports and an analytics dashboard.
HR Management
Document and Task Management. Our document and task management application is designed tomanage employee files and allows employees to digitally sign and view company documents. Wesecurely store client records to meet retention requirements and protect documents fromunauthorized access and other disasters that can threaten businesses. In addition, clients can assignchecklists to employees for the completion of certain tasks associated with processes such ason-boarding and off-boarding.
Government and Compliance. Our government and compliance application helps clients reduceexposure to violations, audits and penalties with respect to the employment laws impacting theirbusiness, such as the Family Medical Leave Act, Equal Employment Opportunity Commissionand other state and federal regulations. A single database keeps our clients’ employee dataconsistent and enhances reporting capabilities by providing better accuracy and real-time insight.
Benefits Administration/Benefits to Carrier. Our benefits administration application allows clientsto customize benefit plan setup, deduction amounts, enrollment dates and new-hire waitingperiods. Employers are provided census and reconciliation reports to ensure they do not overpayfor benefits. Employers can also update deduction amounts for all employees or groups ofemployees at once and automatically updates all insurance carriers for any changes. Thisapplication also provides employees with online enrollment and helps educate them and driveinformed enrollment decisions for greater employee satisfaction.
COBRA Administration. Our COBRA administration application protects employers fromCOBRA violations and the associated fines and penalties by automatically initiating compliancemeasures upon entry of qualifying events into the application. This application also tracksimportant dates, collects and remits premiums and reports on all COBRA activity.
Personnel Action Forms. Our personnel action forms application helps our clients reduce theamount of time and paperwork required with employee changes such as pay rate, position and titlechanges by allowing managers to complete and approve online personnel action forms.
Surveys. Our surveys application allows clients to create employee surveys to help identify andresolve workplace matters that otherwise may remain undisclosed. Clients can analyze results bythe demographics of the workforce and compare how results change over time.
8

Enhanced ACA. Our Affordable Care Act (“ACA”) application provides clients with access to adashboard that tracks employee count, employee status, health care plan affordability and ACAperiods all from one convenient location and enables Paycom to file IRS Forms 1094/1095-B or –C. Clients utilizing this application also have access to additional real-time compliance reports andalerts.
Our Clients
We serve a diverse client base in terms of size and industry. We have over 17,800 clients, or approximately10,000 clients based on parent company grouping, none of which constituted more than one-half of one percentof our revenues for the year ended December 31, 2016. We stored data for more than 2.7 million personsemployed by our clients during the year ended December 31, 2016.
Many small to mid-sized companies can typically make the decision to adopt our solution more quickly thanlarger companies, which we believe results in a shorter sales cycle and more closely corresponds to our targetsales cycle of 30 to 90 days. As a result of the nature and size of our clientele, we maintain a diversified clientbase and very low revenue concentration among our clients. We believe, however, that larger employersrepresent a substantial opportunity to increase the number of clients and to increase our revenues per client withlimited incremental cost. As we attract clients at the higher end of our target client size range, we may facelonger sales cycles and less predictability in completing some of our sales.
Competition
The market for HCM solutions is rapidly evolving, highly competitive and subject to changing technology,shifting client needs and frequent introduction of new products and services. Our competitors range from small,regional firms to large, well-established international firms with multiple product offerings.
We compete with firms that provide HCM solutions by various means. Many providers continue to deliverlegacy enterprise software, but as demand for greater flexibility and access to information grows, we believethere will be increased competition in the delivery of HCM cloud-based solutions by other SaaS providers. Ourcompetitors offer HCM solutions that may overlap with one, several or all categories of applications offered byour solution. Our talent acquisition and talent management applications compete primarily with CornerstoneOnDemand, Inc., Oracle Corporation, SAP SE and Workday, Inc. Our payroll applications, including payrollprocessing, compete primarily with Automatic Data Processing, Inc. (“ADP”), Ceridian HCM, Inc. (“Ceridian”),Concur Technologies, Inc., Intuit Inc., Paychex, Inc., Paylocity Holding Corporation and The Ultimate SoftwareGroup, Inc. Our HR management applications compete primarily with ADP, Ceridian, Oracle Corporation,Paychex, Inc., Paylocity Holding Corporation, SAP SE, and Workday, Inc. Our time and labor managementapplications compete primarily with ADP, Ceridian, Kronos Incorporated, Paylocity Holding Corporation andThe Ultimate Software Group, Inc. Our larger competitors compete with us across multiple segments. Inaddition, our HCM solution continues to face competition from in-house payroll and HR systems anddepartments as well as HR systems and software sold by third-party vendors.
Competition in the HCM solutions market is primarily based on service responsiveness, product quality andreputation, breadth of service and application offering and price. The importance of these factors depends on thesize of the business. Price tends to be the most important factor of competition for smaller businesses with feweremployees, while the scope of features and customization is more important to larger businesses. Regardless of acompany’s size, another important factor is the implementation experience, as all organizations are seeking astreamlined and simplified on-boarding process. We believe that our SaaS delivery model allows us to be mostcompetitive in the HCM solutions market across this spectrum.
9

Sales and Marketing
We sell our solution exclusively through our captive sales force, substantially all of whom have a four-yearcollege degree. We typically recruit sales candidates who have sales experience in non-HCM industries or, withrespect to candidates recruited directly from colleges and universities, who have demonstrated an aptitude forsales. Our sales force is comprised of inside sales and field sales personnel, who are organized geographically,and client relations representatives (“CRRs”), who sell additional applications to existing clients. We have 42sales teams located in 24 states and plan to open additional sales offices to further expand our presence in theU.S. market.
We provide our sales force with an intensive six-week training course that includes at least one week oftraining at our headquarters in Oklahoma City. Our unique training program includes instruction in accounting,business metrics, application features and tax matters relevant to our target market and we believe it fostersloyalty and helps maintain our corporate culture. Our training continues for our sales force through weeklyin-office strategy sessions and leadership development training. Executive sales representatives are also requiredto attend in-person quarterly conferences to share best practices and receive legal and business updates.
When a new client processes payroll with us for an entire month, or an existing client purchases and thenutilizes a new application for one month, our sales representative or CRR receives a one-time commission basedupon an estimate of future annual revenues from such client. Executive sales representatives receive a highercommission rate and base salary based upon both current year and life-to-date realized sales, respectively.
We generate client leads, accelerate sales opportunities and build brand awareness through our marketingprograms that target senior finance and HR executives, technology professionals and senior business leaders ofcompanies that perform HCM functions in-house or outsource these functions to one of our competitors. Ourmarketing programs include:
• Direct mail campaigns, email campaigns, social and digital media, personalized URLs, industry-specific print advertising and tradeshow exhibiting;
• Search engine marketing methods that include site optimization and pay-per-click searches; and
• Webinars, white papers and infographics.
In addition to managing client relationships, our CRRs are focused on expanding the number of applicationsour clients purchase from us by introducing them to additional applications. Our CRRs call upon select clientsperiodically and are paid a non-recurring commission on any additional sales they generate.
Technology, Operations and Security
Technology
Our multi-tenant architecture enables us to deliver our solution across our client base with a single instanceof our solution, while securely partitioning access to our clients’ respective application data. Because a singleversion of our solution is developed, supported and deployed across all of our clients, updates are delivered to allof our clients at the same time, making it easier to scale our solution as our number of clients and their respectiveemployee headcounts increase.
We maintain diverse load-balanced Internet lines serviced by multiple networks to provide our clientscontinuous access to our solution and their stored data. We back up our client data at regular intervals utilizinglive replication, snapshots and cold archive methods of backup and manually monitor backup success and failureregularly. Our server cluster and database servers have redundant “hot swappable” disks to ensure continuousservice in the event of a disk failure.
10
Operations
We physically host our solution for our clients in two secure data center facilities located in Oklahoma andTexas. All of our critical systems are fully redundant and backed-up in real-time to these facilities. Physicalsecurity includes ID-oriented access control, alarm systems and manned 24-hour-a-day camera monitoring by oursecurity guards. Server facilities also have environmental monitoring and extensive environmental controls suchas heat and fire protection, moisture, temperature, and humidity sensors, backup power supply and exteriorreinforced concrete walls.
Security
We maintain a formal and comprehensive security program designed to ensure the confidentiality, integrityand availability of our clients’ data. During the regular course of business, we receive client data through ouronline system that we in turn process, record and store following ISO/IEC 270001:2013 certified controls andprocedures. All communications with our servers that might contain sensitive information are encrypted beforethey leave the network and our servers are configured to only allow high-grade encryption algorithms.
We strictly regulate and limit all access to servers and networks at each of our facilities. Local networkaccess is restricted by our authenticated server, using access control lists and remote network access is restrictedby a firewall, which provides no accessible route from external networks to systems within our local network.We also employ network and host intrusion detection and prevention sensors throughout our infrastructure,systems that monitor and alert on insecure installations of third-party applications, a full system for managingand installing patches for those applications and highly restricted access to the Internet for anyone who hasaccess to client data. Our information security department regularly performs penetration testing and we retain athird-party penetration testing company to conduct penetration tests and periodic audits to identify and remediateany issues.
Our applications are secured using multiple libraries and secure coding practices. Our IT infrastructure issecured and monitored using a number of best practices and tools at multiple layers of the physical and logicalnetwork. This security is also continually monitored by our information security department. All of ouroperations employees work in either our Oklahoma or Texas locations and, with the exception of certain ITpersonnel, are not permitted to work remotely.
Software Development
Our application development team works closely with our clients to enhance our existing applicationofferings and develop new applications. This process is led by experienced product managers who oversee theevolution of their respective applications within a focused timeframe of innovation and cultivation in order todeliver the well-developed applications and enhancements desired by our clients. Our product managers, many ofwhom are former HR executives or members from the competitive landscape, are proactive in their approach toassigning development requests based on research, trends and user feedback. A key element of our developmentprocess is the one-on-one personal interaction between clients and our CRRs, through whom our clientspersonally suggest new applications and features.
We develop our solution from the “ground up” with our internal development and engineering teams. Ourdevelopment and engineering teams and our employees conceive new applications and enhancements, reviewrequests, schedule development in order of priority and subsequently develop the applications or enhancements.Our new applications and enhancements are independently reviewed by the quality assurance team, inaccordance with our software development process, before being fully implemented. Any enhancements to ourapplications are released on a monthly scheduled release date to coordinate the communication and release to ourclients.
11

Capitalized software development expenses, which include compensation for employees directly associatedwith development projects, were $8.8 million, $4.3 million and $2.2 million for the years ended December 31,2016, 2015 and 2014, respectively.
Client Service
We are committed to providing industry-leading, client-centered service. For this reason, we assign eachclient a specialist within a dedicated team. This one-on-one service is a key part of our client service model andhelps to ensure that we are delivering an industry-leading solution and maintaining high client satisfaction. Theprimary elements of our client service model include the following:
Streamlined Setup and On-Boarding
After electing to deploy our solution, a new client begins our on-boarding process with assistance from ateam of new client setup specialists and the sales professional responsible for obtaining the client’s business. Inaddition, we also have a team of transition specialists whose job it is to ensure that the process is performedsmoothly, data is collected properly and all relevant employees are fully trained on the system. This team worksclosely with the client until the client is capable of managing our solution independently, at which timeresponsibility for the client relationship is transferred to our dedicated CRRs. Unlike certain of our competitors,we do not outsource any of our on-boarding efforts.
Dedicated Service Specialists
After completing the on-boarding process, each client is assigned to a services specialist within a dedicatedteam. Clients can then contact their dedicated services specialist or a team member if any issues or questionsarise. These specialists provide personalized service with actual knowledge of the clients’ business needs. Whenappropriate, client questions can be elevated to the specialists with the appropriate application, regulatory or taxexpertise. In addition, our CRRs proactively contact our clients to ensure satisfaction with our solution andintroduce additional applications.
Expert Level Service
Our client specialists are trained across all of our applications to ensure that they can providecomprehensive, expert-level service. Our client service is ISO 9001:2008 certified and helps support a high clientretention rate.
Regulatory and Certifications
We are subject to varying degrees of regulations in each of the jurisdictions in which we provide services.Local laws and regulations, and their interpretation and enforcement, differ significantly among thosejurisdictions. These regulations and laws cover, among others, information disclosure.
Personal privacy has become a significant issue in the United States and in other countries. The regulatoryframework for privacy issues worldwide is rapidly evolving and is likely to remain uncertain for the foreseeablefuture. Many federal, state and foreign government bodies and agencies have adopted or are considering adoptinglaws and regulations affecting or regarding the collection, use and disclosure of personal information. In theUnited States, these include, for example, rules and regulations promulgated under the authority of the FederalTrade Commission, the Health Insurance Portability and Accountability Act of 1996, the Family Medical LeaveAct of 1993, the ACA and state breach notification laws.
We voluntarily obtain third-party security examinations relating to security and data privacy in accordancewith Statement on Standards for Attestation Engagements (“SSAE”), No. 16, Reporting on Controls at a Service
12

Organization. Our SSAE examination is conducted every six months by one of the four largest independentinternational auditing firms, and addresses, among other areas, our physical and environmental safeguards forproduction data centers, data availability and integrity procedures, change management procedures and logicalsecurity procedures.
In October 2016, we renewed a certification based on ISO/IEC 27001:2013 criteria, a security standard forInformation Security Management Systems published by ISO covering our production, quality assurance andimplementation environments. This independent assessment of our conformity to the ISO 27001 standardincludes assessing security risks, designing and implementing comprehensive security controls and adopting aninformation security management process to meet security needs on an ongoing basis. The certification is validuntil December 2019, with continuing assessments taking place annually.
In March 2014, we renewed a certification based on ISO 9001:2008 criteria, a standard for theimplementation of quality management processes published by ISO, covering our activities required to create anddeliver our solution. This independent assessment of our conformity to the ISO 9001 standard includes assessingthe design and implementation of quality objectives to meet delivery standards on an ongoing basis. Thecertification is valid until April 2017, with continuing assessments taking place annually.
Intellectual Property
We rely on a combination of copyrights, trademarks, service marks, trade secret laws and contractualrestrictions to establish and protect our intellectual property rights. We also have a number of registered andunregistered trademarks and will continue to evaluate the registration of additional trademarks as appropriate.We do not have any patents or patent applications pending.
Seasonality
Our revenues are seasonal in nature. Recurring revenues include revenues relating to the annual processingof payroll forms, such as Form W-2 and Form 1099, and revenues from processing unscheduled payroll runs(such as bonuses) for our clients. Because payroll forms are typically processed in the first quarter of the year,first quarter revenues and margins are generally higher than in subsequent quarters. Further, we generatedadditional revenues in the first quarter of 2016 because, as a result of the enactment of the ACA, many clientswere required to file Forms 1094 and 1095 prior to March 31, 2016. We anticipate that our revenues willcontinue to exhibit this seasonal pattern for so long as the ACA (or replacement legislation) includes employerreporting requirements. In addition, we often experience increased revenues during the fourth quarter due tounscheduled payroll runs for our clients that occur before the end of the year. Therefore, we expect theseasonality of our revenue cycle to decrease to the extent clients utilize more of our non-payroll applications.
Employees
Our ability to recruit and retain qualified employees is critical to our continued success. We invest heavilyin our training and leadership development programs to encourage the development and promotion of ouremployees. As of December 31, 2016, we employed 2,075 people. None of our employees were covered bycollective bargaining agreements.
Facilities
Our corporate headquarters is an approximately 250,000-square-foot campus located on over 30 acres ofCompany-owned property in Oklahoma City, Oklahoma. In addition to housing a fully redundant data center atour corporate headquarters, we operate another fully redundant data center at a leased property near Dallas,Texas. We also lease a disaster recovery site in downtown Oklahoma City.
13

We also lease offices in Arizona, California, Colorado, Connecticut, Florida, Georgia, Illinois, Indiana,Maryland, Massachusetts, Michigan, Minnesota, Missouri, New Jersey, New York, North Carolina, Ohio,Oklahoma, Oregon, Pennsylvania, Tennessee, Texas, Virginia and Washington. We believe that these facilitiesare suitable for our current operations and upon the expiration of the terms of the leases we believe we couldrenew these leases or find suitable space elsewhere on acceptable terms.
Segment Information
We operate in a single operating segment and a single reporting segment. Operating segments are defined ascomponents of an enterprise about which separate financial information is regularly evaluated by the chiefoperating decision maker function (which is fulfilled by our chief executive officer) in deciding how to allocateresources and in assessing performance. Our chief executive officer allocates resources and assesses performancebased upon financial information at the consolidated level. Since we operate in one operating segment, allrequired financial segment information is presented in the consolidated financial statements.
Available Information
Our Internet address is www.paycom.com and our investor relations website is located atinvestors.paycom.com. Our Annual Reports on Form 10-K, Quarterly Reports on Form 10-Q, Current Reports onForm 8-K and amendments to those reports can be found on our Investor Relations website, free of charge. Thesereports are also electronically filed with (or furnished to) the SEC. Information contained on our website is notincorporated by reference into this Form 10-K. The SEC maintains a public website, www.sec.gov, whichincludes information about and the filings of issuers that file electronically with the SEC.
Additionally, the information that we file with the SEC may be read at the SEC’s Public Reference Room at100 F Street NE, Washington, DC 20549. Information about the SEC’s Public Reference Room may be obtainedby calling the SEC at 1-800-SEC-0330.
Item 1A. Risk Factors
The risk factors noted in this section and other factors noted throughout this Form 10-K, including thoserisks identified in Part II, Item 7, “Management’s Discussion and Analysis of Financial Condition and Results ofOperations,” describe examples of risks, uncertainties and events that may cause our actual results to differmaterially from those contained in any forward-looking statement. If one or more of these risks or uncertaintiesmaterialize, or if underlying assumptions prove incorrect, actual outcomes may vary materially from thoseincluded in this Form 10-K.
Risks Related to Our Business and Industry
Our business depends substantially on our clients’ continued use of our applications, their purchases ofadditional applications from us and our ability to add new clients. Any decline in our clients’ continued use ofour applications or purchases of additional applications could adversely affect our business, operating resultsor financial condition.
In order for us to maintain or improve our operating results, it is important that our current clients continueto use our applications and purchase additional applications from us, and that we add new clients. Our clientshave no obligation to continue to use our applications, and may choose not to continue to use our applications atthe same or higher level of service, if at all. In the past, some of our clients have elected not to continue to useour applications. Moreover, our clients generally have the right to cancel their agreements with us for any or noreason by providing 30 days’ prior written notice.
Our client retention rates may fluctuate as a result of a number of factors, including the level of clientsatisfaction with our applications, pricing, the prices of competing products or services, mergers and acquisitions
14

affecting our client base, reduced hiring by our clients or reductions in our clients’ spending levels. If our clientsdo not continue to use our applications, renew on less favorable terms or fail to purchase additional applications,or if we fail to add new clients, our revenues may decline and our business, operating results or financialcondition could be adversely affected.
If our security measures are breached, or unauthorized access to our clients’ or their employees’ sensitive datais otherwise obtained, our solution may not be perceived as being secure, clients may reduce the use of or stopusing our solution, our ability to attract new clients may be harmed and we may incur significant liabilities.
Our solution involves the collection, storage and transmission of clients’ and their employees’ confidentialand proprietary information, including personal or identifying information, as well as financial and payroll data.HCM software is increasingly being targeted in cyber-attacks, including computer viruses, worms, phishingattacks, malicious software programs and other information security breaches, which could result in theunauthorized release, gathering, monitoring, misuse, loss or destruction of our clients’ sensitive data or otherwisedisrupt our clients’ or other third parties’ business operations. If cybercriminals are able to circumvent oursecurity measures, or if we are unable to detect an intrusion into our systems and contain such intrusion in areasonable amount of time, our clients’ sensitive data may be compromised.
Certain of our employees have access to sensitive information about our clients’ employees. While weconduct background checks of our employees and limit access to systems and data, it is possible that one or moreof these individuals may circumvent these controls, resulting in a security breach.
Although we have security measures in place to protect client information and prevent data loss and othersecurity breaches, these measures could be breached as a result of third-party action, employee error,malfeasance or otherwise. Because the techniques used to obtain unauthorized access or to sabotage systemschange frequently, we may not be able to anticipate these techniques and implement adequate preventative orprotective measures. While we currently maintain a cyber liability insurance policy, cyber liability insurance maybe inadequate or may not be available in the future on acceptable terms, or at all. In addition, our cyber liabilityinsurance policy may not cover all claims made against us, and defending a suit, regardless of its merit, could becostly and divert management’s attention.
Any actual or perceived breach of our security could damage our reputation, cause existing clients todiscontinue the use of our solution, prevent us from attracting new clients, or subject us to third-party lawsuits,regulatory fines or other actions or liabilities, which could adversely affect our business, operating results orfinancial condition.
Any interruption or failure of our data centers could impair our ability to effectively provide our solution andadversely affect our business.
We serve all of our clients from our two data centers located in Oklahoma and Texas. These locations arevulnerable to damage or interruption from severe weather, tornados, terrorist attacks, earthquakes, floods, fires,power loss, telecommunications failures, computer viruses or cyber-attacks. They are also subject to break-ins,sabotage, intentional acts of vandalism and other misconduct. Our solution depends on the continuing operationof our data centers and any damage to or failure of our data centers could result in interruptions in our services.Any interruption in our service, including adverse changes in service levels at our data centers, could damage ourreputation and, consequently, our ability to attract new clients, cause our clients to terminate their use of oursolution and prevent us from gaining new or additional business from current clients, which could have anadverse effect on our business, operating results or financial condition.
The market in which we participate is highly competitive, and if we do not compete effectively, our business,operating results or financial condition could be adversely affected.
The market for HCM software is highly competitive, rapidly evolving and fragmented. We expectcompetition to intensify in the future with the introduction of new technologies and market entrants. Many of our
15

current and potential competitors are larger and have greater brand name recognition, longer operating histories,more established relationships in the industry and significantly greater financial, technical and marketingresources than we do. As a result, some of these competitors may be able to:
• adapt more rapidly to new or emerging technologies and changes in client requirements;
• develop superior products or services, gain greater market acceptance and expand their product andservice offerings more efficiently or rapidly;
• bundle products and services that we may not offer or in a manner that provides our competitors with aprice advantage;
• take advantage of acquisition and other opportunities for expansion more readily;
• maintain a lower cost basis;
• adopt more aggressive pricing policies and devote greater resources to the promotion, marketing andsales of their products and services; and
• devote greater resources to the research and development of their products and services.
Some of our principal competitors offer their products or services at a lower price, which has resulted inpricing pressures. Similarly, some competitors offer different billing terms, which has resulted in pressures onour billing terms. If we are unable to maintain our pricing levels and our billing terms, our operating resultswould be negatively impacted. In addition, pricing pressures and increased competition generally could result inreduced sales, reduced margins, losses or the failure of our solution to maintain widespread market acceptance,any of which could adversely affect our business, operating results or financial condition.
We compete with firms that provide HCM solutions by various means. Many providers continue to deliverlegacy enterprise software, but as demand for greater flexibility and access to information grows, we believethere will be increased competition in the delivery of HCM cloud-based solutions by other SaaS providers. Ourcompetitors offer HCM solutions that overlap with one, several or all categories of applications that we offer.Our talent acquisition and talent management applications compete primarily with Cornerstone OnDemand, Inc.,Oracle Corporation, SAP SE and Workday, Inc. Our payroll applications, including payroll processing, competeprimarily with ADP, Ceridian, Concur Technologies, Inc., Intuit Inc., Paychex, Inc., Paylocity HoldingCorporation and The Ultimate Software Group, Inc. Our HR management applications compete primarily withADP, Ceridian, Oracle Corporation, Paychex, Inc., Paylocity Holding Corporation, SAP SE, and Workday, Inc.Our time and labor management applications compete primarily with ADP, Ceridian, Kronos Incorporated,Paylocity Holding Corporation and The Ultimate Software Group, Inc. Most of our larger competitors competewith us across multiple application categories. In addition, our HCM solution continues to face competition fromin-house payroll and HR systems and departments as well as HR systems and software sold by third-partyvendors.
Competition in the HCM solutions market is primarily based on service responsiveness, application qualityand reputation, breadth of service and product offering and price. Many of our competitors have establishedmarketing relationships, access to larger client bases and major distribution agreements with consultants,software vendors and distributors. In addition, some competitors may offer software that addresses one or alimited number of HCM functions at a lower price point or with greater depth than our solution. Further, somepotential clients, particularly large enterprises, may elect to develop their own internal solutions. If we are unableto compete effectively, our business, operating results or financial condition could be adversely affected.
We have historically derived a majority of our revenues from payroll processing and our efforts to increase theuse of our other HCM applications may not be successful and may reduce our revenue growth rate.
To date, we have derived a majority of our revenues from payroll processing. Compared to payrollprocessing, our participation in certain other HCM applications markets is relatively new, and it is uncertain
16

whether our revenues from other HCM applications will continue to grow. The uncertainty regarding theadoption of any new applications beyond our existing applications may make it difficult to evaluate our business.Our HCM solution may not achieve and sustain the high level of market acceptance that is critical for thecontinued success of our business. The failure to increase the use of our HCM applications and any newapplications developed by us may reduce our revenue growth rate, which could adversely affect our business,operating results or financial condition.
Any significant disruption in our SaaS network infrastructure could harm our reputation and expose us tosignificant costs.
Our SaaS network infrastructure is a critical part of our business operations. Our clients access our solutionthrough standard web browsers, smart phones, tablets and other web-enabled devices, and depend on us for fastand reliable access to our solution. In the future, we may experience disruptions in our computing andcommunications infrastructure. Factors that may cause such disruptions include:
• human error;
• security breaches;
• telecommunications failures or outages from third-party providers;
• computer viruses or cyber-attacks;
• acts of terrorism, sabotage or other intentional acts of vandalism;
• unforeseen interruption or damages;
• tornados, fires, earthquakes, floods and other natural disasters; and
• power loss.
If our SaaS network infrastructure or our clients’ ability to access our solution is interrupted, client andemployee data from recent transactions may be permanently lost and we could be exposed to significant claimsby clients, particularly if the access interruption is associated with problems in the timely delivery of funds due toemployees. Any significant instances of system downtime could negatively affect our reputation and ability toretain clients and sell our solution, which would adversely impact our revenues.
We have also experienced significant growth in the number of clients and transactions and the amount ofclient and employee data that our network infrastructure supports. We seek to maintain sufficient excess capacityin our network infrastructure to meet the needs of all of our clients and their employees and to facilitate the rapidprovision of new client deployments and the expansion of existing client deployments. Any errors, defects,disruptions or other performance problems with our network infrastructure could adversely affect our reputationand may result in lengthy interruptions in the availability of our solution. Any interruptions in the availability ofour solution might reduce our revenues, cause us to issue refunds to clients or adversely affect our retention ofexisting clients, which could have a negative impact on our business or financial condition.
If our solution fails to perform properly, our reputation could be adversely affected and our market sharecould decline.
Our solution is inherently complex and may in the future contain, or develop, undetected defects or errors.Any defects in our applications could adversely affect our reputation, impair our ability to sell our applications inthe future and result in significant costs to us. The costs incurred in correcting any application defects may besubstantial and could adversely affect our business, operating results or financial condition. Any defects infunctionality or that cause interruptions in the availability of our applications could result in:
• loss or delayed market acceptance and sales of our applications;
• termination of service agreements or loss of clients;
17

• credits or refunds to clients, including reimbursements for any fees or penalties assessed by regulatoryagencies;
• breach of contract, breach of warranty or indemnification claims against us, which may result inlitigation;
• diversion of development and service resources; and
• injury to our reputation.
Because of the large amount of data that we collect and manage, it is possible that hardware failures orerrors in our systems could result in data loss or corruption, or cause the information that we collect to beincomplete or contain inaccuracies that our clients regard as significant. Our clients might assert claims againstus in the future alleging that they suffered damages due to a defect, error, or other failure of our solution. Ourerrors and omissions insurance may be inadequate or may not be available in the future on acceptable terms, or atall. In addition, our policy may not cover all claims made against us, and defending a suit, regardless of its merit,could be costly and divert management’s attention. Any failures in the performance of our solution could harmour reputation and our ability to retain existing clients and attract new clients, which would have an adverseimpact on our business, operating results or financial condition.
If we do not effectively expand and train our sales force and our support teams, we may be unable to add newclients and retain existing clients.
We need to continue to expand our sales force and support team members in order to grow our client baseand increase our revenues. To continue to execute our growth strategy, we must also attract and retain qualifiedsales, marketing and operational personnel capable of supporting a larger and more diverse client base.Identifying and recruiting qualified personnel and training them in the use of our applications requires significanttime, expense and attention and it can take a substantial amount of time before our sales representatives andsupport team members are fully-trained and productive. We may be unable to hire or retain sufficient numbers ofqualified individuals in the markets where we currently, or intend in the future to do business, and our recenthires and planned hires may not achieve desired productivity levels in a reasonable period of time or become asproductive as we expect. If our expansion efforts are unsuccessful or do not generate a corresponding increase inrevenues, our business, operating results or financial condition could be adversely affected.
Our business and operations are experiencing rapid growth and organizational change. If we fail to managesuch growth and change effectively, we may be unable to execute our business plan, maintain high levels ofservice or adequately address competitive challenges.
We have experienced, and may continue to experience, rapid growth in our headcount and operations, whichhas placed, and may continue to place, significant demands on our management, operational and financialresources. For example, our headcount has grown from 523 employees as of December 31, 2011 to 2,075employees as of December 31, 2016, and we have expanded from 20 sales teams as of December 31, 2011 to 42sales teams as of January 31, 2017. We have also experienced significant growth in the number of clients andtransactions and the amount of client and employee data that our infrastructure supports. Finally, ourorganizational structure and recording systems and procedures are becoming more complex as we improve ouroperational, financial and management controls. Our success will depend, in part, on our ability to manage thisgrowth and organizational change effectively. To manage the expected growth of our headcount and operations,we will need to continue to improve our operational, financial and management controls and our reportingsystems and procedures. Our ability to add additional offices may be constrained by the willingness andavailability of qualified personnel to staff and manage any new offices. The failure to effectively manage growthcould result in difficulties or delays in obtaining clients, selling additional applications to our clients, declines inquality or client satisfaction of our applications, increases in costs, and difficulties in introducing newapplications or other operational difficulties, any of which could adversely affect our business by impairing ourability to retain and attract clients or sell additional applications to our existing clients.
18

If we are not able to develop enhancements and new applications, keep pace with technological developmentsor respond to future disruptive technologies, we might not remain competitive and our business could beadversely affected.
Our continued success will depend on our ability to adapt and innovate. To attract new clients and increaserevenues from existing clients, we need to enhance, add new features to and improve our existing applicationsand introduce new applications. The success of any enhancements or new features and applications depends onseveral factors, including timely completion, introduction and market acceptance. We may expend significanttime and resources developing and pursuing sales of a particular enhancement or application that may not resultin revenues in the anticipated time frame or at all, or may not result in revenue growth sufficient to offsetincreased expenses. Further, changing regulatory requirements may delay the development or introduction ofenhancements or new applications or render certain of our applications obsolete. If we are unable to successfullydevelop enhancements, new features or new applications to meet client needs, our business and operating resultscould be adversely affected.
In addition, because our applications are designed to operate on a variety of network, hardware and softwareplatforms using Internet tools and protocols, we will need to continuously modify and enhance our applicationsto keep pace with changes in Internet-related hardware, software, communication, browser and databasetechnologies. If we are unable to respond in a timely and cost-effective manner to these rapid technologicaldevelopments, our current and future applications may become less marketable and less competitive or evenobsolete.
Our success is also subject to the risk of future disruptive technologies. If new technologies emerge that areable to deliver HCM solutions at lower prices, more efficiently or more conveniently, such technologies couldadversely impact our ability to compete.
The market for our solution among large companies may be limited if these companies demand customizedfeatures and functions that we do not offer.
Prospective clients, especially larger companies, may require customized features and functions unique totheir business processes that we do not offer. In order to ensure we meet these requirements, we may devote asignificant amount of support and services resources to larger prospective clients, increasing the cost and timerequired to complete sales with no guarantee that these prospective clients will adopt our solution. Further, wemay not be successful in implementing any customized features or functions. If prospective clients requirecustomized features or functions that we do not offer, or that would be difficult for them to deploy themselves,the market for our solution will be more limited and our business could be adversely affected.
We may encounter long sales cycles with larger prospective clients, which could adversely affect our operatingresults in a given period.
We believe larger employers represent a substantial opportunity to increase the number of clients we serveand to increase our revenues per client. To further capitalize on this opportunity, we intend to pursue largerbusinesses opportunistically within our target client size range where our current sales model is effective. As wetarget our sales efforts at larger clients, we will face longer sales cycles and less predictability in completingsome of our sales. In the large enterprise market, the clients’ decision to use our applications may be anenterprise-wide decision and, therefore, these types of sales will require us to provide greater levels of educationregarding the use and benefits of our applications. In addition, our target clients may prefer to purchaseapplications that are critical to their business from one of our larger, more established competitors. Our typicalsales cycles are 30 to 90 days and we expect that our average sales cycle may gradually trend towards the higherend of this range as we pursue larger clients. Longer sales cycles could cause our operating and financial resultsto suffer in a given period.
19

Our business, operating results or financial condition could be adversely affected if our clients are notsatisfied with our deployment or technical support services.
Our business depends on our ability to satisfy our clients, both with respect to our applications and thetechnical support provided to help clients use the applications that address the needs of their businesses. We useour in-house deployment personnel to implement and configure our solution and provide support to our clients. Ifa client is not satisfied with the quality of our solution or the applications delivered or the support provided, wecould incur additional costs to address the situation, our profitability might be negatively affected, and theclient’s dissatisfaction with our deployment service could damage our ability to sell additional applications tothat client. In addition, our sales process is highly dependent on the reputation of our solution and applicationsand on positive recommendations from our existing clients. Any failure to maintain high-quality technicalsupport, or a market perception that we do not maintain high-quality technical support, could adversely affect ourreputation, our ability to sell our applications to existing and prospective clients, and, as a result, our business,operating results or financial condition.
We are dependent on the continued service of our key executives and, if we fail to retain such key executives,our business could be adversely affected.
We believe that our success depends in part on the continued services of our senior management team,consisting of Chad Richison, Craig E. Boelte, Jeffrey D. York, William X. Kerber III and Stacey Pezold. Ourbusiness could be adversely affected if we fail to retain these key executives. Although the employmentarrangements with each of our key executives contain non-competition restrictions, our business couldnonetheless be adversely affected if a key executive leaves Paycom and attempts to compete with us. In addition,we have not purchased key person life insurance on any members of our senior management team.
If we are unable to attract and retain qualified personnel, including software developers and skilled ITspecialists, our ability to develop new products and, in turn, increase our revenue and profitability could beadversely affected.
Because our future success is dependent on our ability to continue to enhance and introduce newapplications, we are heavily dependent on our ability to attract and retain qualified software developers and ITpersonnel with the requisite education, background and industry experience. The software industry ischaracterized by a high level of employee mobility and aggressive recruiting among competitors. Thiscompetition for qualified personnel may be amplified by new immigration laws or policies that could limitsoftware companies’ ability to recruit internationally. Although such changes in immigration laws or policieswould not have a significant direct impact on our workforce, the ensuing increase in demand for softwaredevelopers and IT personnel could impair our ability to attract or retain skilled employees and/or significantlyincrease our costs to do so. Further, the loss of the services of a significant number of our developers could bedisruptive to our development efforts, which may adversely affect our business by causing us to lose clients,increase operating expenses or divert management’s attention to recruit replacements for the departed employees.
Our financial results may fluctuate due to many factors, some of which may be beyond our control.
Our results of operations, including the levels of our revenues, costs of revenues, administrative expenses,operating income, cash flow and deferred revenue, may vary significantly in the future and the results of any oneperiod should not be relied upon as an indication of future performance. Fluctuations in our financial results maynegatively impact the value of our common stock. Our financial results may fluctuate as a result of a variety offactors, many of which are outside of our control, and as a result, may not fully reflect the underlyingperformance of our business. Factors that may cause our financial results to fluctuate from period to periodinclude, without limitation:
• our ability to attract new clients or sell additional applications to our existing clients;
• the number of new clients and their employees, as compared to the number of existing clients and theiremployees in a particular period;
20

• the mix of clients between small, mid-sized and large organizations;
• the extent to which we retain existing clients and the expansion or contraction of our relationships withthem;
• the mix of applications sold during a period;
• changes in our pricing policies or those of our competitors;
• seasonal factors affecting payroll processing, demand for our applications or potential clients’purchasing decisions;
• the amount and timing of operating expenses, including those related to the maintenance and expansionof our business, operations and infrastructure;
• the timing and success of new applications introduced by us and the timing of expenses related to thedevelopment of new applications and technologies;
• the timing and success of current and new competitive products and services by our competitors;
• economic conditions affecting our clients, including their ability to outsource HCM solutions and hireemployees;
• other changes in the competitive dynamics of our industry, including consolidation among competitorsor clients;
• our ability to manage our existing business and future growth, including expenses related to our datacenters and the expansion of such data centers and the addition of new offices;
• the effects and expenses of acquisition of third-party technologies or businesses and any potentialfuture charges for impairment of goodwill resulting from those acquisitions;
• network outages or security breaches; and
• general economic, industry and market conditions.
Certain of our operating results and financial metrics may be difficult to predict as a result of seasonality.
We have historically experienced seasonality in our revenues because a significant portion of our recurringrevenues relate to the annual processing of payroll forms such as Form W-2 and Form 1099 and, beginning in2016, the annual processing and filing of ACA-related forms. Because these forms are typically processed in thefirst quarter of the year, first quarter revenues are generally higher than subsequent quarters. In addition,unscheduled payroll runs at the end of the year (such as bonuses) often result in increased revenues in the fourthquarter. We expect this seasonality to continue in the future, although the repeal or modification of the ACAcould have an impact on the seasonality of our revenues. Nonetheless, the seasonal fluctuations in certain of ouroperating results and financial metrics may make such results and metrics difficult to predict.
If we fail to adequately protect our proprietary rights, our competitive advantage could be impaired and wemay lose valuable assets, generate reduced revenues or incur costly litigation to protect our rights.
Our success is dependent in part upon our intellectual property. We rely on a combination of copyrights,trademarks, service marks, trade secret laws and contractual restrictions to establish and to protect our intellectualproperty rights. However, the steps we take to protect our intellectual property may be inadequate. We will not be ableto protect our intellectual property if we are unable to enforce our rights or if we do not detect unauthorized use of ourintellectual property. Despite our precautions, it may be possible for unauthorized third parties to copy our applicationsand use information that we regard as proprietary to create products or services that compete with ours.
We may be required to spend significant resources to monitor and protect our intellectual property. We havebeen involved in litigation in the past and litigation may be necessary in the future to protect and enforce ourintellectual property rights and to protect our trade secrets. Such litigation could be costly, time-consuming anddistracting to management and could result in the impairment or loss of portions of our intellectual property.
21
Furthermore, our efforts to enforce our intellectual property rights may be met with defenses, counterclaims andcountersuits attacking the validity and enforceability of our intellectual property rights. We may not be able tosecure, protect and enforce our intellectual property rights or control access to, and the distribution of, oursolution and proprietary information, which could affect our business.
If the SaaS market develops more slowly than we expect or declines, our growth may slow or stall, and ourbusiness could be adversely affected.
The SaaS market is not as mature as the market for on premise enterprise software, and it is uncertainwhether SaaS will achieve and sustain high levels of demand and market acceptance. Our success depends notonly on strong demand for HCM services in general, but also to a substantial extent on the widespread adoptionof SaaS. Many companies have invested substantial personnel and financial resources to integrate traditionalenterprise software into their businesses, and therefore may be reluctant or unwilling to migrate to SaaS. It isdifficult to predict client adoption rates and demand for our solution, the future growth rate and size of the SaaSmarket or the entry of competitive products. The expansion of the SaaS market depends on a number of factors,including the cost, performance and perceived value associated with SaaS, as well as the ability of SaaSproviders to address security and privacy concerns. If other SaaS providers experience security incidents, loss ofclient data, disruptions in delivery or other problems, the market for SaaS applications as a whole, including oursolution, may be negatively affected. If there is a reduction in demand for SaaS caused by a lack of clientacceptance, technological challenges, weakening economic conditions, security or privacy concerns, competingtechnologies and products, decreases in corporate spending or otherwise, our growth may slow or stall, and ourbusiness could be adversely affected.
We may be sued by third parties for alleged infringement of their proprietary rights.
Considerable intellectual property development activity exists in our industry, and we expect that softwaredevelopers will increasingly be subject to infringement claims as the number of applications and competitorsgrows and the functionality of applications in different industry segments overlaps. Our competitors, as well as anumber of other entities and individuals, may own or claim to own intellectual property in technology areasrelating to our solution or applications. In addition, we may increasingly be subject to trademark infringementclaims as our presence grows in the marketplace. From time to time, third parties have asserted and may in thefuture assert that we are infringing on their intellectual property rights, and we may be found to be infringingupon such rights. A claim of infringement may also be made relating to technology that we acquire or licensefrom third parties. However, we may be unaware of the intellectual property rights of others that may cover, ormay be alleged to cover, some or all of our solution, applications or brands.
The outcome of litigation is inherently unpredictable and, as a result, any future litigation or claim ofinfringement could (i) cause us to enter into an unfavorable royalty or license agreement, pay ongoing royaltiesor require that we comply with other unfavorable terms, (ii) require us to discontinue the sale of our solution orapplications, (iii) require us to indemnify our clients or third-party service providers or (iv) require us to expendadditional development resources to redesign our solution or applications. Any of these outcomes could harm ourbusiness. Even if we were to prevail, any litigation regarding our intellectual property could be costly and timeconsuming and divert the attention of our management and key personnel from our business and operations.
We employ third-party licensed software for use in our applications and the inability to maintain these licensesor errors in the software we license could result in increased costs or reduced service levels, which couldadversely affect our business.
Our applications incorporate certain third-party software obtained under licenses from other companies. Weanticipate that we will continue to rely on such third-party software and development tools from third parties inthe future. Although we believe that there are commercially reasonable alternatives to the third-party software wecurrently license, this may not always be the case, or it may be difficult or costly to replace. In addition,incorporating the software used in our applications with new third-party software may require significant work
22

and substantial investment of our time and resources. Also, to the extent that our applications depend upon thesuccessful operation of third-party software in conjunction with our software, any undetected errors or defects inthis third-party software could prevent the deployment or impair the functionality of our applications, delay newapplication introductions, result in a failure of our applications and harm our reputation.
The use of open source software in our applications may expose us to additional risks and harm ourintellectual property rights.
Some of our applications use software covered by open source licenses. From time to time, there have beenclaims challenging the ownership of open source software against companies that incorporate such software intotheir products or applications. As a result, we could be subject to suits by parties claiming ownership of what webelieve to be open source software. Litigation could be costly for us to defend, have a negative effect on ouroperating results and financial condition or require us to devote additional development resources to change ourapplications. In addition, if we were to combine our applications with open source software in a certain manner,we could, under certain of the open source licenses, be required to release the source code of our applications. Ifwe inappropriately use open source software, we may be required to redesign our applications, discontinue thesale of our applications or take other remedial actions, which could adversely impact our business, operatingresults or financial condition.
We may not receive significant revenues from our current research and development activities for severalyears, if at all.
Developing SaaS-based applications is expensive and the investment in the development of theseapplications often involves a long-term return on our investment. We have made and expect to continue to makesignificant investments in research and development activities. Accelerated application introductions and shortsoftware life cycles require increased levels of research and development expenditures that could adversely affectour operating results if not offset by increased revenues. We believe that we must continue to dedicate asignificant amount of resources to our research and development activities to maintain our competitive position.We may not receive significant revenues from these investments however, for several years, if at all.
The failure to develop our brand cost-effectively could have an adverse effect on our business.
We believe that developing and maintaining widespread awareness of our brand in a cost-effective manneris critical to achieving the widespread acceptance of our solution and is an important element in attracting newclients and retaining existing clients. Successful promotion of our brand depends largely on the effectiveness ofour marketing efforts and on our ability to provide reliable and useful applications at competitive prices. Brandpromotion activities may not yield increased revenues, and even if they do, any increased revenues may notoffset the expenses incurred in building our brand. If we fail to successfully promote and maintain our brand, orincur substantial expenses in an unsuccessful attempt to promote and maintain our brand, we may fail to attractenough new clients or retain our existing clients to the extent necessary to realize a sufficient return on ourbrand-building efforts, which could have an adverse effect on our business.
Our outstanding indebtedness is subject to certain operating and financial covenants that may restrict ourbusiness and financing activities and may adversely affect our cash flow and our ability to operate ourbusiness.
As of December 31, 2016, our indebtedness consisted of (i) a term note under the 2021 Consolidated Loandue to Kirkpatrick Bank (the “2021 Consolidated Loan”), with an outstanding principal balance of $25.0 million,and (ii) an 84-month term loan from Kirkpatrick Bank (the “2023 Term Loan”), with an outstanding principalbalance of $4.9 million. In August 2016, we also entered into a construction loan with Kirkpatrick Bank, which is
23

available to finance the ongoing construction of a fourth headquarters building and new parking garage (the“2016 Construction Loan”). As of December 31, 2016, we did not have any outstanding borrowings under the2016 Construction Loan. Pursuant to the terms of both the 2021 Consolidated Loan and the 2023 Term Loan, wemay not, subject to certain exceptions:
• create any mortgages or liens;
• make any loans, advances or extensions of credit to certain affiliates or enter into any other transactionwith certain affiliates;
• lease any mortgaged property;
• make any distributions as long as an event of default exists;
• make any material change in methods of accounting;
• enter into any sale and leaseback arrangement;
• amend, modify, restate, cancel or terminate our organizational documents;
• sell, transfer or convey any mortgaged property; or
• incur funded outside debt.
To the extent we borrow under the 2016 Construction Loan, the foregoing covenants will also apply until allsuch amounts are repaid. In addition, under the 2021 Consolidated Loan, the 2023 Term Loan and the 2016Construction Loan (collectively, the “Loan Agreements”), we are required to maintain a fixed charge coverageratio of earnings before interest, taxes, depreciation and amortization (“EBITDA”) to fixed charges (defined ascurrent maturities of long-term debt, interest expense, rent expense and distributions) of greater than 1.2 to 1.0,which is measured on a quarterly basis. The operating and financial covenants in the Loan Agreements, as wellas any future financing agreements that we may enter into, may restrict our ability to finance our operations,engage in business activities or expand or fully pursue our business strategies. We may also be required to use asubstantial portion of our cash flows to pay principal and interest on our debt, which would reduce the amount ofmoney we have for operations, working capital, expansion, or other general corporate purposes.
Our ability to meet our expenses and debt obligations and comply with the operating and financialcovenants may be affected by financial, business, economic, regulatory and other factors beyond our control. Wemay be unable to control many of these factors and comply with these covenants. A breach of any of thecovenants under the Loan Agreements could result in an event of default, which could cause all of theoutstanding indebtedness under the Loan Agreements to become immediately due and payable.
We may acquire other businesses, applications or technologies, which could divert our management’sattention, result in additional dilution to our stockholders and otherwise disrupt our operations and harm ouroperating results.
In the future, we may seek to acquire or invest in businesses, applications or technologies that we believecomplement or expand our applications, enhance our technical capabilities or otherwise offer growthopportunities. The pursuit of potential acquisitions may divert the attention of management and cause us to incurexpenses in identifying, investigating and pursuing suitable acquisitions, whether or not they are ultimatelyconsummated.
We do not have any experience in acquiring other businesses. If we acquire additional businesses, we maynot be able to integrate the acquired personnel, operations and technologies successfully or to effectively managethe combined business following the acquisition. We also may not achieve the anticipated benefits from theacquired business due to a number of factors, including:
• the inability to integrate or benefit from acquired applications or services in a profitable manner;
• unanticipated costs or liabilities associated with the acquisition;
24

• the incurrence of acquisition-related costs;
• difficulty integrating the accounting systems, operations and personnel of the acquired business;
• difficulty and additional expenses associated with supporting legacy products and hostinginfrastructure of the acquired business;
• difficulty converting the clients of the acquired business onto our solution, including disparities in therevenues, licensing, support or services of the acquired company;
• diversion of management’s attention from other business concerns;
• harm to our existing relationships with clients as a result of the acquisition;
• the potential loss of key employees;
• the use of resources that are needed in other parts of our business; and
• the use of substantial portions of our available cash to consummate the acquisition.
In addition, a significant portion of the purchase price of any companies we acquire may be allocated toacquired goodwill and other intangible assets, which must be assessed for impairment at least annually. In thefuture, if our acquisitions do not yield expected returns, we may be required to take charges to our operatingresults based on this impairment assessment process, which could harm our results of operations. Acquisitionscould also result in issuances of equity securities or the incurrence of debt, which would result in dilution to ourstockholders.
Our growth depends in part on the success of our relationships with third parties.
We rely on third-party financial and accounting processing systems, as well as various financial institutions,to perform financial services in connection with our applications, such as providing automated clearing house(“ACH”), and wire transfers as part of our payroll and expense reimbursement services and to providetechnology and content support, manufacture time clocks and process background checks. We anticipate that wewill continue to depend on various third-party relationships in order to grow our business, provide technologyand content support, manufacture time clocks and process background checks. Identifying, negotiating anddocumenting relationships with these third parties and integrating third-party content and technology requiressignificant time and resources. Our agreements with third parties typically are non-exclusive and do not prohibitthem from working with our competitors. In addition, these third parties may not perform as expected under ouragreements, and we may have disagreements or disputes with such third parties, which could negatively affectour brand and reputation. A global economic slowdown could also adversely affect the businesses of our third-party providers, particularly those financial institutions that process transactions through the ACH network, and itis possible that they may not be able to devote the resources we expect to our relationship.
If we are unsuccessful in establishing or maintaining our relationships with these third parties, our ability tocompete in the marketplace or to grow our revenues could be impaired and our business, operating results orfinancial condition could be adversely affected. Even if we are successful, these relationships may not result inimproved operating results.
Adverse economic conditions could affect our business, operating results or financial condition.
Our business depends on the overall demand for HCM applications and on the economic health of ourcurrent and prospective clients. If economic conditions in the United States or in global markets remain uncertainor deteriorate, clients may cease their operations, delay or reduce their spending on HCM and other outsourcingservices or attempt to renegotiate their contracts with us. This could result in reductions in sales of ourapplications, longer sales cycles, slower adoption of new technologies and increased price competition, any ofwhich could adversely affect our business, operating results or financial condition. In addition, HCM spendinglevels may not increase following any recovery.
25

In addition, as part of our payroll and tax filing application, we collect and then remit client funds to taxingauthorities and accounts designated by our clients. During the interval between receipt and disbursement, we mayinvest such funds in money market funds, demand deposit accounts, certificates of deposit and commercial paper.These investments are subject to general market, interest rate, credit and liquidity risks, and such risks may beexacerbated during periods of unusual financial market volatility. Any loss of or inability to access such fundscould have an adverse impact on our cash position and results of operations and could require us to obtainadditional sources of liquidity, which may not be available on reasonable terms, if at all.
If our goodwill or other intangible assets become impaired, we may be required to record a significant chargeto earnings.
We are required to test goodwill for impairment at least annually or earlier if events or changes incircumstances indicate the carrying value may not be recoverable. As of December 31, 2016, we had recorded atotal of $51.9 million of goodwill and $1.9 million of other intangible assets. An adverse change in domestic orglobal market conditions, particularly if such change has the effect of changing one of our critical assumptions orestimates made in connection with the impairment testing of goodwill or intangible assets, could result in achange to the estimation of fair value that could result in an impairment charge to our goodwill or otherintangible assets. Any such material charges may have a negative impact our operating results.
We typically pay employees and may pay taxing authorities amounts due for a payroll period before a client’selectronic funds transfers are finally settled to our account. If client payments are rejected by bankinginstitutions or otherwise fail to clear into our accounts, we may require additional sources of short-termliquidity and our operating results could be adversely affected.
Our payroll processing application moves significant funds from the account of a client to employees andrelevant taxing authorities. For larger funding amounts, we require clients to transfer the funds to us via fed wire.For smaller funding amounts, we debit a client’s account prior to any disbursement on its behalf, and due to ACHbanking regulations, funds previously credited could be reversed under certain circumstances and time framesafter our payment of amounts due to employees and taxing and other regulatory authorities. There is therefore arisk that the employer’s funds will be insufficient to cover the amounts we have already paid on its behalf. Whilesuch shortage and accompanying financial exposure has only occurred in very limited circumstances in the past,should clients default on their payment obligations in the future, we might be required to advance substantialfunds to cover such obligations. In such an event, we may be required to seek additional sources of short-termliquidity, which may not be available on reasonable terms, if at all, and our operating results and our liquiditycould be adversely affected and our banking relationships could be harmed.
Because our long-term success depends, in part, on our ability to expand the sales of our solution to clientslocated outside of the United States, our business will be subject to risks associated with internationaloperations.
An element of our growth strategy is to expand our operations and client base. To date, we have not engagedin any operations outside of the United States. If we decide to expand our operations into international markets, itwill require significant resources and management attention and will subject us to regulatory, economic andpolitical risks that are different from those in the United States. Because of our lack of experience withinternational operations, we cannot ensure that our international expansion efforts will be successful, and theimpact of such expansion efforts may adversely affect our business, operating results or financial condition.
Risks Related to Legislation or Regulation
The modification or repeal of certain provisions of the ACA could have an adverse effect on our business,financial condition and results of operations.
Beginning in 2016, we generate ACA-related revenues (i) on an annual basis in connection with processingand filing Forms 1094 and 1095 on behalf of clients and (ii) from clients who have purchased our Enhanced
26

ACA application as part of the fixed, bundled price charged per billing period. On January 20, 2017, PresidentDonald J. Trump issued an executive order stating that it is the policy of the new administration to seek theprompt repeal of the ACA. Many uncertainties exist regarding the immediate impact of this executive order aswell as when and if the ACA will ultimately be modified or repealed. Nonetheless, the modification or repeal ofcertain provisions of the ACA could harm our business, operating results and financial condition. If the ACA ismodified to eliminate the employer reporting requirements, or if the ACA is repealed and replaced with newlegislation that does not include similar employer reporting requirements, we will no longer generate revenues inconnection with processing and filing Forms 1094 and 1095 on behalf of clients. Further, uncertainty regardingthe potential future modification, repeal or replacement of the ACA could adversely affect our ability to sell ourEnhanced ACA application to new clients. We expect that as of March 1, 2017, we will have collected themajority of our anticipated revenues from processing and filing clients’ ACA-related forms for the 2016 fiscalyear, and estimate that approximately 3% of our projected total revenues for the year ending December 31, 2017would be eliminated if, as a result of a hypothetical repeal or modification of the ACA, we did not collect anyadditional ACA-related revenues after March 1, 2017.
Privacy concerns and laws or other domestic regulations may reduce the effectiveness of our applications.
Our applications require the storage and transmission of proprietary and confidential information of ourclients and their employees, including personal or identifying information, as well as their financial and payrolldata. Our applications are subject to various complex government laws and regulations on the federal, state andlocal levels, including those governing personal privacy, which has become a significant issue in the UnitedStates. The regulatory framework for privacy issues is rapidly evolving and is likely to remain uncertain for theforeseeable future. Many federal, state and foreign government bodies and agencies have adopted or areconsidering adopting laws and regulations regarding the collection, use and disclosure of personal information. Inthe United States, these include rules and regulations promulgated under the authority of the Federal TradeCommission, the Health Insurance Portability and Accountability Act of 1996, the Family Medical Leave Act of1993, the ACA, federal and state labor and employment laws and state data breach notification laws. Failure tocomply with such laws and regulations could result in the imposition of consent orders or civil and criminalpenalties, including fines, which could damage our reputation and have an adverse effect on our results ofoperations or financial condition.
In addition to government regulation, privacy advocates and industry groups may propose new and differentself-regulatory standards. Because the interpretation and application of privacy and data protection laws are stilluncertain, it is possible that these laws may be interpreted and applied in a manner that is inconsistent with ourexisting data management practices or the features of our solution. Any failure to comply with governmentregulations that apply to our applications, including privacy and data protection laws, could subject us to liability.In addition to the possibility of fines, lawsuits and other claims, we could be required to fundamentally changeour business activities and practices or modify our solution, which could have an adverse effect on our business,operating results or financial condition. Any inability to adequately address privacy concerns, even if unfounded,or comply with applicable privacy or data protection laws, regulations and policies, could result in additional costand liability to us, damage our reputation, inhibit sales and adversely affect our business, operating results orfinancial condition.
Furthermore, privacy concerns may cause our clients’ employees to resist providing the personal datanecessary to allow our clients and their employees to use our applications effectively. Even the perception ofprivacy concerns, whether or not valid, may inhibit market adoption of our applications in certain industries. Allof these legislative and regulatory initiatives may adversely affect the ability of our clients to process, handle,store, use and transmit demographic and personal information from their employees, which could reduce demandfor our applications.
27

Changes in laws, government regulations and policies could have a material adverse effect on our businessand results of operations.
Many of our applications are designed to assist our clients in complying with government regulations thatcontinually change. Changes in laws, regulations or policies could affect the extent and type of benefitsemployers are required, or may choose, to provide employees or the amount and type of taxes employers andemployees are required to pay. Such changes could reduce or eliminate the need for certain of our existingapplications, which would result in decreased revenues. Further, we may spend time and money developing newapplications and enhancements that, due to regulatory changes, become unnecessary prior to being released. Theintroduction of new regulatory or licensing requirements, or new interpretations of existing laws or regulations,could also increase our cost of doing business, and changing regulatory requirements may make the introductionof new applications and enhancements more costly or more time-consuming than we currently anticipate, orprevent the introduction of new applications and enhancements by us altogether. In addition, any failure toeducate and assist our clients with respect to new or revised legislation that impacts them could have an adverseeffect on our reputation, and any failure to modify our applications or develop new applications in a timelyfashion in response to regulatory changes could have an adverse effect on our business and results of operations.
Changes in laws and regulations related to the Internet or changes in the Internet infrastructure itself maydiminish the demand for our applications, and could have a negative impact on our business.
The future success of our business depends upon the continued use of the Internet as a primary medium forcommerce, communication and business. Federal, state and foreign government bodies or agencies have in thepast adopted, and may in the future adopt, laws or regulations affecting the use of the Internet as a commercialmedium. Changes in these laws or regulations could require us to modify our applications in order to complywith these changes. In addition, government agencies or private organizations may impose taxes, fees or othercharges for accessing the Internet or commerce conducted via the Internet. These laws or charges could limit thegrowth of Internet-related commerce or communications generally, or result in reductions in the demand forInternet-based applications such as ours.
In addition, the use of the Internet as a means of conducting business could be adversely affected due todelays in the development or adoption of new standards and protocols to handle increased demands of Internetactivity, security, reliability, cost, ease of use, accessibility, and quality of service. The performance of theInternet has been adversely affected by “viruses,” “worms” and similar malicious programs and the Internet hasexperienced a variety of outages and other delays as a result of damage to portions of its infrastructure. If the useof the Internet is adversely affected by these issues, demand for our applications could suffer, which couldadversely affect our business.
If we are unable to maintain effective internal control over financial reporting, investors may lose confidencein the accuracy and completeness of our financial reports and the market price of our common stock may benegatively affected.
As a public company, we are required to maintain internal control over financial reporting to providereasonable assurance regarding the reliability of financial reporting and the preparation of financial statements.Management must evaluate and furnish a report on the effectiveness of our internal control over financialreporting as of the end of each fiscal year, and our auditors must attest to the effectiveness of our internal controlover financial reporting.
If we have a material weakness in our internal control over financial reporting, we may not detect errors ona timely basis and our financial statements may be materially misstated. Compliance with the public companyrequirements has made some activities more time-consuming, costly and complicated. If we identify materialweaknesses in our internal control over financial reporting or if our independent registered public accountingfirm is unable to express an opinion as to the effectiveness of our internal control over financial reporting,
28

investors may lose confidence in the accuracy and completeness of our financial reports and/or we could becomesubject to investigations by the New York Stock Exchange (the “NYSE”), the SEC, or other regulatoryauthorities and the market price of our common stock could be negatively affected.
Adverse tax laws or regulations could be enacted or existing laws could be applied to us or our clients, whichcould increase the costs of our solution and applications and could adversely affect our business, operatingresults or financial condition.
As a vendor of services, we are ordinarily held responsible by taxing authorities for collecting and payingany applicable sales or other similar taxes. Additionally, the application of federal, state and local tax laws toservices provided electronically like ours is evolving. New income, sales, use or other tax laws, statutes, rules,regulations or ordinances could be enacted at any time (possibly with retroactive effect), and could be appliedsolely or disproportionately to services and applications provided over the Internet. These enactments couldadversely affect our sales activity, due to the inherent cost increase the taxes would represent and ultimatelycould adversely affect our business, operating results or financial condition.
Each state has different rules and regulations governing sales and use taxes, and these rules and regulationsare subject to varying interpretations that change over time. We review these rules and regulations periodicallyand, when we believe we are subject to sales and use taxes in a particular state, we may voluntarily engage statetax authorities in order to determine how to comply with that state’s rules and regulations. We cannot ensure thatwe will not be subject to sales and use taxes or related penalties for past sales in states where we currentlybelieve no such taxes are required.
In addition, existing tax laws, statutes, rules, regulations or ordinances could be interpreted, changed,modified or applied adversely to us (possibly with retroactive effect), which could require us or our clients to payadditional tax amounts, as well as require us or our clients to pay fines or penalties and substantial interest forpast amounts. If we are unsuccessful in collecting such taxes from our clients, we could be held liable for suchcosts, thereby adversely affecting our business, operating results or financial condition. Additionally, theimposition of such taxes on us would effectively increase the cost of our software and services we provide toclients and would likely have a negative impact on our ability to retain existing clients or to gain new clients inthe jurisdictions in which such taxes are imposed.
Risks Related to Ownership of our Common Stock
Our actual operating results may differ significantly from our guidance.
From time-to-time, we have released, and may continue to release, guidance in our earnings conferencecalls, earnings releases, or otherwise, regarding our future performance, which represents our estimates as of thedate of release. This guidance, which includes forward-looking statements, has been and will be based onprojections prepared by our management. These projections are not prepared with a view toward compliancewith published guidelines of the American Institute of Certified Public Accountants, and neither our registeredpublic accountants nor any other independent expert or outside party compiles or examines the projections.Accordingly, no such person expresses any opinion or any other form of assurance with respect to theprojections.
Projections are based upon a number of assumptions and estimates that, while presented with numericalspecificity, are inherently subject to significant business, economic, and competitive uncertainties andcontingencies, many of which are beyond our control. Projections are also based upon specific assumptions withrespect to future business decisions, some of which will change. The principal reason that we release guidance isto provide a basis for our management to discuss our business outlook with analysts and investors. We do notaccept any responsibility for any projections or reports published by any third parties.
29

Guidance is necessarily speculative in nature, and it can be expected that some or all of the assumptionsunderlying the guidance furnished by us will vary significantly from actual results. Accordingly, our guidance isonly an estimate of what management believes is realizable as of the date of release. Actual results may varyfrom our guidance and the variations may be material. In light of the foregoing, investors are urged not to relyupon our guidance in making an investment decision regarding our common stock.
Any failure to successfully implement our operating strategy or the occurrence of any of the events orcircumstances set forth in this “Risk Factors” section in this Form 10-K could result in the actual operatingresults being different from our guidance, and the differences may be adverse and material.
The price of our common stock has been and may continue to be volatile or may decline regardless of ouroperating performance, and you may not be able to resell your shares at or above the current market price.
The market price of our common stock has been, and is likely to continue to be, volatile for the foreseeablefuture. If an active trading market for our common stock is not sustained, you may have difficulty selling anyshares of our common stock that you purchased, and the value of such shares may be materially impaired. Themarket price of our common stock may fluctuate significantly in response to numerous factors, many of whichare beyond our control, including:
• our operating performance and the performance of other similar companies;
• the overall performance of the equity markets;
• announcements by us or our competitors of new applications or enhancements, acquisitions, services,strategic alliances, commercial relationships, joint ventures or capital commitments;
• disruptions in our services due to hardware, software or network problems;
• recruitment or departure of key personnel;
• publication of unfavorable research reports about us or our industry or withdrawal of research coverageby securities analysts;
• trading activity by a limited number of stockholders who together beneficially own a majority of ouroutstanding common stock;
• the size of our public float;
• the economy as a whole, market conditions in our industry and the industries of our clients; and
• economic, legal and regulatory factors unrelated to our performance.
In addition, the stock markets have experienced extreme price and volume fluctuations that have affectedand continue to affect the market prices of equity securities of many technology companies. Stock prices of manytechnology companies have fluctuated in a manner unrelated or disproportionate to the operating performance ofthose companies. In the past, stockholders have filed securities class actions following periods of marketvolatility. If we were to become involved in securities litigation, it could subject us to substantial costs, divertresources and the attention of management from our business, and adversely affect our business, operating resultsor financial condition.
If securities or industry analysts do not publish research or publish misleading or unfavorable research aboutour business, our stock price and trading volume could decline.
The trading market for our common stock depends in part on the research and reports that securities orindustry analysts publish about us or our business. If no or few securities or industry analysts cover our company,the trading price for our common stock would be negatively impacted. If one or more of the analysts who coversus downgrades our stock or publishes incorrect or unfavorable research about our business, our common stock
30

price would likely decline. If one or more of these analysts ceases coverage of our company or fails to publishreports on us regularly, demand for our common stock could decrease, which could cause our common stockprice or trading volume to decline.
The issuance of additional stock in connection with acquisitions, our stock incentive plans, warrants orotherwise will dilute all other stockholders.
Our certificate of incorporation authorizes us to issue up to one hundred million shares of common stockand up to ten million shares of preferred stock with such rights and preferences as may be determined by ourboard of directors. Subject to compliance with applicable rules and regulations, we may issue all of these sharesthat are not already outstanding without any action or approval by our stockholders. We intend to continue toevaluate strategic acquisitions in the future. We may pay for such acquisitions, partly or in full, through theissuance of additional equity securities.
Any issuance of shares in connection with an acquisition, the exercise of stock options or warrants, theaward of shares of restricted stock or otherwise would dilute the percentage ownership held by our existingstockholders.
Anti-takeover provisions in our charter documents and Delaware law may delay or prevent an acquisition ofour company.
Our certificate of incorporation, bylaws and Delaware law contain provisions that may have the effect ofdelaying or preventing a change in control of us or changes in our management. These provisions, alone ortogether, could delay or prevent hostile takeovers and changes in control or changes in our management.
Any provision of our certificate of incorporation, bylaws or Delaware law that has the effect of delaying ordeterring a change in control could limit the opportunity for our stockholders to receive a premium for theirshares of our common stock, and could affect the price that some investors are willing to pay for our commonstock.
Our reported financial results may be adversely affected by changes in accounting principles generallyaccepted in the United States.
Generally accepted accounting principles in the United States are subject to interpretation by the FinancialAccounting Standards Board (“FASB”), the SEC and various bodies formed to promulgate and interpretappropriate accounting principles. A change in these principles or interpretations could have a significant effecton our reported financial results, and could affect the reporting of transactions completed before theannouncement of a change.
Item 1B. Unresolved Staff Comments
None.
Item 2. Properties
Our corporate headquarters is an approximately 250,000-square-foot campus located on over 30 acres ofCompany-owned property in Oklahoma City, Oklahoma. In addition to housing a fully redundant data center atour corporate headquarters, we operate another fully redundant data center at a leased property near Dallas,Texas. We also lease a disaster recovery site in downtown Oklahoma City.
We also lease offices in Arizona, California, Colorado, Connecticut, Florida, Georgia, Illinois, Indiana,Maryland, Massachusetts, Michigan, Minnesota, Missouri, New Jersey, New York, North Carolina, Ohio,
31

Oklahoma, Oregon, Pennsylvania, Tennessee, Texas, Virginia and Washington. We believe that these facilitiesare suitable for our current operations and upon the expiration of the terms of the leases we believe we couldrenew these leases or find suitable space elsewhere on acceptable terms.
Item 3. Legal Proceedings
From time to time, we are involved in various disputes, claims, suits, investigations and legal proceedingsarising in the ordinary course of business. We believe that the resolution of current pending legal matters will nothave a material adverse effect on our business, financial condition, results of operations or cash flows.Nonetheless, we cannot predict the outcome of these proceedings, as legal matters are subject to inherentuncertainties, and there exists the possibility that the ultimate resolution of these matters could have a materialadverse effect on our business, financial condition, results of operations or cash flows.
Item 4. Mine Safety Disclosures
None.
32

PART II
Item 5. Market for Registrants Common Equity, Related Stockholder Matters and Issuer Purchases ofEquity Securities
Price Range of Common Stock
Our common stock is traded on the NYSE under the symbol “PAYC.” The following table sets forth for theperiods indicated the high and low sale prices per share of our common stock as reported on the NYSE:
High Low
Fiscal Year 2015:First Quarter $35.86 $22.58Second Quarter $39.75 $29.36Third Quarter $41.58 $29.80Fourth Quarter $46.35 $34.85Fiscal Year 2016:First Quarter $37.74 $22.42Second Quarter $43.25 $32.42Third Quarter $52.93 $42.73Fourth Quarter $52.80 $39.15
As of February 6, 2017, there were approximately 754 holders of record of our common stock. This numberis based on the actual number of holders registered at such date and does not include holders whose shares areheld in “street name” by brokers and other nominees.
Dividends
We did not pay any cash dividends on our common stock in 2016, 2015 or 2014. The declaration, amountand payment of any future dividends on shares of common stock will be at the sole discretion of our board ofdirectors and we may reduce or discontinue entirely the payment of such dividends at any time. Our board ofdirectors may take into account general and economic conditions, our financial condition and operating results,our available cash and current and anticipated cash needs, capital requirements, contractual, legal, tax andregulatory restrictions and implications of the payment of dividends by us to our stockholders or by oursubsidiaries to us, and such other factors as our board of directors may deem relevant. While there are norestrictions that currently apply under our existing loan agreements, such agreements prohibit the payment ofdividends if an event of default exists. In addition, any financing arrangements that we enter into in the futuremay include restrictive covenants that limit our or our subsidiaries’ ability to pay dividends.
We are a holding company that has no material assets other than our ownership of all of the outstandingSeries B Preferred Units of Paycom Payroll Holdings, LLC (“Holdings”) and the outstanding capital stock ofWCAS Paycom Holdings, Inc. (“WCAS Holdings”) and WCAS CP IV Blocker, Inc. In the event that we decideto pay dividends in the future, we intend to cause Holdings to make distributions to us in an amount sufficient tocover cash dividends, if any, declared by us.
33

Performance Graph
Notwithstanding any statement to the contrary in any of our filings with the SEC, the following performancegraph shall not be deemed “filed” with the SEC for purposes of Section 18 of the Exchange Act or “solicitingmaterial” under the Exchange Act and shall not be incorporated by reference into any such filings irrespective ofany general incorporation language contained in such filing.
The following graph compares the total cumulative stockholder return on our common stock with the totalcumulative return of the S&P 500 Index and the S&P 1500 Application Software Index during the periodcommencing on April 15, 2014, the initial trading day of our common stock, and ending on December 31, 2016.The graph assumes that $100 was invested at the beginning of the period in our common stock and in each of thecomparative indices, and assumes the reinvestment of any dividends. Historical stock price performance shouldnot be relied upon as an indication of future stock price performance.
$80.00$100.00$120.00$140.00$160.00$180.00$200.00$220.00$240.00$260.00$280.00$300.00$320.00$340.00
4/15/14 6/30/14 9/30/14 12/31/14 3/31/15 6/30/15 9/30/15 12/31/15 3/31/16 6/30/16 9/30/16 12/31/16
Comparison of Cumulative Total Return
Paycom Software, Inc. S&P 500 S&P 1500 Application Software Index
Purchases of Equity Securities
The number of shares of common stock repurchased by us during the three months ended December 31,2016 is set forth below:
Total Number ofShares Purchased
Average Price Paid perShare
Total Number ofShares Purchased as
Part of PubliclyAnnounced Plans or
Programs (1)
Approximate DollarValue of Shares that MayYet Be Purchased Underthe Plans or Programs (1)
October 1 - 31, 2016 . . . . . . . 37,285 $48.91 37,285 $25,400,000November 1 - 30, 2016 . . . . . 513,768 $42.27 513,768 $ 3,700,000December 1 - 31, 2016 . . . . . 83,453 $43.63 83,453 $ 40,000
Total . . . . . . . . . . . . . . . 634,506 634,506
(1) Under a stock repurchase plan announced on May 26, 2016, we were authorized to purchase up to$50.0 million of our common stock prior to May 25, 2018. On February 8, 2017, we announced that ourBoard of Directors amended and extended the stock repurchase plan, such that we are authorized topurchase up to an additional $50.0 million of our common stock. The stock repurchase plan will expire onJanuary 23, 2019.
34

Item 6. Selected Financial Data
Our selected consolidated financial data set forth below should be read together with Part II, Item 7,“Management’s Discussion and Analysis of Financial Condition and Results of Operations” and our consolidatedfinancial statements and the related notes thereto, which are included elsewhere in this Form 10-K. Selectedconsolidated financial data for the years ended December 31, 2013 and December 31, 2012 is that of Holdingsand its consolidated subsidiaries and WCAS Holdings.
Year Ended December 31,
2016 2015 2014 2013 2012
(dollars in thousands, except share and per share data)
Consolidated statements of income data:Total revenues $ 329,141 $ 224,653 $ 150,929 $ 107,601 $ 76,810Operating income $ 57,971 $ 34,435 $ 15,700 $ 9,472 $ 6,133Net income (loss) $ 43,840 $ 20,945 $ 5,663 $ 607 $ (406)Earnings (loss) per share, basic $ 0.76 $ 0.37 $ 0.11 $ 0.01 $ (0.01)Earnings (loss) per share, diluted $ 0.74 $ 0.36 $ 0.11 $ 0.01 $ (0.01)Weighted average shares outstanding:Basic 57,550,204 56,495,170 49,784,154 45,476,895 44,771,559Diluted 58,968,099 57,919,700 51,857,309 48,062,075 44,771,559
As of December 31,
2016 2015 2014 2013 2012
(dollars in thousands)
Consolidated balance sheets data:Cash and cash equivalents $ 60,158 $ 50,714 $ 25,144 $ 13,362 $ 13,435Working capital (deficit) (1) 31,919 37,330 15,340 (7,694) 5,099Property and equipment, net 96,848 58,858 47,919 38,671 25,139Total assets 1,078,613 876,655 797,497 575,478 430,041Deferred revenue 39,711 29,036 19,337 12,572 8,392Net long-term debt, less current portion 28,711 24,856 26,123 11,545 11,959Long-term debt to related parties — — — 60,875 60,633Additional paid in capital 95,452 71,135 67,937 33,978 23,577Retained earnings (accumulated deficit) 70,448 26,608 5,663 (29,349) (14,249)Total stockholder’s equity $ 116,527 $ 98,314 $ 74,138 $ 5,083 $ 9,776
(1) Working capital (deficit) is defined as current assets, excluding restricted cash, less current liabilities,excluding the current portion of deferred revenue. For the years ended December 31, 2014 and 2013, ourworking capital includes the effects of the adoption of ASU No. 2015-17, Balance Sheet Classification ofDeferred Taxes, requiring all deferred tax assets and liabilities to be classified as noncurrent on ourconsolidated balance sheets.
Item 7. Management’s Discussion and Analysis of Financial Condition and Results of Operations
You should read the following discussion and analysis of our financial condition and results of operations inconjunction with the audited and unaudited consolidated financial statements (prepared in accordance withaccounting principles generally accepted in the United States (“U.S. GAAP”)) and related notes included elsewhere inthis Annual Report on Form 10-K (this “Form 10-K”). The following discussion contains forward-looking statementsthat are subject to risks and uncertainties. See Part I “Special Note Regarding Forward-Looking Statements” for adiscussion of the uncertainties, risks, and assumptions associated with those statements. Actual results could differmaterially from those discussed in or implied by forward- looking statements as a result of various factors, includingthose discussed below and elsewhere in this Form 10-K, particularly in the section entitled “Risk Factors.” Unless westate otherwise or the context otherwise requires, the terms “we,” “us,” “our” and the “Company” refer to PaycomSoftware, Inc. and its consolidated subsidiaries.
35

Overview
We are a leading provider of comprehensive, cloud-based human capital management (“HCM”) softwaredelivered as Software-as-a-Service. We provide functionality and data analytics that businesses need to manage thecomplete employment life cycle from recruitment to retirement. Our solution requires virtually no customization and isbased on a core system of record maintained in a single database for all HCM functions, including talent acquisition,time and labor management, payroll, talent management and human resources (“HR”) management applications. Ouruser-friendly software allows for easy adoption of our solution by employees, enabling self-management of their HCMactivities in the cloud, which reduces the administrative burden on employers and increases employee productivity.
We serve a diverse client base in terms of size and industry. We have over 17,800 clients, none of whichconstituted more than one-half of one percent of our revenues for the year ended December 31, 2016. We storeddata for more than 2.7 million persons employed by our clients during the year ended December 31, 2016.
Our revenues are primarily generated through our sales force that solicits new clients and our client relationsrepresentatives who sell additional applications to existing clients. We have 42 sales teams located in 24 statesand plan to open additional sales offices to further expand our presence in the U.S. market. During the year endedDecember 31, 2016, we opened six new sales offices, with one new sales office located in each of Chicago,Cleveland, Pasadena, Sacramento, San Antonio and Stamford. Our continued growth depends on attracting newclients through further penetration of our existing markets, geographic expansion and the introduction of newapplications to our existing client base. We also expect that changes in certain factors affecting our performancewill correlate with improvement or deterioration in the labor market. Our principal marketing programs includeemail campaigns, social and digital media, search engine marketing methods and tradeshows.
During the last three years, we have developed several new applications. We believe our ability to continue todevelop new applications and to improve existing applications will enable us to increase revenues in the future, and thenumber of our new applications adopted by our clients has been a significant factor in our revenue growth over the lastthree years.
Trends, Opportunities and Challenges
Our payroll application is the foundation of our solution and all of our clients are required to utilize thisapplication in order to access our other applications. As a result of our evolving revenue mix as clients add morenon-payroll applications, coupled with the unique client benefits that our solution provides (e.g., enabling our clients toscale the number of HCM applications that they use on an as-needed basis), we are presented with a variety ofopportunities and challenges.
We generate revenues from (i) fixed amounts charged per billing period plus a fee per employee ortransaction processed or (ii) fixed amounts charged per billing period. We do not require clients to enter intolong-term contractual commitments with us. Our billing period varies by client based on when they pay theiremployees, which is either weekly, bi-weekly, semi-monthly or monthly.
For the years ended December 31, 2016, 2015 and 2014, our gross margins were approximately 84%, 84%and 82%, respectively. Although our gross margins may fluctuate from quarter to quarter due to seasonality andhiring trends, we expect that our gross margins will remain relatively consistent in future periods.
Growing our business has also resulted in, and will continue to result in, substantial investment in salesprofessionals, operating expenses, systems development and programming costs and general and administrativeexpenses, which has and will continue to increase our expenses. We intend to obtain new clients by (i) continuing toexpand our presence in metropolitan areas where we currently have an existing sales office through adding sales teamsor offices and increasing the number of our sales professionals and (ii) opening sales offices in new metropolitan areas.Our ability to increase revenues and improve operating results depends on our ability to add new clients.
36

The average size of our clients has grown significantly as we have organically grown our operations andincreased the number of applications we offer. Based on our total revenues, we have grown at an approximately44% CAGR from January 1, 2012 through December 31, 2016. Because we charge our clients on a per employeebasis for certain services we provide, any increase or decrease in the number of employees that our clients havewill have a positive or negative impact, respectively, on our results of operations. Our solution requires noadjustment to serve larger clients. We believe larger employers represent a substantial opportunity to increase thenumber of potential clients and to increase our revenues per client, with limited incremental cost to us.
We believe the challenges of managing the ever-changing complexity of payroll and human resources willcontinue to drive companies to turn to outsourced providers for help with their HCM needs. The HCM industryhistorically has been driven, in part, by legislation and regulatory action, including COBRA, changes to theminimum wage laws or overtime rules, and legislation from federal, state or municipal taxation authorities. Theimplementation of the Affordable Care Act (the “ACA”) is the most recent example of legislation that hascreated demand in the HCM industry. We generate ACA-related revenues (i) on an annual basis in connectionwith processing and filing Forms 1094 and 1095 on behalf of clients and (ii) from clients who have purchasedour Enhanced ACA application as part of the fixed, bundled price charged per billing period. While we generallydo not track our revenues on an application-by-application basis (because applications are often sold in variousgroupings and configurations for a single price), we estimate that, if the ACA is not modified or repealed,revenues from our Enhanced ACA application and ACA forms filings business will represent approximately 5%of total projected revenues for the year ending December 31, 2017.
Throughout our history, we have built strong relationships with our clients. As the HCM needs of our clientsevolve, we believe that we are well-positioned to gain additional share of the HCM spending of our clients, andwe believe this opportunity is significant. To be successful, we must continue to demonstrate the operational andeconomic benefits of our solution, as well as effectively hire, train, motivate and retain qualified personnel.
Key Metrics
In addition to the U.S. GAAP and non-GAAP metrics discussed elsewhere in this Form 10-K, we alsomonitor the following metrics to evaluate our business, measure our performance and identify trends affectingour business:
Year Ended December 31,
2016 2015 2014
Key performance indicators:Clients 17,817 15,004 12,775Clients (based on parent company grouping) 10,464 8,906 7,945Sales teams 42 36 31Annual revenue retention rate 91% 91% 91%
• Clients. When we calculate the number of clients at period end, we treat client accounts with separatetaxpayer identification numbers as separate clients, which often separates client accounts that are affiliatedwith the same parent organization. We track the number of our clients to provide an accurate gauge of thesize of our business. Unless we state otherwise or the context otherwise requires, references to clientsthroughout this Form 10-K refer to this metric.
• Clients (based on parent company grouping). When we calculate the number of clients based on parentcompany grouping at period end, we combine client accounts that have identified the same person(s) as theirdecision-maker regardless of whether the client accounts have separate taxpayer identification numbers,which often combines client accounts that are affiliated with the same parent organization. We track thenumber of our clients based on parent company grouping to provide an alternate measure of the size of ourbusiness and clients.
37

• Sales Teams. We monitor our sales professionals by the number of sales teams at period end. Each teamconsists of a sales manager and approximately six to eight sales professionals. Certain larger metropolitanareas can support more than one sales team. We believe that the number of sales teams is an indicator ofpotential revenues for future periods.
• Annual Revenue Retention Rate. Our annual revenue retention rate tracks the percentage of revenues that weretain from our existing clients. We monitor this metric because it is an indicator of client satisfaction andrevenues for future periods.
Components of Results of Operations
Sources of Revenues
Revenues are comprised of recurring revenues, and implementation and other revenues. We expect ourrevenues to increase as we introduce new applications, expand our client base and renew and expandrelationships with existing clients. As a percentage of total revenues, we expect our mix of recurring revenues,and implementation and other revenues to remain relatively constant.
Recurring. Recurring revenues include fees for our talent acquisition, time and labor management, payroll,talent management and HR management applications as well as fees charged for delivery of client payroll checksand reports. These revenues are derived from (i) fixed amounts charged per billing period plus a fee peremployee or transaction processed or (ii) fixed amounts charged per billing period. Because recurring revenuesare based, in part, on fees for use of our applications and the delivery of checks and reports that are levied on aper-employee basis, our recurring revenues increase as our clients hire more employees. Recurring revenues arerecognized in the period services are rendered. As of April 1, 2016, recurring revenues also include interestearned on funds held for clients. We collect funds from clients in advance of either the applicable due date forpayroll tax submissions or the applicable disbursement date for employee payment services. These collectionsfrom clients are typically disbursed from one to 30 days after receipt, with some funds being held for up to 120days. We typically invest funds held for clients in money market funds, demand deposit accounts, commercialpaper and certificates of deposit until they are paid to the applicable tax or regulatory agencies or to clientemployees. We expect that interest earned on funds held for clients will increase as we introduce newapplications, expand our client base and renew and expand relationships with existing clients. The amount ofinterest we earn from the investment of client funds is also impacted by changes in interest rates.
Implementation and Other. Implementation and other revenues are comprised of implementation fees for thedeployment of our solution and other revenues from sales of time clocks as part of our time and attendanceservices. Non-refundable implementation fees are charged to new clients at inception and upon the addition ofcertain incremental applications for existing clients. These fees range from 10% to 30% of the annualized valueof the transaction. Implementation revenues are recorded as deferred revenue and recognized over the life of theclient, which is estimated to be 10 years, and other revenues are recognized upon shipment of time clocks.Implementation and other revenues comprised approximately 1.7% of our total revenues for the year endedDecember 31, 2016.
Cost of Revenues
Cost of revenues consists of expenses related to hosting and supporting our applications, hardware costs,systems support and technology and depreciation and amortization. These costs include employee-relatedexpenses (including non-cash stock-based compensation expenses) and other expenses related to client support,bank charges for processing ACH transactions, certain implementation expenses, delivery charges and papercosts. They also include our cost for time clocks sold and ongoing technology and support costs related to oursystems. The amount of depreciation and amortization of property and equipment allocated to cost of revenues isdetermined based upon an estimate of assets used to support our operations.
38

Administrative Expenses
Administrative expenses consist of sales and marketing, research and development, general andadministrative and depreciation and amortization. Sales and marketing expenses consist primarily of employee-related expenses for our direct sales and marketing staff (such as commissions and bonuses and non-cash stock-based compensation expenses), marketing expenses and other related costs. Research and development expensesconsist primarily of employee-related expenses (including non-cash stock-based compensation expenses) for ourdevelopment staff, net of capitalized software costs for internally developed software. We expect to grow ourresearch and development efforts as we continue to broaden our payroll and HR solution offerings and extend ourtechnological solutions by investing in the development of new applications and introducing them to new andexisting clients. General and administrative expenses consist of employee-related expenses for finance andaccounting, legal, human resources and management information systems personnel (including non-cash stock-based compensation expenses), legal costs, professional fees and other corporate expenses. Depreciation andamortization expenses consist of (i) the amount of depreciation and amortization of property and equipmentallocated to administrative expenses (based upon an estimate of assets used to support our selling, general andadministrative functions) and (ii) amortization of intangible assets.
Net Loss on Early Repayment of Debt
During 2014, we wrote off $4.1 million related to the discount associated with the repayment of certainrelated party debt.
Interest Expense
Interest expense includes interest on debt related to our corporate headquarters and, with respect to the yearended December 31, 2014 only, related party debt.
Other Income, net
Other income, net includes interest earned on our own funds and any gain or loss on the sale or disposal offixed assets. Prior to April 1, 2016, other income, net also included interest earned on funds held for clients.
Provision for Income Taxes
Our consolidated financial statements include a provision for income taxes incurred for the anticipated taxconsequences of the reported results of operations using the asset and liability method. Under this method, werecognize deferred tax assets and liabilities for the expected future tax consequences of temporary differencesbetween the financial reporting and tax basis of assets and liabilities, as well as for any operating loss and taxcredit carryforwards. Deferred tax assets and liabilities are measured using the tax rates that are expected to applyto taxable income for the years in which those tax assets and liabilities are expected to be realized or settled. Werecord a valuation allowance to reduce our deferred tax assets to the net amount that we believe is more likelythan not to be realized.
39

Results of Operations
The following tables set forth selected consolidated statements of income data and such data as a percentageof total revenues for each of the periods indicated:
Year Ended December 31,
2016 2015 2014
(in thousands)
RevenuesRecurring $323,548 $219,987 $148,207Implementation and other 5,593 4,666 2,722
Total revenues 329,141 224,653 150,929
Cost of revenuesOperating expenses 48,268 31,790 24,694Depreciation and amortization 5,798 3,683 2,624
Total cost of revenues 54,066 35,473 27,318
Administrative expensesSales and marketing 119,258 92,554 63,547Research and development 20,966 8,627 4,325General and administrative 69,046 47,826 35,501Depreciation and amortization 7,834 5,738 4,538
Total administrative expenses 217,104 154,745 107,911
Total operating expenses 271,170 190,218 135,229
Operating income 57,971 34,435 15,700Interest expense (1,036) (1,427) (3,421)Net loss on early repayment of debt — — (4,044)Other income, net 308 517 1,421
Income before income taxes 57,243 33,525 9,656Provision for income taxes 13,403 12,580 3,993
Net income $ 43,840 $ 20,945 $ 5,663
40

Year Ended December 31,
2016 2015 2014
RevenuesRecurring 98.3% 97.9% 98.2%Implementation and other 1.7% 2.1% 1.8%
Total revenues 100.0% 100.0% 100.0%
Cost of revenuesOperating expenses 14.6% 14.2% 16.4%Depreciation and amortization 1.8% 1.6% 1.7%
Total cost of revenues 16.4% 15.8% 18.1%Administrative expensesSales and marketing 36.2% 41.2% 42.1%Research and development 6.4% 3.8% 2.9%General and administrative 21.0% 21.3% 23.5%Depreciation and amortization 2.4% 2.6% 3.0%
Total administrative expenses 66.0% 68.9% 71.5%
Total operating expenses 82.4% 84.7% 89.6%
Operating income 17.6% 15.3% 10.4%Interest expense (0.3%) (0.6%) (2.3%)Net loss on early repayment of debt 0.0% 0.0% (2.7%)Other income, net 0.1% 0.2% 1.0%
Income before income taxes 17.4% 14.9% 6.4%Provision for income taxes 4.1% 5.6% 2.6%
Net income 13.3% 9.3% 3.8%
Revenues
Year Ended December 31, % Change
2016 2015 2014 2016 vs 2015 2015 vs 2014
(in thousands)
Recurring $323,548 $219,987 $148,207 47% 48%Implementation and other 5,593 4,666 2,722 20% 71%
Total revenues $329,141 $224,653 $150,929 47% 49%
Total revenues were $329.1 million for the year ended December 31, 2016, compared to $224.7 million forthe year ended December 31, 2015, representing an increase of $104.4 million, or 47%. The increase in totalrevenues was due to several factors, including (i) the addition of clients in mature sales offices, which are officesthat have been open for at least 24 months, as well as contributions from sales offices that are reaching maturity,(ii) the addition of new clients in more recently opened sales offices, (iii) the sale of additional applications to ourexisting clients, (iv) additional revenues in the first quarter attributable to the strong performance of our tax formfiling business (including additional revenues from the first year of ACA-related filings), (v) an increase inaverage revenues per client as we continued to sell our applications to larger clients and (vi) growth in thenumber of employees of our clients. In addition, during the second quarter of 2016, we elected to change ouraccounting policy for recording interest income earned on funds held for clients, such that as of April 1, 2016,interest earned in the period between receipt and disbursement of client funds is recorded as recurring revenue.Prior to April 1, 2016, this interest income was recorded as other income, net.
41

As a result of increased sales, implementation and other revenues, a component of total revenues, increasedto $5.6 million for the year ended December 31, 2016, from $4.7 million for the year ended December 31, 2015,representing an increase of $0.9 million, or 20%.
Total revenues were $224.7 million for the year ended December 31, 2015, compared to $150.9 million forthe year ended December 31, 2014, an increase of $73.8 million, or 49%. The increase in total revenues was dueto several factors, including (i) the addition of clients in mature sales offices, as well as contributions from salesoffices that are reaching maturity, (ii) the addition of new clients in more recently opened sales offices, (iii) theintroduction and sale of additional applications to our existing clients, (iv) growth in the number of employees ofour clients, (v) an increase in average revenues per client as we continued to sell our applications to largerclients, (vi) additional revenues in the first quarter attributable to the strong performance of our tax form filingbusiness and (vii) additional revenues in the fourth quarter resulting from clients seeking to accelerateimplementation of our Enhanced ACA application that we believe would have typically deferred implementationuntil after year-end. As a result of increased sales, implementation and other revenues, a component of totalrevenues, increased to $4.7 million for the year ended December 31, 2015 from $2.7 million for the year endedDecember 31, 2014, representing an increase of $2.0 million, or 71%.
Expenses
The following table presents the non-cash stock-based compensation expense, resulting from stock-basedawards, that is recorded in our consolidated statements of income:
Year Ended December 31, % Change
2016 2015 2014 2016 vs 2015 2015 vs 2014
(in thousands)
Non-cash stock-based compensation expense:Operating expenses $ 2,217 $ 235 $ 32 843% 634%Sales and marketing 3,656 559 166 554% 237%Research and development 836 104 16 704% 550%General and administrative 15,837 2,112 498 650% 324%
Total non-cash stock-based compensation expense $22,546 $3,010 $712 649% 323%
During the year ended December 31, 2016, our non-cash stock-based compensation expense increased$19.5 million, primarily due to the issuance and subsequent vesting of restricted common stock with market-based vesting conditions. During the year ended December 31, 2015, our non-cash stock-based compensationexpense increased $2.3 million primarily due to the issuance of additional shares of restricted common stock,during 2015, whose grant-date fair value was greater than shares previously issued.
Cost of Revenues
Year Ended December 31, % Change
2016 2015 2014 2016 vs 2015 2015 vs 2014
(in thousands)
Operating expenses $48,268 $31,790 $24,694 52% 29%Depreciation and amortization 5,798 3,683 2,624 57% 40%
Total cost of revenues $54,066 $35,473 $27,318 52% 30%
Cost of revenues was $54.1 million for the year ended December 31, 2016, compared to $35.5 million forthe year ended December 31, 2015, representing an increase of $18.6 million, or 52%. The increase in cost ofrevenues was primarily due to a $12.3 million increase in employee costs, which consisted of a $10.3 millionincrease in expenses related to an increase in the number of operating personnel and a $2.0 million increase in
42
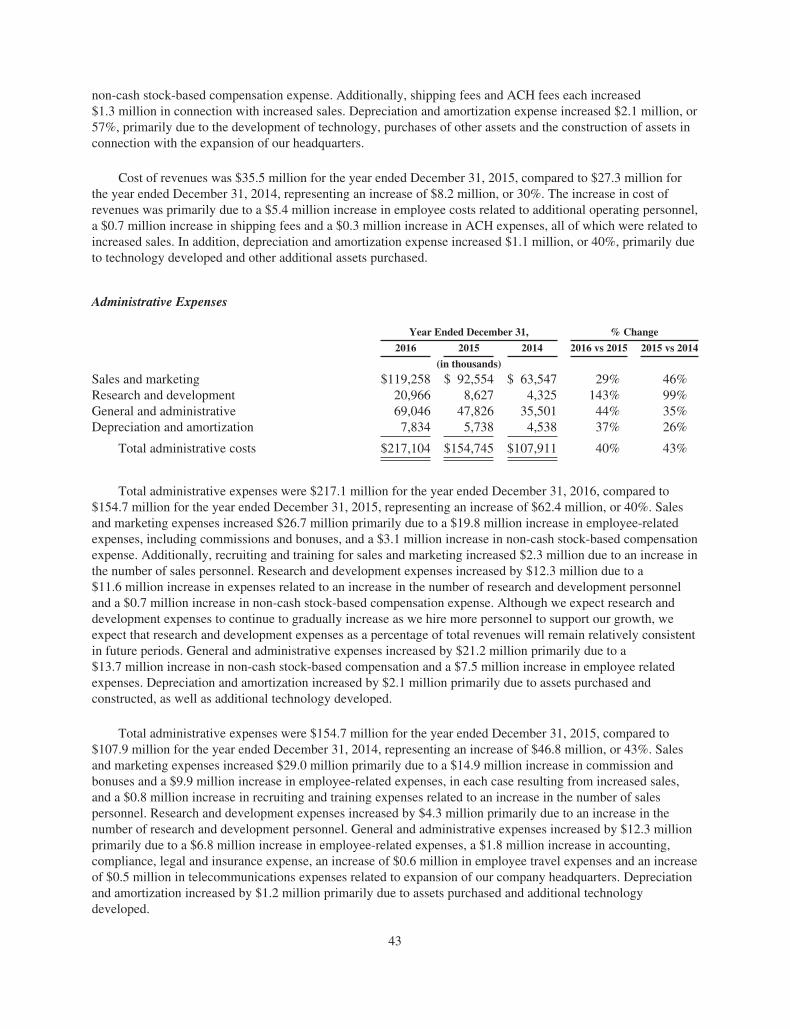
non-cash stock-based compensation expense. Additionally, shipping fees and ACH fees each increased$1.3 million in connection with increased sales. Depreciation and amortization expense increased $2.1 million, or57%, primarily due to the development of technology, purchases of other assets and the construction of assets inconnection with the expansion of our headquarters.
Cost of revenues was $35.5 million for the year ended December 31, 2015, compared to $27.3 million forthe year ended December 31, 2014, representing an increase of $8.2 million, or 30%. The increase in cost ofrevenues was primarily due to a $5.4 million increase in employee costs related to additional operating personnel,a $0.7 million increase in shipping fees and a $0.3 million increase in ACH expenses, all of which were related toincreased sales. In addition, depreciation and amortization expense increased $1.1 million, or 40%, primarily dueto technology developed and other additional assets purchased.
Administrative Expenses
Year Ended December 31, % Change
2016 2015 2014 2016 vs 2015 2015 vs 2014
(in thousands)
Sales and marketing $119,258 $ 92,554 $ 63,547 29% 46%Research and development 20,966 8,627 4,325 143% 99%General and administrative 69,046 47,826 35,501 44% 35%Depreciation and amortization 7,834 5,738 4,538 37% 26%
Total administrative costs $217,104 $154,745 $107,911 40% 43%
Total administrative expenses were $217.1 million for the year ended December 31, 2016, compared to$154.7 million for the year ended December 31, 2015, representing an increase of $62.4 million, or 40%. Salesand marketing expenses increased $26.7 million primarily due to a $19.8 million increase in employee-relatedexpenses, including commissions and bonuses, and a $3.1 million increase in non-cash stock-based compensationexpense. Additionally, recruiting and training for sales and marketing increased $2.3 million due to an increase inthe number of sales personnel. Research and development expenses increased by $12.3 million due to a$11.6 million increase in expenses related to an increase in the number of research and development personneland a $0.7 million increase in non-cash stock-based compensation expense. Although we expect research anddevelopment expenses to continue to gradually increase as we hire more personnel to support our growth, weexpect that research and development expenses as a percentage of total revenues will remain relatively consistentin future periods. General and administrative expenses increased by $21.2 million primarily due to a$13.7 million increase in non-cash stock-based compensation and a $7.5 million increase in employee relatedexpenses. Depreciation and amortization increased by $2.1 million primarily due to assets purchased andconstructed, as well as additional technology developed.
Total administrative expenses were $154.7 million for the year ended December 31, 2015, compared to$107.9 million for the year ended December 31, 2014, representing an increase of $46.8 million, or 43%. Salesand marketing expenses increased $29.0 million primarily due to a $14.9 million increase in commission andbonuses and a $9.9 million increase in employee-related expenses, in each case resulting from increased sales,and a $0.8 million increase in recruiting and training expenses related to an increase in the number of salespersonnel. Research and development expenses increased by $4.3 million primarily due to an increase in thenumber of research and development personnel. General and administrative expenses increased by $12.3 millionprimarily due to a $6.8 million increase in employee-related expenses, a $1.8 million increase in accounting,compliance, legal and insurance expense, an increase of $0.6 million in employee travel expenses and an increaseof $0.5 million in telecommunications expenses related to expansion of our company headquarters. Depreciationand amortization increased by $1.2 million primarily due to assets purchased and additional technologydeveloped.
43

Expenditures for software developed or obtained for internal use are capitalized and amortized over a three-year period on a straight-line basis. The table below sets forth the amounts of capitalized and expensed researchand development cost for the years ended December 31, 2016, 2015 and 2014.
Year Ended December 31, % Change
2016 2015 2014 2016 vs 2015 2015 vs 2014
(in thousands)
Capitalized portion of research and development $ 8,817 $ 4,317 $2,204 104% 96%Expensed portion of research and development 20,966 8,627 4,325 143% 99%
Total research and development costs $29,783 $12,944 $6,529 130% 98%
Provision for Income Taxes
For the twelve months ended December 31, 2016, income tax expense decreased as a percentage of revenuecompared to the twelve months ended December 31, 2015. The decrease primarily resulted from the recognitionof excess tax benefits from share-based payment awards due to the Company’s adoption of Accounting StandardsUpdate No. 2016-09, “Compensation – Stock Compensation (Topic 718): Improvements to Employee Share-Based Payment Accounting” (“ASU 2016-09”). See Note 2 under Adoption of New Pronouncements for furtherdiscussion in connection with the adoption of ASU 2016-09.
44

Quarterly Results of Operations
The following table sets forth selected unaudited quarterly consolidated statements of income data for eachof the 12 quarters within the three-year period ended December 31, 2016. The information for each of thesequarters has been prepared on the same basis as the audited annual consolidated financial statements includedelsewhere in this Form 10-K and, in the opinion of management, includes all adjustments, which includes onlynormal recurring adjustments, necessary for the fair presentation of the results of operations for these periods inaccordance with U.S. GAAP. This data should be read in conjunction with our audited consolidated financialstatements and related notes included elsewhere in this Form 10-K. These quarterly operating results are notnecessarily indicative of our operating results for a full year or any future period (in thousands).
Three Months Ended
Dec 31,2016
Sep 30,2016
Jun 30,2016
Mar 31,2016
Dec 31,2015
Sep 30,2015
Jun 30,2015
Mar 31,2015
Dec 31,2014
Sep 30,2014
Jun 30,2014
Mar 31,2014
RevenuesRecurring $86,295 $75,857 $72,492 $88,904 $63,583 $54,233 $47,820 $54,351 $43,177 $35,910 $32,666 $36,454Implementation and
other 1,515 1,468 1,388 1,222 1,535 1,107 1,153 871 863 688 640 531
Total revenues 87,810 77,325 73,880 90,126 65,118 55,340 48,973 55,222 44,040 36,598 33,306 36,985
Cost of revenuesOperating expenses 13,777 13,227 10,479 10,785 9,221 7,964 7,134 7,471 6,847 5,798 5,757 6,292Depreciation and
amortization 1,705 1,521 1,386 1,186 1,041 945 887 810 748 638 608 630
Total cost ofrevenues 15,482 14,748 11,865 11,971 10,262 8,909 8,021 8,281 7,595 6,436 6,365 6,922
Administrativeexpenses
Sales and marketing 36,556 29,274 24,766 28,662 30,810 23,774 16,741 21,229 19,310 14,856 13,700 15,681Research and
development 6,672 6,232 4,202 3,860 2,504 2,349 1,907 1,867 1,447 1,059 937 882General and
administrative 14,163 24,457 15,220 15,206 13,750 11,996 10,096 11,984 9,685 8,410 8,138 9,268Depreciation and
amortization 2,256 2,032 1,823 1,723 1,558 1,457 1,400 1,323 1,216 1,159 1,072 1,091
Totaladministrativeexpenses 59,647 61,995 46,011 49,451 48,622 39,576 30,144 36,403 31,658 25,484 23,847 26,922
Totaloperatingexpenses 75,129 76,743 57,876 61,422 58,884 48,485 38,165 44,684 39,253 31,920 30,212 33,844
Operating income 12,681 582 16,004 28,704 6,234 6,855 10,808 10,538 4,787 4,678 3,094 3,141Interest expense (303) (252) (170) (311) (360) (343) (392) (332) (342) (338) (674) (2,067)Net loss on early
repayment of debt — — — — — — — — — — (4,044) —Other income
(expense), net 371 (213) 116 34 367 98 19 33 26 39 587 769
Income (loss) beforeincome taxes 12,749 117 15,950 28,427 6,241 6,610 10,435 10,239 4,471 4,379 (1,037) 1,843
Provision (benefit) forincome taxes 4,116 (6,081) 5,529 9,839 1,084 2,763 4,489 4,244 1,965 1,689 (444) 783
Net income (loss) $ 8,633 $ 6,198 $10,421 $18,588 $ 5,157 $ 3,847 $ 5,946 $ 5,995 $ 2,506 $ 2,690 $ (593) $ 1,060
Quarterly Revenues Trends
Excluding changes in quarterly revenues due to seasonal factors, our quarterly revenues increasedsequentially for the periods presented due to a combination of factors, including the addition of clients in maturesales offices, as well as contributions from sales offices that are reaching maturity, the addition of new clients in
45

more recently opened sales offices and the sale of additional applications to our existing clients. There are alsoseasonal factors that affect our revenues. Recurring revenues include revenues relating to the annual processingof payroll forms such as Form W-2 and Form 1099, as well as the processing and filing of ACA-related forms.Because these forms are typically processed in the first quarter of the year, first quarter revenue and margins aregenerally higher than subsequent quarters. In addition, unscheduled payroll runs at the end of the year oftenresult in increased revenue in the fourth quarter.
Quarterly Expenses Trends
Sales and marketing expenses are generally higher in the fourth and first quarters as sales representativesachieve sales goals throughout the year, resulting in higher commission rates. These sales goals reset annually onFebruary 1.
Liquidity and Capital Resources
Our principal sources of liquidity are cash and cash equivalents, which totaled $60.2 million and$50.7 million as of December 31, 2016 and 2015, respectively. Our cash and cash equivalents are comprisedprimarily of demand deposit accounts, money market funds and certificates of deposit. We believe our existingcash and cash equivalents will be sufficient to meet our working capital and capital expenditure needs over atleast the next 12 months.
We have historically financed our operations from cash flows generated from operations, cash from the saleof debt and equity securities and borrowings under our loans. Since inception, we have raised $125.1 million ofequity capital, $64.3 million of which was the net proceeds raised in our initial public offering that closed inApril 2014. We incurred related party debt as part of corporate reorganizations that occurred in April 2012 andJanuary 2014. Such debt has since been repaid. Although we have funded most of the costs for ongoingconstruction projects at our corporate headquarters from available cash, we have incurred indebtedness for aportion of these costs. Further, to date, all purchases under our stock repurchase plan have been paid for fromavailable cash and, to the extent we repurchase additional shares in the future, we expect to continue to use cash.
Recent Liquidity Developments
Withholding Shares to Cover Taxes. During the year ended December 31, 2016, we withheld 302,424 sharesto satisfy tax withholding obligations with respect to the delivery of vested shares of restricted stock to certainemployees. Our payment of the taxes on behalf of those employees resulted in an expenditure of $14.4 million incash and, as such, we subtract the amounts attributable to such withheld shares from the aggregate amountavailable for future purchases under our stock repurchase plan.
Stock Repurchase Plan. On May 26, 2016, we announced that our Board of Directors approved a stockrepurchase plan under which we were authorized to purchase (in the aggregate) up to $50 million of ouroutstanding common stock, par value $0.01 per share, over a 24-month period. During the year endedDecember 31, 2016, we repurchased an aggregate of 1.1 million shares of common stock (including shareswithheld to satisfy tax withholding obligations, as discussed above) for an aggregate cost of $50.0 million. OnFebruary 8, 2017, we announced that our Board of Directors amended and extended this stock repurchase plan,such that we are authorized to purchase (in the aggregate) up to an additional $50.0 million of common stockthrough January 2019.
Oklahoma City Economic Development Trust Incentive. In the first quarter of 2016, we entered into a localincentive package with the Oklahoma City Economic Development Trust worth up to approximately$1.2 million, depending on the number of new jobs we create for local employees through 2021 and the averageannual salary level for such employees.
46

2021 Consolidated Loan. As of December 31, 2016, we had a term note under the 2021 Consolidated Loandue to Kirkpatrick Bank that matures on May 30, 2021 (the “2021 Consolidated Loan”) with an outstandingprincipal balance of $25.0 million. Under the 2021 Consolidated Loan, interest is payable monthly and accrues ata fixed rate of 4.75% per annum. The 2021 Consolidated Loan is secured by a mortgage covering ourheadquarters and certain personal property relating to our headquarters.
We are required to comply with certain financial and non-financial covenants under the 2021 ConsolidatedLoan, including maintaining a fixed charge coverage ratio of EBITDA to fixed charges (defined as currentmaturities of long-term debt, interest expense, rent expense and distributions) of greater than 1.2 to 1.0, which ismeasured on a quarterly basis. Further, until amounts under the 2021 Consolidated Loan are repaid, we may not,subject to certain exceptions, (i) create any mortgages or liens, (ii) make any loans, advances or extensions ofcredit with certain affiliates or enter into any other transactions with certain affiliates, (iii) lease any mortgagedproperty, (iv) make any distributions as long as an event of default exists, (v) make any material change inmethods of accounting, (vi) enter into any sale and leaseback arrangement, (vii) amend, modify, restate, cancel orterminate our organizational documents, (viii) sell, transfer or convey any mortgaged property or (ix) incurfunded outside debt. An event of default under the 2021 Consolidated Loan includes, among other events,(i) failure to pay principal or interest when due, (ii) breaches of certain covenants, (iii) any failure to meet therequired financial covenants and (iv) an institution of bankruptcy, reorganization, liquidation or receivership. Asof December 31, 2016, we were in compliance with all of the covenants under the 2021 Consolidated Loan.
2015 Construction Loan and 2023 Term Loan. On May 13, 2015, we entered into a loan agreement withKirkpatrick Bank to partially finance the construction of our third headquarters building (the “2015 ConstructionLoan”). The 2015 Construction Loan allowed us to borrow a maximum aggregate principal amount equal to thelesser of (i) $11.0 million or (ii) 80% of the appraised value of the constructed property. On August 1, 2016, weconverted the $5.0 million outstanding principal balance of the 2015 Construction Loan into an 84-month termloan (“2023 Term Loan”) with interest payable monthly and accruing at a fixed rate of 3.4% per annum.
At December 31, 2016, the principal balance outstanding on the 2023 Term Loan was $4.9 million. The2023 Term Loan matures on August 31, 2023 and is secured by a mortgage covering our headquarters and certainpersonal property relating to our headquarters. The 2023 Term Loan includes the same covenants as thosedisclosed above with respect to the 2021 Consolidated Loan. We were in compliance with all of the covenants asof December 31, 2016.
2016 Construction Loan. On August 2, 2016, we entered into a new construction loan with KirkpatrickBank, which is available to finance the ongoing construction of a fourth headquarters building and new parkinggarage (the “2016 Construction Loan”). As of December 31, 2016, there were no outstanding borrowings underthe 2016 Construction Loan. The 2016 Construction Loan allows us to borrow a maximum aggregate principalamount equal to the lesser of (i) $28.6 million or (ii) 80% of the appraised value of the constructedproperties. The 2016 Construction Loan matures on the earlier of the completion of construction or February 2,2019, with interest accruing at the greater of (i) the prime rate, plus 50 basis points or (ii) 4.0%. At maturity, theoutstanding principal balance of the 2016 Construction Loan, if any, will be automatically converted to an84-month term loan that will accrue fixed interest at the prevailing 7/20 London Interbank Offered Rate swapinterest rate in effect as of the commencement date, plus 225 basis points.
Cash Flow Analysis
Our cash flows from operating activities have historically been significantly impacted by profitability,implementation revenues received but deferred, research and development, and our investment in sales andmarketing to drive growth. Our ability to meet future liquidity needs will be driven by our operating performanceand the extent of continued investment in our operations. Failure to generate sufficient revenues and related cashflows could have a material adverse effect on our ability to meet our liquidity needs and achieve our businessobjectives.
47

As our business grows, we expect our capital expenditures and our investment activity to continue toincrease. Depending on certain growth opportunities, we may choose to accelerate investments in sales andmarketing, acquisitions, technology and services. Actual future capital requirements will depend on manyfactors, including our future revenues, cash from operating activities and the level of expenditures in all areas ofour business, and may use available cash to repurchase shares of our common stock.
As part of our payroll and payroll tax filing services, we collect funds from our clients for federal, state andlocal employment taxes, which we remit to the appropriate tax agencies. We invest these funds in money marketfunds, demand deposit accounts, commercial paper and certificates of deposit from which we earn interestincome during the period between their receipt and disbursement.
Our cash flows from investing and financing activities are influenced by the amount of funds held forclients, which varies significantly from quarter to quarter. The balance of the funds we hold depends on ourclients’ payroll calendars, and therefore such balance changes from period to period in accordance with thetiming of each payroll cycle.
Our cash flows from financing activities are also affected by the extent to which we use available cash topurchase shares of common stock under our stock repurchase plan as well as restricted stock vesting events thatmay result in the Company paying withholding taxes on behalf of certain employees.
The following table summarizes the consolidated statements of cash flows for the years ended December 31,2016, 2015 and 2014:
Year Ended December 31, % Change
2016 2015 2014 2016 vs 2015 2015 vs 2014
(in thousands)
Net cash provided by (used in):Operating activities $ 98,953 $ 42,972 $ 22,337 130% 92%Investing activities (205,051) (52,324) (219,050) 292% (76%)Financing activities 115,542 34,922 208,495 231% (83%)
Increase in cash and cash equivalents $ 9,444 $ 25,570 $ 11,782 (63%) 117%
Operating Activities
For the year ended December 31, 2016, net cash provided by operating activities was $99.0 million. The netcash provided by operating activities resulted primarily from net income of $43.8 million, an adjustment fornon-cash stock-based compensation expense of $22.5 million, an adjustment for depreciation and amortization of$13.6 million, an increase in deferred revenue of $10.7 million, a decrease in income taxes, net of $6.1 million,an increase in accrued expenses and other current liabilities of $3.9 million, an increase in accrued payroll andvacation of $1.9 million and a decrease in accounts receivable of $1.0 million, partially offset by an increase indeferred income tax asset, net of $1.8 million and an increase in accounts payable of $1.6 million.
For the year ended December 31, 2015, net cash provided by operating activities was $43.0 million. The netcash provided by operating activities resulted primarily from net income of $20.9 million, an increase in deferredrevenue of $9.7 million, an adjustment for depreciation and amortization of $9.4 million, an increase in accruedexpenses and other current liabilities of $4.0 million, an increase in accrued commissions and bonuses of$3.6 million and non-cash stock-based compensation expense of $3.0 million, partially offset by an increase inincome taxes, net of $5.8 million, an increase in prepaid expenses of $1.6 million and a decrease in deferredincome tax liability, net of $1.0 million.
48

For the year ended December 31, 2014, net cash provided by operating activities was $22.3 million. The netcash provided by operating activities resulted primarily from net income of $5.7 million, an adjustment fordepreciation and amortization of $7.2 million, an increase in deferred revenue of $6.8 million related to increasedimplementation fees, and the write off of the debt discount costs of $4.1 million.
Investing Activities
For the year ended December 31, 2016, net cash used in investing activities was $205.1 million. The netcash used in investing activities resulted primarily from an increase in funds held for clients of $161.5 millionrelated to the collection of client taxes and $43.8 million of capital expenditures related to investments inproperty and equipment.
For the year ended December 31, 2015, net cash used in investing activities was $52.3 million. The net cashused in investing activities resulted primarily from a $36.1 million increase in funds held for clients related tocollection of client taxes and $16.5 million of capital expenditures related to investments in property andequipment, offset by a decrease of $0.4 million in restricted cash.
For the year ended December 31, 2014, net cash used in investing activities was $219.1 million. The netcash used in investing activities resulted primarily from a $204.8 million increase in funds held for clients relatedto collection of client taxes and $14.3 million of capital expenditures related to investments in real property,software development and facilities and equipment.
Financing Activities
For the year ended December 31, 2016, net cash provided by financing activities was $115.5 million. Thenet cash provided by financing activities primarily resulted from an increase of $161.5 million in client fundsobligation related to collection of client taxes, proceeds from the issuance of long-term debt of $5.0 million,partially offset by open-market repurchases of common stock of $35.6 million, withholding taxes paid related tonet share settlements of $14.4 million and principal payments on long-term debt of $1.0 million.
For the year ended December 31, 2015, net cash provided by financing activities was $34.9 million. The netcash provided by financing activities primarily resulted from an increase of $36.1 million in client fundsobligation related to collection of client taxes, offset by $1.1 million of principal payments on long-term debt and$0.1 million of payment for debt issuance costs.
For the year ended December 31, 2014, net cash provided by financing activities was $208.5 million. Thenet cash provided by financing activities resulted primarily from an increase in client funds obligation of$204.8 million related to collection of client taxes, gross proceeds from our initial public offering of$62.8 million and proceeds from the issuance of long-term debt of $6.5 million, which were partially offset byprincipal payments on long-term debt of $65.7 million.
Contractual Obligations
Our principal commitments primarily consist of long-term debt and leases for office space. We disclose ourlong-term debt in Note 5 and our commitments and contingencies in Note 11 to our audited consolidatedfinancial statements included elsewhere in this Form 10-K.
49

As of December 31, 2016, the future non-cancelable minimum payments under these commitments were asfollows:
Payments Due by Period
Total
Lessthan
1 Year1-3
Years3-5
Years
Morethan
5 Years
(in thousands)
Long-term debt obligations:2021 Consolidated Loan $24,950 $ 934 $ 1,986 $22,030 —Interest on 2021 Consolidated Loan 4,944 1,183 2,225 1,536 —2023 Term Loan 4,874 179 356 378 3,961Interest on 2023 Term Loan 990 167 315 289 219Operating lease obligations:Facilities space 21,229 5,953 10,501 3,666 1,109
Total $56,987 $8,416 $15,383 $27,899 $5,289
We may continue to lease additional office space to support our growth. In addition, many of our existinglease agreements provide us with the option to renew. Our future operating lease obligations include paymentsdue during any renewal period provided for in the lease where the lease imposes a penalty for failure to renew.
The contractual commitment amounts in the table above are associated with agreements that are enforceableand legally binding and that specify all significant terms, including fixed or minimum services to be used, fixedminimum or variable price provisions, and the approximate timing of the transaction. Obligations under contractsthat we can cancel without a significant penalty are not included in the table above.
Off-Balance Sheet Arrangements
As of December 31, 2016, we did not have any off-balance sheet arrangements.
Critical Accounting Policies and Estimates
Our consolidated financial statements and accompanying notes have been prepared in accordance with U.S.GAAP. The preparation of these consolidated financial statements requires us to make estimates, judgments andassumptions that affect the reported amounts of assets, liabilities, revenues, costs and expenses, and relateddisclosures. On an ongoing basis, we continually evaluate our estimates and assumptions believed to bereasonable under current facts and circumstances. Actual amounts and results may materially differ from theseestimates made by management under different assumptions and conditions.
Certain accounting policies that require significant management estimates, and are deemed critical to ourresults of operations or financial position, are described below. Accordingly, these are the policies we believe arethe most critical to aid in fully understanding and evaluating our consolidated financial condition and results ofoperations.
Adoption of New Pronouncements
In March 2016, the Financial Accounting Standards Board (“FASB”) issued ASU 2016-09, whichsimplified the accounting related to certain aspects of share-based payments to employees. The new guidancerequires excess tax benefits and tax deficiencies to be recognized within the income statement when share-basedpayment awards vest or are settled. In addition, cash flows related to excess tax benefits are not separatelyclassified as a financing activity apart from other income tax cash flows in the statement of cash flows. Thisguidance also allows us to repurchase more of an employee’s vesting shares for tax withholding purposes without
50

triggering liability accounting, clarifies that all cash payments made to taxing authorities on an employee’s behalffor withheld shares be presented as a financing activity in the statement of cash flows, and provides anaccounting policy election to account for award forfeitures as they occur or continue to estimate forfeitures. Weelected to early adopt the new guidance in the third quarter of 2016. As such, we are required to present anyadjustments as of January 1, 2016, the beginning of the annual period that includes the interim period ofadoption. The primary impact of our adoption of ASU 2016-09 was the recognition of excess tax benefits in ourprovision for income taxes of $7.0 million for the year ended December 31, 2016, which otherwise would havebeen recognized as paid in capital. Early adoption had no impact on retained earnings as of January 1, 2016, oron the comparability of the prior period financial statements as there were no excess tax benefits recognizedduring 2015. We elected to continue to estimate expected forfeitures to determine the amount of stockcompensation cost to be recognized in each period. The presentation requirements for cash flows related toexcess benefits and for cash flows related to employee taxes paid for withheld shares had no impact on any of theperiods previously presented in our consolidated statements of cash flows.
We adopted on a retrospective basis the recently issued guidance by the FASB Accounting StandardsUpdate No. 2015-03, “Interest – Imputation of Interest (Subtopic 835-30): Simplifying the Presentation of DebtIssuance Costs” (“ASU 2015-03”). ASU 2015-03 requires companies with debt issuance costs related to arecognized debt liability to present such issuance costs in the consolidated balance sheets as a direct deductionfrom the carrying amount of the debt liability. Our adoption of ASU 2015-03 resulted in a reclassification thatdecreased deposits and other assets by $0.1 million and decreased net long-term debt, less current portion by$0.1 million on our consolidated balance sheet as of December 31, 2015. The adoption of ASU 2015-03 had noimpact on our stockholders’ equity or the results of our operations.
Revenue Recognition
Our total revenues are comprised of recurring revenues, and implementation and other revenues. Werecognize revenues in accordance with accounting standards for software and service companies when all of thefollowing criteria have been met:
• There is persuasive evidence of an arrangement;
• The service has been or is being provided to the customer;
• Collection of the fees is reasonably assured; and
• The amount of fees to be paid by the customer is fixed or determinable.
Recurring revenues are derived primarily from our talent acquisition, time and labor management, payroll,talent management and HR management applications. These services are rendered during each client’s payrollperiod with the agreed-upon fee being charged and collected as part of the client’s payroll. Revenues arerecognized at time of billing of each client’s payroll period. Collectability is reasonably assured as the fees arecollected through ACH as part of the client’s payroll cycle or through direct wire transfer, which minimizes thedefault risk. Our implementation and other revenues represent non-refundable conversion fees which are chargedto new clients to offset the expense of new client set-up and revenues from sale of time clocks as part of ouremployee time and attendance services. Because these conversion fees and sale of time clocks relate to ourrecurring revenues, we have evaluated such arrangements under the accounting guidance that governs multipleelement arrangements.
For arrangements with multiple elements, we evaluate whether each element represents a separate unit ofaccounting. In order to treat deliverables in a multiple element arrangement as separate units of accounting, thedeliverables must have standalone value upon delivery. If the deliverables have standalone value upon delivery,we account for each deliverable separately and revenue is recognized for the respective deliverables as they aredelivered. If one or more of the deliverables does not have standalone value upon delivery, the deliverables thatdo not have standalone value are generally combined with the final deliverable within the arrangement andtreated as a single unit of accounting.
51

For the years ended December 31, 2016, 2015 and 2014, we determined that there was no standalone valueassociated with the upfront conversion fees as they did not have value to our clients on a standalone basis norwere they offered as an individual service; therefore, the conversion fees were deferred and are recognizedratably over the estimated life of our clients, based on our historical client attrition rate, which we estimate to beten years. Revenues from the sale of time clocks are recognized when they are delivered.
Goodwill and Other Intangible Assets
Goodwill is not amortized, but we are required to test the carrying value of goodwill for impairment at leastannually, or earlier if, at the reporting unit level, an indicator of impairment arises. The estimates andassumptions about future results of operations and cash flows made in connection with the impairment testingcould differ from future actual results of operations and cash flows. If impairment exists, a write-down to fairvalue is recorded. Our business is largely homogeneous and, as a result, goodwill is associated with one reportingunit. We have selected June 30 as our annual goodwill impairment testing date and determined there was noimpairment as of June 30, 2016. For the years ended December 31, 2016, 2015 and 2014, there were noindicators of impairment. Intangible assets with finite lives are amortized on a straight-line basis over theirestimated useful lives.
Impairment of Long-Lived Assets
Long-lived assets, including intangible assets with finite lives, are reviewed for impairment when events orchanges in circumstances indicate that the carrying amount of an asset may not be recoverable. Recoverability ofassets to be held and used is measured by a comparison of the carrying amount of an asset to estimatedundiscounted future cash flows expected to be generated by the asset. If the carrying amount of an asset exceedsits estimated future cash flows, an impairment charge is recognized for the amount by which the carrying amountof the asset exceeds the estimated fair value of the asset. We have determined that there is no impairment oflong-lived assets for the years ended December 31, 2016, 2015 and 2014.
Restricted Common Stock
In connection with a corporate reorganization (the “2014 Reorganization”) completed in anticipation of ourinitial public offering (“IPO”), on January 1, 2014 we issued 8,121,101 shares of restricted stock (the “2014Restricted Stock”) under the Paycom Software, Inc. 2014 Long-Term Incentive Plan (the “LTIP”) and 1,148,520shares of common stock, in each case upon conversion of outstanding incentive units of Paycom PayrollHoldings, LLC (“Holdings”). Vested incentive units were converted to shares of common stock and 2014Restricted Stock at various conversion ratios that ranged from approximately 1:02 to 1:24. Unvested incentiveunits were converted to shares of 2014 Restricted Stock at various conversion ratios that ranged from 1:24 to1:47. The conversion ratios were determined based on the underlying conditions of the pre-conversion incentiveunits and reflected any pre-existing vesting conditions.
Given the absence of a public trading market for our common stock and incentive units prior to our IPO, andin accordance with the American Institute of Certified Public Accountants (the “AICPA”), Audit and AccountingPractice Aid Series: Valuation of Privately Held Company Equity Securities Issued as Compensation, our Boardof Directors exercised reasonable judgment and considered numerous factors existing at such time in order todetermine the best estimate of the fair value of the 2014 Restricted Stock and incentive units, including:
• Valuation analyses performed by an unrelated third-party specialist (including the application ofappropriate valuation techniques and inputs);
• Characteristics and specific terms of the shares as noted in the equity grant agreements;
• Value of the shares as determined by the absence of a liquidation value on the date of grant, the abilityto participate in our future profits, growth and appreciation and the lack of an exercise price for theshares;
• Lack of marketability of our common stock;
52

• Our historical and actual operating and financial performance;
• Our stage of development;
• Revenue and expense projections;
• Likelihood of achieving a liquidating event (IPO or sale);
• Market performance of comparable publicly traded companies;
• Industry factors; and
• Overall U.S. and global economic and capital market conditions.
We used a Monte Carlo simulation model to value the 2014 Restricted Stock and for restricted stock with market-based vesting conditions issued after our IPO. Our simulation model requires various subjective assumptions as inputs,including expected life, volatility, risk-free interest rates, and the expected dividend yield. The assumptions used in thesimulation model represent our best estimates, which involve inherent uncertainties and the application of ourjudgment as follows:
• Risk-free interest rate — For purposes of valuing shares of 2014 Restricted Stock, we determined therisk-free interest rate based on the implied yield available on 5 year U.S. Treasury securities. Forpurposes of valuing shares of restricted stock issued following our IPO, we determine the risk-freeinterest rate based on an implied yield available on U.S. Treasury Securities ranging from 5 to 10 yearmaturities, with a term equivalent to that of the restricted stock as of the valuation date.
• Volatility — We determined the volatility input based on the historical volatilities of comparableguideline companies. To determine the comparable guideline companies, we consider cloud-basedapplication providers and select those that are similar to us in nature of services provided. We intend tocontinue to consistently apply this process using the same or similar public companies untilinformation regarding the volatility of our own pricing changes, or unless circumstances change suchthat the identified companies are no longer similar to us, in which case, more suitable companies whoseshare prices are publicly available would be utilized in the calculation.
• Expected life —The expected life represents the period that the shares of restricted stock are expectedto be outstanding. We determined the expected life assumption based on the vesting terms andcontractual terms of the restricted stock.
• Expected dividend yield —We have not paid dividends and therefore apply an expected dividend yieldof 0%. Our Board of Directors will determine if and when dividends will be declared and paid in thefuture based on our financial position at the relevant time.
The FASB Accounting Standards Codification, Section 718-20-53-3 indicates that if the terms andconditions of an existing equity incentive compensation plan are to be modified, then an entity should recordadditional compensation cost for any incremental value associated with the modification. The incrementalcompensation cost is measured as the excess of the fair value of the modified awards over the fair value of theoriginal awards immediately before its terms are modified. Based on the terms of the 2014 Restricted Stock, weconcluded that there was a modification of the existing equity incentive units. Based upon a valuation by anindependent third-party, management determined there was no additional compensation cost created in theconversion, as the value of the incentive units given up was less than the value of the 2014 Restricted Stockreceived. As such, there was no additional compensation recorded.
During the year ended December 31, 2015, we issued an aggregate of 741,931 shares of restricted stockunder the LTIP to all of our executive officers and certain employees (the “2015 Restricted Stock”). During theyear ended December 31, 2016, we issued (i) an aggregate of 1,575,429 shares of restricted stock under the LTIPto all of our executive officers, certain employees and certain members of our Board of Directors (the “2016Restricted Stock” and, collectively with the 2014 Restricted Stock and the 2015 Restricted Stock, the “LTIPStock”). All shares of LTIP Stock are subject to either time-based or market-based vesting conditions.
53

The following tables present a summary of the grant-date fair values and related assumptions with respect toshares of LTIP Stock. The grant-date fair values were determined based on the Monte Carlo Simulation model.
Year EndedDecember 31,
2014
Grant-date fair value of 2014 Restricted Stock $5.76 - $36.03Risk-free interest rate 1.02%Volatility factor 30.0%Expected life (in years) 3.5
Year EndedDecember 31,
2015
Grant-date fair value of 2015 Restricted Stock $21.76 - $33.33Risk-free interest rate 2.20%Volatility factor 26.0%Expected life (in years) 3.6
Year EndedDecember 31,
2016
Grant-date fair value of 2016 Restricted Stock $23.15 - $49.34Risk-free interest rate 1.28% - 1.36%Volatility factor 21.0% - 23.0%Expected life (in years) 2.7
In addition to assumptions used in the simulation model, we are required to estimate forfeitures and onlyrecord compensation costs for those awards that are expected to vest. Our forfeiture estimate is based on ananalysis of our actual forfeitures. We will continue to evaluate the appropriateness of the forfeiture rate based onactual forfeiture experience, analysis of employee turnover, and other factors.
The following table presents information about the LTIP Stock:
Number ofshares of LTIPStock granted
Fair valueper share (1)
Grant DateJanuary 1, 2014 8,121,101 $ 0.25July 8, 2015 741,931 $27.65April 15, 2016 847,928 $27.99May 2, 2016 5,132 $38.95October 4, 2016 721,100 $36.96November 10, 2016 1,269 $39.36
(1) With respect to shares granted on January 1, 2014, July 8, 2015, April 15, 2016 and October 4, 2016,represents the weighted average fair value per share, taking into account both time-based and market-basedvesting conditions.
54

Shares of 2014 Restricted Stock that were subject to time-based vesting conditions retained substantially thesame time-based vesting conditions as the respective tranche of incentive units from which they were converted.The following tables show the vesting schedule for shares of 2014 Restricted Stock outstanding as ofDecember 31, 2016 that are subject to time-based vesting conditions:
Number of Shares ofYear Ending December 31, LTIP Stock to Vest
2017 570,7062018 97,541
Total 668,247
The following table shows the vesting schedule for shares of 2015 Restricted Stock and 2016 RestrictedStock outstanding as of December 31, 2016 that are subject to time-based vesting conditions:
Number of Shares ofYear Ending December 31, LTIP Stock to Vest
2017 132,3812018 207,3472019 180,0502020 126,1892021 78,4202022 36,880
Total 761,267
With respect to shares of 2014 Restricted Stock subject to market-based vesting conditions, 50% of such sharesvested when the Company’s Total Enterprise Value (as defined in the applicable restricted stock award agreement,“TEV”) reached $1.4 billion on December 1, 2014 and 50% of such shares vested when the Company’s TEV reached$1.8 billion on March 2, 2015. With respect to shares of 2015 Restricted Stock subject to market-based vestingconditions (“2015 Market-Based LTIP Stock”), 50% of such shares vested when the Company’s TEV reached$2.65 billion on August 1, 2016, and the remaining 50% will vest if the Company’s TEV equals or exceeds$3.5 billion. The TEV threshold for shares of 2016 Restricted Stock subject to market-based vesting conditions (“2016Market-Based LTIP Stock”) varies depending on the grant date. All shares of 2016 Market-Based LTIP Stock grantedon April 15, 2016 vested when the Company’s TEV reached $2.65 billion on July 28, 2016. Due to differences in thenumber of shares outstanding at the respective grant dates, which affected the TEV calculation, there was a two tradingday gap between the vesting of shares of 2016 Market-Based LTIP Stock and shares of 2015 Market-Based LTIPStock at the $2.65 billion TEV threshold. The remaining shares of 2016 Market-Based LTIP Stock are subject to TEVvesting thresholds of $3.9 billion and $4.2 billion.
The following table shows the shares of 2015 Market-Based LTIP Stock and 2016 Market-Based LTIPStock outstanding as of December 31, 2016 and the TEV vesting thresholds with respect to such shares:
Total Enterprise ValueNumber of Shares ofLTIP Stock to Vest
$3,500,000,000 231,675$3,900,000,000 253,375$4,200,000,000 253,375
Recent Accounting Pronouncements
In May 2014, the FASB issued Accounting Standards Update (“ASU”) No. 2014-09, “Revenue fromContracts with Customers (Topic 606).” This authoritative guidance includes a comprehensive new revenuerecognition model that requires revenue to be recognized in a manner to depict the transfer of goods or services
55

to a customer at an amount that reflects the consideration expected to be received in exchange for those goods orservices. The FASB has since issued several additional amendments to this guidance. In April 2015, the FASBproposed a one year deferral of the effective date of the new revenue recognition standard for public andnon-public entities reporting under U.S. GAAP and on July 9, 2015, the FASB approved the one year deferral.The effective date of the amended standard will begin in periods beginning after December 15, 2017 and earlyadoption is permitted but no earlier than for reporting periods beginning after December 31, 2016. The Companyhas an ongoing project to assess the impact of the standard that has been conducted with the assistance of aninternational accounting firm. The Company has not fully determined the impact of the new revenue recognitionstandard on its systems, processes and consolidated financial statements; however, we expect the new standardwill have a material impact on the manner in which we account for certain costs to acquire new contracts (i.e.,selling and commission costs) and costs to fulfill contracts (i.e., costs related to implementation servicesperformed). Generally, as it relates to these types of costs, the provisions of the new standard will result in thedeferral of these costs on the consolidated balance sheets and subsequently the amortizing of these costs to theconsolidated statements of income over the expected life of our client relationships, which we have determined tobe an average of 10 years. The Company is still evaluating whether implementation services contain an impliedperformance obligation in the form of a material right to the customer and if so, what impact that would have onthe recognition of implementation revenues. We expect to complete our assessment process, including selecting atransition method for adoption, by the end of the third quarter of 2017 and will complete our implementationprocess prior to the adoption of this ASU on January 1, 2018.
In July 2015, the FASB issued ASU No. 2015-11, “Inventory (Topic 330): Simplifying the Measurement ofInventory.” Under the new guidance, an entity should measure inventory (as defined within the scope of theguidance) at the lower of cost or net realizable value. The new guidance applies to all inventory except inventorymeasured using last-in, first-out (LIFO) or the retail inventory method. Net realizable value is defined as theestimated selling price in the ordinary course of business, less reasonably predicable costs of completion,disposal and transportation. The new guidance is effective for public companies for fiscal years beginning afterDecember 15, 2016, including interim periods within those fiscal years. Accordingly, the standard is effective forus on January 1, 2017. We do not anticipate that the adoption of this standard will have a material impact on ourconsolidated financial statements.
In January 2016, the FASB issued ASU No. 2016-01, “Financial Instruments – Overall (Subtopic 825-10):Recognition and Measurement of Financial Assets and Financial Liabilities.” The amendments in this guidancerequire all equity investments to be measured at fair value with changes in the fair value recognized through netincome (other than those accounted for under equity method of accounting or those that result in consolidation ofthe investee). The amendments in this guidance also require an entity to present separately in othercomprehensive income the portion of the total change in the fair value of a liability resulting from a change in theinstrument-specific credit risk when the entity has elected to measure the liability at fair value in accordance withthe fair value option for financial instruments. In addition the amendments in this guidance eliminate therequirement to disclose the method(s) and significant assumptions used to estimate the fair value that is requiredto be disclosed for financial instruments measured at amortized cost on the balance sheet for public businessentities. The new guidance is effective for us for fiscal years, and interim periods within those years, beginningafter December 15, 2017 and early adoption is permitted. We are currently evaluating the impact that thestandard will have on our consolidated financial statements.
In February 2016, the FASB issued ASU No. 2016-02 “Leases (Topic 842).” The purpose of the guidance isto increase the transparency and comparability among organizations by recognizing lease assets and leaseliabilities on the balance sheet as well as providing additional disclosure requirements related to leasingarrangements. The new guidance is effective for fiscal years, and interim periods within those years, beginningafter December 15, 2018, though early adoption is permitted. Full retrospective application is prohibited. Weanticipate that the adoption of this accounting standard will materially affect our consolidated balance sheets andmay require changes to the system and processes that we use to account for leases. We have not yet made anydecision on the timing of adoption or method of adoption with respect to the optional practical expedients.
56

Non-GAAP Financial Measures
Management uses Adjusted EBITDA and non-GAAP net income as supplemental measures to review andassess the performance of our core business operations and for planning purposes. We define (i) AdjustedEBITDA as net income plus interest expense, taxes, depreciation and amortization, non-cash stock-basedcompensation expense, net loss on early repayment of debt and certain transaction expenses that are not core toour operations, and (ii) non-GAAP net income as net income plus non-cash stock-based compensation expense,net loss on early repayment of debt and certain transaction expenses that are not core to our operations, each ofwhich is adjusted for the effect of income taxes. Adjusted EBITDA and non-GAAP net income are metrics thatprovide investors with greater transparency to the information used by management in its financial andoperational decision-making. We believe these metrics are useful to investors because they facilitate comparisonsof our core business operations across periods on a consistent basis, as well as comparisons with the results ofpeer companies, many of which use similar non-GAAP financial measures to supplement results under U.S.GAAP. In addition, Adjusted EBITDA is a measure that provides useful information to management about theamount of cash available for reinvestment in our business, repurchasing common stock and other purposes.Management believes that the non-GAAP measures presented in this Form 10-K, when viewed in combinationwith our results prepared in accordance with U.S. GAAP, provide a more complete understanding of the factorsand trends affecting our business and performance.
Adjusted EBITDA and non-GAAP net income are not measures of financial performance under U.S.GAAP, and should not be considered a substitute for net income, which we consider to be the most directlycomparable U.S. GAAP measure. Adjusted EBITDA and non-GAAP net income have limitations as analyticaltools, and when assessing our operating performance, you should not consider Adjusted EBITDA or non-GAAPnet income in isolation, or as a substitute for net income or other consolidated statements of income dataprepared in accordance with U.S. GAAP. Adjusted EBITDA and non-GAAP net income may not be comparableto similar titled measures of other companies and other companies may not calculate such measures in the samemanner as we do.
The following tables reconcile net income to Adjusted EBITDA, net income to non-GAAP net income andearnings per share to non-GAAP net income per share on a basic and diluted basis:
Year Ended December 31,
2016 2015 2014
(in thousands)
Net Income to Adjusted EBITDA:Net income $43,840 $20,945 $ 5,663Interest expense 1,036 1,427 3,421Provision for income taxes 13,403 12,580 3,993Depreciation and amortization 13,632 9,421 7,162
EBITDA 71,911 44,373 20,239Non-cash stock-based compensation expense 22,546 3,010 712Transaction expenses — 685 2,004Net loss on early repayment of debt — — 4,044
Adjusted EBITDA $94,457 $48,068 $26,999
57

Year Ended December 31,
2016 2015 2014
(in thousands, except share and per share amounts)
Net Income to non-GAAP net income:Net income $ 43,840 $ 20,945 $ 5,663Non-cash stock-based compensation expense 22,546 3,010 712Transaction expenses — 685 2,004Net loss on early repayment of debt — — 4,044Income tax effect on non-GAAP adjustments (14,790) (1,191) (2,795)
Non-GAAP net income $ 51,596 $ 23,449 $ 9,628
Earnings per share, basic $ 0.76 $ 0.37 $ 0.11Earnings per share, diluted $ 0.74 $ 0.36 $ 0.11Non-GAAP net income per share, basic $ 0.90 $ 0.42 $ 0.19Non-GAAP net income per share, diluted $ 0.87 $ 0.40 $ 0.19Weighted average shares outstanding:Basic 57,550,204 56,495,170 49,784,154Diluted 58,968,099 57,919,700 51,857,309
Year Ended December 31,
2016 2015 2014
Earnings per share to non-GAAP net income per share, basic:Earnings per share, basic $ 0.76 $ 0.37 $ 0.11Non-cash stock-based compensation expense 0.39 0.06 0.01Transaction expenses — 0.01 0.04Net loss on early repayment of debt — — 0.08Income tax effect on non-GAAP adjustments (0.25) (0.02) (0.05)
Non-GAAP net income per share, basic $ 0.90 $ 0.42 $ 0.19
Year Ended December 31,
2016 2015 2014
Earnings per share to non-GAAP net income per share, diluted:Earnings per share, diluted $ 0.74 $ 0.36 $ 0.11Non-cash stock-based compensation expense 0.38 0.05 0.01Transaction expenses — 0.01 0.04Net loss on early repayment of debt — — 0.08Income tax effect on non-GAAP adjustments (0.25) (0.02) (0.05)
Non-GAAP net income per share, diluted $ 0.87 $ 0.40 $ 0.19
Item 7A. Quantitative and Qualitative Disclosures about Market Risk
Interest rate sensitivity
We had cash and cash equivalents totaling $60.2 million as of December 31, 2016. We consider all highlyliquid instruments purchased with a maturity of three months or less and money market funds to be cashequivalents. These amounts are invested primarily in demand deposit accounts, money market funds andcertificates of deposit. We also invest funds held for clients in money market funds, demand deposit accounts,commercial paper and certificates of deposit. The primary objectives of our investing activities are capitalpreservation, meeting our liquidity needs and, with respect to investing client funds, generating interest incomewhile maintaining the safety of principal. We do not enter into investments for trading or speculative purposes.
58

Our investments are subject to market risk due to changes in interest rates. The market value of fixed ratesecurities may be adversely affected due to a rise in interest rates, while floating rate securities may produce lessincome than expected if interest rates fall. Due in part to these factors, our future investment income may fallshort of expectation due to changes in interest rates, or we may suffer losses in principal if we are forced to sellsecurities that decline in market value due to changes in interest rates.
We do not believe that an increase or decrease in interest rates of 100-basis points would have a materialeffect on our operating results or financial condition with respect to our cash equivalents.
59

Item 8. Financial Statements and Supplementary Data
INDEX TO CONSOLIDATED FINANCIAL STATEMENTS
Page
Paycom Software, Inc.Consolidated Annual Financial StatementsReport of Independent Registered Public Accounting Firm 61Consolidated Balance Sheets as of December 31, 2016 and 2015 62Consolidated Statements of Income, Years Ended December 31, 2016, 2015 and 2014 63Consolidated Statements of Stockholders’ Equity, Years Ended December 31, 2016, 2015 and 2014 64Consolidated Statements of Cash Flows, Years Ended December 31, 2016, 2015 and 2014 65Notes to Consolidated Financial Statements 66
60

REPORT OF INDEPENDENT REGISTERED PUBLIC ACCOUNTING FIRM
Board of Directors and StockholdersPaycom Software, Inc.
We have audited the accompanying consolidated balance sheets of Paycom Software, Inc. (a Delawarecorporation) and subsidiaries (the “Company”) as of December 31, 2016 and 2015, and the related consolidatedstatements of income, stockholders’ equity, and cash flows for each of the three years in the period endedDecember 31, 2016. These financial statements are the responsibility of the Company’s management. Ourresponsibility is to express an opinion on these financial statements based on our audits.
We conducted our audits in accordance with the standards of the Public Company Accounting Oversight Board(United States). Those standards require that we plan and perform the audit to obtain reasonable assurance aboutwhether the financial statements are free of material misstatement. An audit includes examining, on a test basis,evidence supporting the amounts and disclosures in the financial statements. An audit also includes assessing theaccounting principles used and significant estimates made by management, as well as evaluating the overallfinancial statement presentation. We believe that our audits provide a reasonable basis for our opinion.
In our opinion, the consolidated financial statements referred to above present fairly, in all material respects, thefinancial position of Paycom Software, Inc. and subsidiaries as of December 31, 2016 and 2015, and the resultsof their operations and their cash flows for each of the three years in the period ended December 31, 2016 inconformity with accounting principles generally accepted in the United States of America.
We also have audited, in accordance with the standards of the Public Company Accounting Oversight Board(United States), the Company’s internal control over financial reporting as of December 31, 2016, based oncriteria established in the 2013 Internal Control—Integrated Framework issued by the Committee of SponsoringOrganizations of the Treadway Commission (COSO), and our report dated February 21, 2017 expressed anunqualified opinion.
/s/ GRANT THORNTON LLP
Oklahoma City, OklahomaFebruary 21, 2017
61

Paycom Software, Inc.Consolidated Balance Sheets
(in thousands, except share amounts)
December 31,
2016 2015
AssetsCurrent assets:
Cash and cash equivalents $ 60,158 $ 50,714Accounts receivable 1,339 2,354Prepaid expenses 4,475 3,531Inventory 675 1,093Income tax receivable 692 6,743
Current assets before funds held for clients 67,339 64,435Funds held for clients 858,244 696,703
Total current assets 925,583 761,138Property and equipment, net 96,848 58,858Deposits and other assets 1,215 1,286Goodwill 51,889 51,889Intangible assets, net 1,871 3,484Deferred income tax assets, net 1,207 —
Total assets $1,078,613 $876,655
Liabilities and Stockholders’ EquityCurrent liabilities:
Accounts payable $ 3,737 $ 4,899Accrued commissions and bonuses 8,003 8,687Accrued payroll and vacation 4,769 2,898Deferred revenue 5,230 3,726Current portion of long-term debt 1,113 886Accrued expenses and other current liabilities 17,798 9,735
Current liabilities before client funds obligation 40,650 30,831Client funds obligation 858,244 696,703
Total current liabilities 898,894 727,534
Deferred income tax liabilities, net — 641Long-term deferred revenue 34,481 25,310Net long-term debt, less current portion 28,711 24,856
Total long-term liabilities 63,192 50,807
Commitments and contingenciesStockholders’ equity:
Common stock, $0.01 par value (100,000,000 shares authorized, 58,453,283 and57,119,873 shares issued at December 31, 2016 and 2015, respectively;57,331,022 and 57,119,873 shares outstanding at December 31, 2016 and 2015,respectively) 585 571
Additional paid in capital 95,452 71,135Retained earnings 70,448 26,608Treasury stock, at cost (1,122,261 and 0 shares at December 31, 2016 and 2015,
respectively) (49,958) —
Total stockholders’ equity 116,527 98,314
Total liabilities and stockholders’ equity $1,078,613 $876,655
See accompanying notes to the consolidated financial statements.
62

Paycom Software, Inc.Consolidated Statements of Income
(in thousands, except share and per share amounts)
Year Ended December 31,
2016 2015 2014
RevenuesRecurring $ 323,548 $ 219,987 $ 148,207Implementation and other 5,593 4,666 2,722
Total revenues 329,141 224,653 150,929
Cost of revenuesOperating expenses 48,268 31,790 24,694Depreciation and amortization 5,798 3,683 2,624
Total cost of revenues 54,066 35,473 27,318
Administrative expensesSales and marketing 119,258 92,554 63,547Research and development 20,966 8,627 4,325General and administrative 69,046 47,826 35,501Depreciation and amortization 7,834 5,738 4,538
Total administrative expenses 217,104 154,745 107,911
Total operating expenses 271,170 190,218 135,229
Operating income 57,971 34,435 15,700Interest expense (1,036) (1,427) (3,421)Net loss on early repayment of debt — — (4,044)Other income, net 308 517 1,421
Income before income taxes 57,243 33,525 9,656Provision for income taxes 13,403 12,580 3,993
Net income $ 43,840 $ 20,945 $ 5,663
Earnings per share, basic $ 0.76 $ 0.37 $ 0.11Earnings per share, diluted $ 0.74 $ 0.36 $ 0.11
Weighted average shares outstanding:Basic 57,550,204 56,495,170 49,784,154Diluted 58,968,099 57,919,700 51,857,309
See accompanying notes to the consolidated financial statements.
63

Paycom Software, Inc.Consolidated Statements of Stockholders’ Equity
(in thousands, except share amounts)
Common Stock AdditionalPaid in Capital
(AccumulatedDeficit)RetainedEarnings
Non-controllingInterest
Treasury Stock TotalStockholders’
EquityShares Amount Shares Amount
Balances at December 31,2013 45,708,573 $457 $ 33,978 $(29,349) $ (3) — $ — $ 5,083
Acquisition of CP IVBlocker under the 2014Reorganization — — — — 3 — — 3
Reclassification ofaccumulated deficit toadditional paid in capitalunder the 2014Reorganization — — (29,349) 29,349 — — — —
Incentive units converted tocommon and restrictedstock 3,517,327 35 (35) — — — — —
Initial public offering, net 4,606,882 46 62,810 — — — — 62,856Stock-based compensation — 716 — — — 716Capital impact of the 2014
Reorganization — — (183) — — — — (183)Net income — — — 5,663 — — — 5,663
Balances at December 31,2014 53,832,782 $538 $ 67,937 $ 5,663 — — $ — $ 74,138
Vesting of restricted stock 3,287,091 33 (33) — — — — —Stock-based compensation — — 3,231 — — — — 3,231Net income — — — 20,945 — — — 20,945
Balances at December 31,2015 57,119,873 $571 $ 71,135 $ 26,608 — — $ — $ 98,314
Vesting of restricted stock 1,333,410 14 (14) — — — — —Stock-based compensation — — 24,331 — — — — 24,331Repurchases of common
stock — — — — — 1,122,261 (49,958) (49,958)Net income — — — 43,840 — — — 43,840
Balances at December 31,2016 58,453,283 $585 $ 95,452 $ 70,448 — 1,122,261 $(49,958) $116,527
See accompanying notes to the consolidated financial statements.
64
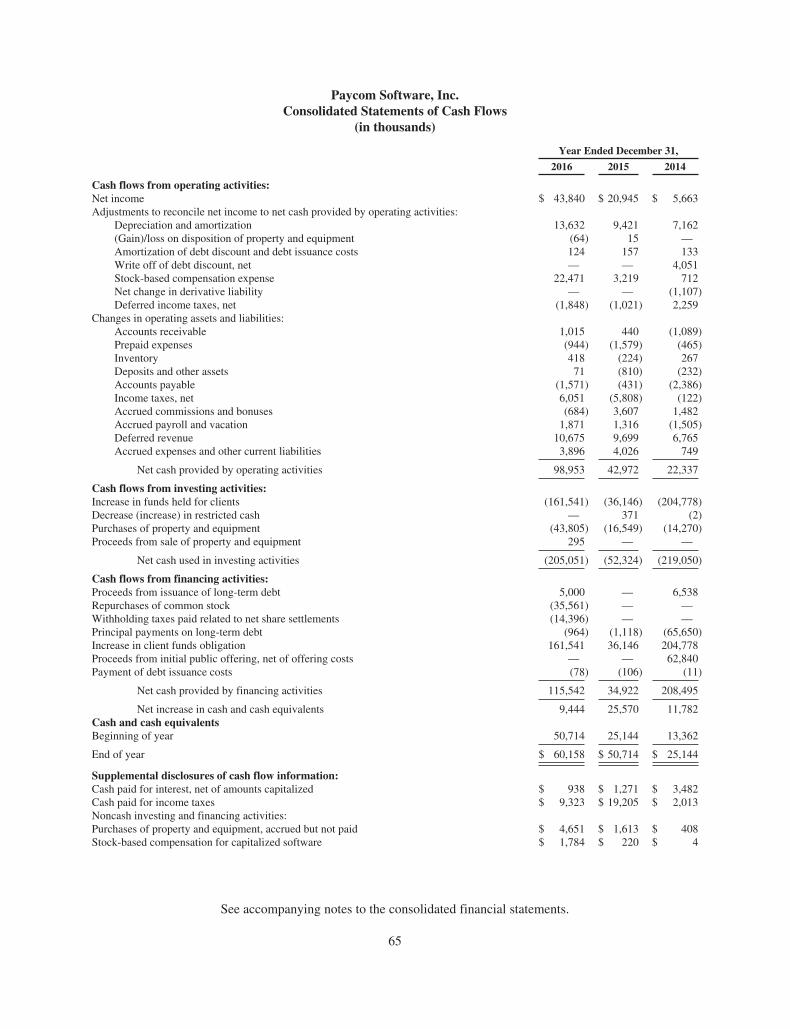
Paycom Software, Inc.Consolidated Statements of Cash Flows
(in thousands)
Year Ended December 31,
2016 2015 2014
Cash flows from operating activities:Net income $ 43,840 $ 20,945 $ 5,663Adjustments to reconcile net income to net cash provided by operating activities:
Depreciation and amortization 13,632 9,421 7,162(Gain)/loss on disposition of property and equipment (64) 15 —Amortization of debt discount and debt issuance costs 124 157 133Write off of debt discount, net — — 4,051Stock-based compensation expense 22,471 3,219 712Net change in derivative liability — — (1,107)Deferred income taxes, net (1,848) (1,021) 2,259
Changes in operating assets and liabilities:Accounts receivable 1,015 440 (1,089)Prepaid expenses (944) (1,579) (465)Inventory 418 (224) 267Deposits and other assets 71 (810) (232)Accounts payable (1,571) (431) (2,386)Income taxes, net 6,051 (5,808) (122)Accrued commissions and bonuses (684) 3,607 1,482Accrued payroll and vacation 1,871 1,316 (1,505)Deferred revenue 10,675 9,699 6,765Accrued expenses and other current liabilities 3,896 4,026 749
Net cash provided by operating activities 98,953 42,972 22,337
Cash flows from investing activities:Increase in funds held for clients (161,541) (36,146) (204,778)Decrease (increase) in restricted cash — 371 (2)Purchases of property and equipment (43,805) (16,549) (14,270)Proceeds from sale of property and equipment 295 — —
Net cash used in investing activities (205,051) (52,324) (219,050)
Cash flows from financing activities:Proceeds from issuance of long-term debt 5,000 — 6,538Repurchases of common stock (35,561) — —Withholding taxes paid related to net share settlements (14,396) — —Principal payments on long-term debt (964) (1,118) (65,650)Increase in client funds obligation 161,541 36,146 204,778Proceeds from initial public offering, net of offering costs — — 62,840Payment of debt issuance costs (78) (106) (11)
Net cash provided by financing activities 115,542 34,922 208,495
Net increase in cash and cash equivalents 9,444 25,570 11,782Cash and cash equivalentsBeginning of year 50,714 25,144 13,362
End of year $ 60,158 $ 50,714 $ 25,144
Supplemental disclosures of cash flow information:Cash paid for interest, net of amounts capitalized $ 938 $ 1,271 $ 3,482Cash paid for income taxes $ 9,323 $ 19,205 $ 2,013Noncash investing and financing activities:Purchases of property and equipment, accrued but not paid $ 4,651 $ 1,613 $ 408Stock-based compensation for capitalized software $ 1,784 $ 220 $ 4
See accompanying notes to the consolidated financial statements.
65

Paycom Software, Inc.Notes to the Consolidated Financial Statements
1. ORGANIZATION AND DESCRIPTION OF BUSINESS
Description of Business
Paycom Software, Inc. (“Software”) and its wholly owned subsidiaries (collectively, the “Company”) is aleading provider of comprehensive, cloud-based human capital management (“HCM”) software delivered asSoftware-as-a-Service. Unless we state otherwise or the context otherwise requires, the terms “we”, “our”, “us”and the “Company” refer to Software and its consolidated subsidiaries.
We provide functionality and data analytics that businesses need to manage the complete employment lifecycle from recruitment to retirement. Our solution requires virtually no customization and is based on a coresystem of record maintained in a single database for all HCM functions, including talent acquisition, time andlabor management, payroll, talent management and human resources (“HR”) management applications.
The Reorganization
Software and its wholly owned subsidiary, Payroll Software Merger Sub, LLC (“Merger Sub”) were formedas Delaware entities on October 31, 2013 and December 23, 2013, respectively, in anticipation of an initial publicoffering (“IPO”) and were wholly owned subsidiaries of Paycom Payroll Holdings, LLC (“Holdings”) prior toDecember 31, 2013.
On January 1, 2014, we consummated a reorganization pursuant to which (i) affiliates of Welsh, Carson,Anderson & Stowe, L.P. contributed WCAS Paycom Holdings, Inc. (“WCAS Holdings”) and WCAS CP IVBlocker, Inc. (“CP IV Blocker”), which together owned all of the Series A Preferred Units of Holdings, toSoftware in exchange for shares of common stock of Software, and (ii) the owners of outstanding Series BPreferred Units of Holdings contributed their Series B Preferred Units of Holdings to Software in exchange forshares of common stock of Software. Immediately after these contributions, Merger Sub merged with and intoHoldings with Holdings surviving the merger. Upon consummation of the merger, the remaining holders ofoutstanding common and incentive units of Holdings received shares of common and restricted stock of Softwarefor their common and incentive units by operation of Delaware law, and Holdings’ ownership interest inSoftware was cancelled. Outstanding common units, Series B Preferred Units and WCAS Holdings and CP IVBlocker were contributed to Software in exchange for, or converted into, an aggregate of 45,708,573 shares ofcommon stock and 8,121,101 shares of restricted stock of Software. Prior to the reorganization, WCAS Holdingsheld Series C Preferred Units of Holdings in the amount of $46.2 million and WCAS Holdings had a 14% notedue April 3, 2017 in the amount of $46.2 million (the “2017 Note”), which was payable to Welsh, Carson,Anderson & Stowe X, L.P. (“WCAS X”). Following the exchange of the Series A Preferred Units and Series BPreferred Units for shares of common stock of Software, all outstanding Series C Preferred Units of Holdingswere eliminated in an intercompany transaction between Holdings and WCAS Holdings, we assumed the 2017Note and Software became a holding company with its principal assets being the Series B Preferred Units ofHoldings and the outstanding capital stock of WCAS Holdings and CP IV Blocker. The foregoing transactionsare referred to collectively as the “2014 Reorganization”.
Software’s acquisition of WCAS Holdings and Holdings in the 2014 Reorganization representedtransactions under common control and were required to be retrospectively applied to the financial statements forall prior periods when the financial statements were issued for a period that included the date the transactionsoccurred. This includes a retrospective presentation for all equity related disclosures, including share, per share,and restricted stock disclosures, which have been revised to reflect the effects of the 2014 Reorganization.Therefore, our consolidated financial statements are presented as if WCAS Holdings and Holdings wereSoftware’s wholly owned subsidiaries in periods prior to the 2014 Reorganization. The acquisition of CP IVBlocker was not deemed to be a reorganization under common control and therefore our historical consolidated
66

Paycom Software, Inc.Notes to the Consolidated Financial Statements
financial statements include the ownership of a minority equity interest in CP IV Blocker, which was eliminatedupon the acquisition of CP IV Blocker in the 2014 Reorganization on January 1, 2014.
Initial Public Offering
On April 21, 2014, we completed our initial public offering (“IPO”) whereby an aggregate of 7,641,750shares of our common stock were sold to the public (consisting of 4,606,882 shares of common stock issued andsold by us and 3,034,868 shares of common stock sold by certain selling stockholders) at a public offering priceof $15.00 per share. We did not receive any proceeds from the sale of shares by the selling stockholders. Thetotal gross proceeds we received from the offering were $69.1 million. After deducting underwriting discountsand commissions and offering expenses payable by us, the aggregate net proceeds we received totaledapproximately $62.8 million. We used all of the net proceeds from the IPO, together with approximately$3.3 million from existing cash, for the repayment in full of the 2017 Note and the 10% Senior Note due 2022payable to WCAS Capital Partners IV, L.P. (“WCAS Capital IV”).
Follow-On Public Offering
On January 21, 2015, we closed our follow-on public offering, whereby 6,422,750 shares of our commonstock were sold to the public by certain selling stockholders at a public offering price of $22.50 per share. We didnot receive any proceeds from the sale of these shares.
Registered Block Trade Transactions
On May 20, 2015, we closed an underwritten secondary offering of 8,000,000 shares of our common stockby WCAS X, WCAS Capital IV, each of our executive officers and certain other selling stockholders at a publicoffering price of $36.25 per share. We did not receive any proceeds from the sale of these shares.
On September 15, 2015, we closed an underwritten secondary offering of 4,500,000 shares of our commonstock by WCAS X, WCAS Capital IV, each of our executive officers and certain other selling stockholders at apublic offering price of $37.95 per share. On September 23, 2015, the underwriter exercised its option topurchase an additional 675,000 shares from WCAS X and WCAS Capital IV. We did not receive any proceedsfrom the sales of these shares.
On November 18, 2015, we closed an underwritten secondary offering of 4,500,000 shares of our commonstock by WCAS X, WCAS Capital IV, each of our executive officers and certain other selling stockholders at apublic offering price of $42.15 per share. On November 19, 2015, the underwriter exercised its overallotmentoption and subsequently purchased an additional 585,697 shares from WCAS X and WCAS Capital IV. We didnot receive any proceeds from the sales of these shares.
2. SUMMARY OF SIGNIFICANT ACCOUNTING POLICIES
Basis of Presentation and Principles of Consolidation
Our consolidated financial statements include the financial results of Software and its wholly ownedsubsidiaries and have been prepared in accordance with accounting principles generally accepted in the UnitedStates of America (“US GAAP”) and applicable rules and regulations of the Securities and ExchangeCommission (“SEC”). Intercompany balances and transactions have been eliminated in consolidation. In theopinion of management, the accompanying consolidated financial statements include all adjustments necessaryfor the fair presentation for the periods presented. Such adjustments are of a normal recurring nature. In addition
67

Paycom Software, Inc.Notes to the Consolidated Financial Statements
to the normal adjustments, on the consolidated statement of cash flows for the year ended December 31, 2015,we combined the accounts of “stock-based compensation expense” and “employee stock purchase plancompensation expense” in order to conform to the current period presentation.
Adoption of New Pronouncements
In March 2016, the Financial Accounting Standards Board (“FASB”) issued Accounting Standards UpdateNo. 2016-09, “Compensation – Stock Compensation (Topic 718): Improvements to Employee Share-BasedPayment Accounting” (“ASU 2016-09”), which simplified the accounting related to certain aspects of share-based payments to employees. The new guidance requires excess tax benefits and tax deficiencies to berecognized within the income statement when share-based payment awards vest or are settled. In addition, cashflows related to excess tax benefits are not separately classified as a financing activity apart from other incometax cash flows in the statement of cash flows. This guidance also allows us to repurchase more of an employee’svesting shares for tax withholding purposes without triggering liability accounting, clarifies that all cashpayments made to taxing authorities on an employee’s behalf for withheld shares be presented as a financingactivity in the statement of cash flows, and provides an accounting policy election to account for awardforfeitures as they occur or continue to estimate forfeitures. We elected to early adopt the new guidance in thethird quarter of 2016. As such, we are required to present any adjustments as of January 1, 2016, the beginning ofthe annual period that includes the interim period of adoption, although there were no such adjustments necessaryin our consolidated financial statements until the quarter ended September 30, 2016. The primary impact of ouradoption of ASU 2016-09 was the recognition of excess tax benefits in our provision for income taxes of$7.0 million for the year ended December 31, 2016, which otherwise would have been recognized as paid incapital. Early adoption had no impact on retained earnings as of January 1, 2016, or on the comparability of theprior period financial statements as there were no excess tax benefits recognized during 2015. We elected tocontinue to estimate expected forfeitures to determine the amount of stock compensation cost to be recognized ineach period. The presentation requirements for cash flows related to excess benefits and for cash flows related toemployee taxes paid for withheld shares had no impact on any of the periods previously presented in ourconsolidated statements of cash flows.
We adopted on a retrospective basis the recently issued guidance by the FASB Accounting StandardsUpdate No. 2015-03, “Interest – Imputation of Interest (Subtopic 835-30): Simplifying the Presentation of DebtIssuance Costs” (“ASU 2015-03”). ASU 2015-03 requires companies with debt issuance costs related to arecognized debt liability to present such issuance costs in the consolidated balance sheets as a direct deductionfrom the carrying amount of the debt liability. Our adoption of ASU 2015-03 resulted in a reclassification thatdecreased deposits and other assets by $0.1 million and decreased net long-term debt, less current portion by$0.1 million on our consolidated balance sheet as of December 31, 2015. The adoption of ASU 2015-03 had noimpact on our stockholders’ equity or the results of our operations.
Use of Estimates
The preparation of financial statements in conformity with US GAAP requires management to makeestimates and assumptions that affect the amounts reported in the financial statements and accompanying notes.Significant estimates include income taxes, loss contingencies, the useful life for long-lived and intangible assets,the life of our client relationships, the fair market value of our equity incentive awards and the fair value of ourfinancial instruments. These estimates are based on historical experience where applicable and other assumptionsthat management believes are reasonable under circumstances. As such, actual results could materially differfrom these estimates.
68

Paycom Software, Inc.Notes to the Consolidated Financial Statements
Segment Information
We operate in a single operating segment and a single reporting segment. Operating segments are defined ascomponents of an enterprise about which separate financial information is evaluated regularly by the chiefoperating decision maker, who is also the chief executive officer in deciding how to allocate resources andassessing performance. Our chief executive officer allocates resources and assesses performance based uponfinancial information at the consolidated level. As we operate in one operating segment, all required financialsegment information is presented in the consolidated financial statements.
Cash Equivalents
We consider all highly liquid instruments purchased with a maturity of three months or less and moneymarket funds to be cash equivalents. We maintain cash and cash equivalents in demand deposit accounts, moneymarket funds, and certificates of deposit, which may not be federally insured. The fair value of our cash and cashequivalents approximates carrying value. We have not experienced any losses in such accounts and do notbelieve there is exposure to any significant credit risk on such accounts.
Accounts Receivable
We generally collect revenues from our clients through an automatic deduction from the clients’ bankaccounts at the time payroll processing occurs. Accounts receivable on our consolidated balance sheets consistsprimarily of revenue fees related to the last day of the year, which are collected on the following business day. Asaccounts receivable are collected via automatic deduction on the following business day, the Company has notrecorded an allowance for doubtful accounts.
Inventory
Our inventory consists of two types of time clocks, and related clock attachments, sold to clients as part ofour time and attendance services and are stated at the lower of cost or market. Cost is determined using thefirst-in first-out (FIFO) cost method.
Time clocks are purchased as finished goods from a third party and as such we do not have any inventoryclassified as raw materials or work in process inventory. Rental clocks are issued to clients undermonth-to-month operating leases and are classified as property and equipment. We retain inventory in certainlines primarily as replacements for those clients who use the various clocks and have determined that no write-down for obsolete items was required based on inventory turnover and our historical experience during the yearsended December 31, 2016, 2015 and 2014.
Property and Equipment
Property and equipment is stated at cost, net of accumulated depreciation and amortization. Depreciation iscomputed using the straight line method over the estimated useful lives of the assets as follows:
Furniture, fixtures and equipment 5 yearsComputer equipment 3 yearsSoftware and capitalized software 3 yearsBuildings 30 yearsLeasehold improvements 3 - 5 yearsRental clocks 5 yearsVehicles 3 years
69

Paycom Software, Inc.Notes to the Consolidated Financial Statements
Our leasehold improvements are amortized over the shorter of their estimated useful lives or the relatedlease terms. Costs incurred during construction of long-lived assets are recorded as construction in progress andare not depreciated until the asset is placed in service.
We capitalize interest costs incurred related to construction in progress. For the years ended December 31,2016, 2015 and 2014, we incurred interest costs of $1.3 million, $1.3 million and $3.7 million, respectively. Forthe years ended December 31, 2016, 2015 and 2014, interest expense of $0.4 million, less than $0.1 million and$0.4 million, respectively, was capitalized.
Internal Use Software
Expenditures for software purchases and software developed or obtained for internal use are capitalized andamortized over a three-year period on a straight-line basis. Capitalized costs include external direct costs ofmaterials and services associated with developing or obtaining internal use computer software and certain payrolland payroll-related costs for employees who are directly associated with internal use computer software projects.The amount of payroll costs that are capitalized with respect to these employees is limited to the time directlyspent on such projects. Costs associated with preliminary project stage activities, training, maintenance and allother post-implementation stage activities are expensed as incurred. We also expense internal costs related tominor upgrades and enhancements, as it is impractical to separate these costs from normal maintenance activities.
The total capitalized payroll costs related to internal use computer software projects was $8.8 million and$4.3 million as of December 31, 2016 and 2015, respectively, which have been included in property andequipment. Amortization expense related to capitalized software costs of $3.6 million, $1.8 million and$0.9 million was charged to expense for the years ended December 31, 2016, 2015 and 2014, respectively.
Goodwill and Other Intangible Assets
Goodwill is not amortized, but is instead tested for impairment annually, or earlier if, at the reporting unitlevel, an indicator of impairment arises. The estimates and assumptions about future results of operations andcash flows made in connection with the impairment testing could differ from future actual results of operationsand cash flows. If impairment exists, a write-down to fair value is recorded. Our business is largely homogeneousand, as a result, goodwill is associated with one reporting unit. We have selected June 30 as our annual goodwillimpairment testing date and determined there was no impairment as of June 30, 2016. For the years endedDecember 31, 2016, 2015 and 2014, there were no indicators of impairment. Intangible assets with finite lives areamortized on a straight-line basis over their estimated useful lives.
Impairment of Long-Lived Assets
Long-lived assets, including intangible assets with finite lives, are reviewed for impairment when events orchanges in circumstances indicate that the carrying amount of an asset may not be recoverable. Recoverability ofassets to be held and used is measured by a comparison of the carrying amount of an asset to estimatedundiscounted future cash flows expected to be generated by the asset. If the carrying amount of an asset exceedsits estimated future cash flows, an impairment charge is recognized for the amount by which the carrying amountof the asset exceeds the estimated fair value of the asset. We have determined that there was no impairment oflong-lived assets including intangible assets with finite lives, for the years ended December 31, 2016, 2015 and2014.
Funds Held for Clients and Client Funds Obligation
As part of our payroll and tax filing application, we (i) collect client funds to satisfy their respective federal,state and local employment tax obligations, (ii) remit such funds to the appropriate taxing authorities and
70

Paycom Software, Inc.Notes to the Consolidated Financial Statements
accounts designated by our clients, and (iii) manage client tax filings and any related correspondence with taxingauthorities. Amounts collected by us from clients for their federal, state and local employment taxes are investedand earn interest during the interval between receipt and disbursement.
These investments are shown in the consolidated balance sheets as funds held for clients, and the offsettingliability for the tax filings is shown as client funds obligation. The liability is recorded in the accompanyingbalance sheets at the time we obtain the funds from clients. The client funds obligation represents liabilities thatwill be repaid within one year of the balance sheet date. As of April 1, 2016, the interest income earned on fundsheld for clients is recorded in recurring revenues. Prior to April 1, 2016, the interest income earned on thesefunds was recorded in other income, net in the consolidated statements of income.
As of December 31, 2016, the funds held for clients were invested in money market funds, demand depositaccounts, commercial paper and certificates of deposit and classified as a current asset in the accompanyingbalance sheets, as these funds are held solely to satisfy the client funds obligation. As of December 31, 2015 and2014, the funds held for clients were invested in the same investments, other than commercial paper.
Stock Repurchase Plan
On May 26, 2016, we announced that our Board of Directors approved a stock repurchase plan under whichwe were authorized to purchase (in the aggregate) up to $50.0 million of our issued and outstanding commonstock, par value $0.01 per share, over a 24-month period. On February 8, 2017, we announced that our Board ofDirectors amended and extended this stock repurchase plan, such that we are authorized to purchase (in theaggregate) up to an additional $50.0 million of common stock through January 2019. Shares may be repurchasedfrom time-to-time in open market transactions at prevailing market prices, in privately negotiated transactions orby other means in accordance with federal securities laws, including Rule 10b5-1 programs, and the repurchaseplan may be suspended or discontinued at any time. The actual timing, number and value of shares repurchaseddepends on a number of factors, including the market price of our common stock, general market and economicconditions and other corporate considerations. During the year ended December 31, 2016, we repurchased anaggregate of 1,122,261 shares of our common stock at an average cost of $44.52 per share, including 302,424shares withheld to satisfy tax withholding obligations for certain employees upon the vesting of restrictedcommon stock.
Revenue Recognition
Our total revenue is comprised of recurring revenues and implementation and other revenues. We recognizerevenues in accordance with accounting standards for software and service companies when all of the followingcriteria have been met:
• There is persuasive evidence of an arrangement;
• The service has been or is being provided to the client;
• Collection of the fees is reasonably assured; and
• The amount of fees to be paid by the client is fixed or determinable.
Recurring
Recurring revenues are derived primarily from our talent acquisition, time and labor management, payroll,talent management and HR management applications as well as fees charged for delivery of client payroll checksand reports. Talent acquisition includes applicant tracking, candidate tracker, background checks, on-boarding, e-verify and tax credit services. Time and labor management includes time and attendance, scheduling/schedule
71

Paycom Software, Inc.Notes to the Consolidated Financial Statements
exchange, time-off requests, labor allocation, labor management reports/push reporting and geofencing/geotracking. Payroll includes payroll and tax management, Paycom pay, expense management, garnishmentmanagement and GL Concierge. Talent management includes employee self-service, compensation budgeting,performance management, executive dashboard and Paycom learning. HR management includes document andtask management, government and compliance, benefits administration, COBRA administration, personnelaction forms, surveys and Enhanced ACA.
The services related to recurring revenues are rendered during each client’s payroll period, with the agreed-upon fee being charged and collected as part of our processing of the client’s payroll. Recurring revenues arerecognized at the conclusion of processing of each client’s payroll-period, when each respective payroll client isbilled. Collectability is reasonably assured as the fees are collected through an Automated Clearing House(“ACH”) as part of the client’s payroll cycle or through direct wire transfer, which minimizes the default risk.
Implementation and other
Implementation and other revenues represent non-refundable conversion fees which are charged to newclients to offset the expense of new client set-up and revenues from the sale of time clocks as part of ouremployee time and attendance services. Because these conversion fees and sale of time clocks relate to ourrecurring revenues, we have evaluated such arrangements under the accounting guidance that governs multipleelement arrangements.
For arrangements with multiple elements, we evaluate whether each element represents a separate unit ofaccounting. In order to treat deliverables in a multiple element arrangement as separate units of accounting, thedeliverables must have standalone value upon delivery. If the deliverables have stand-alone value upon delivery,we account for each deliverable separately and revenue is recognized for the respective deliverables as they aredelivered. If one or more of the deliverables does not have stand-alone value upon delivery, the deliverables thatdo not have stand-alone value are generally combined with the final deliverable within the arrangement andtreated as a single unit of accounting.
When multiple deliverables included in an arrangement are separable into different units of accounting, thearrangement consideration is allocated to the identified separate units of accounting based on their relative sellingprice. Multiple deliverable arrangements accounting guidance provides a hierarchy to use when determining therelative selling price for each unit of accounting. Vendor-specific objective evidence (“VSOE”) of selling price,based on the price at which the item is regularly sold by the vendor on a stand-alone basis, should be used if itexists. If VSOE of selling price is not available, third-party evidence (“TPE”) of selling price is used to establishthe selling price if it exists, and if not it would be based on our best estimate of selling price.
For the years ended December 31, 2016, 2015 and 2014, we have determined that there is no stand-alonevalue associated with the upfront conversion fees as they do not have value to our clients on a stand-alone basisnor are they offered as an individual service; therefore, the conversion fees are deferred and recognized ratablyover the estimated life of our clients, which we have estimated to be ten years.
For the years ended December 31, 2016, 2015, and 2014, we have determined that the revenues from theemployee time and attendance services, and the revenues from the sale of time clocks as part of our time andattendance services, have VSOE of selling price as they are sold on a stand-alone basis. Revenue is thereforerecognized for the respective deliverables as they are delivered.
72

Paycom Software, Inc.Notes to the Consolidated Financial Statements
Cost of Revenues
Our costs and expenses applicable to total revenues represent total operating expenses and systems supportand technology costs, including labor and related expenses, bank fees, shipping fees and costs of paper stock,envelopes, etc. In addition, costs included to derive gross margins are comprised of support labor and relatedexpenses, related hardware costs and applicable depreciation and amortization costs.
Advertising Costs
Advertising costs are expensed the first time that advertising takes place. Advertising costs for the yearsended December 31, 2016, 2015 and 2014 were $4.9 million, $3.6 million and $4.2 million, respectively.
Sales Taxes
We collect and remit sales tax on sales of time and attendance clocks and on payroll services in certainstates. These taxes are shown on a net basis, and as such, excluded from revenues. For the years endedDecember 31, 2016, 2015 and 2014, sales taxes collected and remitted were $4.3 million, $3.7 million and$3.0 million, respectively.
Employee Stock-Based Compensation
Time-based stock compensation awards to employees are recognized pro rata over the applicable vestingperiod as compensation costs in the consolidated statements of income based on their fair values measured as ofthe date of grant. Market-based stock compensation awards to employees are recognized pro rata over theapplicable estimated vesting period as compensation costs in the consolidated statements of income based ontheir fair value as of the date of the grant unless vesting occurs sooner at which time the remaining respectiveunrecognized compensation cost would be recognized.
Employee Stock Purchase Plan
An award issued under the Paycom Software, Inc., Employee Stock Purchase Plan (the “ESPP”) is classifiedas a share-based liability and recorded at the fair value of the award. Expense is recognized, net of estimatedforfeitures, on a straight-line basis over the requisite service period.
Income Taxes
Our consolidated financial statements include a provision for income taxes incurred for the anticipated taxconsequences of the reported results of operations using the asset and liability method. Under this method, werecognize deferred tax assets and liabilities for the expected future tax consequences of temporary differencesbetween the financial reporting and tax basis of assets and liabilities, as well as for operating loss and tax creditcarryforwards. Deferred tax assets and liabilities are measured using the tax rates that are expected to apply totaxable income for the years in which those tax assets and liabilities are expected to be realized or settled. Werecord a valuation allowance to reduce our deferred tax assets to the net amount that we believe is more likelythan not to be realized.
We file income tax returns in the United States and various state jurisdictions. We evaluate tax positionstaken or expected to be taken in the course of preparing our tax returns and disallow the recognition of taxpositions not deemed to meet a “more-likely-than-not” threshold of being sustained by the applicable taxauthority. We do not believe there are any tax positions taken within the consolidated financial statements that
73

Paycom Software, Inc.Notes to the Consolidated Financial Statements
would not meet this threshold. Our policy is to record interest and penalties, if any, related to uncertain taxpositions as a component of general and administrative expenses. We are not aware of any open income taxexaminations as of December 31, 2016. However, the tax years 2007 through 2016 remain open to examinationfor federal income tax purposes and by other major taxing jurisdictions.
Recent Accounting Pronouncements
In May 2014, the Financial Accounting Standards Board (“FASB”) issued Accounting Standards Update(“ASU”) No. 2014-09 “Revenue from Contracts with Customers (Topic 606).” This authoritative guidanceincludes a comprehensive new revenue recognition model that requires revenue to be recognized in a manner todepict the transfer of goods or services to a customer at an amount that reflects the consideration expected to bereceived in exchange for those goods or services. The FASB has since issued several additional amendments tothis guidance. In April 2015, the FASB proposed a one year deferral of the effective date of the new revenuerecognition standard for public and non-public entities reporting under U.S. GAAP and on July 9, 2015, theFASB approved the one year deferral. The effective date of the amended standard will begin in periods beginningafter December 15, 2017 and early adoption is permitted but no earlier than for reporting periods beginning afterDecember 31, 2016. The Company has an ongoing project to assess the impact of the standard that has beenconducted with the assistance of an international accounting firm. The Company has not fully determined theimpact of the new revenue recognition standard on its systems, processes and consolidated financial statements;however, we expect the new standard will have a material impact on the manner in which we account for certaincosts to acquire new contracts (i.e., selling and commission costs) and costs to fulfill contracts (i.e., costs relatedto implementation services performed). Generally, as it relates to these types of costs, the provisions of the newstandard will result in the deferral of these costs on the consolidated balance sheets and subsequently theamortizing of these costs to the consolidated statements of income over the expected life of our clientrelationships, which we have determined to be an average of 10 years. The Company is still evaluating whetherimplementation services contain an implied performance obligation in the form of a material right to thecustomer and if so, what impact that would have on the recognition of implementation revenues. We expect tocomplete our assessment process, including selecting a transition method for adoption, by the end of the thirdquarter of 2017 and will complete our implementation process prior to the adoption of this ASU on January 1,2018.
In July 2015, the FASB issued ASU No. 2015-11, “Inventory (Topic 330): Simplifying the Measurement ofInventory.” Under the new guidance, an entity should measure inventory (as defined within the scope of theguidance) at the lower of cost or net realizable value. The new guidance applies to all inventory except inventorymeasured using last-in, first-out (LIFO) or the retail inventory method. Net realizable value is defined as theestimated selling price in the ordinary course of business, less reasonably predicable costs of completion,disposal and transportation. The new guidance is effective for public companies for fiscal years beginning afterDecember 15, 2016, including interim periods within those fiscal years. Accordingly, the standard is effective forus on January 1, 2017. We do not anticipate that the adoption of this standard will have a material impact on ourconsolidated financial statements.
In January 2016, the FASB issued ASU No. 2016-01, “Financial Instruments – Overall (Subtopic 825-10):Recognition and Measurement of Financial Assets and Financial Liabilities.” The amendments in this guidancerequire all equity investments to be measured at fair value with changes in the fair value recognized through netincome (other than those accounted for under equity method of accounting or those that result in consolidation ofthe investee). The amendments in this guidance also require an entity to present separately in othercomprehensive income the portion of the total change in the fair value of a liability resulting from a change in theinstrument-specific credit risk when the entity has elected to measure the liability at fair value in accordance withthe fair value option for financial instruments. In addition the amendments in this guidance eliminate the
74

Paycom Software, Inc.Notes to the Consolidated Financial Statements
requirement to disclose the method(s) and significant assumptions used to estimate the fair value that is requiredto be disclosed for financial instruments measured at amortized cost on the balance sheet for public businessentities. The new guidance is effective for us for fiscal years, and interim periods within those years, beginningafter December 15, 2017 and early adoption is permitted. We are currently evaluating the impact that thestandard will have on our consolidated financial statements.
In February 2016, the FASB issued ASU No. 2016-02 “Leases (Topic 842).” The purpose of the guidance isto increase the transparency and comparability among organizations by recognizing lease assets and leaseliabilities on the balance sheet as well as providing additional disclosure requirements related to leasingarrangements. The new guidance is effective for fiscal years, and interim periods within those years, beginningafter December 15, 2018, though early adoption is permitted. Full retrospective application is prohibited. Weanticipate that the adoption of this accounting standard will materially affect our consolidated balance sheets andmay require changes to the system and processes that we use to account for leases. We have not yet made anydecision on the timing of adoption or method of adoption with respect to the optional practical expedients.
3. PROPERTY AND EQUIPMENT
Property and equipment and accumulated depreciation and amortization were as follows (dollars inthousands):
Year Ended December 31,
2016 2015
Property and equipmentBuildings $ 48,250 $ 28,154Software and capitalized software costs 23,879 13,959Computer equipment 18,987 11,346Rental clocks 10,669 8,750Furniture, fixtures and equipment 6,695 5,464Leasehold improvements 680 358Vehicles — 421
109,160 68,452Less: accumulated depreciation and amortization (35,833) (24,894)
73,327 43,558Land 8,993 8,993Construction in progress 14,528 6,307
Property and equipment, net $ 96,848 $ 58,858
Included in the construction in progress balance at December 31, 2016 and 2015 is $1.1 and $0.4 million inretainage, respectively.
Rental clocks included in property and equipment, net represent time clocks issued to clients undermonth-to-month operating leases. As such, these items are transferred from inventory to property and equipmentand depreciated over their useful estimated lives.
Depreciation and amortization expense for property and equipment, net was $12.0 million, $7.8 million and$5.5 million for the years ended December 31, 2016, 2015 and 2014, respectively.
75

Paycom Software, Inc.Notes to the Consolidated Financial Statements
4. GOODWILL AND INTANGIBLE ASSETS, NET
We had goodwill of $51.9 million as of December 31, 2016 and 2015. We performed the requiredimpairment tests of goodwill as of June 30 for the years ended December 31, 2016, 2015 and 2014 including anassessment of whether or not indicators of impairment were present and determined there was no impairment foreach of those years then ended.
All of the intangible assets other than goodwill are considered to have finite lives and, as such, are subject toamortization. The components of intangible assets are as follows (dollars in thousands):
December 31, 2016
WeightedAverage
RemainingUseful Life Gross
AccumulatedAmortization Net
(Years)
Intangibles:Customer relationships 0.5 $13,997 $(13,297) $ 700Trade name 5.5 3,194 (2,023) 1,171
Total $17,191 $(15,320) $1,871
December 31, 2015
WeightedAverage
RemainingUseful Life Gross
AccumulatedAmortization Net
(Years)
Intangibles:Customer relationships 1.5 $13,997 $(11,897) $2,100Trade name 6.5 3,194 (1,810) 1,384
Total $17,191 $(13,707) $3,484
The weighted average remaining useful life of the intangible assets was 3.6 years as of December 31, 2016.Amortization of intangible assets for each of the years ended December 31, 2016, 2015 and 2014 was$1.6 million.
Estimated amortization expense for our existing intangible assets for the next five years and thereafter is asfollows (dollars in thousands):
Year Ending December 31, Amortization
2017 $ 9132018 2132019 2132020 2132021 213Thereafter 106
Total $1,871
76

Paycom Software, Inc.Notes to the Consolidated Financial Statements
5. LONG-TERM DEBT
Our long-term debt consisted of the following (dollars in thousands):
Year Ended December 31,
2016 2015
Term note to bank due May 30, 2021 $24,950 $25,742Term note to bank due August 31, 2023 4,874 —
Total long-term debt (including current portion) 29,824 25,742Less: Current portion (1,113) (886)
Total long-term debt, net $28,711 $24,856
As of December 31, 2016, our indebtedness consisted of (i) a term note under the 2021 Consolidated Loandue to Kirkpatrick Bank (the “2021 Consolidated Loan”), (ii) an 84-month term loan from Kirkpatrick Bank (the“2023 Term Loan”), which we obtained by converting the $5.0 million outstanding principal balance of aconstruction loan that was used to partially finance the construction of our third headquarters building (the “2015Construction Loan”), and (iii) a new construction loan from Kirkpatrick Bank, which is available to finance theongoing construction of a fourth headquarters building and new parking garage (the “2016 Construction Loan”).
The 2021 Consolidated Loan matures on May 30, 2021. Under the 2021 Consolidated Loan, interest ispayable monthly and accrues at a fixed rate of 4.75% per annum. The 2021 Consolidated Loan is secured by amortgage covering our headquarters and certain personal property relating to our headquarters. The 2021Consolidated Loan includes certain financial covenants, including maintaining a fixed charge coverage ratio ofEBITDA to fixed charges (defined as current maturities of long-term debt, interest expense, rent expense anddistributions) of greater than 1.2 to 1.0, which is measured on a quarterly basis. We were in compliance with allof these covenants as of December 31, 2016.
We entered into the 2015 Construction Loan with Kirkpatrick Bank on May 3, 2015 and converted theoutstanding principal balance into the 2023 Term Loan on August 1, 2016. The 2015 Construction Loan allowedus to borrow a maximum aggregate principal amount equal to the lesser of (i) $11.0 million or (ii) 80% of theappraised value of the constructed property. The 2023 Term Loan matures on August 31, 2023 and is secured bya mortgage covering our headquarters and certain personal property relating to our headquarters. Interest on the2023 Term Loan is payable monthly and accrues at a fixed rate of 3.4% per annum. The 2023 Term Loanincludes the same covenants as those disclosed above with respect to the 2021 Consolidated Loan. We were incompliance with all of these covenants as of December 31, 2016.
We entered into the 2016 Construction Loan with Kirkpatrick Bank on August 2, 2016. As of December 31,2016, there were no outstanding borrowings under the 2016 Construction Loan. The 2016 Construction Loanallows us to borrow a maximum aggregate principal amount equal to the lesser of (i) $28.6 million or (ii) 80% ofthe appraised value of the constructed properties. The 2016 Construction Loan matures on the earlier of thecompletion of construction or February 2, 2019, with interest accruing at the greater of (i) the prime rate, plus 50basis points or (ii) 4.0%. At maturity, the outstanding principal balance of the 2016 Construction Loan, if any,will be automatically converted into an 84-month term loan that will accrue fixed interest at the prevailing 7/20London Interbank Offered Rate swap interest rate in effect as of the commencement date, plus 225 basis points.
As of December 31, 2016 and December 31, 2015, the carrying value of our total long-term debt, includingcurrent portion, was $29.8 million and $25.7 million, respectively, which approximated its fair value as of bothdates. The fair value of our long-term debt is estimated based on the borrowing rates currently available to us forbank loans with similar terms and maturities.
77

Paycom Software, Inc.Notes to the Consolidated Financial Statements
Aggregate future maturities of long-term debt for the next five years and thereafter (including currentportion) as of December 31, 2016 are as follows (dollars in thousands):
Year Ending December 31,
2017 $ 1,1132018 1,1442019 1,1982020 1,2532021 21,155Thereafter 3,961
Total $29,824
6. EMPLOYEE SAVINGS PLAN AND EMPLOYEE STOCK PURCHASE PLAN
Our employees that are over the age of 21 and have completed ninety (90) days of service are eligible toparticipate in our 401(k) plan. We have made a Qualified Automatic Contribution Arrangement (“QACA”)election, whereby we make a matching contribution for our employees equal to 100% of the first 1% of salarydeferrals and 50% of salary deferrals between 2% and 6%, up to a maximum matching contribution of 3.5% of anemployee’s salary each plan year. We are allowed to make additional discretionary matching contributions anddiscretionary profit sharing contributions. Employees are 100% vested in amounts attributable to salary deferralsand rollover contributions. The QACA matching contributions as well as the discretionary matching and profitsharing contributions vest 100% after two years of employment from the date of hire. Matching contributionsamounted to $3.5 million, $2.4 and $1.7 million for the years ended December 31, 2016, 2015 and 2014,respectively.
The ESPP has overlapping offering periods, with each offering period lasting approximately 24 months. Atthe beginning of each offering period, eligible employees may elect to contribute, through payroll deductions, upto 10% of their compensation, subject to an annual per employee maximum. Eligible employees purchase sharesof the Company’s common stock at a price equal to 85% of the fair market value of the shares on the exercisedate. The maximum number of shares that may be purchased by a participant during each offering period is 2,000shares, subject to IRS limits. The shares reserved for purposes of the ESPP are shares we purchase in the openmarket. The maximum aggregate number of shares of the Company’s common stock that may be purchased byall participants under the ESPP is 2,000,000 shares. During the year ended December 31, 2016, eligibleemployees purchased 110,658 shares of the Company’s common stock under the ESPP. Compensation expenserelated to the ESPP is recognized on a straight-line basis over the requisite service period. Our compensationexpense related to the ESPP was $0.6 million and $0.4 million for the years ended December 31, 2016 and 2015,respectively. There was no compensation expense related to the ESPP for the year ended December 31, 2014.
7. FAIR VALUE OF FINANCIAL INSTRUMENTS
Our financial instruments consist primarily of cash and cash equivalents, accounts receivable, accountspayable, funds held for clients, client funds obligation and long-term debt. The carrying amount of cash and cashequivalents, accounts receivable, accounts payable, funds held for clients and client fund obligation approximatesfair value because of the short-term nature of the instruments.
We did not have any financial instruments that are measured on a recurring basis for the years endedDecember 31, 2016, 2015 or 2014.
78

Paycom Software, Inc.Notes to the Consolidated Financial Statements
The following table summarizes the change in fair value of our Level 3 financial instruments for the yearsended December 31, 2016, 2015 and 2014 (dollars in thousands).
2016 2015 2014
Balance, beginning of year $ — $ — $1,107Issuances — — —Change in fair value of derivative liability — — (635)Gain on the extinguishment of derivative liability — — (472)
Balance, end of year $ — $ — $ —
Total change of the derivative liability recognized as other income, net in the consolidated statements ofincome was $1.1 million for the year ended December 31, 2014.
8. EARNINGS PER SHARE
Basic earnings per share (“EPS”) is based on the weighted average number of shares of common stockoutstanding for the period. Diluted EPS is computed in a similar manner to basic EPS after assuming the issuanceof shares of common stock for all potentially dilutive shares of restricted stock whether or not they are vested.
In accordance with ASC Topic 260 “Earnings Per Share”, the two-class method determines earnings foreach class of common stock and participating securities according to an earnings allocation formula that adjuststhe income available to common stockholders for dividends or dividend equivalents and participation rights inundistributed earnings. Unvested share-based payment awards that contain non-forfeitable rights to dividends ordividend equivalents are participating securities and, therefore, are included in computing earnings per sharepursuant to the two-class method. The outstanding restricted shares of stock that were issued on July 8, 2015, areconsidered participating securities.
Under the 2014 Reorganization, all the outstanding common units, Series B Preferred Units and incentiveunits of Holdings were exchanged for, or converted into, an aggregate of 45,708,573 shares of our common stockand 8,121,101 shares of our restricted stock as of January 1, 2014.
79

Paycom Software, Inc.Notes to the Consolidated Financial Statements
The following is a reconciliation of net income and the shares of common stock used in the computation ofbasic and diluted net earnings per share (dollars in thousands, except share amounts):
Year Ended December 31,
2016 2015 2014
Numerator:Net income $ 43,840 $ 20,945 $ 5,663Less: income allocable to participating securities (333) (270) —
Income allocable to common shares $ 43,507 $ 20,675 $ 5,663
Add back: undistributed earnings allocable to participatingsecurities 333 270 —
Less: undistributed earnings reallocated to participatingsecurities (333) (264) —
Numerator for diluted earnings per share $ 43,507 $ 20,681 $ 5,663
Denominator:Weighted average common shares outstanding 50,315,455 50,315,455 49,002,809Weighted average common shares repurchased (286,699) — —Adjustment for vested restricted stock 7,521,448 6,179,715 781,345
Shares for calculating basic earnings per share 57,550,204 56,495,170 49,784,154
Dilutive effect of unvested restricted stock 1,417,895 1,424,530 2,073,155
Shares for calculating diluted earnings per share 58,968,099 57,919,700 51,857,309
Earnings per share:Basic $ 0.76 $ 0.37 $ 0.11Diluted $ 0.74 $ 0.36 $ 0.11
9. STOCKHOLDERS’ EQUITY AND STOCK-BASED COMPENSATION
On January 1, 2014, we issued restricted shares of common stock (“2014 Restricted Stock”) under thePaycom Software, Inc. 2014 Long-Term Incentive Plan (the “LTIP”) that were subject to either time-basedvesting conditions or market-based vesting conditions. Shares of 2014 Restricted Stock with time-based vestingconditions vest based on various schedules through 2018. The market-based vesting conditions were based onour total enterprise value exceeding certain specified thresholds. Compensation expense related to the issuance of2014 Restricted Stock with time-based vesting conditions was measured based on the fair value of the award onthe grant date and is recognized over the requisite service period on a straight-line basis. Compensation expenserelating to the issuance of 2014 Restricted Stock with market-based vesting conditions was measured based onthe fair value of the award on the grant date and recognized on a straight-line basis over the vesting period basedon the probability that the vesting conditions would be met. For 2014 Restricted Stock with market-based vestingconditions, 50% of the shares vested upon reaching a Total Enterprise Value (as defined in the applicablerestricted stock award agreement, “TEV”) of $1.4 billion on December 1, 2014 and the remaining 50% of theshares vested upon reaching a TEV of $1.8 billion on March 2, 2015. Our total compensation expense related to2014 Restricted Stock for the years ended December 31, 2016, 2015 and 2014 was $0.2 million, $0.4 million and$0.7 million, respectively.
There was $0.1 million of total unrecognized compensation cost, net of estimated forfeitures, related tounvested shares of 2014 Restricted Stock with time-based vesting conditions outstanding as of December 31,2016. The unrecognized compensation cost is expected to be recognized over a weighted average period of 1.2years as of December 31, 2016.
80

Paycom Software, Inc.Notes to the Consolidated Financial Statements
On July 8, 2015, we issued an aggregate of 741,931 restricted shares of common stock under the LTIP(“2015 Restricted Stock”) to each of our executive officers and certain non-executive employees. On April 15,2016, we issued an aggregate of 847,928 restricted shares of common stock under the LTIP (“April 2016Restricted Stock”) to each of our executive officers and certain non-executive employees. On October 4, 2016,we issued an aggregate of 721,100 restricted shares of common stock under the LTIP (“October 2016 RestrictedStock”) to each of our executive officers and certain non-executive employees. On May 2, 2016 andNovember 10, 2016, we issued an aggregate of 5,132 and 1,269 restricted shares of common stock, respectively,under the LTIP to certain members of our Board of Directors (“2016 Director Restricted Stock” and, collectivelywith all shares of 2015 Restricted Stock, April 2016 Restricted Stock and October 2016 Restricted Stock, the“Post-IPO Restricted Stock”). Certain shares of Post-IPO Restricted Stock are subject to market-based vestingconditions and certain shares of Post-IPO Restricted Stock (including all shares of 2016 Director RestrictedStock) are subject to time-based vesting conditions. Shares of Post-IPO Restricted Stock subject to time-basedvesting conditions will vest over periods ranging from approximately one to six years. Shares subject to market-based vesting conditions have vested when, or will vest if, the Company’s TEV equals or exceeds certainpredetermined thresholds. All shares of April 2016 Restricted Stock with market-based vesting conditions vestedon July 28, 2016, when the Company’s TEV reached $2.65 billion. With respect to shares of 2015 RestrictedStock with market-based vesting conditions, 50% of the shares vested on August 1, 2016, when the Company’sTEV reached $2.65 billion, and the remaining 50% of the shares will vest if the Company’s TEV equals orexceeds $3.5 billion. There was a two-trading-day gap between the vesting of April 2016 Restricted Stock andthe applicable portion of the 2015 Restricted Stock when the Company’s TEV reached $2.65 billion due todifferences in the number of shares outstanding at the respective grant dates, which affected the TEVcalculations. With respect to shares of October 2016 Restricted Stock subject to market-based vesting conditions,50% of the shares will vest if the Company’s TEV equals or exceeds $3.9 billion and 50% of the shares will vestif the Company’s TEV equals or exceeds $4.2 billion. Shares of October 2016 Restricted Stock subject tomarket-based vesting conditions will be forfeited if they do not vest within six years of the date of grant while theremaining shares of 2015 Restricted Stock subject to market-based vesting conditions are eligible for vestingindefinitely.
The following table presents a summary of the grant-date fair values of Post-IPO Restricted Stock grantedduring the years ended December 31, 2016 and 2015 and the related assumptions:
Years Ended December 31, 2016 2015
Grant-date fair value of restricted stock $23.15 - $49.34 $21.76 - $33.33Risk-free interest rates (based on U.S. Treasury Securities from 5 to 10
years maturity) 1.28% - 1.36% 2.2%Estimated volatility 21.0% - 23.0% 26.0%Expected life (in years) 2.7 3.6Dividend yield 0% 0%
Compensation expense for the shares of Post-IPO Restricted Stock with time-based vesting conditions wasmeasured based on the fair value of the underlying shares on the grant date (which was equal to the closing priceof our common stock on such grant date) and will be recognized over the requisite service periods on a straight-line basis. Compensation expense for shares of Post-IPO Restricted Stock with market-based vesting conditionswas measured based on the fair value of the underlying shares on the grant date, which ranged from $21.76 to$33.62. The fair value of each share of Post-IPO Restricted Stock with market-based vesting conditions wasestimated on the grant date using a Monte Carlo simulation model. This model considers a range of assumptionsrelated to volatility, risk-free interest rate, expected life and expected dividend yield. Expected volatilities used inthe model are based on historical volatilities of comparable guideline companies until a sufficient trading historyin our common stock exists. We are required to estimate forfeitures and only record compensation costs for thoseawards that are expected to vest.
81

Paycom Software, Inc.Notes to the Consolidated Financial Statements
The Company recognized $9.9 million of compensation cost in connection with the vesting of 490,700shares of April 2016 Restricted Stock on July 28, 2016 and $3.8 million of compensation cost in connection withthe vesting of 234,350 shares of 2015 Restricted Stock on August 1, 2016. To satisfy tax withholding obligationswith respect to the delivery of vested shares to certain employees, the Company withheld 199,128 shares of April2016 Restricted Stock that vested on July 28, 2016 and 90,703 shares of 2015 Restricted Stock that vested onAugust 1, 2016, as well as 12,593 of the 37,047 shares of 2015 Restricted Stock with time-based vestingconditions that vested on July 8, 2016. All shares withheld to satisfy tax withholding obligations are held astreasury stock.
Our total compensation expense related to Post-IPO Restricted Stock was $22.4 million and $2.6 million forthe years ended December 31, 2016 and 2015, respectively. There was $39.6 million of unrecognizedcompensation cost, net of estimated forfeitures, related to unvested shares of Post-IPO Restricted Stockoutstanding as of December 31, 2016. The unrecognized compensation cost is expected to be recognized over aweighted average period of 2.1 years as of December 31, 2016.
We capitalized stock-based compensation costs related to software developed for internal use of$1.8 million, $0.2 million and $4 thousand for the years ended December 31, 2016, 2015 and 2014, respectively.
The following table presents non-cash stock-based compensation expense resulting from employeerestricted common stock agreements and is presented in the following line items in the accompanyingconsolidated statements of income for the years ended December 31, 2016, 2015 and 2014 (dollars in thousands):
Years Ended December 31, 2016 2015 2014
Operating expense $ 2,217 $ 235 $ 32Sales and marketing 3,656 559 166Research and development 836 104 16General and administrative 15,837 2,112 498
Total non-cash stock-based compensationexpense $22,546 $3,010 $712
82

Paycom Software, Inc.Notes to the Consolidated Financial Statements
The following table presents a summary of the activity related to restricted stock for the years endedDecember 31, 2016 and 2015:
Year ended December 31, 2015Number of
shares
Weightedaverage
grant-datefair value
(in dollars)
Unvested shares of restricted stock outstanding at January 1, 2015 4,540,020 $ 0.242015 Restricted Stock granted 741,931 27.652014 Restricted Stock vested (3,287,091) 0.202015 Restricted Stock forfeited (7,805) 30.952014 Restricted Stock forfeited (7,215) 0.48
Unvested shares of restricted stock outstanding at December 31,2015 1,979,840 10.45
2016 Restricted Stock granted 1,575,429 32.142016 Restricted Stock vested (490,700) 23.152015 Restricted Stock vested (271,397) 28.072014 Restricted Stock vested (571,313) 0.312016 Restricted Stock forfeited (25,317) 36.112015 Restricted Stock forfeited (22,449) 29.432014 Restricted Stock forfeited (6,154) 0.54
Unvested shares of restricted stock outstanding at December 31,2016 2,167,939 $23.33
10. RELATED-PARTY TRANSACTIONS
We paid rent on our Dallas office space in the amounts of $0.4 million, $0.4 million and $0.3 million for theyears ended December 31, 2016, 2015 and 2014, respectively. The Dallas office building is owned by 417Oakbend, LP, a Texas limited partnership. Our Chief Sales Officer owned a .01% general partnership interest anda 10.49% limited partnership interest in 417 Oakbend, LP but sold his interest in 2016.
In accordance with the terms of the Registration Rights Agreement dated as of December 30, 2013, we paid$1.4 million of registration expenses and related legal fees on behalf of certain related parties in connection withthe underwritten secondary offerings in May, September and November 2015. The Company’s Audit Committeeapproved the payment of such expenses and fees with respect to related parties.
11. COMMITMENTS AND CONTINGENCIES
Employment Agreements
We have employment agreements with certain of our executive officers. The agreements allow for annualcompensation, participation in executive benefit plans, and performance-based cash bonuses.
Incentive Plan
On May 2, 2016, our stockholders approved the Paycom Software, Inc. Annual Incentive Plan (the“Incentive Plan”). The Incentive Plan provides for payment of incentive compensation that is not subject tocertain federal income tax deduction limitations. Participation in the Incentive Plan is limited to certain of ouremployees designated by the Compensation Committee of the Board of Directors.
83
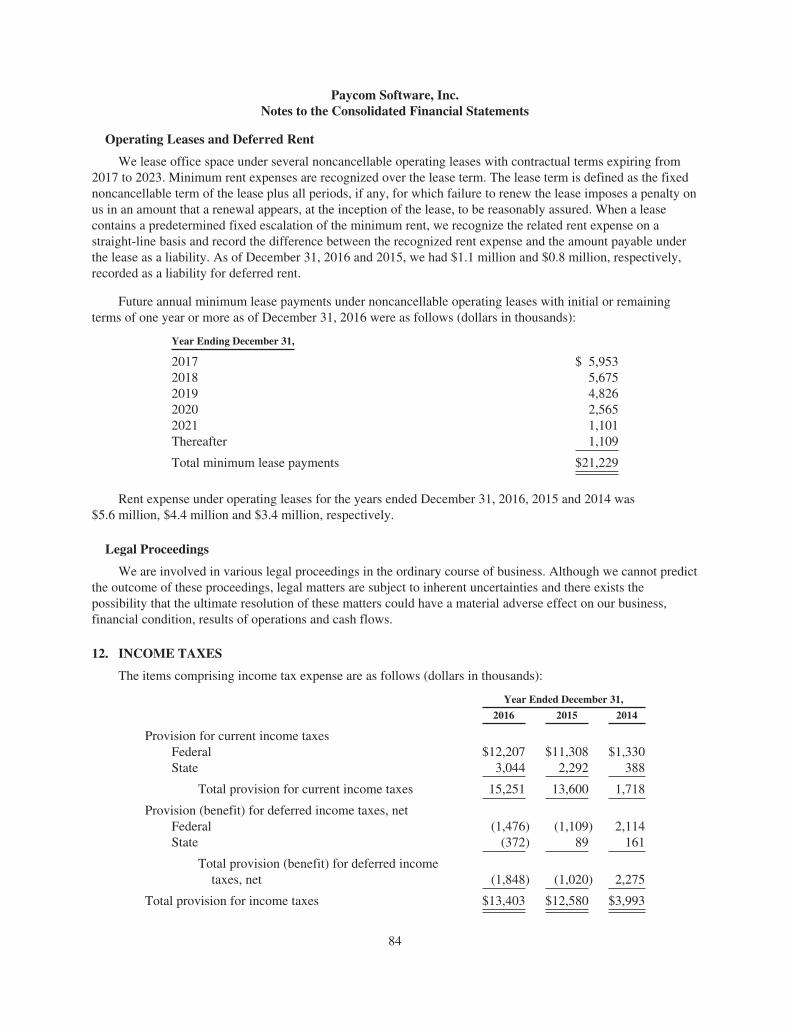
Paycom Software, Inc.Notes to the Consolidated Financial Statements
Operating Leases and Deferred Rent
We lease office space under several noncancellable operating leases with contractual terms expiring from2017 to 2023. Minimum rent expenses are recognized over the lease term. The lease term is defined as the fixednoncancellable term of the lease plus all periods, if any, for which failure to renew the lease imposes a penalty onus in an amount that a renewal appears, at the inception of the lease, to be reasonably assured. When a leasecontains a predetermined fixed escalation of the minimum rent, we recognize the related rent expense on astraight-line basis and record the difference between the recognized rent expense and the amount payable underthe lease as a liability. As of December 31, 2016 and 2015, we had $1.1 million and $0.8 million, respectively,recorded as a liability for deferred rent.
Future annual minimum lease payments under noncancellable operating leases with initial or remainingterms of one year or more as of December 31, 2016 were as follows (dollars in thousands):
Year Ending December 31,
2017 $ 5,9532018 5,6752019 4,8262020 2,5652021 1,101Thereafter 1,109
Total minimum lease payments $21,229
Rent expense under operating leases for the years ended December 31, 2016, 2015 and 2014 was$5.6 million, $4.4 million and $3.4 million, respectively.
Legal Proceedings
We are involved in various legal proceedings in the ordinary course of business. Although we cannot predictthe outcome of these proceedings, legal matters are subject to inherent uncertainties and there exists thepossibility that the ultimate resolution of these matters could have a material adverse effect on our business,financial condition, results of operations and cash flows.
12. INCOME TAXES
The items comprising income tax expense are as follows (dollars in thousands):
Year Ended December 31,
2016 2015 2014
Provision for current income taxesFederal $12,207 $11,308 $1,330State 3,044 2,292 388
Total provision for current income taxes 15,251 13,600 1,718
Provision (benefit) for deferred income taxes, netFederal (1,476) (1,109) 2,114State (372) 89 161
Total provision (benefit) for deferred incometaxes, net (1,848) (1,020) 2,275
Total provision for income taxes $13,403 $12,580 $3,993
84

Paycom Software, Inc.Notes to the Consolidated Financial Statements
The following schedule reconciles the statutory Federal tax rate to the effective income tax rate:
Year Ended December 31,
2016 2015 2014
Federal statutory tax rate 35% 35% 34%Increase (decrease) resulting from:
State income taxes, net of Federal income tax benefit 4% 4% 4%Nondeductible expenses 1% 3% 4%Research credit, Federal benefit (2%) (1%) 0%Section 199 - Qualified production activities (2%) (3%) 0%Stock-based compensation (12%) 0% 0%
Other (1%) 0% (1%)
Effective income tax rate 23% 38% 41%
Our effective income tax rate was 23% and 38% for the years ended December 31, 2016 and 2015,respectively. The lower effective income tax rate for the year ended December 31, 2016 primarily resulted fromthe recognition of excess tax benefits from share-based payment awards due to the Company’s adoption of ASU2016-09. See Note 2 under Adoption of New Pronouncements for further discussion of ASU 2016-09.
Deferred income taxes reflect the net tax effects of temporary differences between the carrying amounts ofassets and liabilities for financial reporting purposes and the amounts used for income tax purposes. Thesignificant components of our deferred tax assets and liabilities were as follows (dollars in thousands):
Year Ended December 31,
2016 2015
Deferred income tax assets (liabilities):Stock-based compensation $ 2,658 $ 1,035Investment in Paycom Payroll Holdings, LLC (1,487) (1,676)Net operating losses 36 —
Noncurrent deferred income tax assets (liabilities), net $ 1,207 $ (641)
In November 2015, the FASB issued ASU 2015-17 which we elected to early adopt on a retrospective basis.Previous to the issuance of ASU 2015-17, U.S. GAAP required an entity to separate deferred income tax assetsand liabilities into current and noncurrent amounts. To simplify the presentation of deferred income taxes, thisguidance requires that deferred tax assets and liabilities be classified as noncurrent.
At December 31, 2016, we had net operating loss carryforwards for state income tax purposes ofapproximately $36 thousand which are available to offset future state taxable income that begin expiring in 2030.
At December 31, 2016 and 2015, we had no material unrecognized tax benefits related to uncertain taxpositions.
We file income tax returns with the United States federal government and various state jurisdictions. Our2007 through 2016 U.S. federal and state income tax returns remain open to examination by tax authorities, dueto the usage of net operating loss carryovers.
85

Paycom Software, Inc.Notes to the Consolidated Financial Statements
13. SELECTED QUARTERLY FINANCIAL DATA (unaudited)
The following tables set forth selected quarterly statements of income data for the periods indicated (dollarsin thousands, except share and per share amounts):
Quarter Ended
December 31, 2016 September 30, 2016 June 30, 2016 March 31, 2016
Revenues $ 87,810 $ 77,325 $ 73,880 $ 90,126Operating income 12,681 582 16,004 28,704Net income 8,633 6,198 10,421 18,588Earnings per share, basic $ 0.15 $ 0.11 $ 0.18 $ 0.32Earnings per share, diluted $ 0.15 $ 0.10 $ 0.18 $ 0.31Weighted average shares outstanding:Basic 57,652,531 57,819,734 57,591,556 57,132,909Diluted 58,882,966 58,907,281 58,697,229 58,362,040
Quarter Ended
December 31, 2015 September 30, 2015 June 30, 2015 March 31, 2015
Revenues $ 65,118 $ 55,340 $ 48,973 $ 55,222Operating income 6,234 6,855 10,808 10,538Net income 5,157 3,847 5,946 5,995Earnings per share, basic $ 0.09 $ 0.07 $ 0.10 $ 0.11Earnings per share, diluted $ 0.09 $ 0.07 $ 0.10 $ 0.11Weighted average shares outstanding:Basic 57,109,987 57,050,684 57,038,021 54,749,951Diluted 58,365,587 58,367,830 58,369,083 56,562,661
86

Item 9. Changes in and Disagreements With Accountants on Accounting and Financial Disclosure
None.
Item 9A. Controls and Procedures
Evaluation of Disclosure Controls and Procedures
The term “disclosure controls and procedures,” as defined in Rules 13a-15(e) and 15d-15(e) under theExchange Act, refers to controls and procedures that are designed to ensure that information required to bedisclosed by a company in the reports that it files or submits under the Exchange Act is recorded, processed,summarized and reported, within the time periods specified in the SEC’s rules and forms. Disclosure controls andprocedures include, without limitation, controls and procedures designed to ensure that such information isaccumulated and communicated to a company’s management, including its principal executive and principalfinancial officers, as appropriate to allow timely decisions regarding required disclosure. We believe, however,that any controls and procedures, no matter how well designed and operated, can only provide reasonableassurance of achieving desired control objectives, and no evaluation of controls can provide absolute assurancethat all control issues and instances of fraud or error within a company, if any, have been detected.
Our management, with the participation of our chief executive officer and chief financial officer, hasevaluated the effectiveness of our disclosure controls and procedures as of December 31, 2016, the end of theperiod covered by this Form 10-K. Based upon such evaluation, our chief executive officer and chief financialofficer have concluded that our disclosure controls and procedures were effective as of such date.
Management’s Report on Internal Control Over Financial Reporting
Our management is responsible for establishing and maintaining adequate internal control over financialreporting. Our management, under the supervision and with the participation of our chief executive officer andchief financial officer, assessed the effectiveness of our internal control over financial reporting based on criteriaestablished in the 2013 Internal Control—Integrated Framework issued by the Committee of SponsoringOrganizations of the Treadway Commission (COSO). Based on this evaluation, management concluded that ourinternal control over financial reporting was effective as of December 31, 2016.
The effectiveness of our internal control over financial reporting as of December 31, 2016 has been auditedby Grant Thornton LLP, an independent registered public accounting firm, as stated in its report included below.
Changes in Internal Control Over Financial Reporting
There have been no changes in our internal control over financial reporting that occurred during the quarterended December 31, 2016 that have materially affected, or are reasonably likely to materially affect, our internalcontrol over financial reporting.
87

Independent Registered Public Accounting Firm’s Report on Internal Control over Financial Reporting
REPORT OF INDEPENDENT REGISTERED PUBLIC ACCOUNTING FIRM
Board of Directors and Stockholders
Paycom Software, Inc.
We have audited the internal control over financial reporting of Paycom Software, Inc. (a Delawarecorporation) and subsidiaries (the “Company”) as of December 31, 2016, based on criteria established in the2013 Internal Control—Integrated Framework issued by the Committee of Sponsoring Organizations of theTreadway Commission (COSO). The Company’s management is responsible for maintaining effective internalcontrol over financial reporting and for its assessment of the effectiveness of internal control over financialreporting, included in the accompanying Management’s Report on Internal Control Over Financial Reporting.Our responsibility is to express an opinion on the Company’s internal control over financial reporting based onour audit.
We conducted our audit in accordance with the standards of the Public Company Accounting OversightBoard (United States). Those standards require that we plan and perform the audit to obtain reasonable assuranceabout whether effective internal control over financial reporting was maintained in all material respects. Ouraudit included obtaining an understanding of internal control over financial reporting, assessing the risk that amaterial weakness exists, testing and evaluating the design and operating effectiveness of internal control basedon the assessed risk, and performing such other procedures as we considered necessary in the circumstances. Webelieve that our audit provides a reasonable basis for our opinion.
A company’s internal control over financial reporting is a process designed to provide reasonable assuranceregarding the reliability of financial reporting and the preparation of financial statements for external purposes inaccordance with generally accepted accounting principles. A company’s internal control over financial reportingincludes those policies and procedures that (1) pertain to the maintenance of records that, in reasonable detail,accurately and fairly reflect the transactions and dispositions of the assets of the company; (2) provide reasonableassurance that transactions are recorded as necessary to permit preparation of financial statements in accordancewith generally accepted accounting principles, and that receipts and expenditures of the company are being madeonly in accordance with authorizations of management and directors of the company; and (3) provide reasonableassurance regarding prevention or timely detection of unauthorized acquisition, use, or disposition of thecompany’s assets that could have a material effect on the financial statements.
Because of its inherent limitations, internal control over financial reporting may not prevent or detectmisstatements. Also, projections of any evaluation of effectiveness to future periods are subject to the risk thatcontrols may become inadequate because of changes in conditions, or that the degree of compliance with thepolicies or procedures may deteriorate.
In our opinion, the Company maintained, in all material respects, effective internal control over financialreporting as of December 31, 2016, based on criteria established in the 2013 Internal Control—IntegratedFramework issued by COSO.
We also have audited, in accordance with the standards of the Public Company Accounting Oversight Board(United States), the consolidated financial statements of the Company as of and for the year ended December 31,2016, and our report dated February 21, 2017 expressed an unqualified opinion on those financial statements.
/s/ GRANT THORNTON LLP
Oklahoma City, OklahomaFebruary 21, 2017
88

Item 10. Directors, Executive Officers and Corporate Governance
The information required in response to this Item 10 is incorporated herein by reference to our DefinitiveProxy Statement to be filed with the SEC pursuant to Regulation 14A of the Exchange Act not later than 120days after the end of the fiscal year covered by this Annual Report on Form 10-K.
Item 11. Executive Compensation
The information required in response to this Item 11 is incorporated herein by reference to our DefinitiveProxy Statement to be filed with the SEC pursuant to Regulation 14A of the Exchange Act not later than 120days after the end of the fiscal year covered by this Annual Report on Form 10-K.
Item 12. Security Ownership of Certain Beneficial Owners and Management and Related StockholderMatters
The information required in response to this Item 12 is incorporated herein by reference to our DefinitiveProxy Statement to be filed with the SEC pursuant to Regulation 14A of the Exchange Act not later than 120days after the end of the fiscal year covered by this Annual Report on Form 10-K.
Item 13. Certain Relationships and Related Transactions, and Director Independence
The information required in response to this Item 13 is incorporated herein by reference to our DefinitiveProxy Statement to be filed with the SEC pursuant to Regulation 14A of the Exchange Act not later than 120days after the end of the fiscal year covered by this Annual Report on Form 10-K.
Item 14. Principal Accounting Fees and Services
The information required in response to this Item 14 is incorporated herein by reference to our DefinitiveProxy Statement to be filed with the SEC pursuant to Regulation 14A of the Exchange Act not later than 120days after the end of the fiscal year covered by this Annual Report on Form 10-K.
Item 15. Exhibits, Financial Statement Schedules
(a) Documents filed as part of this Form 10-K
(1) Consolidated Financial Statements: The following consolidated financial statements of PaycomSoftware, Inc., together with the report thereon, of Grant Thornton LLP, our Independent RegisteredPublic Accounting Firm, are included in Part II, Item 8 of this Form 10-K:
Consolidated Balance Sheets as of December 31, 2016 and 2015
Consolidated Statements of Income, Years Ended December 31, 2016, 2015 and 2014
Consolidated Statements of Stockholders’ Equity, Years Ended December 31, 2016, 2015 and 2014
Consolidated Statements of Cash Flows, Years Ended December 31, 2016, 2015 and 2014
Notes to Consolidated Financial Statements
(2) Financial Statement Schedules: Financial statement schedules have been omitted as informationrequired is inapplicable or the information is presented in the consolidated financial statements and therelated notes.
89

(3) Exhibits:
The following exhibits are included herein or incorporated herein by reference:
Exhibit No. Description
2.1 Merger Agreement, by and among Paycom Software, Inc., Paycom Payroll Holdings, LLC,Paycom Payroll, LLC and Paycom Merger Sub, LLC, dated December 30, 2013(incorporated by reference to Exhibit 2.4 to the Company’s Registration Statement on FormS-1 dated March 10, 2014, filed with the SEC on March 10, 2014).
2.2 Contribution Agreement, by and between WCAS Capital Partners, IV L.P. and PaycomSoftware, Inc., dated December 30, 2013 (incorporated by reference to Exhibit 2.5 to theCompany’s Registration Statement on Form S-1 dated March 10, 2014, filed with the SEC onMarch 10, 2014).
2.3 Contribution Agreement, by and among Welsh, Carson, Anderson & Stowe X, L.P., WCASManagement Corporation and Paycom Software, Inc., dated December 30, 2013(incorporated by reference to Exhibit 2.6 to the Company’s Registration Statement on FormS-1 dated March 10, 2014, filed with the SEC on March 10, 2014).
2.4 Contribution Agreement, by and among Paycom Software, Inc. and each of the signatoriesthereto, dated December 30, 2013 (incorporated by reference to Exhibit 2.7 to the Company’sRegistration Statement on Form S-1 dated March 10, 2014, filed with the SEC on March 10,2014).
3.1 Amended and Restated Certificate of Incorporation of Paycom Software, Inc. (incorporatedby reference to Exhibit 3.1 to the Company’s Amendment No. 1 to the Registration Statementon Form S-1/A dated March 31, 2014, filed with the SEC on March 31, 2014).
3.2 Amended and Restated Bylaws of Paycom Software, Inc. (incorporated by reference toExhibit 3.2 to the Company’s Quarterly Report on Form 10-Q for the quarter endedSeptember 30, 2015, filed with the SEC on November 6, 2015).
4.1 Form of Common Stock Certificate (incorporated by reference to Exhibit 4.1 to theCompany’s Amendment No. 1 to the Registration Statement on Form S-1/A dated March 31,2014, filed with the SEC on March 31, 2014).
4.2 Registration Rights Agreement (incorporated by reference to Exhibit 4.3 to the Company’sRegistration Statement on Form S-1 dated March 10, 2014, filed with the SEC on March 10,2014).
4.3 Joinder to Registration Rights Agreement, by and among Paycom Software, Inc. and each ofthe signatories thereto, dated as of March 6, 2015 (incorporated by reference to Exhibit 4.6 tothe Company’s Quarterly Report on Form 10-Q for the quarter ended March 31, 2015, filedwith the SEC on May 13, 2015).
4.4 Amendment No. 1 to the Registration Rights Agreement, by and among Paycom Software,Inc. and each of the signatories thereto, dated as of May 13, 2015 (incorporated by referenceto Exhibit 4.7 to the Company’s Quarterly Report on Form 10-Q for the quarter endedJune 30, 2015, filed with the SEC on August 7, 2015).
4.5 Joinder to Registration Rights Agreement, by and between Paycom Software, Inc. and theMackesy Family Foundation, dated as of May 27, 2015 (incorporated by reference to Exhibit4.9 to the Company’s Quarterly Report on Form 10-Q for the quarter ended September 30,2015, filed with the SEC on November 6, 2015).
90

Exhibit No. Description
4.6 Joinder to Registration Rights Agreement, by and between Paycom Software, Inc. andAnthony & Christie de Nicola Foundation, dated as of August 13, 2015 (incorporated byreference to Exhibit 4.11 to the Company’s Quarterly Report on Form 10-Q for the quarterended September 30, 2015, filed with the SEC on November 6, 2015).
4.7 Amendment No. 2 to Registration Rights Agreement, by and between Paycom Software, Inc.and each of the signatories thereto, dated as of September 15, 2015 (incorporated byreference to Exhibit 4.12 to the Company’s Quarterly Report on Form 10-Q for the quarterended September 30, 2015, filed with the SEC on November 6, 2015).
4.8 Joinder to Registration Rights Agreement, by and between Paycom Software, Inc. and TheSwani Family Foundation, dated as of October 13, 2015 (incorporated by reference to Exhibit4.14 to the Company’s Quarterly Report on Form 10-Q for the quarter ended September 30,2015, filed with the SEC on November 6, 2015).
4.9 Joinder to Registration Rights Agreement, by and between Paycom Software, Inc. and Paul &Anne-Marie Queally Family Foundation, dated as of October 13, 2015 (incorporated byreference to Exhibit 4.16 to the Company’s Quarterly Report on Form 10-Q for the quarterended September 30, 2015, filed with the SEC on November 6, 2015).
4.10 Joinder to Registration Rights Agreement, by and between Paycom Software, Inc. and ScullyFamily Charitable Foundation, dated as of December 2, 2015 (incorporated by reference toExhibit 4.18 to the Company’s Annual Report on Form 10-K for the year endedDecember 31, 2015, filed with the SEC on February 22, 2016).
10.1+ Form of Indemnification Agreement between Paycom Software, Inc. and each of its directorsand executive officers (incorporated by reference to Exhibit 10.1 to the Company’sRegistration Statement on Form S-1 dated March 10, 2014, filed with the SEC on March 10,2014).
10.2+ Paycom Software, Inc. 2014 Long-Term Incentive Plan (incorporated by reference to Exhibit10.2 to the Company’s Registration Statement on Form S-1 dated March 10, 2014, filed withthe SEC on March 10, 2014).
10.2.1 Form of Restricted Stock Award Agreement (Post-IPO) (incorporated by reference to Exhibit10.3 to the Company’s Registration Statement on Form S-1 dated March 10, 2014, filed withthe SEC on March 10, 2014).
10.2.2 Form of Restricted Stock Award Agreement for Non-Executives (incorporated by referenceto Exhibit 10.4 to the Company’s Amendment No. 1 to the Registration Statement on FormS-1/A dated March 31, 2014, filed with the SEC on March 31, 2014).
10.2.3+ Form of Restricted Stock Award Agreement for Executives with Employment Agreements(incorporated by reference to Exhibit 10.5 to the Company’s Amendment No. 1 to theRegistration Statement on Form S-1/A dated March 31, 2014, filed with the SEC onMarch 31, 2014).
10.2.4+ Form of Restricted Stock Award Agreement for Chief Executive Officer (incorporated byreference to Exhibit 10.6 to the Company’s Amendment No. 1 to the Registration Statementon Form S-1/A dated March 31, 2014, filed with the SEC on March 31, 2014).
10.2.5+ Form of Incentive Stock Option Agreement under the Paycom Software, Inc. 2014 Long-Term Incentive Plan (incorporated by reference to Exhibit 10.1 to the Company’s CurrentReport on Form 8-K dated March 25, 2015, filed with the SEC on March 30, 2015).
91

Exhibit No. Description
10.2.6+ Form of Nonqualified Stock Option Agreement under the Paycom Software, Inc. 2014 Long-Term Incentive Plan (incorporated by reference to Exhibit 10.2 to the Company’s CurrentReport on Form 8-K dated March 25, 2015, filed with the SEC on March 30, 2015).
10.2.7+ Form of CEO Market-Based Vesting Restricted Stock Award Agreement under the PaycomSoftware, Inc. 2014 Long-Term Incentive Plan (incorporated by reference to Exhibit 10.1 tothe Company’s Current Report on Form 8-K dated July 8, 2015, filed with the SEC onJuly 10, 2015).
10.2.8+ Form of Market-Based Vesting Restricted Stock Award Agreement under the PaycomSoftware, Inc. 2014 Long-Term Incentive Plan (incorporated by reference to Exhibit 10.2 tothe Company’s Current Report on Form 8-K dated July 8, 2015, filed with the SEC onJuly 10, 2015).
10.2.9 Form of Time and Market-Based Vesting Restricted Stock Award Agreement under thePaycom Software, Inc. 2014 Long-Term Incentive Plan (incorporated by reference to Exhibit10.3 to the Company’s Current Report on Form 8-K dated July 8, 2015, filed with the SEC onJuly 10, 2015).
10.2.10 Form of Time Delayed and Market-Based Vesting Restricted Stock Award Agreement underthe Paycom Software, Inc. 2014 Long-Term Incentive Plan (incorporated by reference toExhibit 10.4 to the Company’s Current Report on Form 8-K dated July 8, 2015, filed with theSEC on July 10, 2015).
10.2.11 Form of Time-Based Vesting Restricted Stock Award Agreement under the PaycomSoftware, Inc. 2014 Long-Term Incentive Plan (incorporated by reference to Exhibit 10.5 tothe Company’s Current Report on Form 8-K dated July 8, 2015, filed with the SEC onJuly 10, 2015).
10.2.12+ Form of CEO Market-Based Vesting Restricted Stock Award Agreement under the PaycomSoftware, Inc. 2014 Long-Term Incentive Plan (incorporated by reference to Exhibit 10.1 tothe Company’s Current Report on Form 8-K dated April 15, 2016, filed with the SEC onApril 21, 2016).
10.2.13+ Form of Market-Based Vesting Restricted Stock Award Agreement under the PaycomSoftware, Inc. 2014 Long-Term Incentive Plan (incorporated by reference to Exhibit 10.2 tothe Company’s Current Report on Form 8-K dated April 15, 2016, filed with the SEC onApril 21, 2016).
10.2.14 Form of Time and Market-Based Vesting Restricted Stock Award Agreement under thePaycom Software, Inc. 2014 Long-Term Incentive Plan (incorporated by reference to Exhibit10.3 to the Company’s Current Report on Form 8-K dated April 15, 2016, filed with the SECon April 21, 2016).
10.2.15 Form of Time-Based Vesting Restricted Stock Award Agreement under the PaycomSoftware, Inc. 2014 Long-Term Incentive Plan (incorporated by reference to Exhibit 10.4 tothe Company’s Current Report on Form 8-K dated April 15, 2016, filed with the SEC onApril 21, 2016).
10.2.16+ Form of CEO Market-Based Vesting Restricted Stock Award Agreement under the PaycomSoftware, Inc. 2014 Long-Term Incentive Plan, approved October 4, 2016 (incorporated byreference to Exhibit 10.1 to the Company’s Current Report on Form 8-K dated October 4,2016, filed with the SEC on October 6, 2016).
92
Exhibit No. Description
10.2.17+ Form of Market-Based Vesting Restricted Stock Award Agreement under the PaycomSoftware, Inc. 2014 Long-Term Incentive Plan, approved October 4, 2016 (incorporated byreference to Exhibit 10.2 to the Company’s Current Report on Form 8-K dated October 4,2016, filed with the SEC on October 6, 2016).
10.2.18 Form of Time and Market-Based Vesting Restricted Stock Award Agreement under thePaycom Software, Inc. 2014 Long-Term Incentive Plan, approved October 4, 2016(incorporated by reference to Exhibit 10.3 to the Company’s Current Report on Form 8-Kdated October 4, 2016, filed with the SEC on October 6, 2016).
10.3+ Executive Employment Agreement by and between Paycom Payroll Holdings, LLC and ChadRichison, dated December 30, 2013 (incorporated by reference to Exhibit 10.4 to theCompany’s Registration Statement on Form S-1 dated March 10, 2014, filed with the SEC onMarch 10, 2014).
10.4+ Executive Employment Agreement by and between Paycom Payroll Holdings, LLC andCraig E. Boelte, dated December 30, 2013 (incorporated by reference to Exhibit 10.5 to theCompany’s Registration Statement on Form S-1 dated March 10, 2014, filed with the SEC onMarch 10, 2014).
10.5+ Executive Employment Agreement by and between Paycom Payroll Holdings, LLC andJeffrey D. York, dated December 30, 2013 (incorporated by reference to Exhibit 10.6 to theCompany’s Registration Statement on Form S-1 dated March 10, 2014, filed with the SEC onMarch 10, 2014).
10.6+ Executive Employment Agreement by and between Paycom Payroll Holdings, LLC andWilliam X. Kerber III, dated December 30, 2013 (incorporated by reference to Exhibit 10.7to the Company’s Registration Statement on Form S-1 dated March 10, 2014, filed with theSEC on March 10, 2014).
10.7+ Paycom Software, Inc. Annual Incentive Plan (incorporated by reference to Exhibit 10.2 tothe Company’s Current Report on Form 8-K dated May 5, 2015, filed with the SEC onMay 8, 2015).
10.8 Paycom Software, Inc. Employee Stock Purchase Plan (incorporated by reference to Exhibit10.1 to the Company’s Current Report on Form 8-K dated May 5, 2015, filed with the SECon May 8, 2015).
10.9 Consolidated, Amended and Restated Loan Agreement, by and between Kirkpatrick Bankand Paycom Payroll, LLC, dated December 15, 2011 (incorporated by reference to Exhibit10.8 to the Company’s Registration Statement on Form S-1 dated March 10, 2014, filed withthe SEC on March 10, 2014).
10.9.1 First Loan Modification Agreement, by and between Kirkpatrick Bank and Paycom Payroll,LLC, dated December 31, 2013 (incorporated by reference to Exhibit 10.1 to the Company’sQuarterly Report on Form 10-Q for the quarter ended June 30, 2014, filed with the SEC onAugust 8, 2014).
10.9.2 Second Loan Modification Agreement, by and between Kirkpatrick Bank and PaycomPayroll, LLC, dated June 17, 2014 (incorporated by reference to Exhibit 10.2 to theCompany’s Quarterly Report on Form 10-Q for the quarter ended June 30, 2014, filed withthe SEC on August 8, 2014).
10.9.3 4.75% Consolidated, Amended, Restated and Increased Promissory Note, by and betweenKirkpatrick Bank and Paycom Payroll, LLC, dated June 17, 2014 (incorporated by referenceto Exhibit 10.3 to the Company’s Quarterly Report on Form 10-Q for the quarter endedJune 30, 2014, filed with the SEC on August 8, 2014).
93

Exhibit No. Description
10.10 Loan Agreement, by and between Kirkpatrick Bank and Paycom Payroll, LLC, datedMay 13, 2015 (incorporated by reference to Exhibit 10.3 to the Company’s Quarterly Reporton Form 10-Q for the quarter ended June 30, 2015, filed with the SEC on August 7, 2015).
10.10.1 Promissory Note, by and between Kirkpatrick Bank and Paycom Payroll, LLC, datedMay 13, 2015 (incorporated by reference to Exhibit 10.1 to the Company’s Quarterly Reporton Form 10-Q for the quarter ended September 30, 2016, filed with the SEC on November 3,2016).
10.10.2 First Modification to Loan Agreement, by and between Kirkpatrick Bank and PaycomPayroll, LLC (incorporated by reference to Exhibit 10.2 to the Company’s Quarterly Reporton Form 10-Q for the quarter ended September 30, 2016, filed with the SEC on November 3,2016).
10.10.3 Second Modification to Loan Agreement, by and between Kirkpatrick Bank and PaycomPayroll, LLC, dated August 2, 2016 (incorporated by reference to Exhibit 10.3 to theCompany’s Quarterly Report on Form 10-Q for the quarter ended September 30, 2016, filedwith the SEC on November 3, 2016).
10.11 Loan Agreement, by and between Kirkpatrick Bank and Paycom Payroll, LLC, datedAugust 2, 2016 (incorporated by reference to Exhibit 10.4 to the Company’s Quarterly Reporton Form 10-Q for the quarter ended September 30, 2016, filed with the SEC on November 3,2016).
10.11.1 Promissory Note, by and between Kirkpatrick Bank and Paycom Payroll, LLC, datedAugust 2, 2016 (incorporated by reference to Exhibit 10.5 to the Company’s Quarterly Reporton Form 10-Q for the quarter ended September 30, 2016, filed with the SEC on November 3,2016).
21.1* List of subsidiaries of the Company
23.1* Consent of Independent Registered Public Accounting Firm
31.1* Certification of the Chief Executive Officer of the Company, pursuant to the Section 302 ofthe Sarbanes-Oxley Act of 2002.
31.2* Certification of the Chief Financial Officer of the Company, pursuant to Section 302 of theSarbanes-Oxley Act of 2002.
32.1** Certification of the Chief Executive Officer and Chief Financial Officer of the Company,pursuant to Section 906 of the Sarbanes-Oxley Act of 2002.
101.INS* XBRL Instance Document.
101.SCH* XBRL Taxonomy Extension Schema Document
101.CAL* XBRL Taxonomy Extension Calculation Linkbase Document
101.DEF* XBRL Taxonomy Extension Definition Linkbase Document
101.LAB* XBRL Taxonomy Extension Label Linkbase Document
101.PRE* XBRL Taxonomy Extension Presentation Linkbase Document
+ Management contract or compensatory plan or arrangement.* Filed herewith.** The certifications attached as Exhibit 32.1 are not deemed “filed” with the SEC and are not to be incorporatedby reference into any filing of Paycom Software, Inc. under the Securities Act or the Exchange Act, whethermade before or after the date of this Annual Report on Form 10-K, irrespective of any general incorporationlanguage contained in such filing.
94

SIGNATURES
Pursuant to the requirements of the Securities Exchange Act of 1934, the registrant has duly caused thisreport to be signed on its behalf by the undersigned thereunto duly authorized.
Date: February 21, 2017
PAYCOM SOFTWARE, INC.
By: /s/ Chad Richison
Chad RichisonPresident and Chief Executive Officer(Principal Executive Officer and duly authorizedofficer)
Pursuant to the requirements of the Securities Exchange Act of 1934, this report has been signed below bythe following persons on behalf of the registrant and in the capacities and on the date indicated.
Date: February 21, 2017
/s/ Chad Richison
Chad RichisonPresident, Chief Executive Officer and Chairman of the Boardof Directors(Principal Executive Officer)
/s/ Craig E. Boelte
Craig E. BoelteChief Financial Officer(Principal Accounting Officer and Principal Financial Officer)
/s/ Jason D. Clark
Jason D. ClarkDirector
/s/ Henry C. Duques
Henry C. DuquesDirector
/s/ Robert J. Levenson
Robert J. LevensonDirector
/s/ Larry V. Parman
Larry V. ParmanDirector
/s/ Frederick C. Peters II
Frederick C. Peters IIDirector
/s/ J.C. Watts, Jr.
J.C. Watts, Jr.Director
95

The Oklahoman’s Top WorkplacesPaycom earned the title of the Top Workplace in Oklahoma for 2016 by The Oklahoman. Now on the list for a fourth consecutive year, Paycom earned the distinction based solely on the results of an employee feedback survey.
The Oklahoman’s Direction AwardPaycom received this special recognition in The Oklahoman’s Top Workplaces program based on feedback from employees who believe the company is going in the right direction.
Deloitte’s Technology Fast 500™
Paycom ranked No. 364 on Deloitte’s Technology Fast 500™, a list of the 500 fastest-growing technology, media, telecommunica-tions, life sciences and energy tech companies in North America. Paycom earned a spot on the coveted list after experiencing 192 percent revenue growth during the time period considered.
The Journal Record’s Excellence in Financial Stewardship AwardPaycom’s Chief Financial Officer, Craig Boelte, was honored by The Journal Record with a 2016 Financial Stewardship Award in the public company category. The accolade honors business leaders who demonstrate great leadership and dedication to their companies and communities.
2017 ANNUAL MEETINGThe annual meeting of stockholders will be held Monday, May 1, 2017, at Gaillardia.
5300 Gaillardia Blvd.Oklahoma City, OK 73142
INVESTOR RELATIONS For more information about Paycom, please email [email protected] or call (855) 603-1620.
Paycom Software, Inc. financial information can be accessed at investors.paycom.com.
Achievers 50 Most Engaged Workforces™
Recognized as one of Achievers 50 Most Engaged Workplaces™ for 2016, Paycom was selected based on an evaluation of eight elements: communication, leadership, culture, rewards and rec-ognition, professional and personal growth, accountability and performance, vision and values, and corporate social responsibil-ity. The annual award honors employers that display leadership and innovation in engaging their workplaces.
Chief Learning Officer® Magazine’s Business Impact AwardPaycom’s Director of Sales Training, Jessica Melo, was awarded bronze in the business impact category of Chief Learning Officer® magazine’s 2016 Learning in Practice Awards. We believe this achievement is a reflection of Paycom’s strong leadership and technology initiatives with the utilization of Paycom Learning, Paycom’s learning management software.
Communication Director Magazine’s North American Excellence AwardPaycom’s Affordable Care Act (ACA) awareness campaign was shortlisted in the content marketing category by Communication Director magazine. Paycom’s campaign was designed to update businesses across the country about one of the most complicat-ed pieces of health care legislation in history, and to empower them to take control of their compliance needs through Paycom’s Enhanced ACA application and numerous other resources.
2016SPECIALDISTINCTIONS

7501 W. Memorial Road | Oklahoma City, OK 73142800.580.4505 | 405.722.6900 | Paycom.com