10 Social Tips for HR Pros and Recruiters to Help You Navigate the Social Waters
Upload
kris-dunnCategory
view
4.148download
0
The 5 BEST HR PLAYS For Business
Intelligence (BI) and Big Data
Presenter Info• Kris Dunn• CHRO at Kinetix (RPO, Recruiting)• Founder of Fistful of Talent , The HR
Capitalist • Hoops Junkie
• Steve Boese• Co-Chair HR Technology Conference • HR Exec Magazine Technology Editor• Host of HR Happy Hour Show and
Podcast• BBQ Aficionado
#ThoughtSpot


#1 – Predicting Turnover
• #1 All Time post on the HR Capitalist – Turnover Calculator
• Most of us are reporting turnover, but we’re not predicting it.
• Reporting turnover is a start.
• Turnover is the biggest lever you have to getting organizational change that is friendly to talent – often from leaders that are hostile to HR and recruiting.
• Always start any data play using turnover with no less than a year’s worth of data.

3 Ways to Experiment with Turnover Prediction
1. Project Turnover for Next Month/Quarter based on annualized run rates.
2. Pick the variable(s) you think has the most juice and add it as an influencing factor (example – You think a mix of tenure, comp-ratios and size of last increase impact turnover. You study and implement it into your reporting.) Note that the best way to find influencing factors is to study what’s happened in the past.
3. Buy a solution that has a turnover predictor (starting to trickle into marketplace)…

#2 – Hiring Manager Batting Average
• Have you ever had a hiring manger who:– Was awful at interviewing and making
hiring decisions, and/or;
– Couldn’t keep good talent once she onboarded it?
• You know who your best hiring managers are – in interviewing, marketing the company to candidates, making the right offer and giving them what they need once they’re part of the team…
• It only stands to reason you should be reporting on that...
How to Calculate Hiring Manager Batting Average (HMBA)
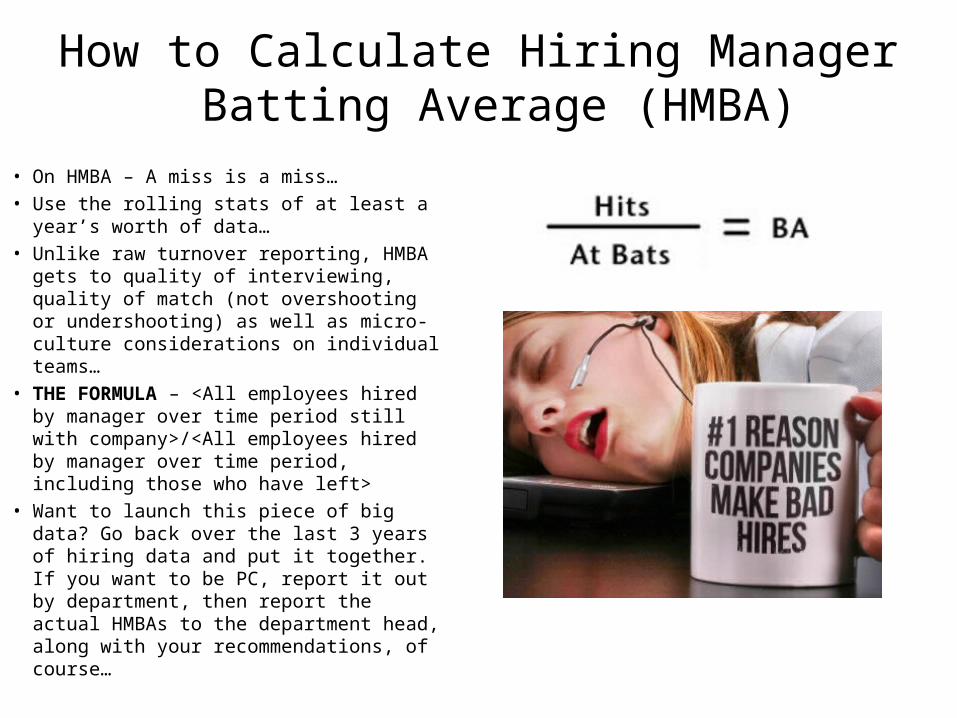
• On HMBA – A miss is a miss…• Use the rolling stats of at least a year’s worth
of data…• Unlike raw turnover reporting, HMBA gets to
quality of interviewing, quality of match (not overshooting or undershooting) as well as micro-culture considerations on individual teams…
• THE FORMULA – <All employees hired by manager over time period still with company>/<All employees hired by manager over time period, including those who have left>
• Want to launch this piece of big data? Go back over the last 3 years of hiring data and put it together. If you want to be PC, report it out by department, then report the actual HMBAs to the department head, along with your recommendations, of course…

#3 – Salary Cap Utilization• When it comes to managing headcount
dollars and FTEs, there are 3 universal truths:1. HR Departments report FTEs more than
they report $$$
2. Business leaders long for max autonomy. FTE reporting is the opposite of this…
3. Most people are familiar with the sports world concept of a “salary cap”.
• In moving to reporting on company and departmental “salary caps,” smart HR departments focus on flexibility and consultative solutions, which make them an “assassin” instead of a “cop.”

How to Report Headcount Via Salary Cap Utilization
• Salary Cap (per department or by manager with large spans of control) = Budget Salary Dollars for month/year (recommend month to month breakout)
• Salary Cap Utilization = % of Salary Cap spent for month.
• Report month and chart trend. Report headcount if needed but eliminate budgeted headcount – just report actuals
• Call it the “Salary Cap”
• Makes HR consultative via flexibility with the following topics – merit increases, equity increases, offers above budgeted amount, retention of high priced talent vs. performance expected, etc.
• “Can you reinvent your department with the same cap number?”
• “You want to do something new? What are you willing to give up?”
• You want to give an average of 8% on merit increases in your department? Are you willing to lay people of to do it? Will your business run the same? What will you get back related to performance?

#4 – Revenue Per Employee (RPE)• Think all the talk about a set of 20 metrics is
white noise?
• Cut to the chase and report the biggest data lever you have at your disposal – Revenue Per Employee (RPE)
• RPE seamlessly merges what’s most important to most of you – the performance and effectiveness of people – with what’s most important to the people who employ you – the financial health of the business as noted by top-line revenue.
• Use to drive attention and partnership with any autonomous business unit or product line delivering significant revenue.
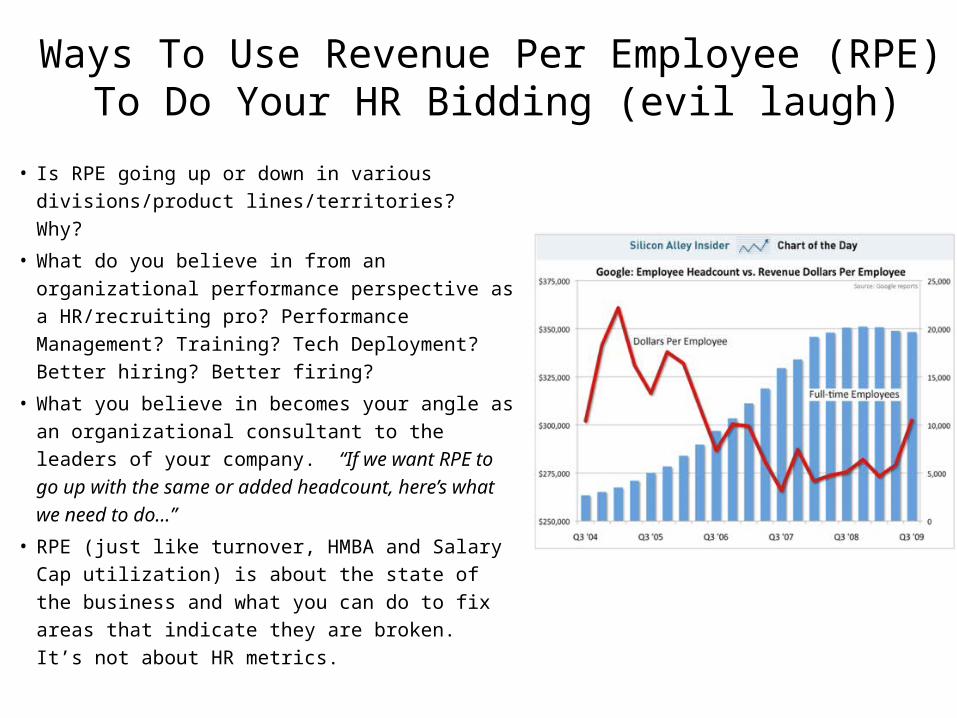
• Best practice in presentation appears to the left – bar chart for revenue by quarter with line graph of total headcount.
Ways To Use Revenue Per Employee (RPE) To Do Your HR Bidding (evil laugh)
• Is RPE going up or down in various divisions/product lines/territories? Why?
• What do you believe in from an organizational performance perspective as a HR/recruiting pro? Performance Management? Training? Tech Deployment? Better hiring? Better firing?
• What you believe in becomes your angle as an organizational consultant to the leaders of your company. “If we want RPE to go up with the same or added headcount, here’s what we need to do…”
• RPE (just like turnover, HMBA and Salary Cap utilization) is about the state of the business and what you can do to fix areas that indicate they are broken. It’s not about HR metrics.
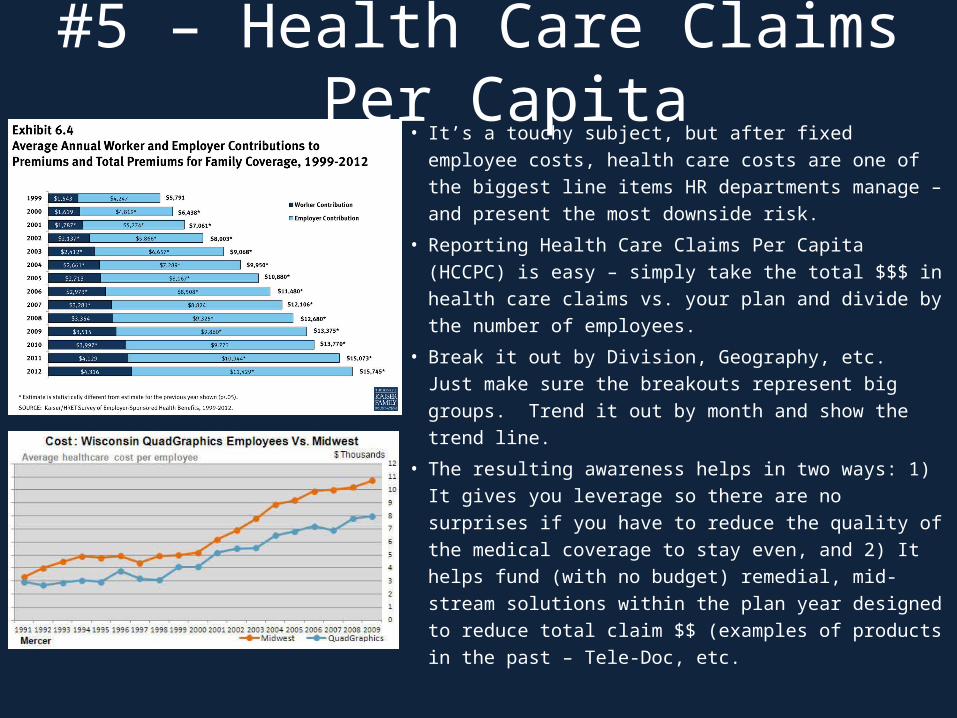
#5 – Health Care Claims Per Capita• It’s a touchy subject, but after fixed employee costs,
health care costs are one of the biggest line items HR departments manage – and present the most downside risk.
• Reporting Health Care Claims Per Capita (HCCPC) is easy – simply take the total $$$ in health care claims vs. your plan and divide by the number of employees.
• Break it out by Division, Geography, etc. Just make sure the breakouts represent big groups. Trend it out by month and show the trend line.
• The resulting awareness helps in two ways: 1) It gives you leverage so there are no surprises if you have to reduce the quality of the medical coverage to stay even, and 2) It helps fund (with no budget) remedial, mid-stream solutions within the plan year designed to reduce total claim $$ (examples of products in the past – Tele-Doc, etc.

Kris:[email protected]: @kris_dunnLinkedIn: www.linkedin.com/in/krisdunn
Steve:[email protected] Twitter: @SteveBoeseLinkedIn: https://www.linkedin.com/in/steveboese