40 of Palm Springs
29
40 City of Palm Springs Demuth Park The 60 acre Demuth Park is Palm Springs’ largest developed park. It provides a range of facilities that include playgrounds, picnic areas, and open lawns for more passive use, and tennis courts, ball diamonds, and multi‐purpose fields for active sports. There is a golf course to the south of the park, and the Demuth Community Center to the west. Because this large park is heavily used, a series of traffic mitigations and parking improvements have been completed along its northern boundary where residential neighborhoods lie directly across Mesquite Avenue. While this park contributes mightily to the recreational needs of Palm Springs residents, it has been developed in a piecemeal fashion over the years and has functional issues due to lack of planning. While restrooms are available throughout the park, these are not necessarily located in the best places to serve park users, especially younger participants in youth sports, who must be escorted to the restrooms or not allowed to go there on their own due to the lack of ability to monitor them from parts of the park. Proposals for reconfiguration of Demuth Park were prepared in 2009 as part of this master plan and will be presented elsewhere in the document. The 2013 site visit showed improvements to the picnic grounds, removal of a previous low scoring playground and the addition of a very nice community garden space adjacent to the Demuth Community Center. Desert Healthcare Wellness Park Desert Healthcare Wellness Park is a five‐acre site located just north of Ruth Hardy Park. Developed in conjunction with the Desert Healthcare District, the park’s attractive gardens and paths entice people in for exercise and emotional well‐being. The park exhibits the beauty of the desert landscape aesthetic while offering an attractive place to exercise using specialized fitness equipment built into the site. This park seems to be perfectly suited to its intended purpose, and needs no improvements other than routine maintenance.
Transcript of 40 of Palm Springs

40 City of Palm Springs
Demuth Park The 60 acre Demuth Park is Palm Springs’ largest developed park. It provides a range of facilities that include playgrounds, picnic areas, and open lawns for more passive use, and tennis courts, ball diamonds, and multi‐purpose fields for active sports. There is a golf course to the south of the park, and the Demuth Community Center to the west. Because this large park is heavily used, a series of traffic mitigations and parking improvements have been completed along its northern boundary where
residential neighborhoods lie directly across Mesquite Avenue. While this park contributes mightily to the recreational needs of Palm Springs residents, it has been developed in a piecemeal fashion over the years and has functional issues due to lack of planning. While restrooms are available throughout the park, these are not necessarily located in the best places to serve park users, especially younger participants in youth sports, who must be escorted to the restrooms or not allowed to go there on their own due to the lack of ability to monitor them from parts of the park. Proposals for reconfiguration of Demuth Park were prepared in 2009 as part of this master plan and will be presented elsewhere in the document. The 2013 site visit showed improvements to the picnic grounds, removal of a previous low scoring playground and the addition of a very nice community garden space adjacent to the Demuth Community Center.
Desert Healthcare Wellness Park Desert Healthcare Wellness Park is a five‐acre site located just north of Ruth Hardy Park. Developed in conjunction with the Desert Healthcare District, the park’s attractive gardens and paths entice people in for exercise and emotional well‐being. The park exhibits the beauty of the desert landscape aesthetic while offering an attractive place to exercise using specialized fitness equipment built into the site. This park seems to be perfectly suited to its intended purpose, and needs no improvements other than routine maintenance.

Parks and Recreation Master Plan ‐ DRAFT 41
Desert Highland Park Situated at the far north end of the developed part of Palm Springs, this 18‐acre park is the home of the Desert Highland Unity Center, a ball diamond, basketball courts, playground, and other park amenities. Approximately a third of the site is undeveloped. This park’s location is both a benefit and a liability. Being on the far edge of the city, it is somewhat distanced from residents other than those within its immediate neighborhood. However, this is a distinct benefit to the neighborhood, because the distance
to other parks and facilities makes this park more important to them. The primary drawback to this location, however, is that it is subject to notoriously windy conditions at times. The impressive wind farm that serves as the park’s backdrop is a testimony to the windiness of this site. The fact that the land around it is undeveloped serves to emphasize the park’s isolation and exposure to the elements. Vandalism, especially in the form of dumping of trash on the undeveloped parts of the park, is a problem at this site. Future plans for development around this site include a proposed solar collector farm and a community college. Given the undetermined nature of these plans, it is difficult to envision what modifications to this site would be appropriate, but ideas were developed in conjunction with the 2009 portion of this master plan. The site is an important one and critical to serving the needs of Palm Springs, but determining exactly how it can best serve the city may need to wait for a better understanding of its ultimate context. Meanwhile, its function as a home for the Unity Center, and as a much‐needed park for this part of the community, should be preserved and enhanced as much as possible. Downtown Experience While not a park in the traditional sense, the Parks Department utilizes what is identified in this inventory as the “Downtown Experience.” In addition to maintaining the palm trees, plantings and banners along Palm Canyon Drive in the downtown area, the city also utilizes the ability to block off the street for various special events such as VillageFest. Numerous public art pieces are also located within the Downtown Experience.

42 City of Palm Springs
The somewhat temporary placement of the art piece “Forever Marilyn” has attracted visitors since 2012 to the corner of Palm Canyon Drive and Tahquitz Canyon Way. Finally, the area also includes the historic Village Green Heritage Center. The Village Green Heritage Center is a 0.4‐acre park in downtown Palm Springs, and is home to the Village Green Museum and two nineteenth‐century pioneer homes. The McCallum Adobe, the oldest remaining building in Palm Springs,
was built in 1884 for John McCallum. Miss Cornelia’s “Little House,” built in 1893 by the city’s first hotel proprietor, was made of railroad ties from the defunct Palmdale Railway. Both homes provide historic information about early Palm Springs. The Cornelia House is home to the Palm Springs Historical Society. In 2013, the maintenance of the “Downtown Experience” and the Village Green Heritage Center was transferred from the Parks Department to the City’s new Facilities and Maintenance Department.
Frances Stevens Park This park consists of the grounds around the Palm Springs Palm Canyon Theater and Desert Arts Center. The entire site is 3.3 acres, but much of it is covered by buildings and parking. While the area is small and broken into even smaller pieces, it is nonetheless important in that it is the only public green space located immediately within the downtown. As such, it is the host for events and other activities in the downtown. The location is ideal, but the size and configuration are inadequate. It might be possible to recapture some of the space now dedicated to parking by relocating the parking or
reconfiguring it, to allow for a larger space of lawn. This needs further investigation.
Gene Autry Gateway Park In 2007, the City of Palm Springs applied for a grant through the Transportation Enhancement Program (TE) that provides federal funds for transportation related projects that enhance the quality of life in or around transportation facilities. This federal grant is administered through the California Department of Transportation (CalTrans) and was awarded by the Riverside County Transportation Commission (RCTC). However, due to the economic slowdown, the project money was rerouted to other projects. The City immediately applied for funding from the federal
stimulus package in hopes of preventing loss of the project. The City got news that they would be the first in Riverside County to receive $1.8 million for their shovel ready project.

Parks and Recreation Master Plan ‐ DRAFT 43
The stimulus money provided finding to the City funding to install landscaping and associated improvements within the future raised median on Gene Autry Trail between Vista Chino and Via Escuela (approximately 1/4 mile) including the adjacent 20 foot wide parkways; and landscaping of the vacant parcel located at the southwest corner of Gene Autry Trail and Vista Chino (1.72 acres) to be used as a “passive park” and the location of a new Palm Springs gateway entry monument. City Council voted on the final package in July, 2009 with groundbreaking in fall of 2009. During the 2013 site visit, the park was inventoried and assessed as an existing park. While primarily a passive park, two bocce courts do provide some recreation opportunities. Desert landscape, trails, and seating make up the remainder of the park. Users of the park are subjected to significant noise from the adjacent street.
Palm Springs Dog Park This 1.6 acre site adjacent to the municipal center is a pleasant and casual meeting place for the many residents of Palm Springs with dogs. The site offers a shaded grassy area with movable lawn chairs, all within an artistically designed wrought‐iron enclosure. During times the park is closed for extended maintenance such as overseeding a temporary dog park is provided at Demuth Park. Ruth Hardy Park Ruth Hardy is one of Palm Spring’s larger parks. The 22‐acre site offers tennis, basketball, and volleyball courts, along with playgrounds and picnic areas. Unique features here include public art and display gardens. There is also an interesting restroom building that is a good example of mid‐century modern architecture and which serves to define a grassy area that could serve as a space for various types of outdoor events. This structure shows that interesting architecture has a place in the parks and could become an identifying feature for the entire city.
While Ruth Hardy is one of Palm Springs’ most pleasant parks, there is room for improvements. The restroom building and the space adjacent to it could be renovated and upgraded to make them showplace features of the park. And while the park is well‐shaded by Palm Springs standards, additional trees would probably be welcomed by park users. This park might also be a candidate for a more modern and elaborate “spray ground” water play area to replace the current “turtle” spray pad.

44 City of Palm Springs
Sunrise Plaza This 35‐acre site includes many attractions, such as a large outdoor pool, skatepark, and a baseball stadium. It is also the home of the city’s Leisure Center and Pavilion, public library, and senior center. In addition, there is a large playground, basketball court, and loop walks. This is truly a destination park for all of Palm Springs. In 2013, a new modular indoor facility was added to the skate park and is further discussed later in this document. The park offers rolling grassy topography and amply shaded areas. Its central location within the city and adjacent to the High School makes it reasonably accessible to residents.
Tahquitz Creek Golf Resort The City owns the 36‐hole Tahquitz Creek Golf Resort, a 160‐acre public golf course that also includes a driving range and clubhouse. While factored into the overall level of service the golf course was not factored into the developed park acres.
Victoria Park Victoria Park is nine‐acres in size, located in the north‐central part of Palm Springs. The park offers a variety of activities, including open turf, volleyball, and a playground. However, the park lacks focus, and the activities feel scattered about without apparent intention. In particular, it lacks paved walkways. The simple addition of loop walks connecting the various elements of the park would give it form and make it more inviting as a place to stroll. This would also enhance its usefulness for people of all abilities. Indoor Facilities Palm Springs’ primary indoor facilities include the Leisure Center and Pavilion, Demuth Community Center, and the Desert Highland Unity Center. Together, these three facilities provide a range of components to serve the city’s residents. A fourth facility was added in 2013 to help serve the skate park.

Parks and Recreation Master Plan ‐ DRAFT 45
James O. Jessie Desert Highland Unity Center The James O. Jessie Desert Highland Unity Center offers two multi‐purpose rooms, a gymnasium, weight room, and kitchen. It is situated at the far north end of Palm Springs in Desert Highland Park and is the focal point of the park and the surrounding neighborhood.
Leisure Center and Pavilion The Leisure Center and Pavilion offers a very large multipurpose space (auditorium) suitable for events and activities, as well as several other smaller multipurpose spaces, and a conference room. It is in the heart of Sunrise Plaza, next to the aquatics center, skatepark, and other facilities, making it convenient for most of Palm Springs to get to.
Rhythm Skate Shop In 2013, the city invested in the installation and refurbishment of a modular facility to serve as the entry point and security system for the skate park. The facility is currently managed and operated by a contractor that also provides retail equipment sales within the building.

46 City of Palm Springs
Demuth Community Center The former YMCA at Demuth Park is now part of the City Indoor Facilities. While dated and in need of upgrades, the facility is functional and provides a great deal of opportunity for expanded programming and meeting spaces as well as gymnasium and fitness. Tahquitz Creek Golf Resort Clubhouse The Tahquitz Creek Golf Resort Clubhouse was included in the level of service as an indoor facility offering a restaurant and golf pro shop. The restaurant and bar have recently been remodeled and updated to provide a better user experience.
Trails Trails enhance level of service through connectivity and access. In addition, walkable/bikeable communities are defined by their trail network. The importance of trails ranks extremely high in Palm Springs and was reinforced by the survey that was conducted during this master plan. The inventory for this project includes over 57 miles of trails and eight trailheads. These include paved multi‐use trails as well as primitive trails into the mountains adjacent to the city. Trailheads connect many of these to the city and serve as portals into the wilderness. However, many of these are not well‐marked and do not offer basic amenities that would enhance their usefulness. Recreational trails serve a wide range of constituents and are among the most universally desired park and recreation amenities throughout the nation. Palm Springs is fortunate to have such a large amount of trails readily available to people, and should make the most of these by highlighting them to residents and visitors alike. Information kiosks, better signage, shade shelters, parking, and drinking fountains are amenities that would enhance the trailheads and invite even more people to use them. Hiking trails are abundant in Palm Springs. From easy walking trails to difficult terrain, the outdoor enthusiasts will experience spectacular mountain vistas, waterfalls, natural streams, rocky gorges, and unusual rock formations. The pristine desert air mixed with giant palm trees and an alpine wilderness create the perfect setting of natural desert beauty. While some of these trails require an admission charge, a number of the trails are free.

Parks and Recreation Master Plan ‐ DRAFT 47
Free Hiking Trails Araby Trail (Moderate) – 6 miles; 800 foot gain; 4 hours – IN‐OUT. This trail gives the hiker great views of the Coachella Valley, and the opportunity to hike right past Bob Hope’s house. After hiking up the Araby past Bob Hope’s house, one can continue up the trail for access to the Berns, Garstin, and Henderson Trails. There are no picnic tables, but there are plenty of rocks to sit on and enjoy the view of the Coachella Valley while taking a well‐deserved lunch break. North Lykken Trail (Moderate) – 5 miles; 1,000 foot gain; 4 hours – SHUTTLE. Most people start from the south, ascending moderately to the picnic tables above the museum. Continue on, dropping down to the trail that winds below the ridgeline behind Las Palmas dam. Rest at the picnic tables towards the end before you drop down to Cielo Drive. Murray Hill (Strenuous) – 8 miles; 2,100 foot gain; 6 hours – IN‐OUT. Trailhead is off Bogert Trail. A view hike extraordinaire! After a steep climb you will follow a ridge of rolling hills with views of both sides of the valley, ending at attractive picnic tables perched atop Murray Hill. Palm Springs Art Museum Trail (Moderate) – 2 miles; 900 foot gain; 2 hours – IN‐OUT. Trail rises above the City of Palm Springs, and offer spectacular views of Palm Springs Mountains, downtown, and of the beautiful desert of the Coachella Valley. Skyline Trail (Strenuous) – 10 miles; 8,000 foot gain; 7 to 9 hours – HIKE UP/TRAM DOWN. A hike of extremes – most beautiful views, best workout, most varied vegetation (3 life zones), NO water, and easiest downhill – you ride the tram! Note that extreme care is required in planning and preparation for this hike, since spring and fall provide the only windows of opportunity to hike all the way. Winter can bring snow and frigid weather at the top, and summer is much too hot. South Lykken Trail (Moderate) – 5 miles; 1,000 foot gain; 4 hours – SHUTTLE. Trail is mostly downhill from the picnic tables if you are going from the north to the south end, and the hike will take about two hours. When you hike the north end of this trail, you will be rewarded with fantastic views of Palm Springs, the Coachella Valley, and down into Tahquitz Canyon. A great exercise hike, climbing the hillside to picnic tables at each end with panoramic vista. Hiking Trails with Admission Charge: Andreas Canyon Trail (Easy) – 2 miles; 50 foot gain; 1 to 2 hours – LOOP. The trail takes hikers up the right side of the canyon, following a stream that wanders through groves of California fan palms. This is a leisurely hike along a quiet stream with ledges of rock used by the Cahuilla women. Maynard Mine Trail (Strenuous) – 7 miles; 2,200 foot gain; 5 hours – IN‐OUT. This trail is a rugged uphill climb that leads to the remains of an old tungsten mine that was worked during WWII by Jim Maynard. This trail climbs up the mountain without stopping. After about three miles of uphill climbing you will reach a ridge that overlooks the wonderful views of the canyon, the Coachella Valley, and the mountain peaks beyond. Murray Canyon Trail (Moderate) – 6 miles; 500 foot gain; 4 hours – IN‐OUT. Trail will take hikers further and higher into the San Jacinto Mountains. It is abundant in California fan palms and other desert vegetation. Amble along a running stream having some rock crossings and enjoy the cool tree canopy.
48 City of Palm Springs
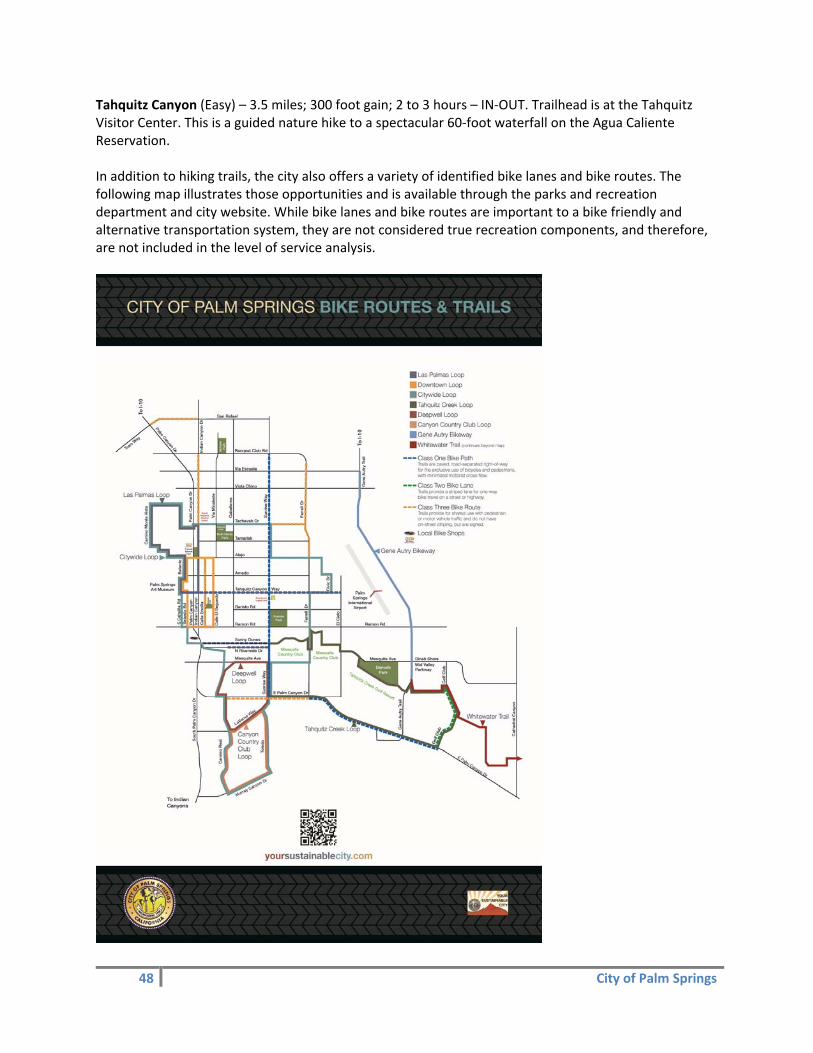
Tahquitz Canyon (Easy) – 3.5 miles; 300 foot gain; 2 to 3 hours – IN‐OUT. Trailhead is at the Tahquitz Visitor Center. This is a guided nature hike to a spectacular 60‐foot waterfall on the Agua Caliente Reservation. In addition to hiking trails, the city also offers a variety of identified bike lanes and bike routes. The following map illustrates those opportunities and is available through the parks and recreation department and city website. While bike lanes and bike routes are important to a bike friendly and alternative transportation system, they are not considered true recreation components, and therefore, are not included in the level of service analysis.

Parks and Recreation Master Plan ‐ DRAFT 49
CVAG Non‐Motorized Transportation Plan Update In September 2010, the CVAG Non‐Motorized Transportation Plan Update was completed. While the plan focuses heavily on transportation, there are portions that are applicable to recreation trails. For the purposes of this plan, the following classifications and associated discussions are most applicable to recreation and therefore the level of service analysis of this plan. However, all classes may provide differing levels of improved or safe access to existing or future recreation facilities.
Class I Bikeways – Typically called bike paths, they provide for bicycle travel on paved rights‐of‐way completely separated from any street or highway. Paved Multipurpose Paths – Similar to Class I bike paths, but intended for multiple users (bicycles, pedestrians, roller bladers, other non‐motorized users) and do not meet Caltrans bike path standards. Hiking/Equestrian Trails – Off‐road earthen paths intended primarily for equestrians. Hikers, pedestrians, mountain bicyclists, and others are permitted, unless signed otherwise.
The Non‐Motorized Transportation Plan updates a plan for bikeways and trails that was completed in 2001. It includes updates of a bicycle plan for each jurisdiction as well as revisions to plans for hiking and equestrian trails. The bicycle plans will make each city and the County of Riverside eligible for Bicycle Transportation Account funds, and will enhance their chances to compete for other funds. Cities and the County will also improve their chances of receiving funds for the trails on this Plan. Plans for all of the facilities contained herein provide opportunities to include them along with future development. By having bikeway and trail alignments on the Plan, local jurisdictions will have significant leverage to work with developers to construct them. Results of a 2008 survey indicated that safety topped the list of overall concerns cited by respondents. The plan also includes discussion of several government efforts that aimed at reducing motor vehicle impact and increasing bike and pedestrian friendly development. These include, but are not limited to, the following: Complete Streets Act of 2008 The State of California recently adopted the Complete Streets Act of 2008. The law requires local governments to consider all users in planning for all streets. They must plan for bicyclists, pedestrians, and transit users as well as motorists. And they are required to plan for all ages and physical abilities. Such accommodations may include sidewalks, bike lanes, crosswalks, pedestrian crossing improvements, wide shoulders, medians, bus bulbs, and audible pedestrian signals, among others. As of 2011, whenever local governments revise circulation elements to their general plans, the provisions of this law take effect. By adopting the bicycle plans contained in this Plan into their circulation elements, cities and the County would comply with that part of the law.
Assembly Bill 32 – The Global Warming Solutions Act In 2008, the State of California adopted AB 32, which requires the California Air Resources Board (CARB) to develop regulations and market mechanisms to reduce California's greenhouse gas emissions by 25 percent by 2020, and by 80 percent by 2050, to be below 1990 levels. By adopting and implementing the bicycle plans contained in this Plan into their circulation elements, cities and the County would progress towards these objectives.

50 City of Palm Springs
Senate Bill 375 In 2008, the State of California adopted SB 375 aimed at reducing greenhouse gases caused by motor vehicles. It calls on regional governments to develop plans to reduce sprawl and develop bicycle, pedestrian and transit transportation modes. SB 375 offers cities and developers incentives to develop in a more compact form. By adopting and implementing the bicycle plans contained in this Plan into their circulation elements, cities and the County would progress toward the intent of this law. Cities and the County can also progress towards the intent of this law by adopting “smart growth” strategies in their land use planning to mold new development into a form that makes new neighborhoods walkable and bicycle friendly. Numerous Goals and Objectives are presented. Those found most applicable to recreation include the following:
Complete a network of bikeways that is feasible, fundable, and that serve bicyclists’ needs, especially for travel to employment centers, schools, commercial districts, transit stations, and recreational destinations. Recognize and accommodate other key activities on shared‐use paths, such as
pedestrian, equestrian, and golf cart uses.
Maintain and improve the quality, operation, and integrity of the bikeway network and facilities. Provide designs that ensure the safety of bicyclists and others who use shared‐use trails.
Provide short‐ and long‐term bicycle parking in employment and commercial areas, in multifamily housing, at schools, and at recreation and transit facilities. Encourage local agencies to work with area elementary, middle, and high schools to
promote bicycle commuting and to assist in purchasing and siting long‐ and short‐term bicycle parking.
Develop and implement education and encouragement plans aimed at youth, adult cyclists, pedestrians, and motorists. Increase public awareness of the benefits of bicycling and of available resources and facilities. Encourage local agencies to develop adult and youth bicycle and pedestrian education,
encouragement, and safety programs. These could be provided at schools, senior centers, and recreational areas.
Develop and implement a safety program with the development of shared‐use trails. Coordinate with local law enforcement to create a plan to regularly patrol shared‐use
trails. Fund a call‐box system along trails and paths to provide security and a quick response to
incidents by appropriate public agencies and services. Encourage local agencies to collaborate with law enforcement on appropriate designs
that enhance the safety of trails as they are developed.
Provide a safe, accessible, and enjoyable environment for hiking and equestrian recreational opportunities on off‐road trails in the Coachella Valley. The following objectives address these goals and provide guidelines for local jurisdictions to follow. More detailed plans for implementation of these goals and objectives are contained in the following sections. Implement the Hiking and Equestrian Element of the Non‐Motorized Transportation
Plan, which identifies existing and future needs, and provides specific recommendations for facilities and programs over the next 20 years.
Seek funding for projects identified in the Plan.
Work through the detailed design and implementation phases of project development.

Parks and Recreation Master Plan ‐ DRAFT 51
Implement a Trail Plan that accommodates users of off‐road trails and creates an integrated network that enhances trail access and recreational opportunities.
All existing and proposed trails should reflect the needs of existing hiking, bicycling, and equestrian groups, the requirements of governing agencies, and design and planning standards developed by national groups such as the American Hiking Society and the U.S. Department of Agriculture. Trailheads should be developed to provide access to the trail network and minimize
adverse impacts on surrounding residents and wildlife in the vicinity. Trailheads should include vehicular and bicycle parking as well as restrooms and
drinking fountains. Selected trailheads should offer developed staging areas for equestrians and parking for
trucks/trailers. Trails should be developed with a minimum of barriers per ADA requirements. A distinct
system of trail identification and signage should be developed to identify routes, reveal relative level of intensity, regulated activities, and hours of operation.
Existing gaps in the trail network should be closed in order to create a more integrated system of trails that creates more opportunities for recreation.
Existing easements should be utilized to fill in gaps in the trail network as much as possible to take advantage of the relative low cost of construction at these locations.
Ensure the safety and security of all users of off‐road trails in the Coachella Valley. Trails should be designed to protect Big Horn Sheep and other natural resources and
wildlife. The document also has sections devoted to each individual city within the valley. Again, focusing on the Class I routes we see the following: City of Palm Springs Existing Bikeways Tahquitz Creek (from Calle Palo Fierro to Sunrise Way, to Sunny Dunes Rd., to Farrell Dr.) 1.3 miles Palm Canyon Wash (from Gene Autry Trail to Landau Blvd.) 1.2 miles
City of Palm Springs Top Priority Projects Whitewater Wash
(from I‐10 Freeway to Cathedral City limit) 11.5 miles $11,500,000 Tahquitz Creek Path
(from Calle Palo Fierro to Tahquitz Canyon Visitor Center) 0.6 miles $600,000 Crossley Rd.
(from Ramon Rd. to Ave. 34) 1.0 miles $1,000,000 Ave. 34
(from Crossley Rd. to Whitewater Wash) 0.5 miles $500,000
City of Palm Springs 2nd Priority Bikeway Projects Murray Canyon S. Palm Canyon Dr. Palm Canyon Wash 1.8 miles $1,800,000 Palm Canyon Wash S. Palm Canyon Dr. Gene Autry Trail 4.9 miles $4,900,000

52 City of Palm Springs
City of Palm Springs 3rd Priority Bikeway Projects Mission Creek I‐10 Freeway Whitewater Wash 2.4 miles $2,400,000 Palm Springs has identified several locations where bicycle parking facilities exist. They include the parks and recreation department areas listed below:
Sunrise Park
Demuth Park
Ruth Hardy Park
Leisure Center The City proposed to add new bicycle parking to the following locations:
Gene Autry Plaza Future Financial Needs The City of Palm Springs has the following future financial needs:
Top Priority Bikeways: 25.8 miles, $14,166,000
2nd Priority Bikeways: 33.4 miles, $7,568,000
3rd Priority Bikeways: 21.9 miles, $3,012,000 Total: 81 miles, $24,746,000
Bicycle Parking Program: $25,000
Total Capital Financial Need: $24,771,000
Annual Class I Bike Path Maintenance: 22.7 miles, $71,914 Several funding sources are listed in the document and also apply to recreation associated trails. Chapter 7: Design and Maintenance Guidelines provide important discussions to consider. Trailhead amenity recommendations included would be appropriate in most of the existing Palm Springs trailhead locations. Tahquitz Creek Trail Master Plan In 2009, Alta Planning and Design completed the Tahquitz Creek Trail Master Plan. This plan looks specifically at one of the top priorities trails identified in the CVAG plan for Palm Springs. The plan identifies five major goals including:
1. Create a scenic and enjoyable desert greenway along the Tahquitz Creek. 2. Create visual access to the creek trail as well as connections to the larger trail system and area
destinations. 3. Provide a safe, comfortable, and engaging experience for a variety of trail users. 4. Highlight the local context: history, culture, and natural environment. 5. Respect the functional role of the Tahquitz Creek.
This in‐depth look at Tahquitz Creek Trail addresses two primary trail types as part of the plan: multi‐use trails and equestrian trails. Included in the document are:
Typical design standards for most situations including trail width
Striping, signage
Roadway crossings
Creek crossings
Design speed

Parks and Recreation Master Plan ‐ DRAFT 53
Other sections include the following:
ADA access
Operating Standards
Existing Conditions
Opportunities and Constraints
Alignment Alternatives
Conceptual Design
Permitting and Costs While the completion of these design features may impact the overall scoring of the Tahquitz Creek Trail, the route for the trail is included in the overall scoring and level of service analysis used in this study based on the assumed scoring presented below. Once completed, the overall level of service could be evaluated and adjusted based on actual components and opportunities provided in final construction. GRASP® Scoring for Trails Some trails serve as independent parks or greenways, and are recreational destinations within themselves. Others serve as individual components within a park. For purposes of assigning scores, the former type of trail receives its own set of scores for modifiers and design and ambiance. Trails within parks take on the modifiers and design and ambiance of the larger parks in which they reside. Trails are assumed to consist of three (3) components including one active component, one passive component, and the parcel itself. This translates into the following formula for calculating the GRASP® score:
(Component number + Parcel) x Component score x Comfort x Design = GRASP® score or
(2 +1) x 2 x 1.2 x 2 = 14.4 A more detailed explanation of trail scoring can be found in Appendix C in the discussion on “Trails Base Score.” City-Owned Open Space The presence of open space throughout the City of Palm Springs boundaries provides additional level of service. Even parcels that do not currently allow public access provide relief from development, views of natural settings, and habitat for a variety of wildlife. Chino Cone The Chino Cone is a world‐renowned Palm Springs landmark; it is monumental in stature, and one of the largest and few remaining undeveloped alluvial fans in the entire Coachella Valley. The City has identified this as important for preservation and in 2013 purchased the first of 15 acres (Figure 7).

54 City of Palm Springs
Figure 7: Chino Cone
GRASP® Scoring for City‐Owned Open Space In addition, many of these areas offer active recreation through trail access. Since all of these trails are included in the trails GIS layer, and therefore, are scored as part of trails level of service in the composite values methodology it was determined that assumed scoring for City Owned Open Space should include two components. One might consider these two components to be a natural area and other‐ passive. This translates into the following formula for calculating the GRASP® score:
(Component number + Parcel) x Component score x Comfort x Design = GRASP® score or
(2 +1) x 2 x 1.2 x 2 = 14.4 For the purposes of this study, “Open Space” includes parcels that are defined in the General Plan as Desert, OS‐C, OS‐D, OS‐M, OS‐P, or OS‐W. These parcels were then intersected with “City Owned” Property to determine “City Owned Open Space.”
Parks and Recreation Master Plan ‐ DRAFT 55
Therefore, all “City Owned Open Space” receive the same GRASP® score of 14.4. In the GRASP® Perspectives that follow, that value has been assigned to each location and buffered accordingly. This value also is included in computations for the GRASP® Indices that are calculated along with each Perspective. Specific components found at each parcel have not been identified and are not included in the inventory of components for the dataset. As a result, they are not included in any tables, calculations, or other references that are based on the quantities or values of specific types of components that may occur in City Owned Open Space parcels.
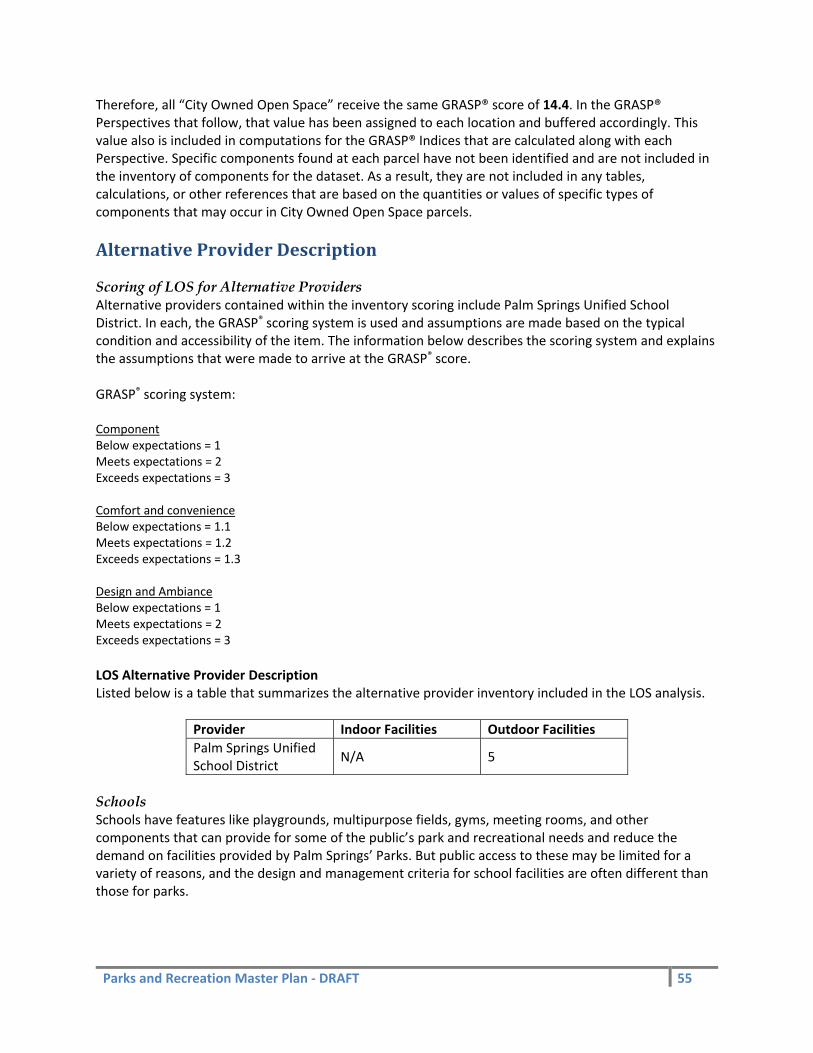
AlternativeProviderDescription Scoring of LOS for Alternative Providers Alternative providers contained within the inventory scoring include Palm Springs Unified School District. In each, the GRASP® scoring system is used and assumptions are made based on the typical condition and accessibility of the item. The information below describes the scoring system and explains the assumptions that were made to arrive at the GRASP® score. GRASP® scoring system: Component Below expectations = 1 Meets expectations = 2 Exceeds expectations = 3 Comfort and convenience Below expectations = 1.1 Meets expectations = 1.2 Exceeds expectations = 1.3 Design and Ambiance Below expectations = 1 Meets expectations = 2 Exceeds expectations = 3
LOS Alternative Provider Description Listed below is a table that summarizes the alternative provider inventory included in the LOS analysis.
Provider Indoor Facilities Outdoor Facilities
Palm Springs Unified School District
N/A 5
Schools Schools have features like playgrounds, multipurpose fields, gyms, meeting rooms, and other components that can provide for some of the public’s park and recreational needs and reduce the demand on facilities provided by Palm Springs’ Parks. But public access to these may be limited for a variety of reasons, and the design and management criteria for school facilities are often different than those for parks.

56 City of Palm Springs
For the purposes of this study, a list of public schools was obtained and reviewed to provide a reasonable dataset of schools that offer some park and recreational value to the public. While no specific listing of components at each school was generated, it has been assumed that each school has two (2) components (playground, multi‐purpose field, etc.) and that like the parks in this study, the land on which it is located has a basic value. These two components and the parcel are assumed to be meeting the expectations (scores 2) of the community in the same way that park components meet expectations. The other parts to the GRASP® score relate to the comfort and design of the location, and are called modifiers. The aesthetic and recreational standards for schoolyards are typically different from those for parks, so modifiers at schools are generally assigned a value of below expectations (score 1) even if they meet the expectations of the school. The final component in the GRASP® score is the ownership modifier. This is a percentage that is applied to the score that relates to the general public’s ability to access the facility. This translates into the following formula for calculating the GRASP® score:
(Component number + Parcel) x Component score x Comfort x Design x ownership = GRASP® score or
(2 +1) x 2 x 1.1 x .5 = 3.3
Therefore, all schools receive the same GRASP® score of 3.3. In the GRASP® Perspectives that follow, that value has been assigned to the location where each school is found and buffered accordingly. This value also is included in computations for the GRASP® Indices that are calculated along with each Perspective. However, since the specific components found at each school have not been identified, any components found at schools are not included in the inventory of components for the dataset. As a result, they are not included in any tables, calculations, or other references that are based on the quantities or values of specific types of components that may occur at schools.

Parks and Recreation Master Plan ‐ DRAFT 57
Figure 8: Resource Map B: System Map Resource Map B: System Map (Figure 8) shows where existing parks, trails, and open spaces are located. All locations containing components with GRASP® scores in the dataset are shown on this map, including those owned by the City of Palm Springs and Palm Springs Unified School District schools (The illustration provided here is a thumbnail for quick‐reference only, and is not intended to be legible at this scale. Larger versions of this and other maps, as well as the GRASP® Perspectives can be found in Appendix E: Resource Maps and GRASP® Perspectives.)

58 City of Palm Springs
Figure 9: Resource Map C: Population Density Population density can have an effect on the Levels of Service (LOS) provided by the parks and recreation system at a localized level. For this reason population density was used in the LOS analyses that follow. Resource Map C: Population Density (Figure 9) shows population density by persons per square mile across the study area by census block group in the Palm Springs area in 2012. Population density is calculated by dividing the total population count of geographic feature by the area of the feature, in square miles. The area is calculated from the geometry of the geographic feature in projected coordinates. ©2013 ESRI. In general, it can be said that Palm Springs does a good job of providing parks and developed recreation opportunities in areas that are more densely populated (darker orange gradient), while the majority of the trail system occurs in lesser populated areas (lighter orange gradient). In addition, population density mapping is based on census block that vary in size and shape. Population is not
necessarily distributed equally across the entire census block. For example, it is known that much of the southern portion of the city boundary is uninhabited; however, a small population living in the northern edge of this large census block would show population density gradient across the entire census block. Further discussion of Palm Springs demographics and population are included in Community Profile section of Chapter III. Needs Assessment in this document.

Parks and Recreation Master Plan ‐ DRAFT 59
Alternative Providers Located but not Scored in Level of Service. Figure 10: Resource MAP D
Resource Map D: Alternative Provider Locations (Figure 10) Identification and location of other alternative providers is also important to understanding all recreation opportunities available to residents and visitors. Because access is often limited or restricted, these types of facilities have not been included in the level of service analysis with the exception of public schools as discussed earlier.
LevelofService Levels of Service (LOS) are typically defined in parks and recreation plans as the capacity of the system’s components to meet the needs of the public. The traditional method used in parks and recreation planning is to compare the quantity or capacity of various elements within the park and recreation system to the population it is intended to serve. Traditional methods also include an analysis of the distribution of elements across the system to determine the proximity of those elements to the intended service population. For this planning study, an enhanced tool was utilized to examine Levels of Service (LOS) in a more detailed and sophisticated way. This tool uses computer technology to allow the elements of the park and recreation system to be looked at in greater detail than traditionally used. The park and recreation system can be broken into smaller components and more detailed information about these can be incorporated into the analysis. Qualitative as well as quantitative information about the system can be incorporated. Using a technique called Composite Values Methodology, analytical maps can be generated that show LOS from a variety of “perspectives.” This approach is referred to as Geo‐Referenced Amenities Standards Process (GRASP®). A more detailed description of the methodology of GRASP® and its relationship to traditional park and recreation planning can be found in Appendix D.

60 City of Palm Springs
The GRASP® Analysis GRASP® methodology is a unique way of looking at Level of Service (LOS), because it not only considers the quantity and distribution of parks and facilities, but also functionality, comfort and convenience, and overall design and ambiance. It is also unique in that it uses the individual components of a parks and recreation system, in different combinations, to create a multi‐dimensional model for evaluating LOS. This evaluation of the park and recreation system is one way to address the Recreation, Open Space and Conservation Element of the City’s General Plan. After scoring each component as outlined in the inventory description, GIS software was used to create graphic representations that allow for easy visual and numerical analysis of the parks and recreation system. Some of the representations show raw data collected through the inventory process or received from other sources. These are referred to as Resource Maps. Other representations emerge from the processing of data within the GIS using composite values analysis. These analyses can evaluate both general and specific aspects of the system. Each of these representations is called a GRASP® Perspective. The following maps and perspectives were prepared for this report and can be found in Appendix E. Map A: Regional Map Map B: System Map Map C: Population Density Map D: Alternative Provider Locations Perspective A: Access to All Components Perspective B: Walkable Access to All Components Perspective C: Access to Indoor Recreation Perspective D: Access to Outdoor Components Perspective E: Access to Sports Fields For each GRASP® Perspective, the GRASP® scores for components in the inventory relevant to that Perspective are applied to a radius around each component. This radius represents the service area, (sometimes also referred to as the catchment area or buffer), within which the score for that component is effective. Catchment areas may vary from one Perspective to the next, depending on the assumptions and parameters on which the Perspective is based. The typical approach is to apply the component’s qualitative score to both one mile and 1/3 mile radii. One mile radii represent a distance from which convenient access to the component can be achieved by normal means such as driving or bicycling. Indoor facilities tend to be fewer and farther apart than neighborhood parks; therefore, people expect to travel a bit farther to access them. In the case of Palm Springs, a three mile distance was chosen for this outer catchment area. The 1/3 mile radius is an assumed distance from which a resident can reasonably walk to the component. By plotting both sets of radii for each component on a map, scores are effectively doubled within the 1/3 mile radius. This is done to place a premium on walking and reflect the added accessibility of walking, since almost anyone can reach the location on their own by walking, particularly if they do not drive or ride a bicycle.

Parks and Recreation Master Plan ‐ DRAFT 61
When catchment areas from multiple components with associated scores are plotted on a map, a picture emerges that represents the cumulative LOS. Where catchment areas for multiple components overlap, a darker shade results and indicates locations that are “served” by a combination of more components and/or higher quality ones. In other words, where there are darker shades, the level of service is higher for that particular Perspective. It is important to note that the shade overlaying any given point on the map represents the cumulative value offered by the surrounding park system to an individual situated in that specific location, rather than the service being provided by components at a location to the areas around it. GRASP® Threshold Values Analysis For some of the GRASP® Perspectives, the catchment areas and associated scores are presented in two ways – with infinite tone ranges (orange) and in two tones based on Threshold Values (purple and yellow). The infinite tone map for each Perspective shows the GRASP® LOS with a tone range that portrays the nuances of service that is being provided to the community. Note: The complete Perspective series is set to the same tone scale so that different Perspectives can be compared side‐by‐side. A particular shade on one Perspective will have the same numerical value on all other Perspectives. The Threshold Values maps show GRASP® score ranges bracketed into categories that represent the following: No Service, Service Below Threshold Value, or Service Above Threshold Value. Threshold scores represent the score that would be achieved if a determined set of components, along with the appropriate modifiers, were accessible from a given location. The combination of components is based on the set of needs being evaluated, and varies for each Perspective. Unless otherwise noted, the threshold score is appropriate for a typical developed suburban residential area. For this reason, it should not be implied that all parts of the city should attain this score. In some areas, no service or a level of service below the threshold score is completely appropriate. Areas with yellow shading on the threshold values maps have at least some service (GRASP® score of greater than zero), but the service score is below the threshold. Areas with purple shading have service scores that meet or exceed the threshold value. Areas without shading have a service score of zero. Different threshold score breaks were used for each Perspective, depending on what was being measured. For this reason, the Threshold Values maps cannot be compared but are specific to each Perspective. The Maps and Perspectives section below reviews the Perspectives and highlights where higher and lower levels of service are being provided from given sets of components. In addition to components provided by the city, some alternative providers have been included in the Level of Service (LOS) computations as described earlier, and the remaining providers are shown for reference. Alternative providers included in the LOS analysis include elementary and middle schools within the Palm Springs Unified School District. Thumbnails of the maps and perspectives are shown here for convenience only – the reader should refer to the full‐size versions in Appendix E for complete information and clarity.

62 City of Palm Springs
Perspective A: Access to All Components This perspective (Figure 11) shows the service provided throughout the city by all components in the inventory. This includes all outdoor, indoor, active, passive, and other components. Service is measured based on a one‐mile radius, with a higher value placed on the components that are available within walking distance, or 1/3 mile. GRASP® scores for all components were assigned to catchment areas as described above. Figure 11: Perspective A: Access to All Components
This Perspective shows that service is being provided to most of the developed parts of the city, with higher values occurring in a band across the city running from northwest to southeast. This axis runs through the city’s main parks: Ruth Hardy, Sunrise Plaza, and Demuth. Table 4: Perspective A ‐ Access to All Components – LOS Scores shows the statistics derived from Perspective A: Access to All Components (Figure 11). The table shows that 62 percent of the total land area of Palm Springs enjoys some level of service, meaning that the GRASP® score for that area according to this Perspective is greater than zero. While this may not seem like a high percentage of coverage, it should be kept in mind that a large part of the total area within Palm Springs is either undeveloped or non‐residential. The important thing to look for is whether service is being provided where needed in the city and at desired levels. Referring to Resource Map C – Projected Population Density (Figure 9) to see where the numbers of residents are at various levels, it is apparent that, for the most part,
the most densely populated parts of Palm Springs are covered by darker shades on the Perspective, and therefore have service, with a notable exception in the census tract located east of Toledo Avenue and south of East Palm Canyon Drive. Because this area is grouped into a single census tract with the large undeveloped area to the south, it appears to have a lower population density on Map C than it actually does in reality. Perspective A shows service to be relatively low in this area. This may be an area where there is a gap in service, and should be looked at more closely to see if the low service there is offset by some other factor such as the availability of private recreation facilities or specific demographic characteristics of that neighborhood that negate the need for service. If not, service may need to be enhanced for this neighborhood. Table 4: Perspective A ‐ Access to All Components – LOS Scores
Percent of Total with LOS
Average LOS per Acre Served
Avg. LOS Per Acre/Population per acre
GRASP® Index
City of Palm Springs (Perm) 69% 121 165 26
City of Palm Springs (Perm+) 69% 121 95 15

Parks and Recreation Master Plan ‐ DRAFT 63
The next column in Table 4 shows the average GRASP® LOS score for each acre that has service. The average score for all acres with service across the city is 86 points. This number represents the average GRASP® score for all of the area within the city where access to some type of facilities is provided. While it is a useful benchmark, it is a bit misleading, because it includes some open space parcels and primitive trails that are relatively remote. These features have the effect in this case of spreading the LOS somewhat thinly across a large area. The column in Table 4 labeled “Avg. LOS Per Acre Per Pop.” shows the number that results when the average GRASP® score per acre is divided by the planning area’s average population density per acre. This was done to normalize the LOS for population. The measure was calculated for both the permanent population and the permanent plus seasonal population. When analyzed this way, the LOS per permanent population is 102 points. Because density goes up with the addition of the seasonal population, the LOS in this measure goes down to 62. Another way of looking at the service within the planning area is to use the total GRASP® value of all of the components within the planning area, regardless of where they are located. When this number is divided by the population of the planning area, in thousands, the result is called a “GRASP® Index.” Simply put, the GRASP® Index shows the value of everything within the boundaries of a defined area on a per‐capita basis. The last column in Table 4 shows the GRASP® Index for each population scenario. Note: the GRASP® Index does not include trails. Table 4 shows that the overall GRASP® Index for Palm Springs’ permanent population is 20. The index for the permanent plus seasonal population is 12. GRASP® Indices for other communities can be found in the GRASP® Comparative Data later in this section. The difference between the “GRASP® Index” and the “Average GRASP® LOS Per Population Density” is that in the GRASP® Index the location of components does not matter as long as they are within the planning area. In the Average GRASP® LOS Per Population Density the location of components may have an effect and things located outside the planning area may even be included if the service radius of those things extends into the planning area. Both numbers are normalized for population – the GRASP® Index uses the total population of a planning area and the Average GRASP® LOS Per Population Density number uses the average density of the population within a planning area. These two different ways of looking at LOS with population taken into account allow for a more complete understanding of how LOS and population are related in various parts of the city. It is inappropriate to say what the “correct” value should be for the scores presented here, or whether the values for all places within the planning area should be the same. There are no established standards for such scores. However, if assumptions are made about what scores might be appropriate, further analyses can be conducted. An example is shown on Perspective A. This is the small inset map, Perspective A‐2: GRASP® LOS Meeting Threshold Scores, with purple and yellow shaded areas shown on it. It shows where the cumulative LOS on Perspective A falls above or below the Threshold Value, as described earlier. The threshold value used for this Perspective is 67.2. This is equivalent to access to at least four components and one trail with appropriate modifiers in place, although this score might be achieved in other ways that do not guarantee a certain mix of components. Whether or not the mix is appropriate for all areas is determined through other tools, including the public input process.

64 City of Palm Springs
The areas in yellow on the inset map indicate where service exists, but it falls below the threshold value. These areas account for 31 percent of the overall land area. These are areas of opportunity, because land and facilities are currently available to provide service, and relatively simple improvements to those lands and facilities may be enough to bring service up to the targets. Thirty‐one percent (31%) of the total land area has no service. These areas appear to be rather remote and lack of service is not necessarily a negative if these areas lack current population as discussed earlier with regards to population density. Thirty‐eight percent (38%) of the total land area is comprised of purple areas on the inset map. Purple indicates scores are at or above the threshold. These areas are considered to have adequate levels of service, although this does not necessarily imply that the mix of features being offered is one that residents currently desire. It may be that changes and/or improvements are needed within the purple‐shaded areas to fit the specific mix of services to the needs and expectations of residents. Again, this is determined through the public process. The purple areas on the map show that much of the built‐out residential parts of Palm Springs are served at values at or above the threshold. This is an indication that Palm Springs has a good distribution of parkland and facilities, and that there are adequate amounts of components within those parks to add up to a desired threshold of service. However, as explained earlier, the threshold scores can be met by any combination of components, and not necessarily the particular ones that offer diverse opportunities to residents or match up with their specific needs or interests.

Parks and Recreation Master Plan ‐ DRAFT 65
Figure 12: Perspective B: Walkable Access to All Components This perspective is similar to Perspective A in that it measures the service provided by all components in the dataset, but the difference is that it reflects only the service available within convenient walking distance. A radius of 1/3 mile for each component is used to define the area within which the component can be reached within a convenient walk, even when the route is non‐direct, such as would occur in a neighborhood of gridded streets. It is a conservative measure in that older or younger citizens, and those with strollers, wheelchairs, or other devices should normally be able to get to a destination within 1/3 mile. The analysis does not take into account the quality, character, condition, or other aspects of walking routes to get to the components, or if they even exist. However, it does account for major barriers such as highways, railroad tracks, and waterways. This Perspective primarily measures the cumulative number of components available within walking distance, and the desirability of walking to them, in terms of their functionality for their intended purpose. It does not weigh the relative merits of one type of destination over another.
Table 5 shows the statistics derived from Perspective B: Walkable Access to All Components (Figure 12). The table shows that 38 percent of the entire study area has some level of walk‐to‐service, meaning that the GRASP® score for that area according to this Perspective is greater than zero. Table 5: Perspective B ‐ Walkable Access to All Components – LOS Scores
Percent of Total with LOS
Average LOS per Acre Served
Avg. LOS Per Acre/ Population per acre
GRASP® Index
City of Palm Springs (Perm) 38% 62 84 26
City of Palm Springs (Perm+) 38% 62 48 15
The column with the GRASP® Indices in Table 5 is identical to Table 4 because the computation for this is not affected by service radii. Similar to the Perspective A we can analyze the threshold in the inset Map PB‐2, with purple and yellow shaded areas shown on it. It shows where the cumulative LOS on Perspective B falls above or below the Threshold Value, as described earlier. The threshold value used for this Perspective is also 67.2.
66 City of Palm Springs
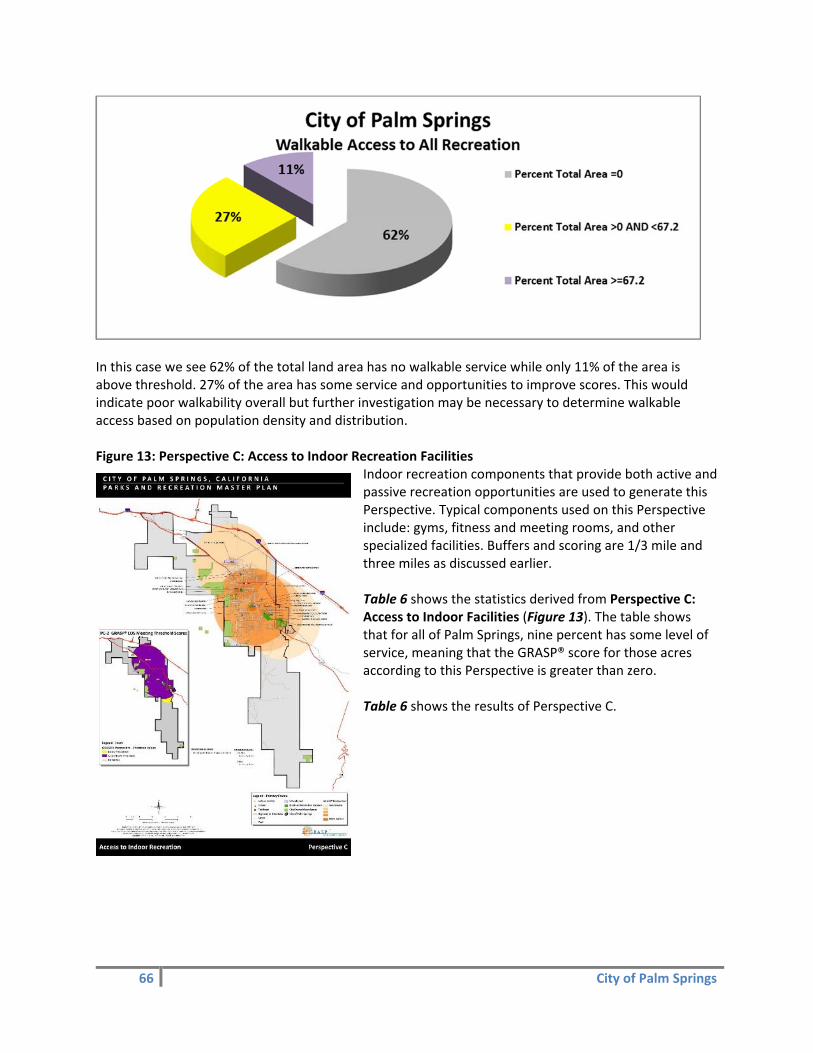
In this case we see 62% of the total land area has no walkable service while only 11% of the area is above threshold. 27% of the area has some service and opportunities to improve scores. This would indicate poor walkability overall but further investigation may be necessary to determine walkable access based on population density and distribution. Figure 13: Perspective C: Access to Indoor Recreation Facilities
Indoor recreation components that provide both active and passive recreation opportunities are used to generate this Perspective. Typical components used on this Perspective include: gyms, fitness and meeting rooms, and other specialized facilities. Buffers and scoring are 1/3 mile and three miles as discussed earlier. Table 6 shows the statistics derived from Perspective C: Access to Indoor Facilities (Figure 13). The table shows that for all of Palm Springs, nine percent has some level of service, meaning that the GRASP® score for those acres according to this Perspective is greater than zero. Table 6 shows the results of Perspective C.

Parks and Recreation Master Plan ‐ DRAFT 67
Table 6: Perspective C ‐ Access to Indoor Recreation Facilities – LOS Scores
Percent of Total with LOS
Average LOS per Acre Served
Avg. LOS Per Acre/Population per acre
GRASP® Index
City of Palm Springs (Perm) 50% 63 85 3
City of Palm Springs (Perm+) 50% 63 49 2
Because people typically expect to travel farther for indoor facilities, the distributed LOS as measured by this Perspective may not be as critical as the total availability of components and their total GRASP® value available to residents on a per‐capita basis. The dilemma faced by many communities when providing indoor recreation facilities is to decide whether components should be concentrated into fewer, larger centers that each provide a high level of service, or if they should be spread out to multiple smaller centers, with better proximity to the general population, but lower service values. Figure 14: Perspective D: Access to Outdoor Components
For this Perspective, only outdoor components in the inventory were used. It is the counterpoint to Perspective C, which showed the service provided by indoor components alone. Table 7 shows the statistics derived from Perspective D (Figure 14). Of the total area, 62 percent has service according to this analysis. This is the same coverage as shown in Perspective A where all components (indoor and outdoor) were included. This means that overall service coverage is not dependent upon indoor facilities. The decrease in Average LOS Per Acre Served from 86 points in Perspective A to the 81 points seen here reflects the relative contributions of indoor and outdoor components to the overall LOS picture for Palm Springs. Similar results can be observed for the Average LOS Per Acre Per Population Density and the GRASP® Indices.
Table 7: Perspective D – Access to Outdoor Recreation – LOS Score
Percent of Total with LOS
Average LOS per Acre Served
Avg. LOS Per Acre / Population per acre
GRASP® Index
City of Palm Springs (Perm) 62% 85 115 23
City of Palm Springs (Perm+) 62% 85 66 13

68 City of Palm Springs
Figure 15: Perspective E: Access to Sports Fields This perspective shows the LOS for all sports fields in the inventory, including softball, baseball, and multi‐use fields. Both the main perspective and the inset Perspective E‐2: GRASP® LOS Meeting Threshold Scores show a concentration of fields in Palm Springs around Demuth Park. The threshold value for this Perspective is based on a score of 9.6 (See Appendix D). Table 8 shows the values derived from Perspective E (Figure 15). Overall, 17 percent of Palm Springs is covered by service for sports fields. The concentration of fields in one area is not necessarily an issue and could be a benefit, depending on the intentions for those fields. Concentrating fields in one location is advantageous for purposes of leagues and tournaments, but having some fields distributed through the community is beneficial for informal play and practices.
Table 8: Perspective E ‐ Access to Sports Fields – LOS Scores
Percent of Total with LOS
Average LOS per Acre Served
Avg. LOS Per Acre/ Population per acre
GRASP® Index
City of Palm Springs (Perm) 14% 17 23 2
City of Palm Springs (Perm+) 14% 17 13 1