3689 UDE Gary Chen May 2014. Disclaimer The information contained in this confidential document...
38
Solution Provider For the Secure Transmission of Data 3689 UDE Gary Chen May 2014
-
Upload
mark-carpenter -
Category
Documents
-
view
216 -
download
0
Transcript of 3689 UDE Gary Chen May 2014. Disclaimer The information contained in this confidential document...

Solution ProviderFor the Secure Transmission of Data
3689 UDE
Gary Chen
May 2014

Disclaimer• The information contained in this confidential document ("Presentation") has been prepared by UDE (the "Company"). It has not been fully verified and is
subject to material updating, revision and further amendment.
• While the information contained herein has been prepared in good faith, neither the Company nor any of its shareholders, directors, officers, agents, employees or advisers gives, has given or has authority to give, any representations or warranties (express or implied) as to, or in relation to, the accuracy, reliability or completeness of the information in this Presentation, or any revision or supplement thereof, or of any other written or oral information made or to be made available to any interested party or its advisers (all such information being referred to as "Information") and liability therefore is expressly disclaimed. Accordingly, neither the Company nor any of its shareholders, directors, officers, agents, employees or advisers takes any responsibility for, or will accept any liability whether direct or indirect, express or implied, contractual, tortious, statutory or otherwise, in respect of, the accuracy or completeness or injury of the Information or for any of the opinions contained herein or for any errors, omissions or misstatements or for any loss, howsoever arising, from the use of this Presentation or the information.
• Neither the issue of this Presentation nor any part of its contents is to be taken as any form of commitment on the part of the Company to proceed with any transaction and the right is reserved by the Company to terminate any discussions or negotiations with any prospective investors. In no circumstances will the Company be responsible for any costs, losses or expenses incurred in connection with any appraisal or investigation of the Company. In furnishing this Presentation, the Company does not undertake or agree to any obligation to provide the recipient with access to any additional information or to update this Presentation or to correct any inaccuracies in, or omissions from, this Presentation which may become apparent.
• This Presentation should not be considered as the giving of investment advice by the Company or any of its shareholders, directors, officers, agents, employees or advisers. Each party to whom this Presentation is made available must make its own independent assessment of the Company after making such investigations and taking such advice as may be deemed necessary. In particular, any estimates or projections or opinions contained herein necessarily involve significant elements of subjective judgment, analysis and assumptions and each recipient should satisfy itself in relation to such matters.
• This Presentation includes certain statements that may be deemed “forward-looking statements”. All statements in this discussion, other than statements of historical facts, that address future activities and events or developments that the Company expects, are forward-looking statements. Although the Company believes the expectations expressed in such forward-looking statements are based on reasonable assumptions, such statements are not guarantees of future performance and actual results or developments may differ materially from those in the forward-looking statements. Factors that could cause actual results to differ materially from those in forward-looking statements include market prices, continued availability of capital and financing, general economic, market or business conditions and other unforeseen events. Prospective Investors are cautioned that any such statements are not guarantees of future performance and that actual results or developments may differ materially from those projected in forward-looking statements.
2

• We are a Global Leader in Ethernet Technology Applications.
• We are the rare manufacturer that is able to combine automated volume production capability with a high degree of product customization.
• While we are proud of our historical record of healthy growth in profits and 20%+ ROE, we seek investors who believe in our vision for future growth.
• We are not wedded to any single product, but instead seek to leverage UDE manufacturing management expertise to seek out new business opportunities.
3
UDE – Young and Restless

4
2013 Results & 2014 Outlook
Strategic Vision for 2014 & Beyond
The UDE Way
Appendix

5
2013 Results and 2014 Outlook

Total Shareholder Return was 54% in 2013
• Share Price Appreciation: UDE’s share price rose 48% in 2013, closing at NT$91.1/share on December 31, 2013.
• A 5.8% Yield: We paid a cash-dividend of NT$3.8/share on 2012 earnings, representing a 5.8% yield based on UDE’s year-end 2012 close.
• Rising Dividend Payment: The UDE Board of Directors has proposed a cash dividend of NT$4.5/share for 2013 earnings. This is an increase of 18% over 2012 and represents a 60% payout.
6

Review of 2013 Operating Results
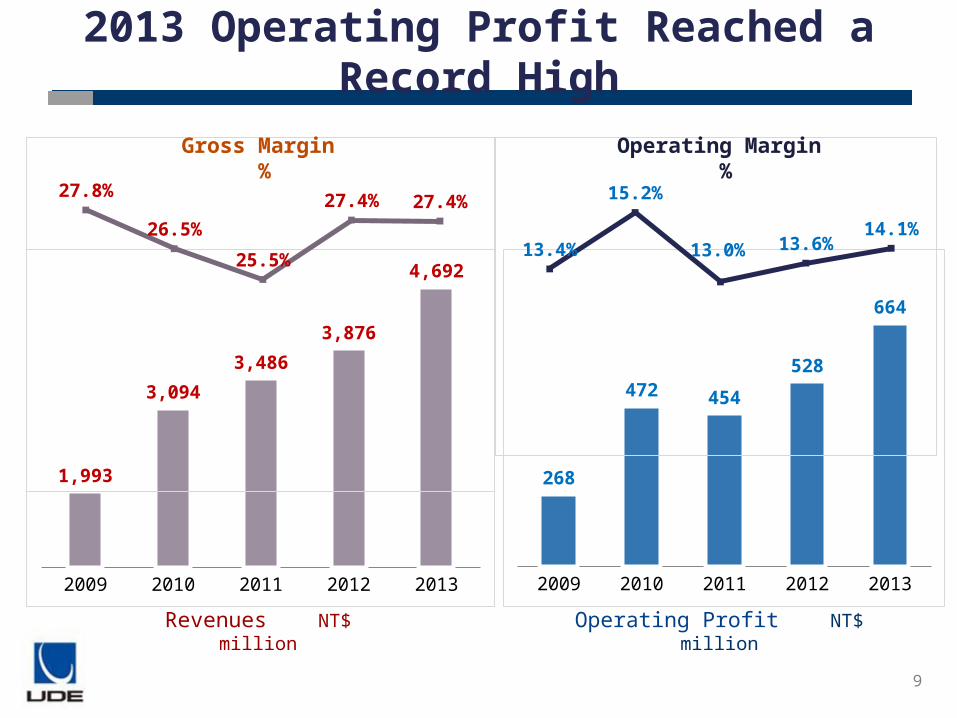
• Record High Revenues: UDE’s 2013 revenue reached a record NT$4.7bn, growing 21% YoY.
• Margin Expansion: Operating income and Income Before Tax both reached record highs, growing by 26% and 25% YoY, respectively.
- Networking revenues reached a record high 38% of sales.
- Efficiency and automation gains extended our cost advantage versus peers.
• Higher Tax Rate: Effective 2013 tax rate was 23.7% versus 17.8% in 2012.
- Higher tax rate for Dongguan plant.
- Extra taxes were booked in 3Q13 due to insufficient booking of taxes for the China plant in the previous two years.
7

2009 2010 2011 2012 20130
1,000
2,000
3,000
4,000
5,000
61% 46% 45% 35% 29%
23% 23%
25% 34%38%
16%
31%30%
31%
33%
PC Networking Consumer
Networking Revenues are Driving Revenue Growth
NT$mn
8
2009 2010 2011 2012 2013
1,993
3,094
3,486
3,876
4,692
2009 2010 2011 2012 2013
268
472 454
528
664
13.4%
15.2%
13.0% 13.6%14.1%
27.8%
26.5%
25.5%
27.4% 27.4%
Revenues NT$ million
Gross Margin %
Operating Profit NT$ million
Operating Margin %
2013 Operating Profit Reached a Record High
9

UDPS + Automation: Continued Payoff in 2013
10
More efficient production and higher profitability
Growth in number of operators
Growth in unit production-20%
-10%
0%
10%
20%
30%
40%
50%
60%
70%
39%
62%
-7%
5%
-6%
16%
-2%
16%
2010 v 2009 2011 v 20102012 v 2011 2013 v 2012
2008 2009 2010 2011 2012 20130
200
400
600
800
1,000
1,200
1,400
0%
5%
10%
15%
20%
25%
30%
0 34
408 483
662
1,078
19%
28%27% 26%
27% 27%
19%
26%
13%12%
10%
4%
Estimated Gross Margin Improvement from TPSReported Gross Margin (includes effects of TPS implementation)Estimated Gross Margin (without TPS implementation)
NT$ million

2014 Outlook
11
A strong start to 2014:1Q14 revenues grew 15% YoY to NT$1.28bn as a strong start to 2014.
Pricing Pressure: Our clients in the PC and consumer space are under significant pricing pressure.
Accelerated investment in Capex: The outlook for volume demand is strong. We are also optimistic about the prospects for share gains in the networking segment, and subsequent product mix improvement.
Accelerated investment in Sales & Marketing + R&D: We feel that the timing is right to put increased emphasis on the development of advanced products and penetration into these markets.

12
Strategic Vision for 2014 & Beyond

Strategic Vision for 2014 & Beyond
13
Robust Investment in Advanced Products and Markets
1.
Systematic Cultivation of Human Resources
2.
Accelerate Process Automation3.

Integrated Investment in R&D, Sales and Marketing
14
Robust R&D Investment
R&D spending to be increased by 50% over the next two years.
Focus to be on high-end networking products
Will establish an advanced R&D lab in Taiwan.

Investing in HR to Manage Future Growth
15
• With an eye to the next stage of UDE’s growth, we are cultivating teams of veteran employees that will be capable of managing new product initiatives.
Systematic Training SOP: We have established a program of rigorous and systematic training for all UDE operators and technicians.
Apprenticeship Program in Sichuan: We offer 2-year apprenticeships with on-site plant training to students attending our technical college.
• We are pursuing organic product development and M&A, seeking to take small but promising business lines and expand their scale.
We see ample room for growth in our core business, but want to stay ahead of the game

16
The UDE Way

17
Differentiated Product Focus
Targeting Market Share Gains
Outstanding Financial Performance
Keeping Up With the Cloud
The UDE Way

The UDE Way
18
Soft Power
UDPS Lean Production System
Production Line Automation
Strict Cost Management
1.
2.
3.
4.

Representative Principles of Soft Power
19
Employee Development
•Training for employees in UDPS methods in Japan and Taiwan.
•Work groups are promoted as a team.
•Production requirements double with each promotion.
•Production lines to eventually have only technicians, no operators.Work Smart
•Discourage frequent overtime.
•Show concern for staff contentment on the job.
•Emphasize teamwork, communication and efficiency.
Creative Destruction
•Overthrow the traditional principles of production.
•Do not be satisfied with the status quo.

UDE is a rarity – a high volume, low cost leader that also offers a highly customized product
Product Offering
Customer Base
Wide range of electrical characteristics and structural options Highly customized with low volume production run capability 8,500 active part numbers 4,700 different models produced each month
Low single client risk : 60% of sales from top ten clients No client accounts for more than 15% of sales, only one client accounts for more
than 10%. 1,300 active client accounts.
IndustryAttributes
Barriers to entry are high RJ45 Jack industry has only a handful of major players These are UDE, Foxconn, Bel Fuse, Molex and Pulse Bel Fuse has the most advanced technology UDE is the largest scale producer and the low-cost leader
20

UDE Possesses Excellent Electromagnetic Signal Processing and Customization Capability
Signal Input Signal Filtering System Protection Signal Output
Filter Surge/ESD ProtectionIntegrated Ethernet ICRJ45 LAN Cable
Noise FilteringSignal PurificationEMI Control
Protection of networking IC and motherboard
Customized high frequency electromagnetic impedance design to match customer systems
Goal:Maintain high S/N ratio to guarantee complete and rapid signal transmission to the network IC on client motherboard
21

The Most Diverse Application Base of Any RJ45 Producer
MB / AIO PC Networking Set-Top BOX Server Blu-ray Player/ Internet TV
Game Consoles Printer
√ √ √ √ √ √ √
√ √ √ √
√ √ √ √
√ √
√ √
√ √
√ √ √
√ √
22

Selling to global leaders in key product categories
MB / AIO PC
23
Networking PrinterServerSet-Top Box Blu-ray Player/ Internet TV
/ Game Consoles

UDE’s Revenue and Market Share Targets
24
Penetrate the high end
networking market
Claim share in the mass market
consumer segment
Raise global market share
to 15%
Grow annual revenues to
NT$10bn

-
100,000,000
200,000,000
300,000,000
400,000,000
500,000,000
600,000,000
700,000,000
0%
10%
20%
30%
40%
50%
60%
70%1,650Additional addressable market* Market size
Market Share (%, RHS)
Mn units
⌇⌇
New Worlds to Conquer…
25
UDE’s current global market share is 9.5%
* Additional addressable market refers to devices that do not currently have RJ 45 connections, but are expected to incorporate them in the future.
Source: brokers and UDE estimates

2009 2010 2011 2012 2013
84
341 353
444
514
1.65
6.456.08
7.087.69
EPS NT$ Net Income NT$ million
2009 2010 2011 2012 2013
11.6
37.0
27.3 24.823.7
6.0
18.1
14.2 14.0 13.3
ROE % ROA %
Five-year Financial Highlights
26
Note: 2009 Net Profit was biased downwards by an NT$122m one time non-cash write down of goodwill.

2009 2010 2011 2012 2013
Sales Revenue 1,993 3,094 3,486 3,876 4,692
Gross Profit 553 820 890 1,063 1,284
OP Profit 268 472 454 528 664
Income before tax 130 409 481 539 674
Net Income 84 341 353 443 514
EPS(NTD$) 1.65 6.45 6.08 7.08 7.69
Five-year P&L (Consolidated)
NT$ millionYOY (%)
2009 2010 2011 2012 2013
27.2 55.2 12.7 11.2 21.1
84.0 48.3 8.5 19.5 20.8
114.0 76.1 -3.8 16.3 25.7
-9.0 215.4 17.7 12.0 25.1
-28.7 305.1 3.7 25.5 16.0
-35.3 291.0 -5.8 16.5 8.6
27

NT$ million 2009 2010 2011 2012 2013
TOTAL ASSETS 1,565 2,194 2,784 3,567 4,356
Cash 314 275 751 1,099 1,258
NR & AR 580 706 757 918 1,184
Inventory 255 413 435 715 881
Non-current Asset 332 605 675 629 785
TOTAL LIABILITIES 774 1,142 1,248 1,526 1,977
Bank Loans 178 237 426 419 417
NP & AP 233 352 303 433 476
Other Payables 268 365 427 570 695
TOTAL EQUITY 791 1,052 1,537 2,041 2,340
Capital 527 532 614 676 676 Additional Paid-in Capital 112 112 323 568 582
Retained Earnings 149 426 600 828 1,091
Five-year Balance Sheet (Consolidated)
28
A/R turnover days 86 76 77 79 82
Inventory turnover days 65 54 60 75 84
A/P turnover days 46 47 46 48 48
YOY (%)
2009 2010 2011 2012 2013
25.9 40.2 26.9 28.1 22.1
119.5 -12.5 173.3 46.3 14.4
60.1 21.6 7.4 21.2 28.9
-2.2 61.6 5.4 64.4 23.1
-9.4 82.3 11.6 -6.8 24.8
31.8 47.6 9.2 22.3 29.6
2.9 32.9 79.9 -1.7 -0.3
78.5 50.8 -13.7 42.6 10.1
49.1 36.1 16.9 33.4 22.0
20.6 32.9 46.1 32.9 14.6
9.2 0.9 15.4 10.1 -
154.0 0.8 187.4 75.8 2.4
21.4 186.6 40.6 38.2 31.7

2011-2013 Dividend Payout
( NT$ Million ) 2011 2012 2013
Net income 353 444 514
Cash dividend 215 257 306
Dividend p/s (NT$) 3.5 3.8 4.5
Cash yield (%) 6.7*1 5.3*2 4.2*3
Payout ratio (%) 61% 58% 60%
29
Notes: 1. 2011 yield is based on UDE’s closing share price on July 23, 2012; the day before ex-dividend day. 2. 2012 yield is based on UDE’s closing share price on July 5, 2013; the day before ex-dividend day.3. 2013 yield is based on UDE’s closing share price on March 24, 2014.

• We pledge that our primary focus will be the maximization of returns to our shareholders via the profitable long-term growth of our core business
• We aim to sustain revenue and earnings growth superior to that of our peers
• We intend to maintain a cash dividend payout in excess of 50%
Our Commitment to Shareholders
30

31
Appendix

World No. 2 in RJ-45 Port Revenues
Founded in 2005
Ticker: 3689 TT
4,300 Full Time Employees
Dedicated Mfg of Integrated RJ-45 Ports
2013 Revenue of NT$4.7Bn
Headquarters: Taoyuan, Taiwan
Deyang, Sichuan, China Plant: High Volume Mass Production
Donguan, Guangzhou, China Plant: Product and Automation R&D, High Value- Added Production
32
RJ45 Revenues (US$m)
Note: Bel Fuse acquired RJ45 port business of TE Connectivity in March 2013. This chart includes the TE Connectivity revenues in Bel Fuse’s total revenues.
Series1
0 50 100 150 200 250

Assembly- UDPS implementation ~2008 2008~2009 2010~2012 2013
Linear line70~130 OPs
U Line implementation25~30 OPs
Small U line8~12 OPs
Advanced U line3~5 OPs
33
OP Production line PPH Capacity/hr
Linear line 80 1 10 pcs 800 pcs
U line 80 10 (8 P/line) 80 pcs 6,400 pcs

Manual Winding VS Auto Winding
Twisting Winding Assembly Process Complete
Hourly output Defect Rate
Manual winding 50 pcs 2-4%
Auto winding 650 pcs Below 0.2%
34
A Pictorial Illustration of the Manual Winding Process

Experienced and Stable Int’l Mgmt Team
Chris Chen, President21-yrs experience Vice President, SpeedTechManager of Mfg Technology, Delta
Justin ChangVice President of Guangdong Factory21-yrs experience SpeedTech KunShan Plant Manager
Tony HuangExecutive Assistant to the Chairman19-yrs experience CFO, Technology Quartek
Eric Shih, Head of Sales17-yrs experience Sales Manager, SpeedTechSupervisor – Sales, Delta Electronics
Elton WuCFO19-yrs experience Accounting Manager, Delta Electronics
Abel LuVice President of Sichuan Factory26-yrs experience SpeedTech Dongguan R&D Manager
Alan WangHead of Audit and Head of IR19-yrs experience TongLung Industry, Executive Assistant to the Chairman
Abulla YuHead of R&D17-yrs experience Vice Manager of R&D, Delta Electronics
Gary ChenFounder and ChairmanOver 25-yrs experienceVice Chairman and President, SpeedTech
35

36
4%10%
18%
11%
35%
20%16% 17% 15%
Quarterly Revenue Trend
NT$ million
YoY Growth
1Q12 2Q12 3Q12 4Q12 1Q13 2Q13 3Q13 4Q13 1Q14 600
700
800
900
1,000
1,100
1,200
1,300
1,400
824
1,000
1,054
997
1,110
1,198 1,221
1,163 1,276

37
1Q12 2Q12 3Q12 4Q12 1Q13 2Q13 3Q13 4Q13 1Q14
116 107
161
143
166
186 174
137
193
14.1%
10.7%
15.3%
14.4%
15.0%15.5%
14.3%
11.8%
15.2%
Gross Profit NT$ million
Gross Margin %
Operating Profit NT$ million
Operating Margin %
Quarterly Gross Profit and Operating Profit
28.8%
26.2%
27.4%27.6%
27.3%
28.5%27.9%
25.7%
27.8%
1Q12 2Q12 3Q12 4Q12 1Q13 2Q13 3Q13 4Q13 1Q14
238
262
289 275
303
342 340
299
354

38
1Q12 2Q12 3Q12 4Q12 1Q13 2Q13 3Q13 4Q13 1Q140
200
400
600
800
1000
1200
1400
39% 34% 34% 35% 29% 28% 28% 31% 28%
30%36% 35% 34% 41% 40% 35% 34%
36%
31%
30%31%
31%
30%32% 37% 35%
36%
PC Networking Consumer
Sales Breakdown by Application
NT$ million