
2017 EMEA Aon Report Final Updated A4Conv 091017b EMEA Cyber Risk...2017 Europe, Middle East & Af...
36
2017 Europe, Middle East & Africa Cyber Risk Transfer Comparison Report Sponsored by Aon Risk Solutions Independently conducted by Ponemon Institute LLC Publication Date: October 2017
Transcript of 2017 EMEA Aon Report Final Updated A4Conv 091017b EMEA Cyber Risk...2017 Europe, Middle East & Af...

2017 Europe, Middle East & Africa Cyber Risk Transfer Comparison Report
Sponsored by Aon Risk Solutions Independently conducted by Ponemon Institute LLC Publication Date: October 2017
Ponemon Institute© Research Report
Page 1
ExecutiveSummary WannaCry and Petya ransomware attacks firmly established the danger that cyber risk poses to both businesses and society today. Affected organisations ranged across a huge variety of sectors; public, private, large, small, domestic and international, and recognised brands and trusted public institutions were forced to admit sizable losses both to IT assets and business disruption. In light of these two destructive events, evidence compiled in this report demonstrates that information assets are underinsured against theft or destruction based on the probable maximum loss (PML) and likelihood of an incident, despite actual losses already hitting the bottom line of EMEA organisations. On top of financial and operational exposures, organisations across EMEA show varying degrees of preparedness for the legal and compliance challenges they face over the coming years. This is particularly true of organisations handling the personal data of EU individuals, which will have to comply with the EU General Data Protection Regulation (GDPR). Key findings in the report include:
- Organisations commit four times more insurance spend on protecting physical assets like Property, Plant and Equipment (PP&E) than they do for information assets
- Only 15% of the probable maximum loss (PML) potential for information assets is covered by insurance; almost two thirds (60%) of total PP&E asset values are protected
- The impact of business disruption to information assets is 50% greater than to PP&E
- Only 7% of cyber insureds have limits exceeding $21m falling below that of business interruption PML $227m
- 38% of organisations have experienced a genuine cyber loss in the past 24 months, averaging $3.3m
- Only 30% of businesses state they are “fully aware” of the economic and legal consequences of an international data breach or security exploit
Build cyber resilience One revealing aspect of the data is how buyers value services and support networks over indemnification alone. Organisations demand a service network that can respond instantaneously in the event of a cyber-attack in order to meet regulators’ breach reporting mandates, and to respond to threats facing their reputation, operations and business interruption. With 65% of EMEA organisations expecting their cyber risk exposure to increase over the next two years, risk transfer options are continuously evolving with insurance policies coming to market to meet this demand. Due to the significant vulnerabilities faced by organisations, cyber risk needs to be approached as an enterprise-wide risk to achieve cyber resilience.
GDPR – an imminent challenge The EU General Data Protection Regulation (GDPR) introduces a 72-hour notification requirement for all personal data breaches, except those which are unlikely to pose a risk to individuals. Fines for non-compliance with the EU GDPR will increase to as much as €20 million or, if higher, to 4% of an organisation’s annual global turnover. This is a significant escalation from the current penalties under existing data protection laws. The EU GDPR will create significant challenges for business, particularly following a loss or exposure of personal data per the effective date of the 25th of May 2018.
Ponemon Institute© Research Report
Page 2
2017 Cyber Risk Transfer Comparison Report Sponsored by Aon Risk Solutions
Independently Conducted by Ponemon Institute LLC Publication Date: October 2017
Part 1. Introduction The purpose of this research is to compare the relative insurance protection of certain tangible1 versus intangible2 assets. How do cyber asset values and potential losses compare to tangible asset values and potential losses from an organisation’s other perils, such as fire and weather? The probability of any particular building burning down is significantly lower than one percent (1%). However, most organisations spend much more on fire insurance premiums than on cyber insurance, despite stating in their publicly disclosed documents that a majority of the organisation’s value is attributed to intangible assets.3 One concrete example is the sale of Yahoo!: Verizon reduced the purchase price by $350 million because of the severity of cyber incidents in 2013 and 2014. Acceleration in the scope, scale and economic impact of technology multiplied by the concomitant data revolution, which places unprecedented amounts of information in the hands of consumers and businesses alike, and the proliferation of technology-enabled business models,4 force organisations to examine the benefits and consequences of emerging technologies.5 This financial statement quantification study demonstrates that organisations recognise the growing value of technology and data assets relative to historical tangible assets, yet a disconnect remains regarding cost-benefit analysis resource allocation. Particularly, a disproportionate amount is spent on tangible asset insurance protection compared to cyber asset protection6 based on the respective relative financial statement impact and potential expected losses.7 Quantitative models are being developed that evaluate the return on investment of various cyber risk management IT security and process solutions, which can incorporate cost-benefit analysis for different levels of insurance.8 As such, organisations are driven toward a holistic capital expenditure discussion spanning functional teams rather than being segmented in traditional siloes. The goal of these models is to identify and protect critical assets by aligning macro-level risk tolerance more consistently.
1 Property, Plant & Equipment (PP&E) 2 Computer systems and related digital assets. Most other cyber-incident studies include damage estimates of subjective intangible assets that are difficult to quantify and almost impossible to insure, such as brand and reputation. Furthermore, the value of trade secrets and patent infringement are typically excluded from cyber insurance, although there are new models being developed to quantify intangible intellectual property values, which could eventual lead to viable insurance in the near future. 3 More than 80% of a organisation’s value is derived from intangible assets according to some studies. 4 No Ordinary Disruption: The Four Global Forces Breaking All the Trends. McKinsey Global Institute. 5 Source: World Economic Forum Global Risks Perception Survey 6 Aon has placed primary cyber insurance with 67 different insurance carriers, which entails 67 different insurance applications, underwriting processes, policy form wording, servicing capabilities and claims payment aptitude. 7 Unfortunately, it is not a binary discussion because property, general liability, crime, kidnap & ransom and other lines of insurance may intentionally or unintentionally include elements of cyber coverage. 8 A 2016 Rand Study found contrary results: “Cost of Cyber Incidents Not Large Compared with Other Business Losses; May Influence Responses by Businesses”

Ponemon Institute© Research Report
Page 3
An interesting perspective on the perceived benefits and negative consequences of 12 emerging technologies is the Global Risks Report published by the World Economic Forum (WEF), as shown in Figure 1. This year, the WEF’s Global Risks Perception Survey considered the impact of 12 emerging technologies.9 While the results suggest that the benefits of these technologies outweigh the negative consequences, there is a need for better governance of emerging technologies. Figure 1. Examining the risk: Benefit analysis of intangible & intangible assets
9 World Economic Forum Global Risks Perception Survey http://reports.weforum.org/global-risks-2017/part-3-emerging-technologies/3-1-understanding-the-risk-landscape/
Ponemon Institute© Research Report
Page 4
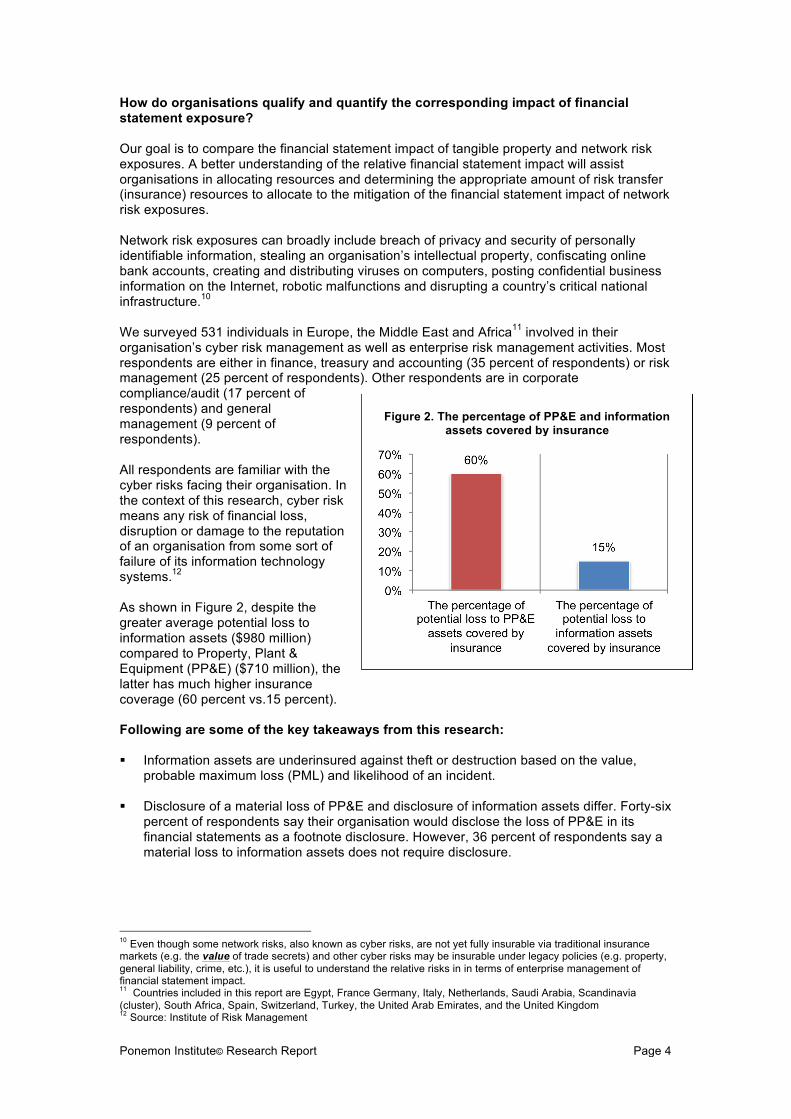
How do organisations qualify and quantify the corresponding impact of financial statement exposure? Our goal is to compare the financial statement impact of tangible property and network risk exposures. A better understanding of the relative financial statement impact will assist organisations in allocating resources and determining the appropriate amount of risk transfer (insurance) resources to allocate to the mitigation of the financial statement impact of network risk exposures. Network risk exposures can broadly include breach of privacy and security of personally identifiable information, stealing an organisation’s intellectual property, confiscating online bank accounts, creating and distributing viruses on computers, posting confidential business information on the Internet, robotic malfunctions and disrupting a country’s critical national infrastructure.10 We surveyed 531 individuals in Europe, the Middle East and Africa11 involved in their organisation’s cyber risk management as well as enterprise risk management activities. Most respondents are either in finance, treasury and accounting (35 percent of respondents) or risk management (25 percent of respondents). Other respondents are in corporate compliance/audit (17 percent of respondents) and general management (9 percent of respondents). All respondents are familiar with the cyber risks facing their organisation. In the context of this research, cyber risk means any risk of financial loss, disruption or damage to the reputation of an organisation from some sort of failure of its information technology systems.12 As shown in Figure 2, despite the greater average potential loss to information assets ($980 million) compared to Property, Plant & Equipment (PP&E) ($710 million), the latter has much higher insurance coverage (60 percent vs.15 percent). Following are some of the key takeaways from this research: ! Information assets are underinsured against theft or destruction based on the value,
probable maximum loss (PML) and likelihood of an incident. ! Disclosure of a material loss of PP&E and disclosure of information assets differ. Forty-six
percent of respondents say their organisation would disclose the loss of PP&E in its financial statements as a footnote disclosure. However, 36 percent of respondents say a material loss to information assets does not require disclosure.
10 Even though some network risks, also known as cyber risks, are not yet fully insurable via traditional insurance markets (e.g. the value of trade secrets) and other cyber risks may be insurable under legacy policies (e.g. property, general liability, crime, etc.), it is useful to understand the relative risks in in terms of enterprise management of financial statement impact. 11 Countries included in this report are Egypt, France Germany, Italy, Netherlands, Saudi Arabia, Scandinavia (cluster), South Africa, Spain, Switzerland, Turkey, the United Arab Emirates, and the United Kingdom 12 Source: Institute of Risk Management
Figure 2. The percentage of PP&E and information
assets covered by insurance
Ponemon Institute© Research Report
Page 5
! Despite the risk, companies are reluctant to purchase cyber insurance coverage. Sixty-five percent of respondents believe their organisation’s exposure to cyber risk will increase over the next 24 months. However, only 23 percent of respondents say their organisation has cyber insurance coverage.
! Thirty-eight percent of companies represented in this study experienced a material or
significantly disruptive security exploit or data breach one or more times during the past two years, with an average economic impact of $3.3 million.
! Eighty-eight percent of respondents believe cyber liability is one of the top 10 business
risks for their organisation.
Ponemon Institute© Research Report
Page 6
Part 2. Key findings The complete audited findings are presented in the appendix of this report. We have organised the report according to the following topics:
a. Differences between the valuation and PML of PP&E and information assets b. The cyber risk experience of companies c. Perceptions about the financial impact of cyber exposures
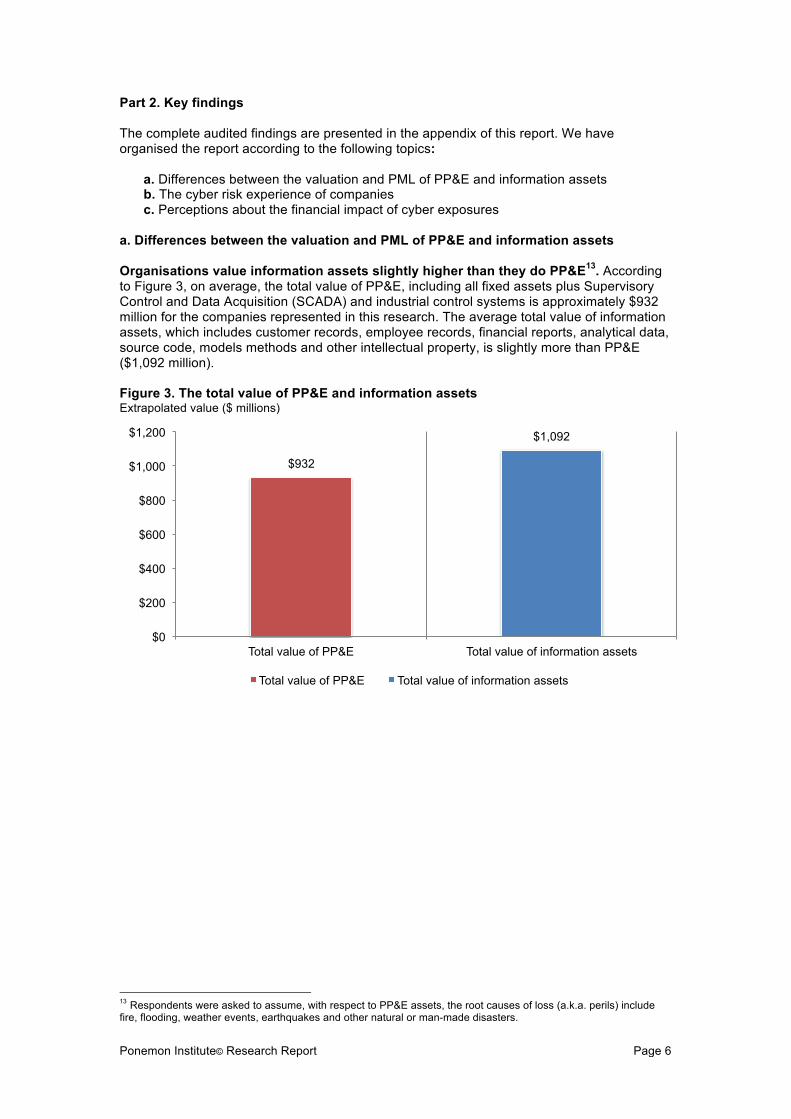
a. Differences between the valuation and PML of PP&E and information assets Organisations value information assets slightly higher than they do PP&E13. According to Figure 3, on average, the total value of PP&E, including all fixed assets plus Supervisory Control and Data Acquisition (SCADA) and industrial control systems is approximately $932 million for the companies represented in this research. The average total value of information assets, which includes customer records, employee records, financial reports, analytical data, source code, models methods and other intellectual property, is slightly more than PP&E ($1,092 million). Figure 3. The total value of PP&E and information assets Extrapolated value ($ millions)
13 Respondents were asked to assume, with respect to PP&E assets, the root causes of loss (a.k.a. perils) include fire, flooding, weather events, earthquakes and other natural or man-made disasters.
$932
$1,092
$0
$200
$400
$600
$800
$1,000
$1,200
Total value of PP&E Total value of information assets
Total value of PP&E Total value of information assets
Ponemon Institute© Research Report
Page 7
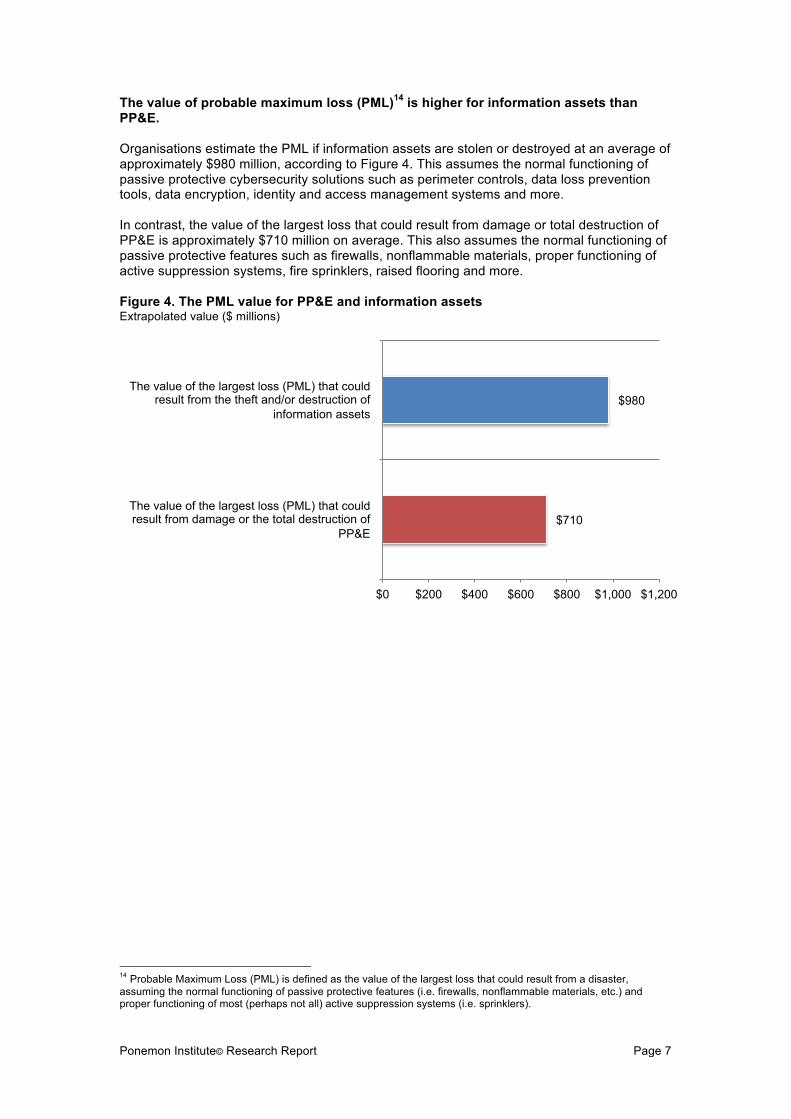
The value of probable maximum loss (PML)14 is higher for information assets than PP&E. Organisations estimate the PML if information assets are stolen or destroyed at an average of approximately $980 million, according to Figure 4. This assumes the normal functioning of passive protective cybersecurity solutions such as perimeter controls, data loss prevention tools, data encryption, identity and access management systems and more. In contrast, the value of the largest loss that could result from damage or total destruction of PP&E is approximately $710 million on average. This also assumes the normal functioning of passive protective features such as firewalls, nonflammable materials, proper functioning of active suppression systems, fire sprinklers, raised flooring and more. Figure 4. The PML value for PP&E and information assets Extrapolated value ($ millions)
14 Probable Maximum Loss (PML) is defined as the value of the largest loss that could result from a disaster, assuming the normal functioning of passive protective features (i.e. firewalls, nonflammable materials, etc.) and proper functioning of most (perhaps not all) active suppression systems (i.e. sprinklers).
$710
$980
$0 $200 $400 $600 $800 $1,000 $1,200
The value of the largest loss (PML) that could result from damage or the total destruction of
PP&E
The value of the largest loss (PML) that could result from the theft and/or destruction of
information assets
Ponemon Institute© Research Report
Page 8
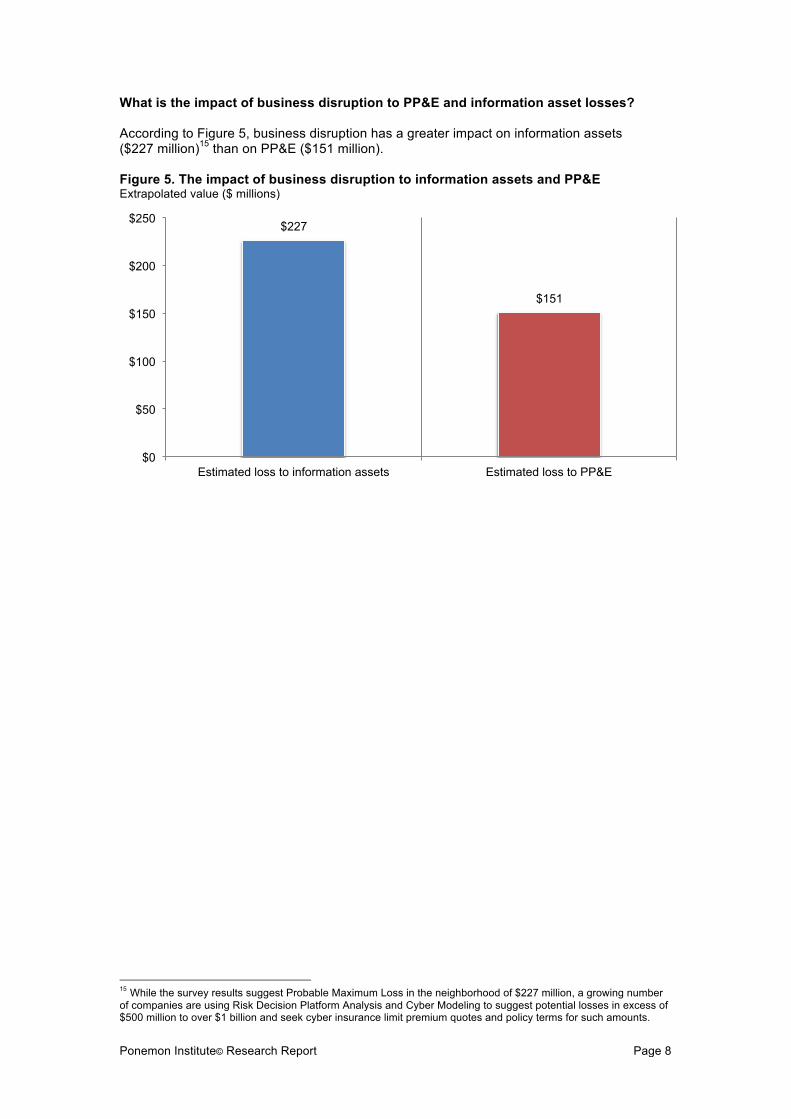
What is the impact of business disruption to PP&E and information asset losses? According to Figure 5, business disruption has a greater impact on information assets ($227 million)15 than on PP&E ($151 million). Figure 5. The impact of business disruption to information assets and PP&E Extrapolated value ($ millions)
15 While the survey results suggest Probable Maximum Loss in the neighborhood of $227 million, a growing number of companies are using Risk Decision Platform Analysis and Cyber Modeling to suggest potential losses in excess of $500 million to over $1 billion and seek cyber insurance limit premium quotes and policy terms for such amounts.
$227
$151
$0
$50
$100
$150
$200
$250
Estimated loss to information assets Estimated loss to PP&E

Ponemon Institute© Research Report Page 9
There is a significant difference between the insurance coverage of PP&E and information assets.
On average, approximately 60 percent of PP&E assets are covered by insurance and approximately 27 percent of PP&E assets are self-insured (Figure 6)16. In contrast, an average of 15 percent of information assets are covered by insurance. Self-insurance is higher for information assets at 58 percent.
Figure 6. Percentage of PP&E and information assets covered by insurance Extrapolated percentage
The likelihood of a loss is higher for information assets than for PP&E.
Companies estimate the likelihood that they will sustain a loss to information assets totalling no more than 50 percent of PML over the next 12 months at 5.1 percent and 100 percent of PML at 2.6 percent, as shown in Figure 7. The likelihood of a loss to PP&E totalling no more than 50 percent of PML over the next 12 months is an average of 1.6 percent and at 100 percent of PML it is 0.45 percent.
Figure 7. Likelihood of loss to PP&E and information assets totalling more than 50 percent and 100 percent of PML over the next 12 months Extrapolated percentage
16 The percentages do not add up to 100 percent because they are extrapolated values from questions 3,4,10 and 11. These results are shown in the complete audited findings in the appendix of the report.
15%
27%
58%
60%
0% 10% 20% 30% 40% 50% 60% 70%
The percentage of potential loss to information assets covered by insurance
The percentage of potential loss to PP&E assets that is self-insured
The percentage of potential loss to information assets that is self-insured
The percentage of potential loss to PP&E assets covered by insurance
0.45%
1.6%
2.6%
5.1%
0.00% 1.00% 2.00% 3.00% 4.00% 5.00% 6.00%
The likelihood of a loss to PP&E assets totalling no more than 50 percent of PML over
the next 12 months
The likelihood of a loss to PP&E assets totalling 100 percent of PML over the
next 12 months
The likelihood of a loss to information assets totalling no more than 50 percent of PML over
the next 12 months
The likelihood of a loss to information assets totalling 100 percent of PML over the
next 12months

Ponemon Institute© Research Report Page 10
Disclosure of material loss to PP&E and disclosure of material loss to information assets also differs.
Figure 8 focuses on how organisations would disclose a material loss. Forty-six percent of respondents say their organisation would disclose a material loss to PP&E assets that is not covered by insurance in its financial statements as a footnote disclosure in the financial statement, followed by a disclosure as a contingent liability on the balance sheet, such as FASB 5, (21 percent of respondents). Thirty-eight percent of respondents say they would disclose a material loss to information assets as a footnote disclosure in the financial statements, but 36 percent of respondents do not believe disclosure would be necessary.
Figure 8. How would your organisation disclose a material loss to PP&E and information assets?
7%
13%
21%
13%
46%
6%
9%
11%
36%
38%
0% 5% 10% 15% 20% 25% 30% 35% 40% 45% 50%
Other
Discussion in the management letter
Disclosure as a contingent liability on the balance sheet
None – disclosure is not necessary
Footnote disclosure in the financial statements
Methods to disclose a material loss to information assets not covered by insurance
Methods to disclose a material loss to PP&E assets not covered by insurance

Ponemon Institute© Research Report
Page 11
b. The cyber risk experience of organisations Awareness of the economic and legal consequences of an international data breach or security exploit is low. As revealed in Figure 9, only 30 percent of respondents are fully aware of the potential consequences of a data breach or security exploit in countries in which their organisation operates, with 24 percent responding that they are not aware of the consequences. Figure 9. Awareness of the economic and legal consequences of an international data breach or security exploit
30%
46%
24%
0%
5%
10%
15%
20%
25%
30%
35%
40%
45%
50%
Yes, fully aware Yes, somewhat aware Not aware

Ponemon Institute© Research Report
Page 12
Many organisations had a material17 or significantly disruptive security exploit or data breach one or more times in the past 24 months. Thirty-eight percent of respondents report their organisation had such a security incident. The average total financial impact of these incidents was $3.3 million.18 As Figure 10 indicates, 65 percent of these respondents say the incident increased their organisation’s concerns over cyber liability. Figure 10. How did the security exploit or data breach affect your organisation’s concerns over cyber liability?
17 In the context of this study, the term materiality takes into consideration monies expended for first-party losses, potential third-party liabilities, value of lost time, litigation costs, reputation damages and revenue losses. This term is broader than materiality as defined by GAAP and SEC requirements. 18 This included all costs, including out-of-pocket expenditures such as consultant and legal fees, indirect business costs such as productivity losses, diminished revenues, legal actions, customer turnover and reputation damages.
65%
13%
22%
0%
10%
20%
30%
40%
50%
60%
70%
More concerned Less concerned No change
Ponemon Institute© Research Report
Page 13
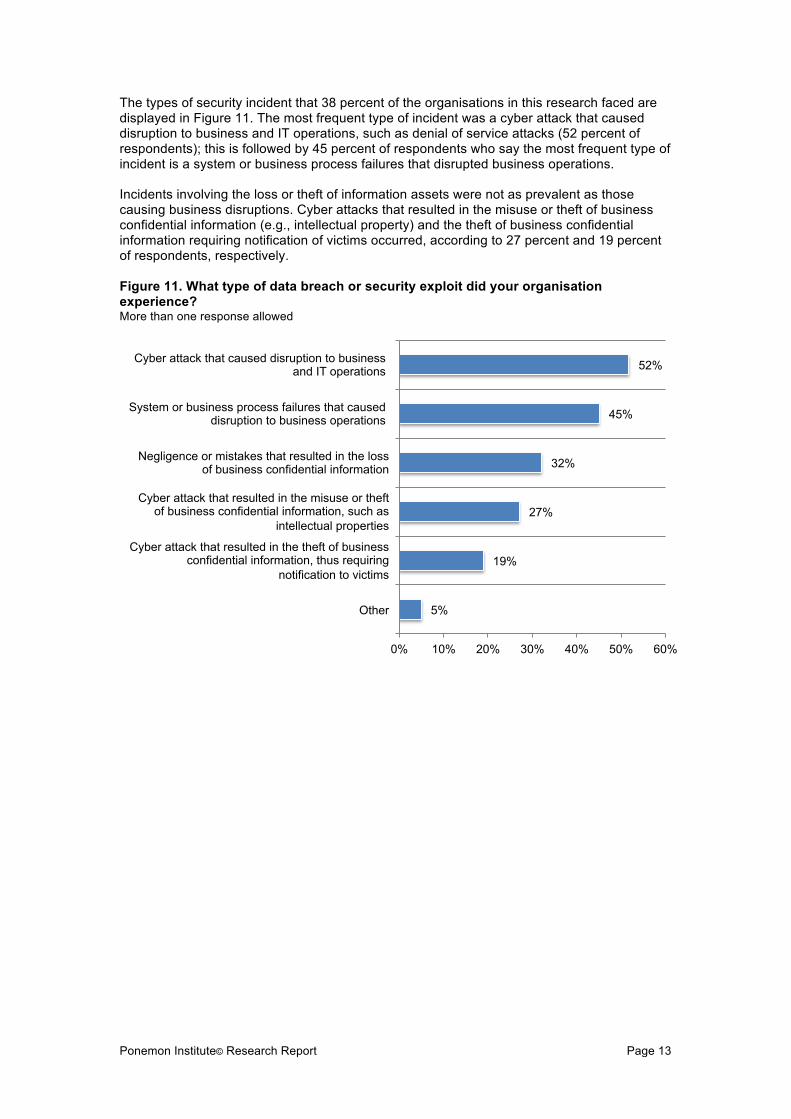
The types of security incident that 38 percent of the organisations in this research faced are displayed in Figure 11. The most frequent type of incident was a cyber attack that caused disruption to business and IT operations, such as denial of service attacks (52 percent of respondents); this is followed by 45 percent of respondents who say the most frequent type of incident is a system or business process failures that disrupted business operations. Incidents involving the loss or theft of information assets were not as prevalent as those causing business disruptions. Cyber attacks that resulted in the misuse or theft of business confidential information (e.g., intellectual property) and the theft of business confidential information requiring notification of victims occurred, according to 27 percent and 19 percent of respondents, respectively. Figure 11. What type of data breach or security exploit did your organisation experience? More than one response allowed
5%
19%
27%
32%
45%
52%
0% 10% 20% 30% 40% 50% 60%
Other
Cyber attack that resulted in the theft of business confidential information, thus requiring
notification to victims
Cyber attack that resulted in the misuse or theft of business confidential information, such as
intellectual properties
Negligence or mistakes that resulted in the loss of business confidential information
System or business process failures that caused disruption to business operations
Cyber attack that caused disruption to business and IT operations

Ponemon Institute© Research Report
Page 14
c. Perceptions about the financial impact of cyber exposures Organisations’ exposure to cyber risk is expected to increase; yet 46 percent of respondents say there is no plan to purchase cyber insurance. According to Figure 12, 65 percent of respondents believe their organisations’ exposure to cyber risk will increase and 22 percent of respondents say it will stay the same. Only 13 percent of respondents expect it to decrease. Figure 12. Will your organisation’s cyber risk exposure increase, decrease or stay the same over the next 24 months?
Despite the extent of cyber risk, which exceeds that of PP&E risk, only 23 percent of respondents say their organisations currently have cyber insurance coverage with an average limit of approximately $17 million. As Figure 13 reveals, 62 percent of respondents believe this insurance is sufficient with respect to coverage terms and conditions, exclusions, retentions, limits and insurance carrier financial security. Figure 13. Is your organisation’s cyber insurance coverage sufficient?
65%
13%
22%
0%
10%
20%
30%
40%
50%
60%
70%
Increase Decrease Stay the same
62%
23%
15%
0%
10%
20%
30%
40%
50%
60%
70%
Yes No Unsure

Ponemon Institute© Research Report Page 15
According to Figure 14, the adequacy of coverage is determined mainly by policy terms and conditions reviewed by a third-party specialist (21 percent of respondents), maximum available from the insurance market (18 percent of respondents), a formal risk assessment by in-house staff (17 percent of respondents). Only 15 percent of respondents say coverage was determined by a formal risk assessment conducted by the insurer.
Figure 14. How organisations determine the adequacy of coverage
Figure 15 displays the incidents typically covered by cyber insurance. Most incidents covered are external attacks by cyber criminals (83 percent of respondents) and malicious or criminal insiders (76 percent of respondents). While system or business process failures were the most often cited causes of the data breach or exploit, only 38 percent of respondents say these incidents are covered by their cyber insurance.
Figure 15. Types of incidents covered by cyber insurance More than one response allowed
2%
11%
15%
16%
17%
18%
21%
0% 5% 10% 15% 20% 25%
Other
Informal or ad hoc risk assessment
Formal risk assessment conducted by the insurer
Formal risk assessment by third party
Formal risk assessment by in-house staff
Maximum available from the insurance market
Policy terms and conditions reviewed by a third-party specialist
40%
33%
36%
38%
76%
83%
0% 10% 20% 30% 40% 50% 60% 70% 80% 90%
Other
Incidents affecting business partners, vendors or other third parties that have access to your
company’s information assets
Human error, mistakes and negligence
System or business process failures
Malicious or criminal insiders
External attacks by cyber criminals
Ponemon Institute© Research Report Page 16
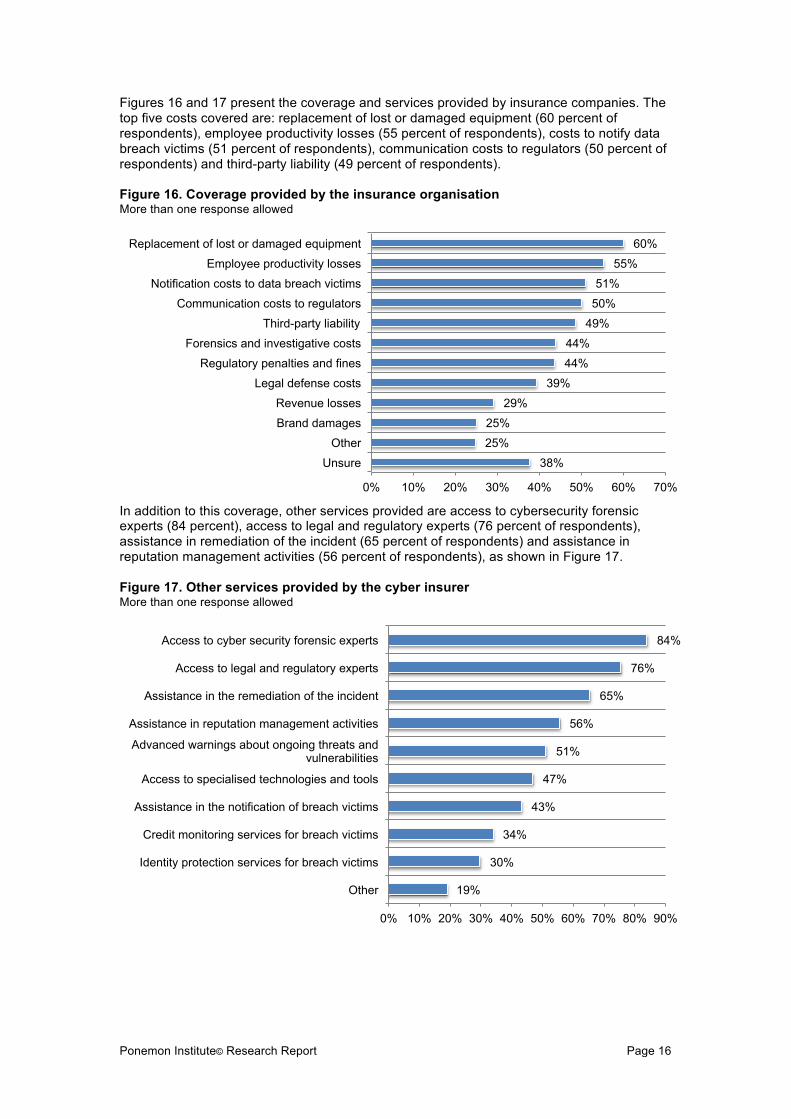
Figures 16 and 17 present the coverage and services provided by insurance companies. The top five costs covered are: replacement of lost or damaged equipment (60 percent of respondents), employee productivity losses (55 percent of respondents), costs to notify data breach victims (51 percent of respondents), communication costs to regulators (50 percent of respondents) and third-party liability (49 percent of respondents).
Figure 16. Coverage provided by the insurance organisation More than one response allowed
In addition to this coverage, other services provided are access to cybersecurity forensic experts (84 percent), access to legal and regulatory experts (76 percent of respondents), assistance in remediation of the incident (65 percent of respondents) and assistance in reputation management activities (56 percent of respondents), as shown in Figure 17.
Figure 17. Other services provided by the cyber insurer More than one response allowed
38%
25%
25%
29%
39%
44%
44%
49%
50%
51%
55%
60%
0% 10% 20% 30% 40% 50% 60% 70%
Unsure
Other
Brand damages
Revenue losses
Legal defense costs
Regulatory penalties and fines
Forensics and investigative costs
Third-party liability
Communication costs to regulators
Notification costs to data breach victims
Employee productivity losses
Replacement of lost or damaged equipment
19%
30%
34%
43%
47%
51%
56%
65%
76%
84%
0% 10% 20% 30% 40% 50% 60% 70% 80% 90%
Other
Identity protection services for breach victims
Credit monitoring services for breach victims
Assistance in the notification of breach victims
Access to specialised technologies and tools
Advanced warnings about ongoing threats and vulnerabilities
Assistance in reputation management activities
Assistance in the remediation of the incident
Access to legal and regulatory experts
Access to cyber security forensic experts

Ponemon Institute© Research Report
Page 17
Cyber liability ranks in the top 10 of all business risks facing organisations. According to Figure 18, only 12 percent of respondents do not consider cyber risk as a top 10 business risk facing their companies. Thirty-seven percent of respondents place this risk in the top five, and 35 percent of respondents place it in the top 10. Figure 18. How do cyber risks compare to other business risks?
To determine the cyber risk to their organisation, 31 percent of respondents say the organisation hired a third-party to conduct an assessment or audit and 21 percent of respondents say it was an informal (ad hoc) internal assessment (Figure 19). Only 18 percent of respondents say their organisation completed a formal internal assessment, but 19 percent of respondents say it was intuition or gut feel. Figure 19. How did you determine the level of cyber risk to your organisation?
12%
16%
35%
37%
0% 5% 10% 15% 20% 25% 30% 35% 40%
Cyber liability is not in the top 10 of business risks for my company
Cyber liability is the number one or two business risk for my company
Cyber liability is a top 10 business risk for my company
Cyber liability is a top 5 business risk for my company
11%
18%
19%
21%
31%
0% 5% 10% 15% 20% 25% 30% 35%
Did not do any type of assessment
Completed a formal internal assessment
Intuition or gut feel
Completed an informal (ad hoc) internal assessment
Hired a third party to conduct an assessment or audit
Ponemon Institute© Research Report
Page 18
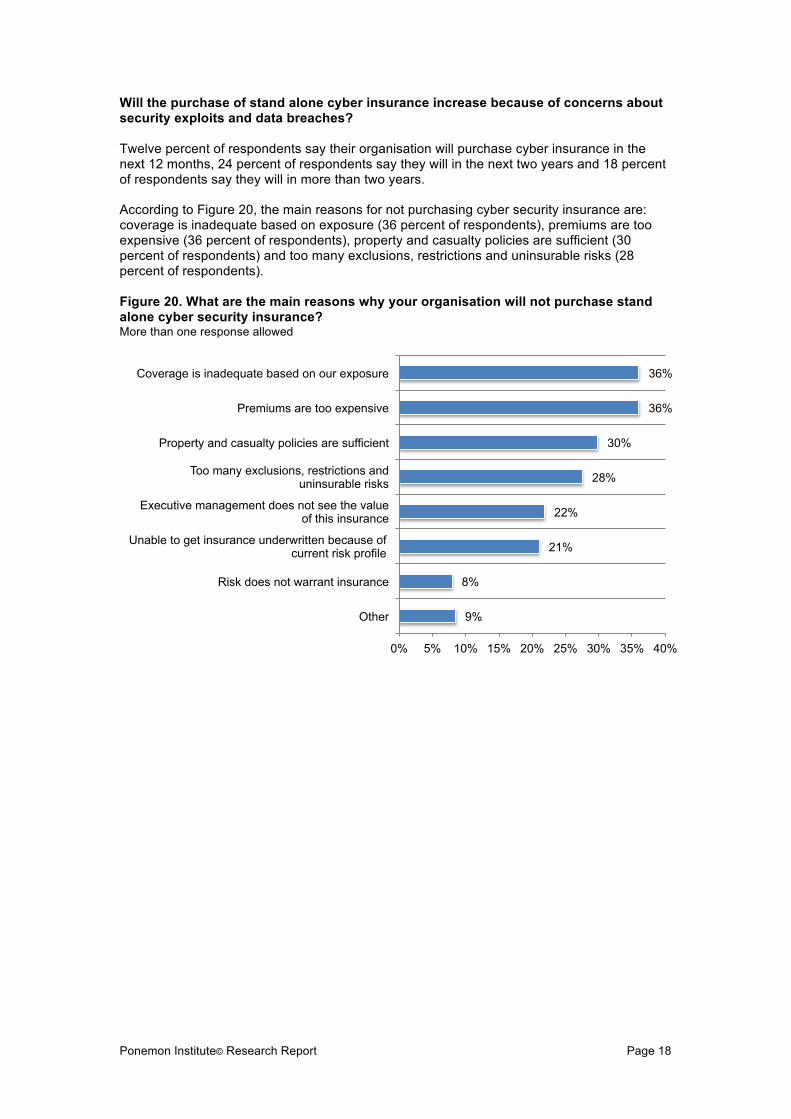
Will the purchase of stand alone cyber insurance increase because of concerns about security exploits and data breaches? Twelve percent of respondents say their organisation will purchase cyber insurance in the next 12 months, 24 percent of respondents say they will in the next two years and 18 percent of respondents say they will in more than two years. According to Figure 20, the main reasons for not purchasing cyber security insurance are: coverage is inadequate based on exposure (36 percent of respondents), premiums are too expensive (36 percent of respondents), property and casualty policies are sufficient (30 percent of respondents) and too many exclusions, restrictions and uninsurable risks (28 percent of respondents). Figure 20. What are the main reasons why your organisation will not purchase stand alone cyber security insurance? More than one response allowed
9%
8%
21%
22%
28%
30%
36%
36%
0% 5% 10% 15% 20% 25% 30% 35% 40%
Other
Risk does not warrant insurance
Unable to get insurance underwritten because of current risk profile
Executive management does not see the value of this insurance
Too many exclusions, restrictions and uninsurable risks
Property and casualty policies are sufficient
Premiums are too expensive
Coverage is inadequate based on our exposure
Ponemon Institute© Research Report
Page 19
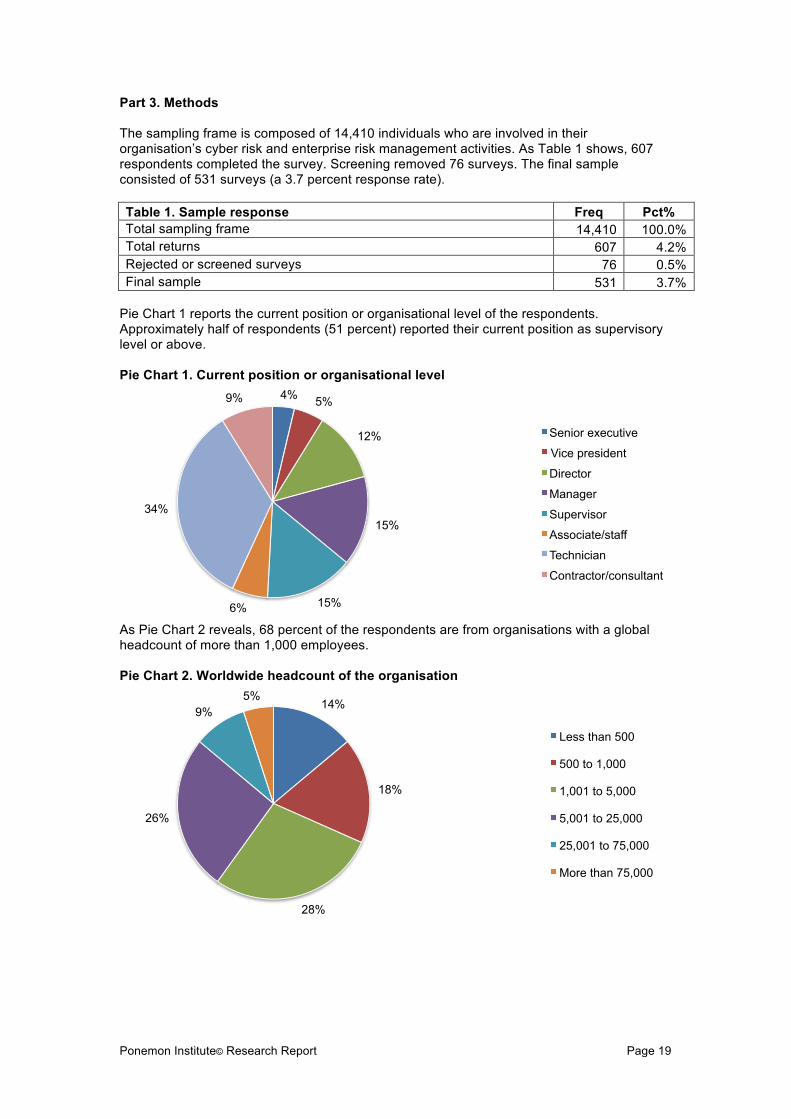
Part 3. Methods The sampling frame is composed of 14,410 individuals who are involved in their organisation’s cyber risk and enterprise risk management activities. As Table 1 shows, 607 respondents completed the survey. Screening removed 76 surveys. The final sample consisted of 531 surveys (a 3.7 percent response rate). Table 1. Sample response Freq Pct% Total sampling frame 14,410 100.0% Total returns 607 4.2% Rejected or screened surveys 76 0.5% Final sample 531 3.7%
Pie Chart 1 reports the current position or organisational level of the respondents. Approximately half of respondents (51 percent) reported their current position as supervisory level or above. Pie Chart 1. Current position or organisational level
As Pie Chart 2 reveals, 68 percent of the respondents are from organisations with a global headcount of more than 1,000 employees. Pie Chart 2. Worldwide headcount of the organisation
4% 5%
12%
15%
15% 6%
34%
9%
Senior executive
Vice president
Director
Manager
Supervisor
Associate/staff
Technician
Contractor/consultant
14%
18%
28%
26%
9% 5%
Less than 500
500 to 1,000
1,001 to 5,000
5,001 to 25,000
25,001 to 75,000
More than 75,000

Ponemon Institute© Research Report
Page 20
Pie Chart 3 reports the primary industry classification of respondents’ organisations. This chart identifies financial services (15 percent of respondents) as the largest segment, which includes banking, investment management, insurance, brokerage, payments and credit cards. This is followed by health and pharmaceuticals (11 percent of respondents) and public sector (11 percent of respondents). Pie Chart 3. Primary industry focus
Part 4. Caveats
There are inherent limitations to survey research that need to be carefully considered before drawing inferences from findings. The following items are specific limitations that are germane to most web-based surveys.
Non-response bias: The current findings are based on a sample of survey returns. We sent surveys to a representative sample of individuals, resulting in a large number of usable returned responses. Despite non-response tests, it is always possible that individuals who did not participate are substantially different in terms of underlying beliefs from those who completed the instrument. Sampling-frame bias: The accuracy is based on contact information and the degree to which the list is representative of individuals who are involved in their organistion’s cyber and enterprise risk management. We also acknowledge that the results may be biased by external events such as media coverage. We also acknowledge bias caused by compensating subjects to complete this research within a specified period. Self-reported results: The quality of survey research is based on the integrity of confidential responses received from subjects. While certain checks and balances can be incorporated into the survey process, there is always the possibility that a subject did not provide accurate responses.
15%
11%
11%
10% 10%
9%
6%
6%
5%
4%
4% 3% 2% 2% 2%
Financial services Health & pharmaceuticals Public sector Industrial Retail Services Technology & software Consumer products Education & research Communications Energy & utilities Hospitality Transportation Agriculture & food service Entertainment & media

Ponemon Institute© Research Report
Page 21
Appendix: Detailed Survey Results The following tables provide the frequency or percentage frequency of responses to all survey questions contained in this study. All survey responses were captured between December 2016 and February 2017.
Survey response EMEA 2017 Sampling frame 14,410 Total returns 607 Final sample 531 Response rate 3.7% Sample weights 24.5%
Screening questions
S1. How familiar are you with cyber risks facing your organisation today? EMEA 2017 Very familiar 20% Familiar 36% Somewhat familiar 43% Not familiar (stop) 0% Total 100%
S2. Are you involved in your organisation’s cyber risk management activities? EMEA 2017 Yes, significant involvement 35% Yes, some involvement 65% No involvement (stop) 0% Total 100%
S3. Are you involved in your organisation’s enterprise risk management activities? EMEA 2017 Yes, significant involvement 30% Yes, some involvement 70% No involvement (stop) 0% Total 100%
S4. What best defines your role? EMEA 2017 Risk management 25% Finance, treasury & accounting 35% Corporate compliance/audit 17% Security/information security 7% General management 9% Legal (OGC) 8% None of the above (stop) 0% Total 100%
Ponemon Institute© Research Report
Page 22
The following questions pertain to your organisation’s property, plant and equipment (PP&E)
Part 1. Sizing the economic impact
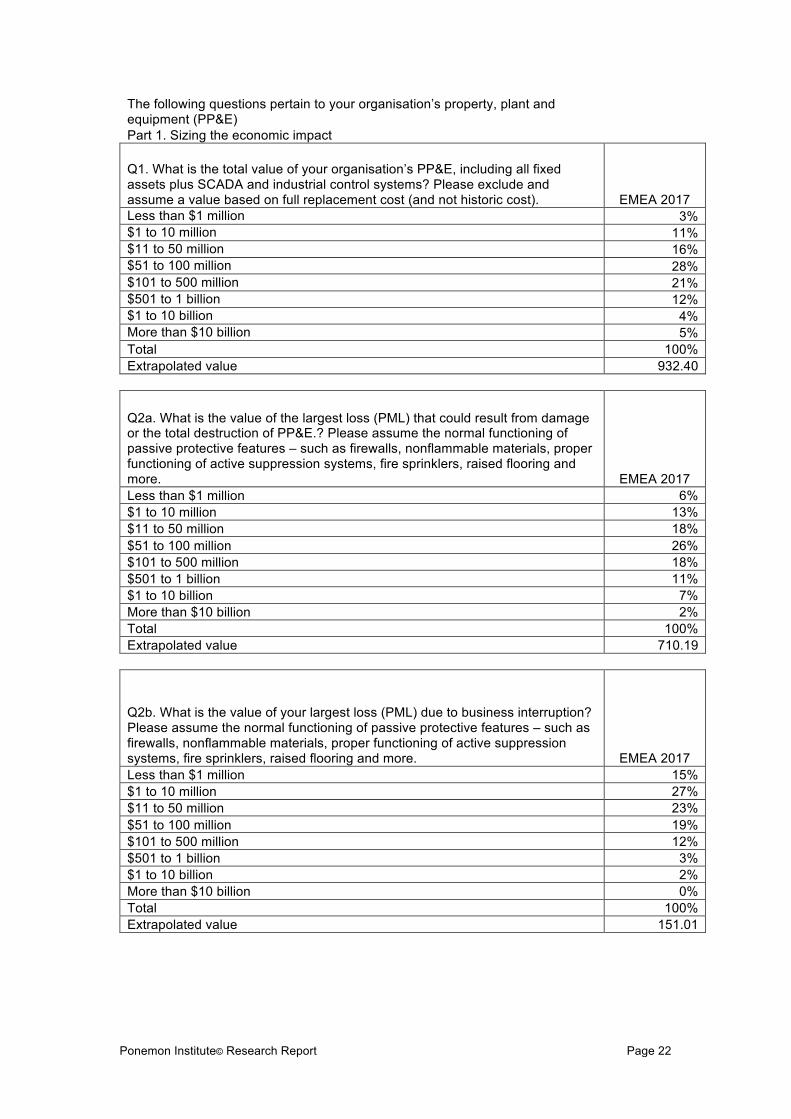
Q1. What is the total value of your organisation’s PP&E, including all fixed assets plus SCADA and industrial control systems? Please exclude and assume a value based on full replacement cost (and not historic cost). EMEA 2017 Less than $1 million 3% $1 to 10 million 11% $11 to 50 million 16% $51 to 100 million 28% $101 to 500 million 21% $501 to 1 billion 12% $1 to 10 billion 4% More than $10 billion 5% Total 100% Extrapolated value 932.40
Q2a. What is the value of the largest loss (PML) that could result from damage or the total destruction of PP&E.? Please assume the normal functioning of passive protective features – such as firewalls, nonflammable materials, proper functioning of active suppression systems, fire sprinklers, raised flooring and more. EMEA 2017 Less than $1 million 6% $1 to 10 million 13% $11 to 50 million 18% $51 to 100 million 26% $101 to 500 million 18% $501 to 1 billion 11% $1 to 10 billion 7% More than $10 billion 2% Total 100% Extrapolated value 710.19
Q2b. What is the value of your largest loss (PML) due to business interruption? Please assume the normal functioning of passive protective features – such as firewalls, nonflammable materials, proper functioning of active suppression systems, fire sprinklers, raised flooring and more. EMEA 2017 Less than $1 million 15% $1 to 10 million 27% $11 to 50 million 23% $51 to 100 million 19% $101 to 500 million 12% $501 to 1 billion 3% $1 to 10 billion 2% More than $10 billion 0% Total 100% Extrapolated value 151.01

Ponemon Institute© Research Report
Page 23
Q3. What percentage of this potential loss to PP&E assets is covered by insurance, including captives reinsured but not including captives not reinsured? EMEA 2017 Less than 5% 1% 5% to 10% 0% 11%to 20% 6% 21% to 30% 4% 31% to 40% 9% 41% to 50% 9% 51% to 60% 22% 61% to 70% 14% 71% to 80% 13% 81% to 90% 13% 91% to 100% 9% Total 100% Extrapolated value 60%
Q4. What percentage of this potential loss to PP&E assets is self-insured, including captives not reinsured? EMEA 2017 Less than 5% 11% 5% to 10% 13% 11% to 20% 19% 21% to 30% 18% 31% to 40% 11% 41% to 50% 13% 51% to 60% 7% 61% to 70% 7% 71% to 80% 1% 81% to 90% 0% 91% to 100% 0% Total 100% Extrapolated value 27%
Q5. What is the likelihood that your organisation will sustain a loss to PP&E assets totalling no more than 50 percent of PML over the next 12 months? EMEA 2017 Less than 0.1% 24% 0.1% to 0.5% 16% 0.6% to 1.0% 13% 1.1% to 2.0% 13% 2.1% to 3.0% 18% 3.1% to 4.0% 7% 4.1% to 5.0% 8% 5.1% to 10.0% 1% More than 10.0% 1% Total 100% Extrapolated value 1.6%

Ponemon Institute© Research Report
Page 24
Q6. What is the likelihood that your organisation will sustain a loss to PP&E assets totalling 100 percent of PML over the next 12 months? EMEA 2017 Less than 0.1% 74% 0.1% to 0.5% 11% 0.6% to 1.0% 8% 1.1% to 2.0% 3% 2.1% to 3.0% 1% 3.1% to 4.0% 2% 4.1% to 5.0% 1% 5.1% to 10.0% 1% More than 10.0% 0% Total 100% Extrapolated value 0.45%
Q7. In your opinion, how would your organisation disclose a material loss to PP&E assets that is not covered by insurance in its financial statements? EMEA 2017
Disclosure as a contingent liability on the balance sheet (e.g., FASB 5) 21% Footnote disclosure in the financial statements 46% Discussion in the management letter 13% None – disclosure is not necessary 13% Other 7% Total 100%
The following questions pertain to your organisation’s information assets.
Q8. What is the total value of your organisation’s information assets, including customer records, employee records, financial reports, analytical data, source code, models, methods and other intellectual properties? Please assume a value based on full replacement cost (and not historic cost). Please note this value can be a precise quantification or estimate. EMEA 2017 Less than $1 million 6% $1 to 10 million 11% $11 to 50 million 16% $51 to 100 million 26% $101 to 500 million 16% $501 to 1 billion 15% $1 to 10 billion 5% More than $10 billion 6% Total 100% Extrapolated value 1,091.83
Ponemon Institute© Research Report
Page 25
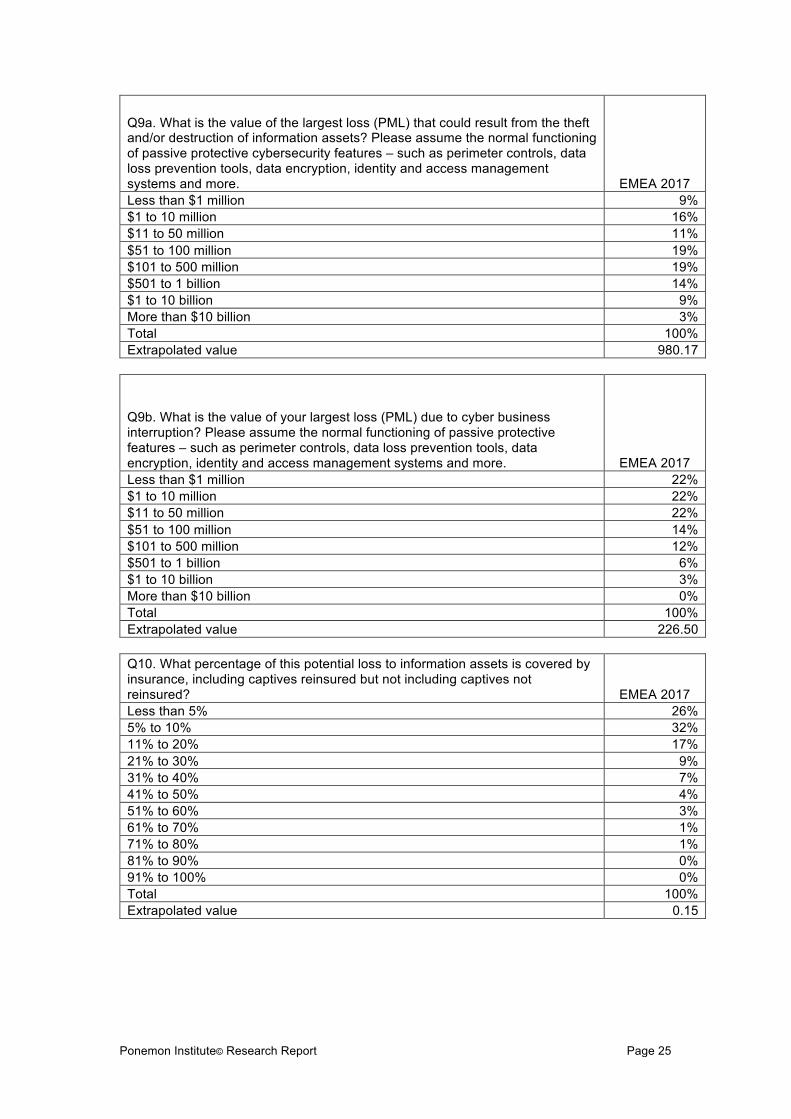
Q9a. What is the value of the largest loss (PML) that could result from the theft and/or destruction of information assets? Please assume the normal functioning of passive protective cybersecurity features – such as perimeter controls, data loss prevention tools, data encryption, identity and access management systems and more. EMEA 2017 Less than $1 million 9% $1 to 10 million 16% $11 to 50 million 11% $51 to 100 million 19% $101 to 500 million 19% $501 to 1 billion 14% $1 to 10 billion 9% More than $10 billion 3% Total 100% Extrapolated value 980.17
Q9b. What is the value of your largest loss (PML) due to cyber business interruption? Please assume the normal functioning of passive protective features – such as perimeter controls, data loss prevention tools, data encryption, identity and access management systems and more. EMEA 2017 Less than $1 million 22% $1 to 10 million 22% $11 to 50 million 22% $51 to 100 million 14% $101 to 500 million 12% $501 to 1 billion 6% $1 to 10 billion 3% More than $10 billion 0% Total 100% Extrapolated value 226.50
Q10. What percentage of this potential loss to information assets is covered by insurance, including captives reinsured but not including captives not reinsured? EMEA 2017 Less than 5% 26% 5% to 10% 32% 11% to 20% 17% 21% to 30% 9% 31% to 40% 7% 41% to 50% 4% 51% to 60% 3% 61% to 70% 1% 71% to 80% 1% 81% to 90% 0% 91% to 100% 0% Total 100% Extrapolated value 0.15
Ponemon Institute© Research Report
Page 26
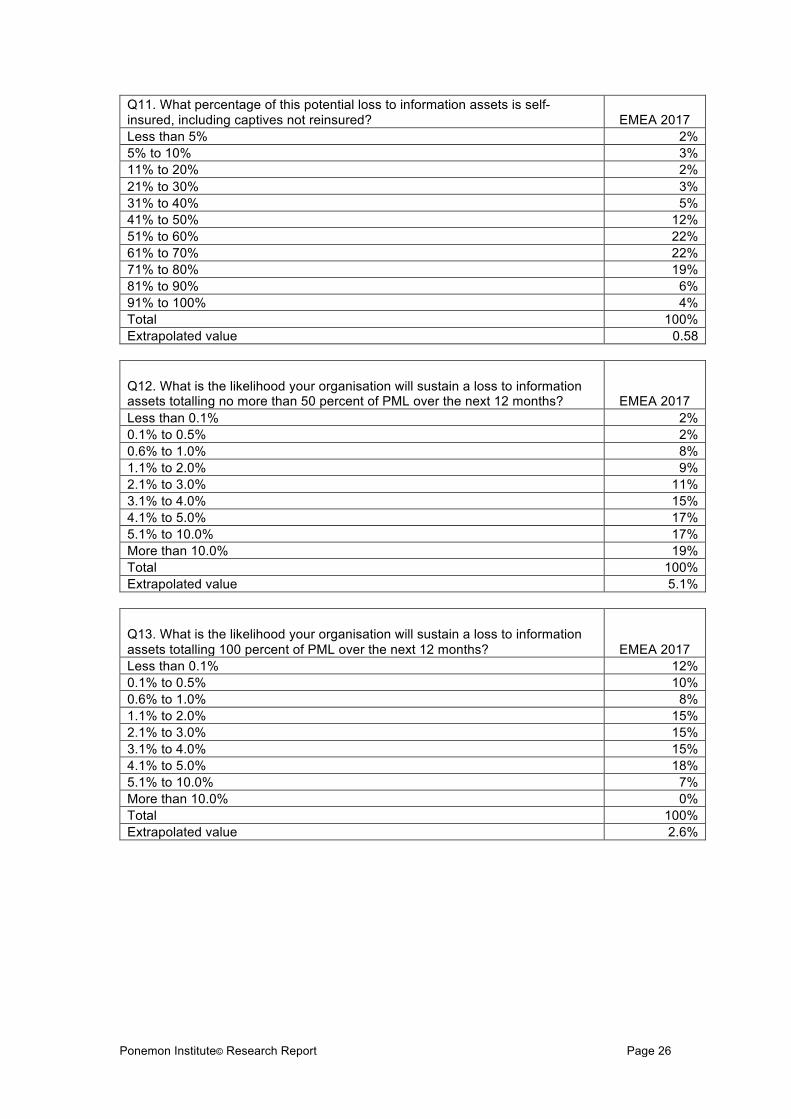
Q11. What percentage of this potential loss to information assets is self-insured, including captives not reinsured? EMEA 2017 Less than 5% 2% 5% to 10% 3% 11% to 20% 2% 21% to 30% 3% 31% to 40% 5% 41% to 50% 12% 51% to 60% 22% 61% to 70% 22% 71% to 80% 19% 81% to 90% 6% 91% to 100% 4% Total 100% Extrapolated value 0.58
Q12. What is the likelihood your organisation will sustain a loss to information assets totalling no more than 50 percent of PML over the next 12 months? EMEA 2017 Less than 0.1% 2% 0.1% to 0.5% 2% 0.6% to 1.0% 8% 1.1% to 2.0% 9% 2.1% to 3.0% 11% 3.1% to 4.0% 15% 4.1% to 5.0% 17% 5.1% to 10.0% 17% More than 10.0% 19% Total 100% Extrapolated value 5.1%
Q13. What is the likelihood your organisation will sustain a loss to information assets totalling 100 percent of PML over the next 12 months? EMEA 2017 Less than 0.1% 12% 0.1% to 0.5% 10% 0.6% to 1.0% 8% 1.1% to 2.0% 15% 2.1% to 3.0% 15% 3.1% to 4.0% 15% 4.1% to 5.0% 18% 5.1% to 10.0% 7% More than 10.0% 0% Total 100% Extrapolated value 2.6%

Ponemon Institute© Research Report
Page 27
Q14. In your opinion, how would your organisation disclose a material loss to information assets that is not covered by insurance in its financial statements? EMEA 2017
Disclosure as a contingent liability on the balance sheet (FASB 5) 11% Footnote disclosure in the financial statements 38% Discussion in the management letter 9% None – disclosure is not necessary 36% Other 6% Total 100%
Part 2. Other Questions
Q15. Are you aware of the economic and legal consequences resulting from a data breach or security exploit in other countries in which your organisation operates, such as the European Union’s General Data Protection Regulation (GDPR), which may issue a fine of up to 4 percent of an organisation’s worldwide revenue? EMEA 2017 Yes, fully aware 30% Yes, somewhat aware 46% Not aware 24% Total 100%
Q16a. Has your organisation experienced a material or significantly disruptive security exploit or data breach one or more times over the past 24 months? Please refer to the definition of materiality provided above. EMEA 2017 Yes 38% No [skip to Q17] 62% Total 100%
Q16b. If yes, what best describes the data breaches or security exploits experienced by your organisation over the past 24 months? Please select all that apply. EMEA 2017 Cyber attack that caused disruption to business and IT operations (such as denial of service attacks) 52%
Cyber attack that resulted in the theft of business confidential information, thus requiring notification to victims 19%
Cyber attack that resulted in the misuse or theft of business confidential information, such as intellectual properties 27% Negligence or mistakes that resulted in the loss of business confidential information 32% System or business process failures that caused disruption to business operations (e.g. software updates) 45% Other 5% Total 180%
Ponemon Institute© Research Report
Page 28
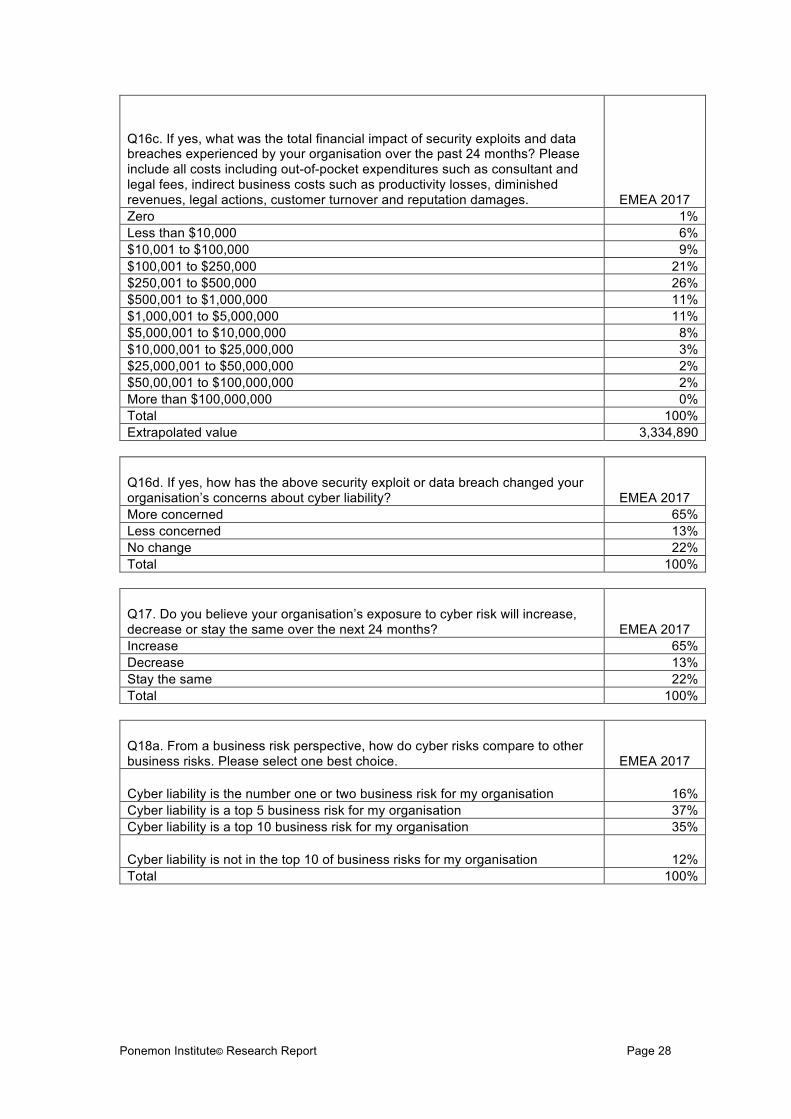
Q16c. If yes, what was the total financial impact of security exploits and data breaches experienced by your organisation over the past 24 months? Please include all costs including out-of-pocket expenditures such as consultant and legal fees, indirect business costs such as productivity losses, diminished revenues, legal actions, customer turnover and reputation damages. EMEA 2017 Zero 1% Less than $10,000 6% $10,001 to $100,000 9% $100,001 to $250,000 21% $250,001 to $500,000 26% $500,001 to $1,000,000 11% $1,000,001 to $5,000,000 11% $5,000,001 to $10,000,000 8% $10,000,001 to $25,000,000 3% $25,000,001 to $50,000,000 2% $50,00,001 to $100,000,000 2% More than $100,000,000 0% Total 100% Extrapolated value 3,334,890
Q16d. If yes, how has the above security exploit or data breach changed your organisation’s concerns about cyber liability? EMEA 2017 More concerned 65% Less concerned 13% No change 22% Total 100%
Q17. Do you believe your organisation’s exposure to cyber risk will increase, decrease or stay the same over the next 24 months? EMEA 2017 Increase 65% Decrease 13% Stay the same 22% Total 100%
Q18a. From a business risk perspective, how do cyber risks compare to other business risks. Please select one best choice. EMEA 2017
Cyber liability is the number one or two business risk for my organisation 16% Cyber liability is a top 5 business risk for my organisation 37% Cyber liability is a top 10 business risk for my organisation 35%
Cyber liability is not in the top 10 of business risks for my organisation 12% Total 100%
Ponemon Institute© Research Report
Page 29
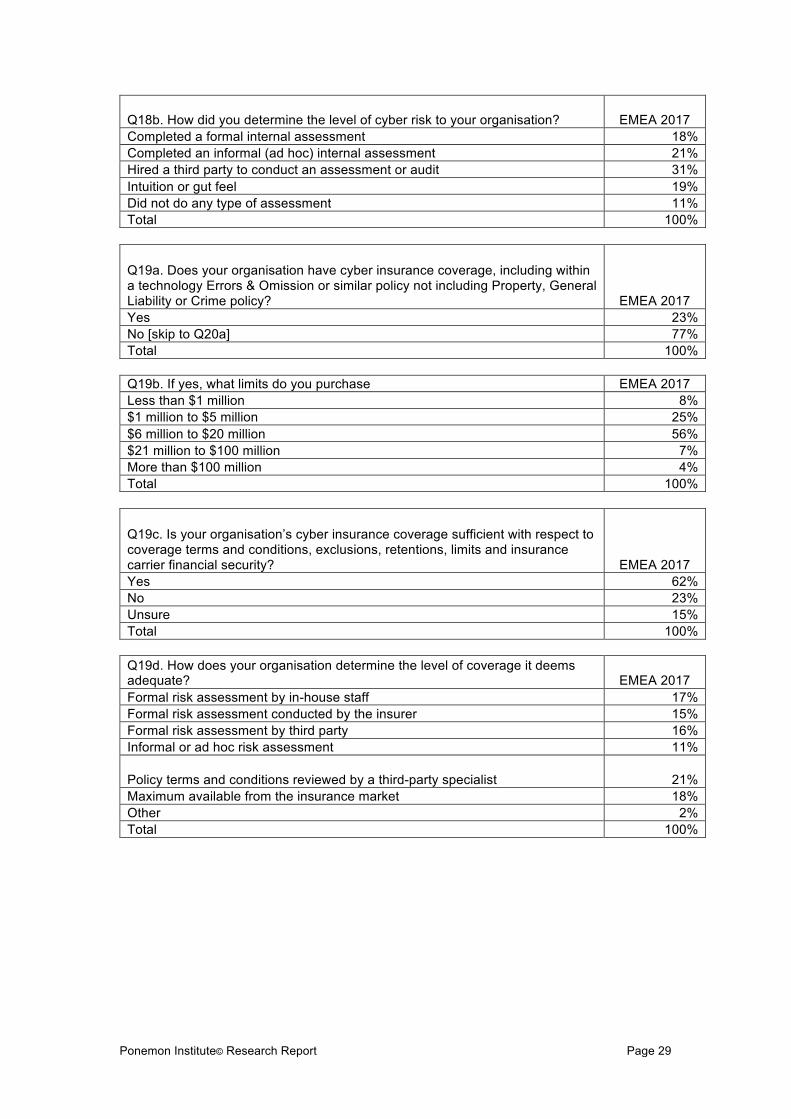
Q18b. How did you determine the level of cyber risk to your organisation? EMEA 2017 Completed a formal internal assessment 18% Completed an informal (ad hoc) internal assessment 21% Hired a third party to conduct an assessment or audit 31% Intuition or gut feel 19% Did not do any type of assessment 11% Total 100%
Q19a. Does your organisation have cyber insurance coverage, including within a technology Errors & Omission or similar policy not including Property, General Liability or Crime policy? EMEA 2017 Yes 23% No [skip to Q20a] 77% Total 100%
Q19b. If yes, what limits do you purchase EMEA 2017 Less than $1 million 8% $1 million to $5 million 25% $6 million to $20 million 56% $21 million to $100 million 7% More than $100 million 4% Total 100%
Q19c. Is your organisation’s cyber insurance coverage sufficient with respect to coverage terms and conditions, exclusions, retentions, limits and insurance carrier financial security? EMEA 2017 Yes 62% No 23% Unsure 15% Total 100%
Q19d. How does your organisation determine the level of coverage it deems adequate? EMEA 2017 Formal risk assessment by in-house staff 17% Formal risk assessment conducted by the insurer 15% Formal risk assessment by third party 16% Informal or ad hoc risk assessment 11%
Policy terms and conditions reviewed by a third-party specialist 21% Maximum available from the insurance market 18% Other 2% Total 100%

Ponemon Institute© Research Report
Page 30
Q19e. What types of incidents does your organisation’s cyber insurance cover? Please select all that apply. EMEA 2017 External attacks by cyber criminals 83% Malicious or criminal insiders 76% System or business process failures 38% Human error, mistakes and negligence 36%
Incidents affecting business partners, vendors or other third parties that have access to your organisation’s information assets 33% Other 40% Total 306%
Q19f. What coverage does this insurance offer your organisation? Please select all that apply. EMEA 2017 Forensics and investigative costs 44% Notification costs to data breach victims 51% Communication costs to regulators 50% Employee productivity losses 55% Replacement of lost or damaged equipment 60% Revenue losses 29% Legal defense costs 39% Regulatory penalties and fines 44% Third-party liability 49% Brand damages 25% Other 25% Unsure 38% Total 508%
Q19g. In addition to cost coverage, what other services does the cyber insurer provide your organisation in the event of a security exploit or data breach? Please check all that apply. EMEA 2017 Access to cyber security forensic experts 84% Access to legal and regulatory experts 76% Access to specialised technologies and tools 47%
Advanced warnings about ongoing threats and vulnerabilities 51% Assistance in the remediation of the incident 65% Assistance in the notification of breach victims 43% Identity protection services for breach victims 30% Credit monitoring services for breach victims 34% Assistance in reputation management activities 56% Other 19% Total 504%
Q20a. Does your organisation plan to purchase standalone cyber insurance? EMEA 2017 Yes, in the next 12 months 12% Yes, in the next 24 months 24% Yes, in more than 24 months 18% No 46% Total 100%
Ponemon Institute© Research Report
Page 31
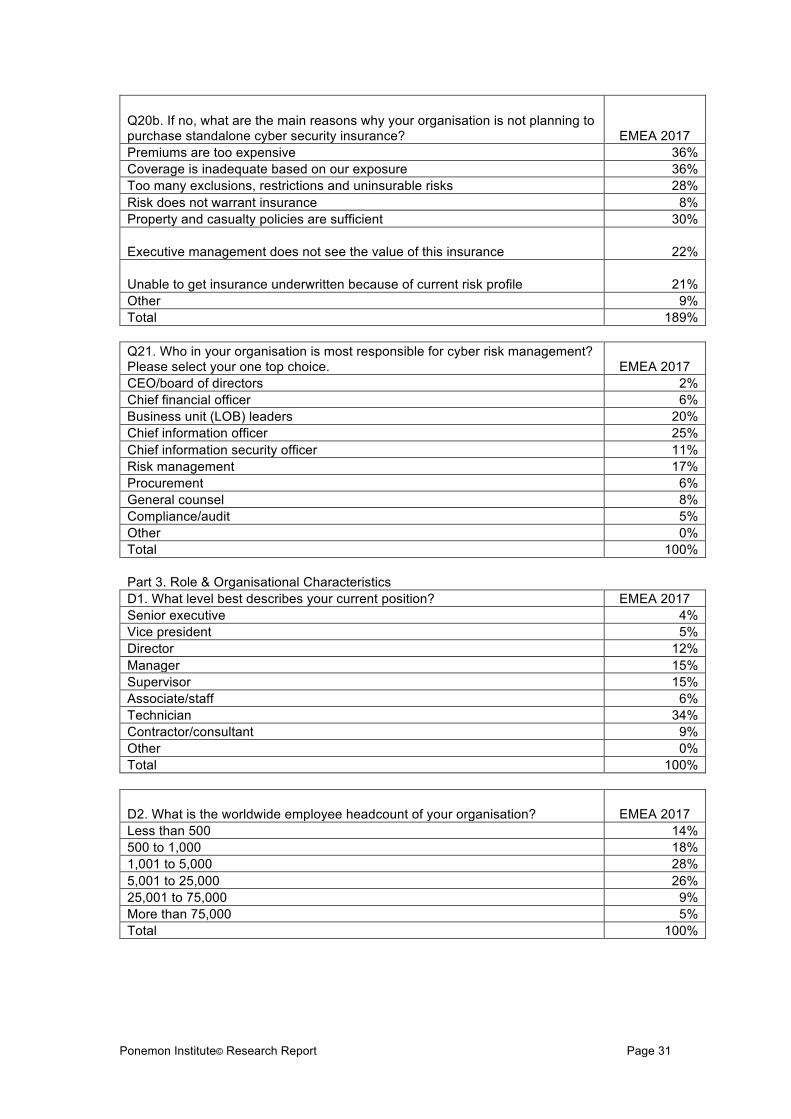
Q20b. If no, what are the main reasons why your organisation is not planning to purchase standalone cyber security insurance? EMEA 2017 Premiums are too expensive 36% Coverage is inadequate based on our exposure 36% Too many exclusions, restrictions and uninsurable risks 28% Risk does not warrant insurance 8% Property and casualty policies are sufficient 30%
Executive management does not see the value of this insurance 22%
Unable to get insurance underwritten because of current risk profile 21% Other 9% Total 189%
Q21. Who in your organisation is most responsible for cyber risk management? Please select your one top choice. EMEA 2017 CEO/board of directors 2% Chief financial officer 6% Business unit (LOB) leaders 20% Chief information officer 25% Chief information security officer 11% Risk management 17% Procurement 6% General counsel 8% Compliance/audit 5% Other 0% Total 100%
Part 3. Role & Organisational Characteristics D1. What level best describes your current position? EMEA 2017
Senior executive 4% Vice president 5% Director 12% Manager 15% Supervisor 15% Associate/staff 6% Technician 34% Contractor/consultant 9% Other 0% Total 100%
D2. What is the worldwide employee headcount of your organisation? EMEA 2017 Less than 500 14% 500 to 1,000 18% 1,001 to 5,000 28% 5,001 to 25,000 26% 25,001 to 75,000 9% More than 75,000 5% Total 100%

Ponemon Institute© Research Report
Page 32
D3. What best describes your organisation’s industry focus? EMEA 2017 Agriculture & food service 2% Communications 4% Consumer products 6% Education & research 5% Energy & utilities 4% Entertainment & media 2% Financial services 15% Health & pharmaceuticals 11% Hospitality 3% Industrial 10% Public sector 11% Retail 10% Services 9% Technology & software 6% Transportation 2% Total 100%
Ponemon Institute© Research Report
Page 33
ACKNOWLEDGEMENTS We appreciate the past review and input of Massachusetts Institute of Technology 2016 Graduate, Adam Kalinich, major Course 18C: "Mathematics with Computer Science.” For more information about this study, please contact Ponemon Institute by sending an email to [email protected] or calling our toll free line at 1.800.887.3118.
Ponemon Institute Advancing Responsible Information Management
Ponemon Institute is dedicated to independent research and education that advances responsible information and privacy management practices within business and government. Our mission is to conduct high quality, empirical studies on critical issues affecting the management and security of sensitive information about people and organisations. We uphold strict data confidentiality, privacy and ethical research standards. We do not collect any personally identifiable information from individuals (or organisation identifiable information in our business research). Furthermore, we have strict quality standards to ensure that subjects are not asked extraneous, irrelevant or improper questions.

Ponemon Institute© Research Report
Page 34
Contacts Johannes Behrends Head of Specialty Cyber Aon Risk Solutions [email protected] Timothee Crespe Senior Broker Aon Risk Solutions [email protected] Karl Curran Associate Director, Global & Specialty Aon Risk Solutions [email protected] Shannan Fort Cyber Product Development Leader Global Broking Centre [email protected] Claudia Beatriz Gomez Director Financial Lines Aon Risk Solutions [email protected] Kevin Kalinich Global Practice Leader Cyber Insurance Aon Risk Solutions [email protected]
Vanessa Leemans Global Cyber Chief Operating Officer Aon Risk Solutions [email protected] Spencer Lynch Managing Director Stroz Friedberg [email protected] Jennifer Millar Managing Director Aon Risk Solutions [email protected] Alexander van Nierop Broking Director FSG & Cyber Broking Solutions Leader Aon Risk Solutions [email protected] Adam Peckman Global Cyber Risk Consulting Practice Leader [email protected] Renette Pretorius Cyber Practice Leader Global Broking Centre [email protected]
About Aon Aon plc (NYSE:AON) is a leading global professional services firm providing a broad range of risk, retirement and health solutions. Our 50,000 colleagues in 120 countries empower results for clients by using proprietary data and analytics to deliver insights that reduce volatility and improve performance.
© Aon plc 2017. All rights reserved.
The information contained herein and the statements expressed are of a general nature and are not intended to address the circumstances of any particular individual or entity. Although we endeavor to provide accurate and timely information and use sources we consider reliable, there can be no guarantee that such information is accurate as of the date it is received or that it will continue to be accurate in the future. No one should act on such information without appropriate professional advice after a thorough examination of the particular situation.
aon.com