2016 - Svea Ekonomi · 2016, this also includes the wholly-owned subsidiary Svea Bank AB with its...
5
Year-end report 2016
Transcript of 2016 - Svea Ekonomi · 2016, this also includes the wholly-owned subsidiary Svea Bank AB with its...
Year-end report2016
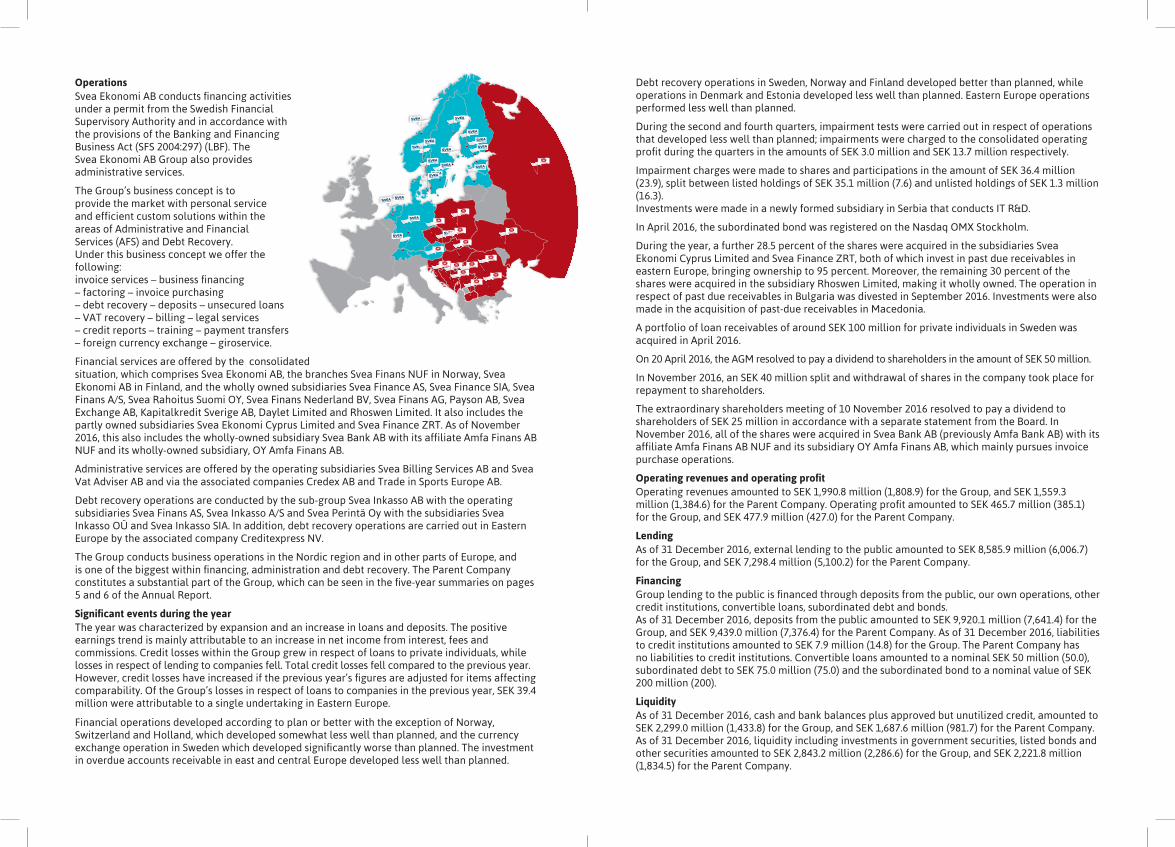
OperationsSvea Ekonomi AB conducts financing activities under a permit from the Swedish Financial Supervisory Authority and in accordance with the provisions of the Banking and Financing Business Act (SFS 2004:297) (LBF). The Svea Ekonomi AB Group also provides administrative services.
The Group’s business concept is to provide the market with personal service and efficient custom solutions within the areas of Administrative and Financial Services (AFS) and Debt Recovery. Under this business concept we offer the following:invoice services – business financing– factoring – invoice purchasing – debt recovery – deposits – unsecured loans – VAT recovery – billing – legal services – credit reports – training – payment transfers – foreign currency exchange – giroservice.
Financial services are offered by the consolidated situation, which comprises Svea Ekonomi AB, the branches Svea Finans NUF in Norway, Svea Ekonomi AB in Finland, and the wholly owned subsidiaries Svea Finance AS, Svea Finance SIA, Svea Finans A/S, Svea Rahoitus Suomi OY, Svea Finans Nederland BV, Svea Finans AG, Payson AB, Svea Exchange AB, Kapitalkredit Sverige AB, Daylet Limited and Rhoswen Limited. It also includes the partly owned subsidiaries Svea Ekonomi Cyprus Limited and Svea Finance ZRT. As of November 2016, this also includes the wholly-owned subsidiary Svea Bank AB with its affiliate Amfa Finans AB NUF and its wholly-owned subsidiary, OY Amfa Finans AB.
Administrative services are offered by the operating subsidiaries Svea Billing Services AB and Svea Vat Adviser AB and via the associated companies Credex AB and Trade in Sports Europe AB.
Debt recovery operations are conducted by the sub-group Svea Inkasso AB with the operating subsidiaries Svea Finans AS, Svea Inkasso A/S and Svea Perintä Oy with the subsidiaries Svea Inkasso OÜ and Svea Inkasso SIA. In addition, debt recovery operations are carried out in Eastern Europe by the associated company Creditexpress NV.
The Group conducts business operations in the Nordic region and in other parts of Europe, and is one of the biggest within financing, administration and debt recovery. The Parent Company constitutes a substantial part of the Group, which can be seen in the five-year summaries on pages 5 and 6 of the Annual Report.
Significant events during the yearThe year was characterized by expansion and an increase in loans and deposits. The positive earnings trend is mainly attributable to an increase in net income from interest, fees and commissions. Credit losses within the Group grew in respect of loans to private individuals, while losses in respect of lending to companies fell. Total credit losses fell compared to the previous year.However, credit losses have increased if the previous year’s figures are adjusted for items affecting comparability. Of the Group’s losses in respect of loans to companies in the previous year, SEK 39.4 million were attributable to a single undertaking in Eastern Europe.
Financial operations developed according to plan or better with the exception of Norway, Switzerland and Holland, which developed somewhat less well than planned, and the currency exchange operation in Sweden which developed significantly worse than planned. The investment in overdue accounts receivable in east and central Europe developed less well than planned.
Debt recovery operations in Sweden, Norway and Finland developed better than planned, while operations in Denmark and Estonia developed less well than planned. Eastern Europe operations performed less well than planned.
During the second and fourth quarters, impairment tests were carried out in respect of operations that developed less well than planned; impairments were charged to the consolidated operating profit during the quarters in the amounts of SEK 3.0 million and SEK 13.7 million respectively.
Impairment charges were made to shares and participations in the amount of SEK 36.4 million (23.9), split between listed holdings of SEK 35.1 million (7.6) and unlisted holdings of SEK 1.3 million (16.3).Investments were made in a newly formed subsidiary in Serbia that conducts IT R&D.
In April 2016, the subordinated bond was registered on the Nasdaq OMX Stockholm.
During the year, a further 28.5 percent of the shares were acquired in the subsidiaries Svea Ekonomi Cyprus Limited and Svea Finance ZRT, both of which invest in past due receivables in eastern Europe, bringing ownership to 95 percent. Moreover, the remaining 30 percent of the shares were acquired in the subsidiary Rhoswen Limited, making it wholly owned. The operation in respect of past due receivables in Bulgaria was divested in September 2016. Investments were also made in the acquisition of past-due receivables in Macedonia.
A portfolio of loan receivables of around SEK 100 million for private individuals in Sweden was acquired in April 2016.
On 20 April 2016, the AGM resolved to pay a dividend to shareholders in the amount of SEK 50 million.
In November 2016, an SEK 40 million split and withdrawal of shares in the company took place for repayment to shareholders.
The extraordinary shareholders meeting of 10 November 2016 resolved to pay a dividend to shareholders of SEK 25 million in accordance with a separate statement from the Board. In November 2016, all of the shares were acquired in Svea Bank AB (previously Amfa Bank AB) with its affiliate Amfa Finans AB NUF and its subsidiary OY Amfa Finans AB, which mainly pursues invoice purchase operations.
Operating revenues and operating profitOperating revenues amounted to SEK 1,990.8 million (1,808.9) for the Group, and SEK 1,559.3 million (1,384.6) for the Parent Company. Operating profit amounted to SEK 465.7 million (385.1) for the Group, and SEK 477.9 million (427.0) for the Parent Company.
LendingAs of 31 December 2016, external lending to the public amounted to SEK 8,585.9 million (6,006.7) for the Group, and SEK 7,298.4 million (5,100.2) for the Parent Company.
FinancingGroup lending to the public is financed through deposits from the public, our own operations, other credit institutions, convertible loans, subordinated debt and bonds.As of 31 December 2016, deposits from the public amounted to SEK 9,920.1 million (7,641.4) for the Group, and SEK 9,439.0 million (7,376.4) for the Parent Company. As of 31 December 2016, liabilities to credit institutions amounted to SEK 7.9 million (14.8) for the Group. The Parent Company has no liabilities to credit institutions. Convertible loans amounted to a nominal SEK 50 million (50.0), subordinated debt to SEK 75.0 million (75.0) and the subordinated bond to a nominal value of SEK 200 million (200).
LiquidityAs of 31 December 2016, cash and bank balances plus approved but unutilized credit, amounted to SEK 2,299.0 million (1,433.8) for the Group, and SEK 1,687.6 million (981.7) for the Parent Company.As of 31 December 2016, liquidity including investments in government securities, listed bonds and other securities amounted to SEK 2,843.2 million (2,286.6) for the Group, and SEK 2,221.8 million (1,834.5) for the Parent Company.
Stockholm, April 2017 SVEA EKONOMI AB (publ)
Lennart Ågren CEO
InvestmentsInvestments in tangible and intangible assets for the year amounted to SEK 73.6 million (35.3) for the Group, and SEK 254.9 million (258.4) for the Parent Company.
PersonnelThe average number of permanent employees in the Group amounted to 980 (916), of whom 571 were women (541), and in the Parent Company 504 (455), of whom 272 were women (247). As 31 December 2016, the number of employees in the Group amounted to 1,050 (943), and in the Parent Company 537 (470). The planning and decision-making process regarding remunerations and benefits for key individuals in executive positions including the Board is described in Note 11 of the annual report.
Capital adequacyThe new European CRR/CRDIV (Basel III) regulations entail more stringent requirements for the highest quality components of the capital base – core primary capital and primary capital. In addition to the minimum capital requirement, there is a capital conservation buffer of 2.50 percent.
The contra-cyclic buffer was raised to 1.50 percent as of 30 June 2016 for certain exposures in Norway, and to 1.50 percent for certain exposures in Sweden, applicable as of 27 June 2016. The Board further resolved that capital ratios should exceed the regulatory requirements by 0.50 percentage points. The minimum capital requirement for the core primary capital ratio is 4.50 percent, the primary capital ratio 6.00 percent and the total capital ratio 8.00 percent.
In the consolidated situation on 31 December 2016, the minimum capital requirement for the core primary capital ratio including the buffer requirement stood at 7.82 percent, the primary capital ratio at 9.32 percent and the total capital ratio at 11.32 percent.
On 31 December 2016, the minimum capital requirement including the buffer requirement for the core primary capital ratio stood at 7.83 percent, the primary capital ratio at 9.33 percent and the total capital ratio at 11.33 percent. Capital requirement is calculated in compliance with statutory minimum requirements for capital for credit risk, market risk, operational risk and credit valuation adjustment risk.In the consolidated situation on 31 December 2016, core primary capital amounted to 13.06 percent (13.25); the primary capital ratio amounted to 13.06 percent (13.25) and the total capital ratio to 15.06 percent (15.25). On 31 December 2016, the core primary capital ratio in the Parent Company stood at 13.92 percent (14.02), the primary capital ratio at 13.92 percent (14.02) and the total capital ratio at 14.94 percent (15.44). For further information on risk management and capital management, refer to page 4 and Notes 42 and 43 in the Annual Report.
Economic outlookGroup operating income for 2017 is anticipated to increase with positive earnings and cash flow.The Group’s lending to the general public, its credit losses and deposits from the public are anticipated to increase during 2017.
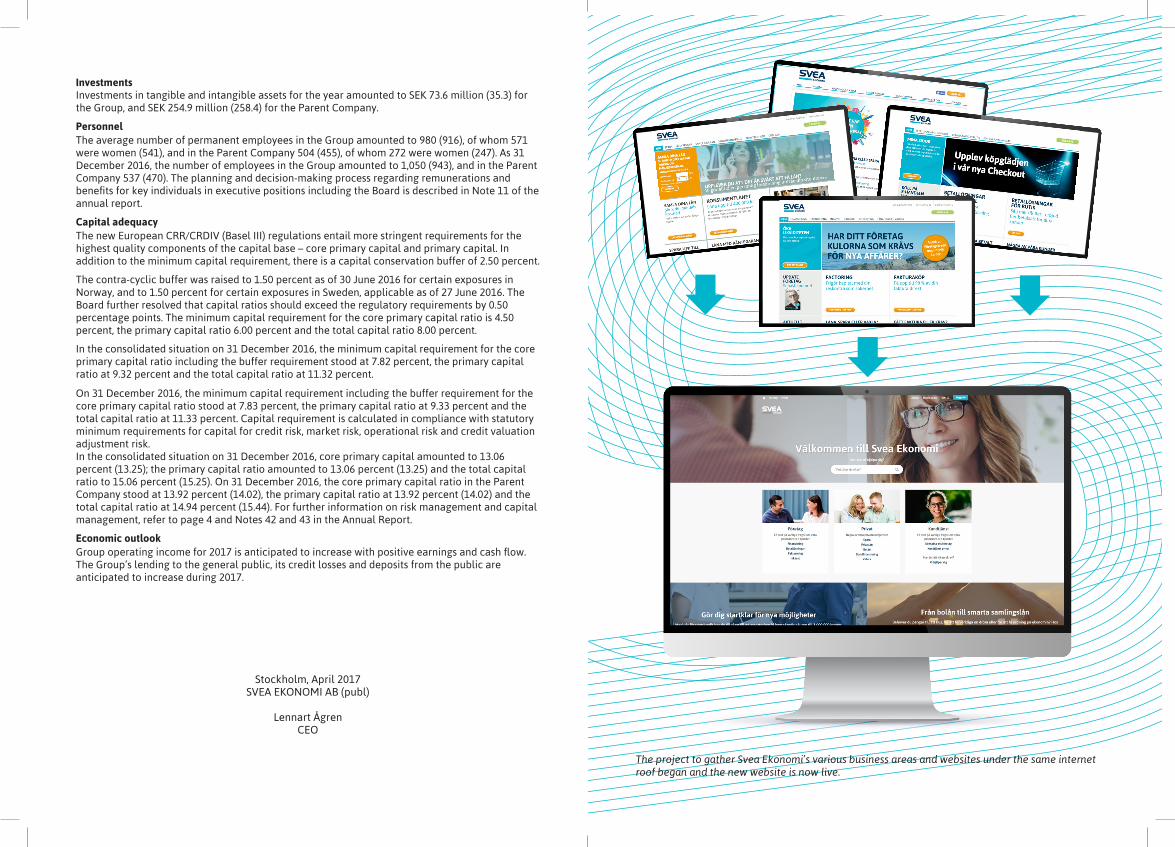
The project to gather Svea Ekonomi’s various business areas and websites under the same internet roof began and the new website is now live.
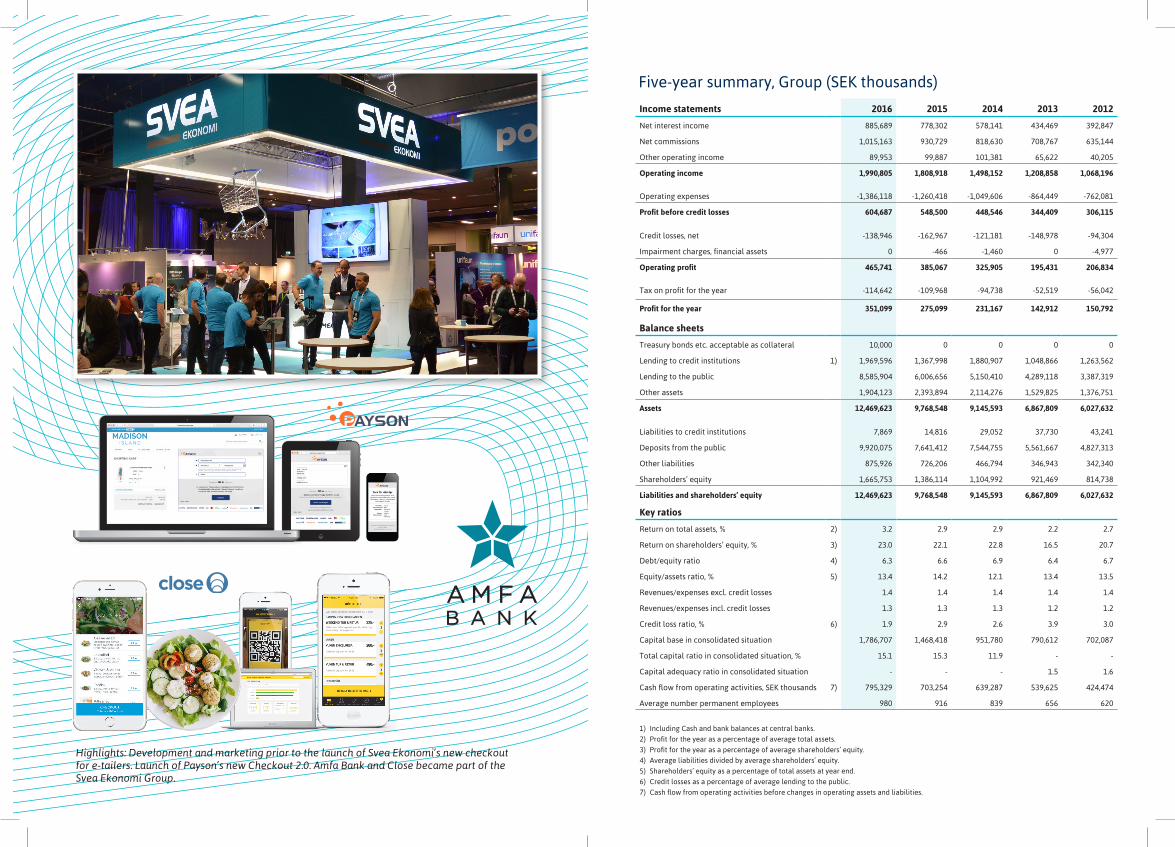
Highlights: Development and marketing prior to the launch of Svea Ekonomi’s new checkout for e-tailers. Launch of Payson’s new Checkout 2.0. Amfa Bank and Close became part of the Svea Ekonomi Group.
Income statements 2016 2015 2014 2013 2012
Net interest income 885,689 778,302 578,141 434,469 392,847
Net commissions 1,015,163 930,729 818,630 708,767 635,144
Other operating income 89,953 99,887 101,381 65,622 40,205
Operating income 1,990,805 1,808,918 1,498,152 1,208,858 1,068,196
Operating expenses -1,386,118 -1,260,418 -1,049,606 -864,449 -762,081
Profit before credit losses 604,687 548,500 448,546 344,409 306,115
Credit losses, net -138,946 -162,967 -121,181 -148,978 -94,304
Impairment charges, financial assets 0 -466 -1,460 0 -4,977
Operating profit 465,741 385,067 325,905 195,431 206,834
Tax on profit for the year -114,642 -109,968 -94,738 -52,519 -56,042
Profit for the year 351,099 275,099 231,167 142,912 150,792
Balance sheets
Treasury bonds etc. acceptable as collateral 10,000 0 0 0 0
Lending to credit institutions 1) 1,969,596 1,367,998 1,880,907 1,048,866 1,263,562
Lending to the public 8,585,904 6,006,656 5,150,410 4,289,118 3,387,319
Other assets 1,904,123 2,393,894 2,114,276 1,529,825 1,376,751
Assets 12,469,623 9,768,548 9,145,593 6,867,809 6,027,632
Liabilities to credit institutions 7,869 14,816 29,052 37,730 43,241
Deposits from the public 9,920,075 7,641,412 7,544,755 5,561,667 4,827,313
Other liabilities 875,926 726,206 466,794 346,943 342,340
Shareholders’ equity 1,665,753 1,386,114 1,104,992 921,469 814,738
Liabilities and shareholders’ equity 12,469,623 9,768,548 9,145,593 6,867,809 6,027,632
Key ratios
Return on total assets, % 2) 3.2 2.9 2.9 2.2 2.7
Return on shareholders’ equity, % 3) 23.0 22.1 22.8 16.5 20.7
Debt/equity ratio 4) 6.3 6.6 6.9 6.4 6.7
Equity/assets ratio, % 5) 13.4 14.2 12.1 13.4 13.5
Revenues/expenses excl. credit losses 1.4 1.4 1.4 1.4 1.4
Revenues/expenses incl. credit losses 1.3 1.3 1.3 1.2 1.2
Credit loss ratio, % 6) 1.9 2.9 2.6 3.9 3.0
Capital base in consolidated situation 1,786,707 1,468,418 951,780 790,612 702,087
Total capital ratio in consolidated situation, % 15.1 15.3 11.9 - -
Capital adequacy ratio in consolidated situation - - - 1.5 1.6
Cash flow from operating activities, SEK thousands 7) 795,329 703,254 639,287 539,625 424,474
Average number permanent employees 980 916 839 656 620
Five-year summary, Group (SEK thousands)
1) Including Cash and bank balances at central banks. 2) Profit for the year as a percentage of average total assets. 3) Profit for the year as a percentage of average shareholders’ equity. 4) Average liabilities divided by average shareholders’ equity. 5) Shareholders’ equity as a percentage of total assets at year end. 6) Credit losses as a percentage of average lending to the public. 7) Cash flow from operating activities before changes in operating assets and liabilities.

SolnaSE-169 81 Solna Sweden
Evenemangsgatan 31 Tel: + 46 8 735 90 00 Fax: +46 8 735 42 09
GothenburgBox 2149 SE-403 13 Gothenburg Sweden
Otterhällegatan 12 B Tel: + 46 31 17 25 45 Fax: + 46 31 711 18 16
ÅsedaBox 116 SE-364 21 Åseda Sweden
Skolgatan 8 Tel: + 46 8 735 90 00 Fax: + 46 474 716 68
www.sveaekonomi.se [email protected] Co. reg. no. 556489-2924 Registered office: Stockholm
sveaekonomi.se READ MORE AT