
Hawkinson NDT Tire Inspection Technology: Where the Rubber ...
Upload
massrecycle-Category
view
128download
0
Recovered Paper Market Update
Brian Hawkinson, AF&PA
MassRecycle 2016 R3 Conference
March 29, 2016
Quincy, Mass.
About AF&PA
• Advances a sustainable pulp, paper,
packaging and wood products
manufacturing industry
• Fact-based public policy and marketplace
advocacy
2

AF&PA’s 2020 Sustainability Goals
3
1. Paper Recovery Exceed 70%
2. Energy Efficiency Increase purchased energy efficiency
by at least 10%
3. GHG Emissions Reduce intensity by at least 15%
4. Forestry Increase certified fiber procurement
5. Safety Reduce incidence rate by 25%
6. Water Reduce use in mills by 12%

Recovered Fiber Markets
• Complex, dynamic, efficient
• Global demand
• Collection commitment by many parties • Municipalities
• Paper manufacturers
• Recycling companies
• Schools
• Businesses
• Millions of Americans
• Not served by regulations that restrict market-based collection or use

U.S. Recovery of Paper & Paper-based Packaging
• Overall: 65.4% (2014)
• Exceed 60% recovery past 6 years
• True environmental success story
• On track to meet Better Practices Better
Planet 2020 goal
5

U.S. Paper Recovery Rate 1990-2014
20%
25%
30%
35%
40%
45%
50%
55%
60%
65%
70%
1990
1991
1992
1993
1994
1995
1996
1997
1998
1999
2000
2001
2002
2003
2004
2005
2006
2007
2008
2009
2010
2011
2012
2013
2014
Actual
Trend
Source: AF&PA
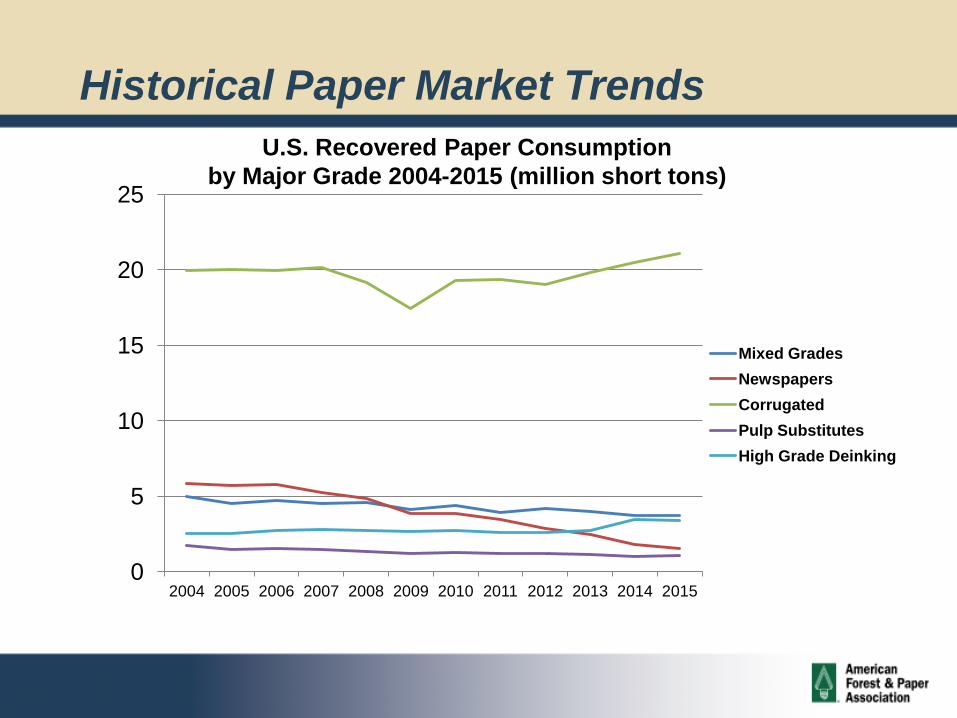
Historical Paper Market Trends
Historical Paper Market Trends
0
5
10
15
20
25
2004 2005 2006 2007 2008 2009 2010 2011 2012 2013 2014 2015
Mixed Grades
Newspapers
Corrugated
Pulp Substitutes
High Grade Deinking
U.S. Recovered Paper Consumption
by Major Grade 2004-2015 (million short tons)
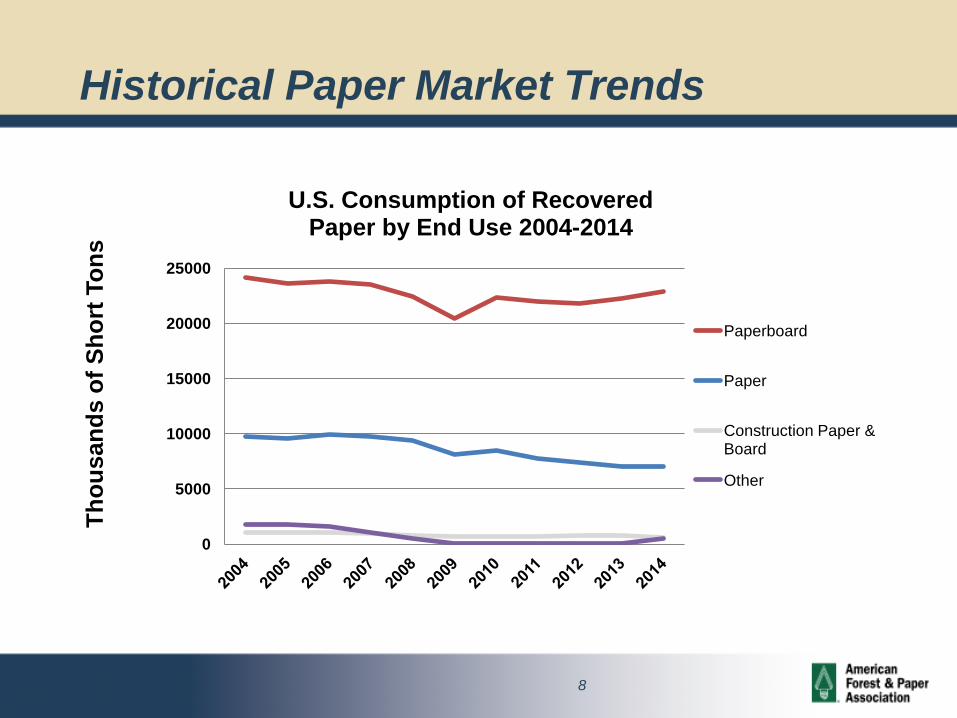
Historical Paper Market Trends
8
0
5000
10000
15000
20000
25000
Th
ou
san
ds o
f S
ho
rt T
on
s
U.S. Consumption of Recovered Paper by End Use 2004-2014
Paperboard
Paper
Construction Paper & Board
Other

Global Demand for Recovered Paper (2015-2029)
9
Source: RISI
2015 2016 2017 2018 2019 2020 2021 2022 2023 2024 2025 2026 2027 2028 2029
Global Recovered Fiber Demand vs. Paper and Paperboard Output
Demand
Output
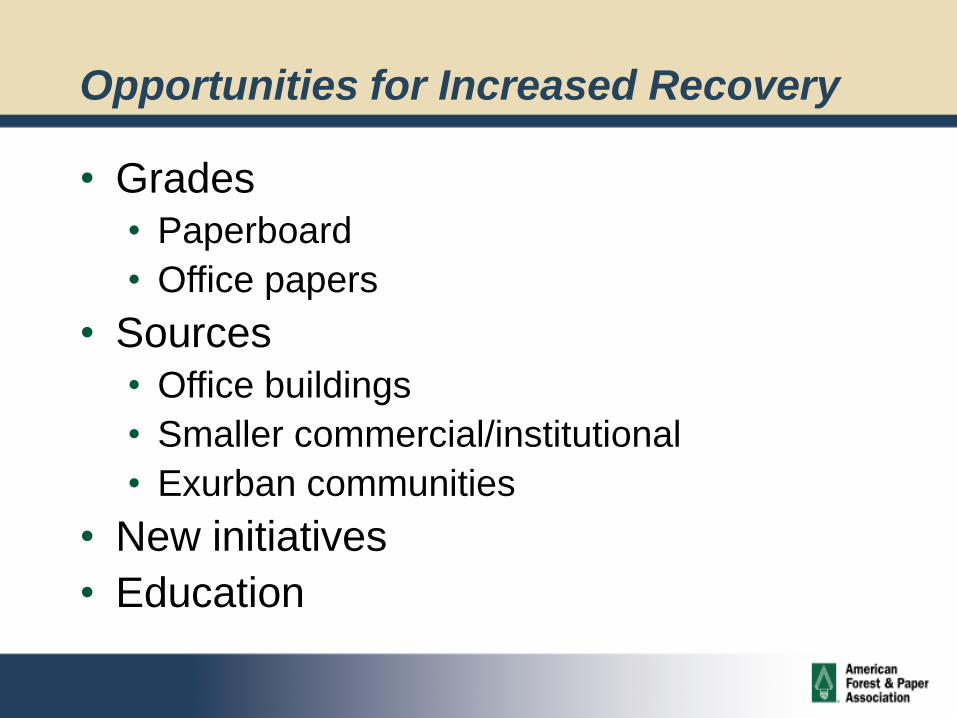
Opportunities for Increased Recovery
• Grades
• Paperboard
• Office papers
• Sources
• Office buildings
• Smaller commercial/institutional
• Exurban communities
• New initiatives
• Education
Affect of Quality on End Markets
• Recovered Paper quality is marketplace issue
• Must meet production specifications: • Cost
• Availability
• Functionality
• Performance attributes of finished product
• Processing requirements vary by grade
• Mills procure fiber that best meets production
specifications
11
Government Policy Challenges
• Mixed-waste processing systems
• Extended Producer Responsibility
• Recycled content mandates
12
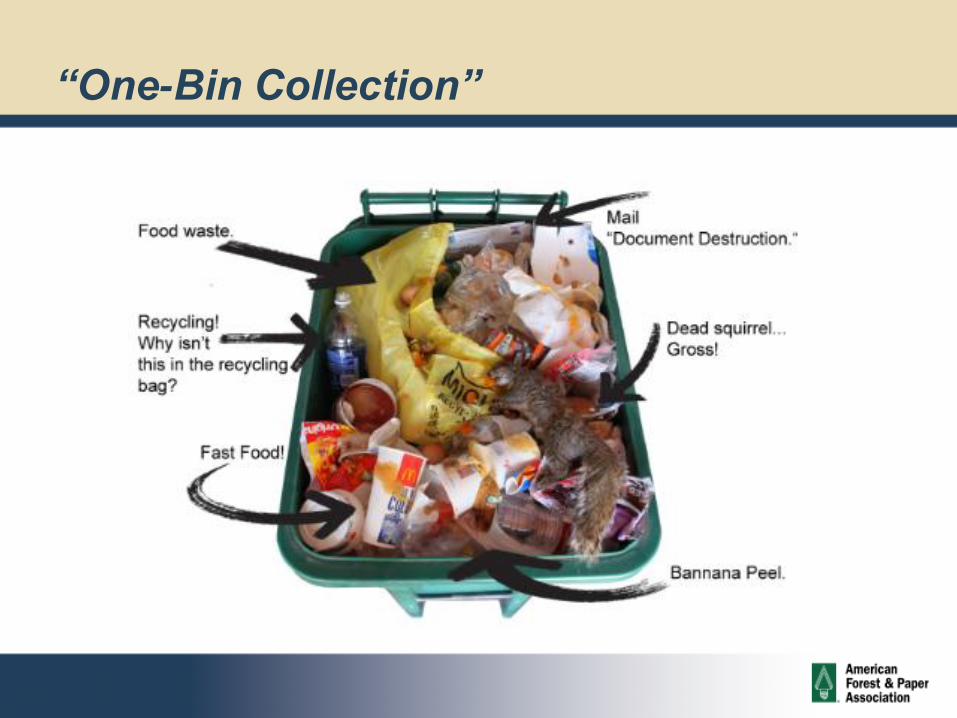
“One-Bin Collection”

Challenge to Increasing Recovery
• Mixed waste processing systems (MWP)
• Concept
• Collect dry recyclable materials with wet & organic garbage
• Separate recyclables on processing line
• Residuals to WTE, RDF or landfill
• Increasing pressure on municipalities
• Cost management
• Meet diversion goals
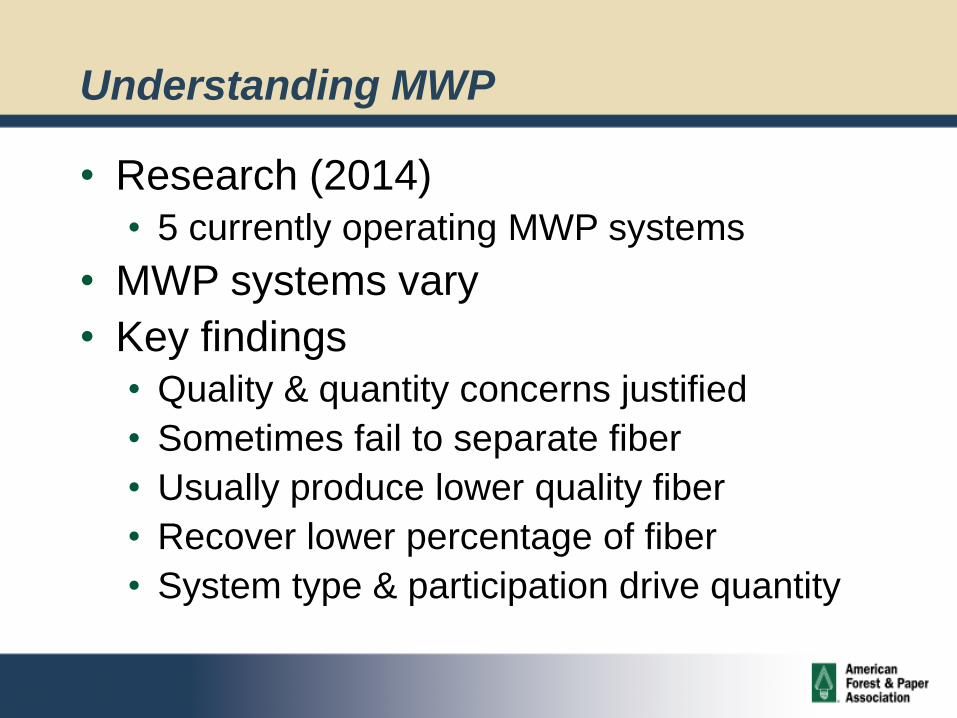
Understanding MWP
• Research (2014)
• 5 currently operating MWP systems
• MWP systems vary
• Key findings
• Quality & quantity concerns justified
• Sometimes fail to separate fiber
• Usually produce lower quality fiber
• Recover lower percentage of fiber
• System type & participation drive quantity

Mixed Waste Processing Economic & Policy
Study (2015)
• Purpose
• Is there a market-based economic case?
• Inform future decisions regarding
engagement in objective manner.
17
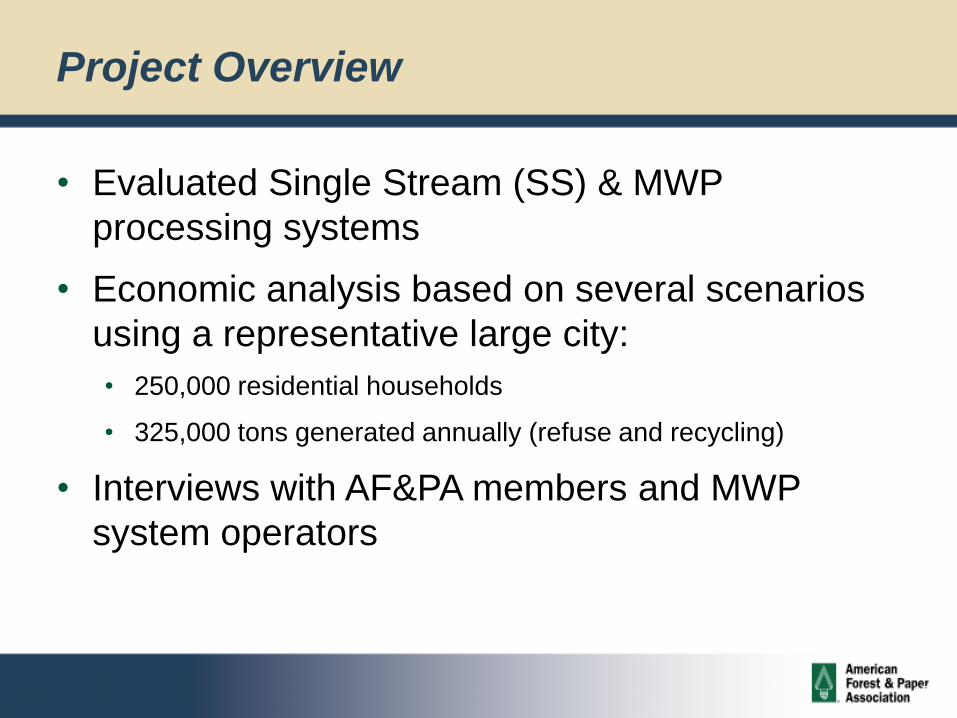
Project Overview
• Evaluated Single Stream (SS) & MWP
processing systems
• Economic analysis based on several scenarios
using a representative large city:
• 250,000 residential households
• 325,000 tons generated annually (refuse and recycling)
• Interviews with AF&PA members and MWP
system operators
18
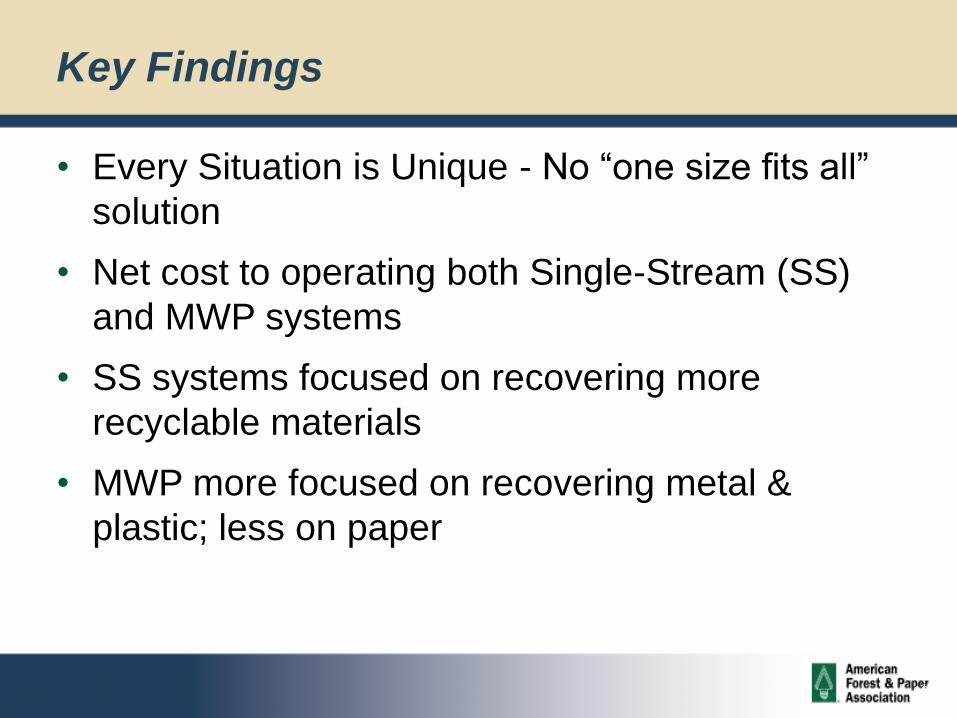
Key Findings
• Every Situation is Unique - No “one size fits all”
solution
• Net cost to operating both Single-Stream (SS)
and MWP systems
• SS systems focused on recovering more
recyclable materials
• MWP more focused on recovering metal &
plastic; less on paper
19
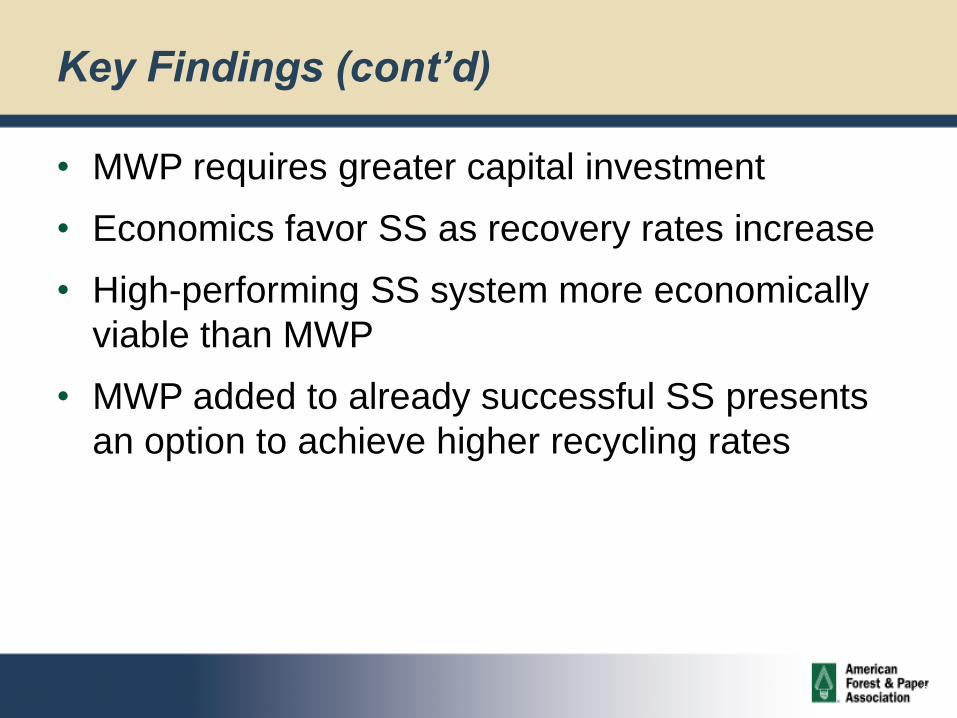
Key Findings (cont’d)
• MWP requires greater capital investment
• Economics favor SS as recovery rates increase
• High-performing SS system more economically
viable than MWP
• MWP added to already successful SS presents
an option to achieve higher recycling rates

Extended Producer Responsibility
• AF&PA opposes for paper & packaging
• Markets for recovered paper are developed
• Broad consumer access to paper recycling
• Paper is recycled at a high rate
• Will not increase paper recovery
20

Policy: Recycled Content Mandates
• AF&PA promotes open market access for all products
• Choice of fiber strikes balance among quality, cost, functionality and production performance
• Recycled content mandates: • Make markets for recovered fiber less efficient
• Prevent recovered fiber from going to highest value end use
• Raise cost of production for new paper products
• Narrow available choices for consumers
• Unlikely to drive increased paper recovery rate
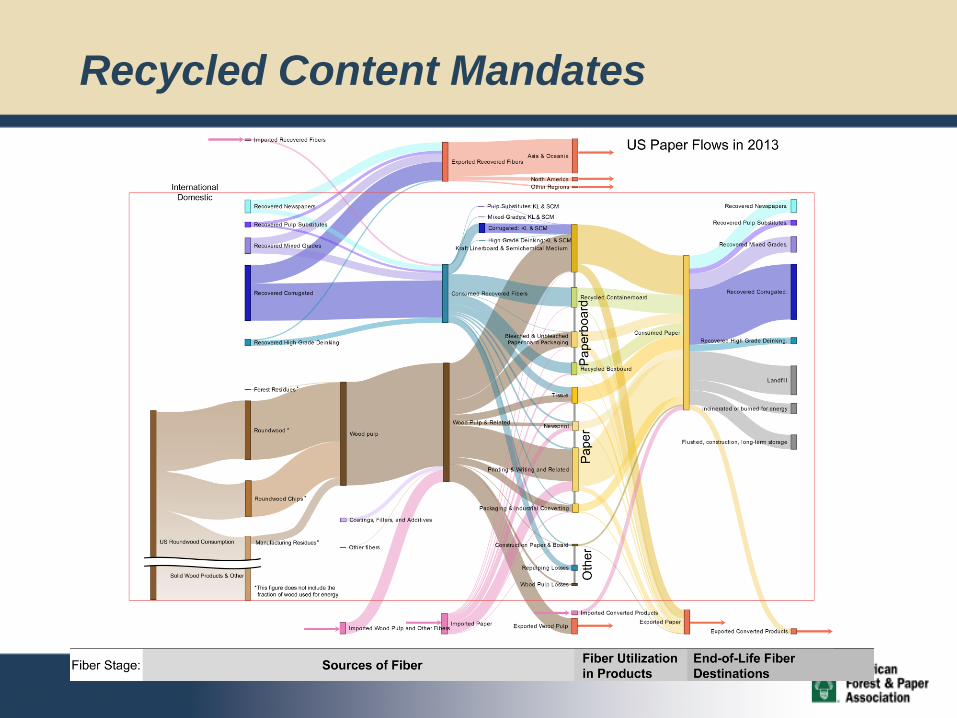
Recycled Content Mandates
“Best Practices” for Sustaining Recovered
Paper Markets
• Free marketplace
• Collection
• Utilization
• System designed to meet end user
requirements
23

Thank You
Brian Hawkinson
Executive Director, Recovered Fiber
AF&PA
202-463-2776
24
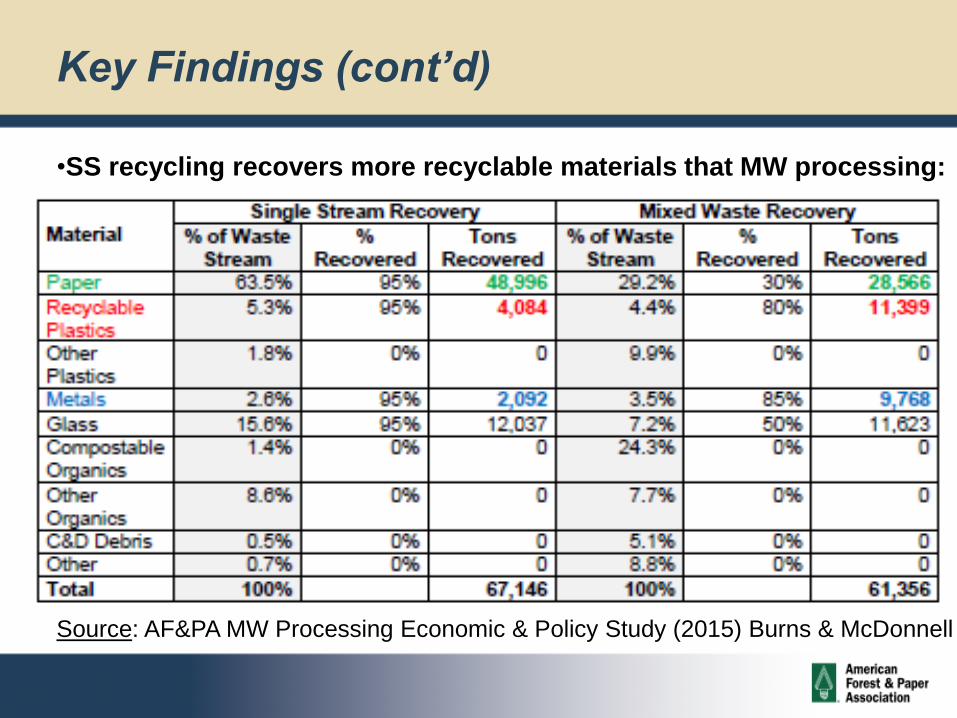
Key Findings (cont’d)
•SS recycling recovers more recyclable materials that MW processing:
Source: AF&PA MW Processing Economic & Policy Study (2015) Burns & McDonnell