2016 Multimodal Asset Performance Report€¦ · Table of Contents & Multimodal Asset . 2016...
39
WSDOT’s annual summary of transportation asset management performance reports Roger Millar, PE, AICP Secretary of Transportation 2016 Multimodal Asset Performance Report
Transcript of 2016 Multimodal Asset Performance Report€¦ · Table of Contents & Multimodal Asset . 2016...
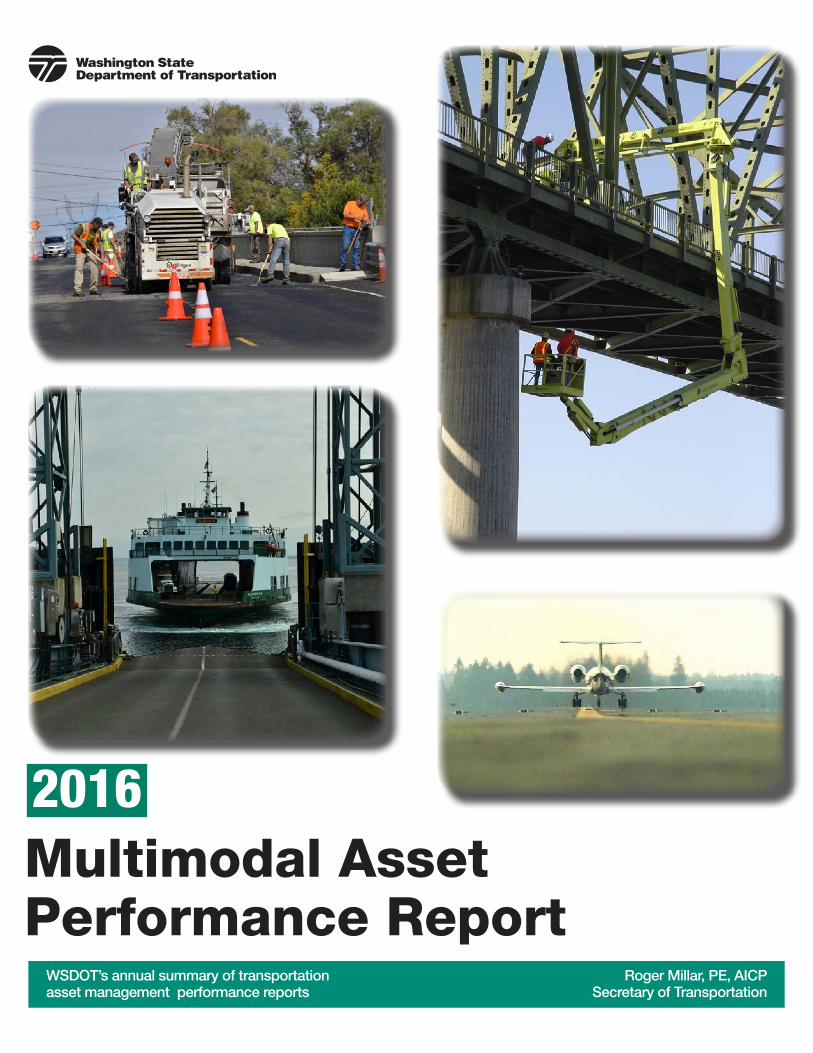
WSDOT’s annual summary of transportation asset management performance reports
Roger Millar, PE, AICPSecretary of Transportation
2016Multimodal Asset Performance Report
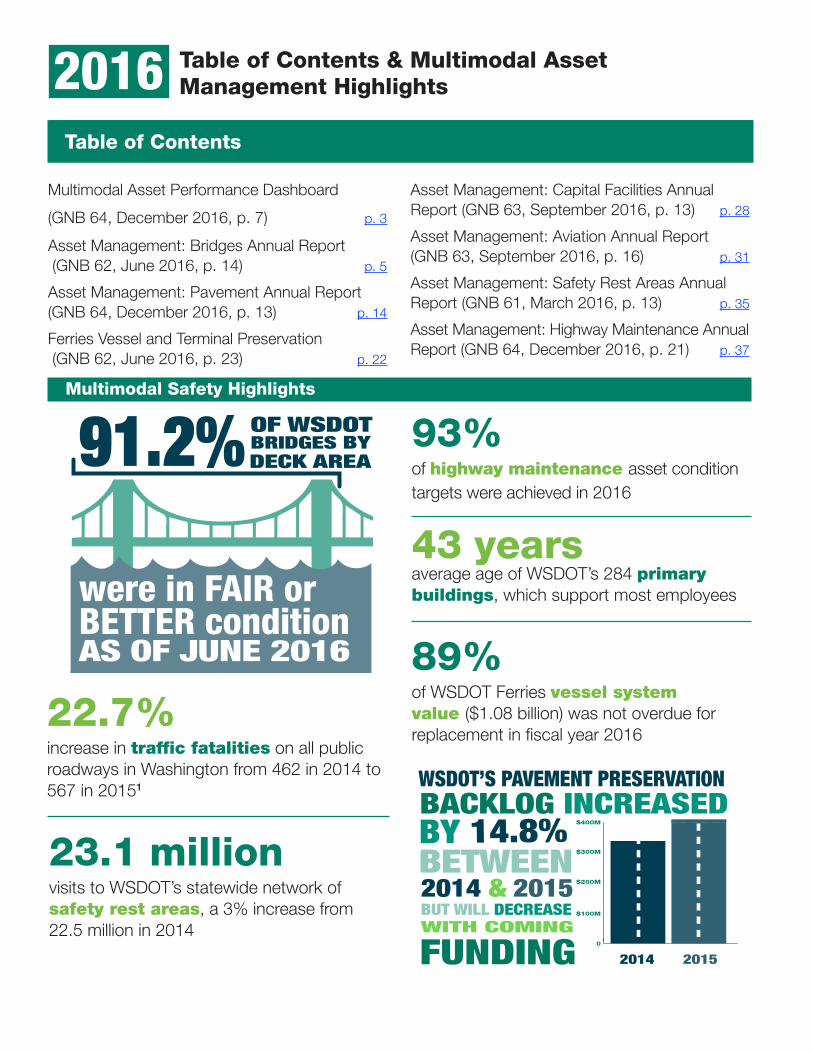
Table of Contents & Multimodal Asset Management Highlights2016
Multimodal Safety Highlights
Multimodal Asset Performance Dashboard
(GNB 64, December 2016, p. 7) p. 3
Asset Management: Bridges Annual Report (GNB 62, June 2016, p. 14) p. 5
Asset Management: Pavement Annual Report (GNB 64, December 2016, p. 13) p. 14
Ferries Vessel and Terminal Preservation (GNB 62, June 2016, p. 23) p. 22
Table of Contents
Asset Management: Capital Facilities Annual Report (GNB 63, September 2016, p. 13) p. 28
Asset Management: Aviation Annual Report (GNB 63, September 2016, p. 16) p. 31
Asset Management: Safety Rest Areas Annual Report (GNB 61, March 2016, p. 13) p. 35
Asset Management: Highway Maintenance Annual Report (GNB 64, December 2016, p. 21) p. 37
89%of WSDOT Ferries vessel system value ($1.08 billion) was not overdue for replacement in fiscal year 2016
23.1 millionvisits to WSDOT’s statewide network of safety rest areas, a 3% increase from 22.5 million in 2014
91.2%OF WSDOT
DECK AREABRIDGES BY
AS OF JUNE 2016
were in FAIR or BETTER condition
WSDOT’S PAVEMENT PRESERVATION
BY BETWEEN 2014
BACKLOG INCREASED 14.8%
0
$100M
$200M
$300M
$400M
BUT WILL DECREASE2015&
WITH COMING
2014 2015 FUNDING
93%of highway maintenance asset condition targets were achieved in 2016
43 yearsaverage age of WSDOT’s 284 primary buildings, which support most employees
22.7%increase in traffic fatalities on all public roadways in Washington from 462 in 2014 to 567 in 20151
GNB Edition 64 – December 31, 2016 | 3Multimodal Asset Performance Dashboard
Multimodal Asset Performance Dashboard 64
WSDOT performance measurePrevious
periodCurrent
period Goal Goal met Five-year trend (unless noted)Desired
trend
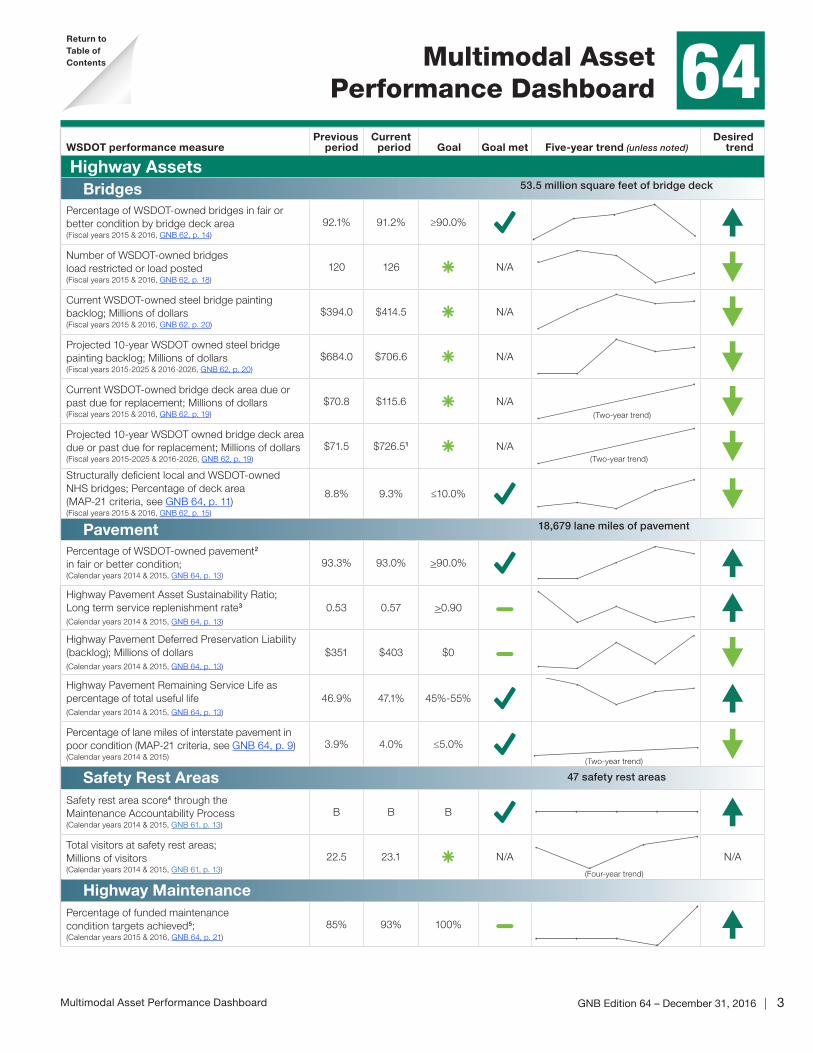
Highway Assets Bridges
Percentage of WSDOT-owned bridges in fair or better condition by bridge deck area(Fiscal years 2015 & 2016, GNB 62, p. 14)
92.1% 91.2% ≥90.0%
0.910
0.922
Number of WSDOT-owned bridgesload restricted or load posted(Fiscal years 2015 & 2016, GNB 62, p. 18)
120 126 N/A119
141
Current WSDOT-owned steel bridge painting backlog; Millions of dollars(Fiscal years 2015 & 2016, GNB 62, p. 20)
$394.0 $414.5 N/A197
469
Projected 10-year WSDOT owned steel bridgepainting backlog; Millions of dollars(Fiscal years 2015-2025 & 2016-2026, GNB 62, p. 20)
$684.0 $706.6 N/A565
751
Current WSDOT-owned bridge deck area due or past due for replacement; Millions of dollars(Fiscal years 2015 & 2016, GNB 62, p. 19)
$70.8 $115.6 N/A70
116
Projected 10-year WSDOT owned bridge deck area due or past due for replacement; Millions of dollars(Fiscal years 2015-2025 & 2016-2026, GNB 62, p. 19)
$71.5 $726.51 N/A70
730
Structurally deficient local and WSDOT-owned NHS bridges; Percentage of deck area(MAP-21 criteria, see GNB 64, p. 11)(Fiscal years 2015 & 2016, GNB 62, p. 15)
8.8% 9.3% ≤10.0%0.078
0.095
PavementPercentage of WSDOT-owned pavement2
in fair or better condition; (Calendar years 2014 & 2015, GNB 64, p. 13)
93.3% 93.0% >90.0%91.90
93.35
Highway Pavement Asset Sustainability Ratio;Long term service replenishment rate3
(Calendar years 2014 & 2015, GNB 64, p. 13)
0.53 0.57 >0.900.52
0.77
Highway Pavement Deferred Preservation Liability (backlog); Millions of dollars(Calendar years 2014 & 2015, GNB 64, p. 13)
$351 $403 $0343.000000
403.999963
Highway Pavement Remaining Service Life aspercentage of total useful life(Calendar years 2014 & 2015, GNB 64, p. 13)
46.9% 47.1% 45%-55%0.46
Percentage of lane miles of interstate pavement in poor condition (MAP-21 criteria, see GNB 64, p. 9)(Calendar years 2014 & 2015)
3.9% 4.0% ≤5.0%3.9
Safety Rest AreasSafety rest area score4 through theMaintenance Accountability Process(Calendar years 2014 & 2015, GNB 61, p. 13)
B B B
2.000000
3.999999
Total visitors at safety rest areas;Millions of visitors(Calendar years 2014 & 2015, GNB 61, p. 13)
22.5 23.1 N/A20.700001
23.200001
N/A
Highway MaintenancePercentage of funded maintenance condition targets achieved5;(Calendar years 2015 & 2016, GNB 64, p. 21)
85% 93% 100%
0.790
0.855
(Two-year trend)
(Two-year trend)
53.5 million square feet of bridge deck
18,679 lane miles of pavement
47 safety rest areas
(Two-year trend)
(Four-year trend)
Return toTable of Contents
4 | GNB Edition 64 – December 31, 2016 Multimodal Asset Performance Dashboard
Multimodal Asset Performance Dashboard (continued)
(Three-year trend)
(Three-year trend)
(Three-year trend)
(Three-year trend)
WSDOT performance measurePrevious
periodCurrent
period Goal Goal met Five-year trend (unless noted)Desired
trend
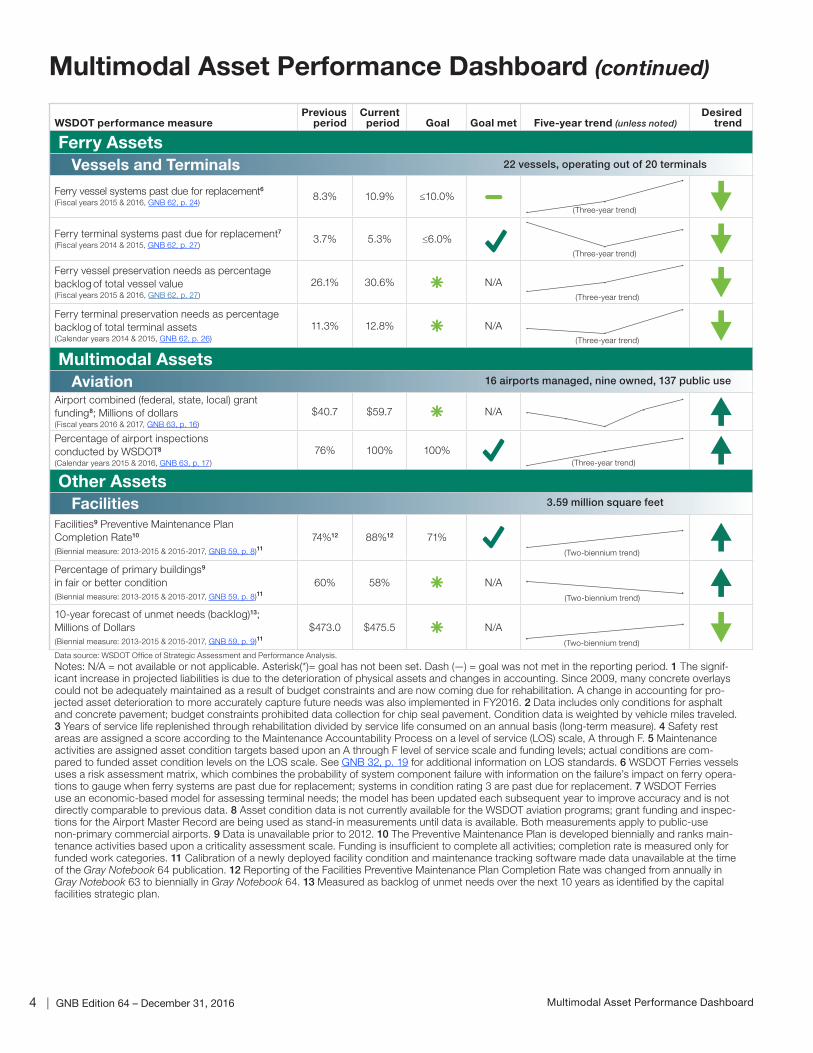
Ferry Assets Vessels and Terminals
Ferry vessel systems past due for replacement6
(Fiscal years 2015 & 2016, GNB 62, p. 24)8.3% 10.9% ≤10.0%
0.07
0.11
Ferry terminal systems past due for replacement7
(Fiscal years 2014 & 2015, GNB 62, p. 27)3.7% 5.3% ≤6.0%
0.036
0.061
Ferry vessel preservation needs as percentage backlog of total vessel value(Fiscal years 2015 & 2016, GNB 62, p. 27)
26.1% 30.6% N/A0.07
0.11
Ferry terminal preservation needs as percentage backlog of total terminal assets(Calendar years 2014 & 2015, GNB 62, p. 26)
11.3% 12.8% N/A0.112
0.129
Multimodal Assets Aviation
Airport combined (federal, state, local) grant funding8; Millions of dollars(Fiscal years 2016 & 2017, GNB 63, p. 16)
$40.7 $59.7 N/A9.20
59.95
Percentage of airport inspectionsconducted by WSDOT8
(Calendar years 2015 & 2016, GNB 63, p. 17)
76% 100% 100%0.49
1.01
Other Assets Facilities
Facilities9 Preventive Maintenance Plan Completion Rate10
(Biennial measure: 2013-2015 & 2015-2017, GNB 59, p. 8)11
74%12 88%12 71%0.73
0.98
Percentage of primary buildings9
in fair or better condition(Biennial measure: 2013-2015 & 2015-2017, GNB 59, p. 8)11
60% 58% N/A0.588
0.620
10-year forecast of unmet needs (backlog)13;Millions of Dollars(Biennial measure: 2013-2015 & 2015-2017, GNB 59, p. 9)11
$473.0 $475.5 N/A472.899994
478.999972
Data source: WSDOT Office of Strategic Assessment and Performance Analysis.
Notes: N/A = not available or not applicable. Asterisk(*)= goal has not been set. Dash (—) = goal was not met in the reporting period. 1 The signif-icant increase in projected liabilities is due to the deterioration of physical assets and changes in accounting. Since 2009, many concrete overlays could not be adequately maintained as a result of budget constraints and are now coming due for rehabilitation. A change in accounting for pro-jected asset deterioration to more accurately capture future needs was also implemented in FY2016. 2 Data includes only conditions for asphalt and concrete pavement; budget constraints prohibited data collection for chip seal pavement. Condition data is weighted by vehicle miles traveled. 3 Years of service life replenished through rehabilitation divided by service life consumed on an annual basis (long-term measure). 4 Safety rest areas are assigned a score according to the Maintenance Accountability Process on a level of service (LOS) scale, A through F. 5 Maintenance activities are assigned asset condition targets based upon an A through F level of service scale and funding levels; actual conditions are com-pared to funded asset condition levels on the LOS scale. See GNB 32, p. 19 for additional information on LOS standards. 6 WSDOT Ferries vessels uses a risk assessment matrix, which combines the probability of system component failure with information on the failure’s impact on ferry opera-tions to gauge when ferry systems are past due for replacement; systems in condition rating 3 are past due for replacement. 7 WSDOT Ferries use an economic-based model for assessing terminal needs; the model has been updated each subsequent year to improve accuracy and is not directly comparable to previous data. 8 Asset condition data is not currently available for the WSDOT aviation programs; grant funding and inspec-tions for the Airport Master Record are being used as stand-in measurements until data is available. Both measurements apply to public-use non-primary commercial airports. 9 Data is unavailable prior to 2012. 10 The Preventive Maintenance Plan is developed biennially and ranks main-tenance activities based upon a criticality assessment scale. Funding is insufficient to complete all activities; completion rate is measured only for funded work categories. 11 Calibration of a newly deployed facility condition and maintenance tracking software made data unavailable at the time of the Gray Notebook 64 publication. 12 Reporting of the Facilities Preventive Maintenance Plan Completion Rate was changed from annually in Gray Notebook 63 to biennially in Gray Notebook 64. 13 Measured as backlog of unmet needs over the next 10 years as identified by the capital facilities strategic plan.
(Three-year trend)
(Two-biennium trend)
(Two-biennium trend)
(Two-biennium trend)
3.59 million square feet
16 airports managed, nine owned, 137 public use
22 vessels, operating out of 20 terminals
GNB Edition 62 - June 30, 2016 | 5Strategic goal: Preservation – Bridges5 |
Asset Management: Bridge Annual Report62
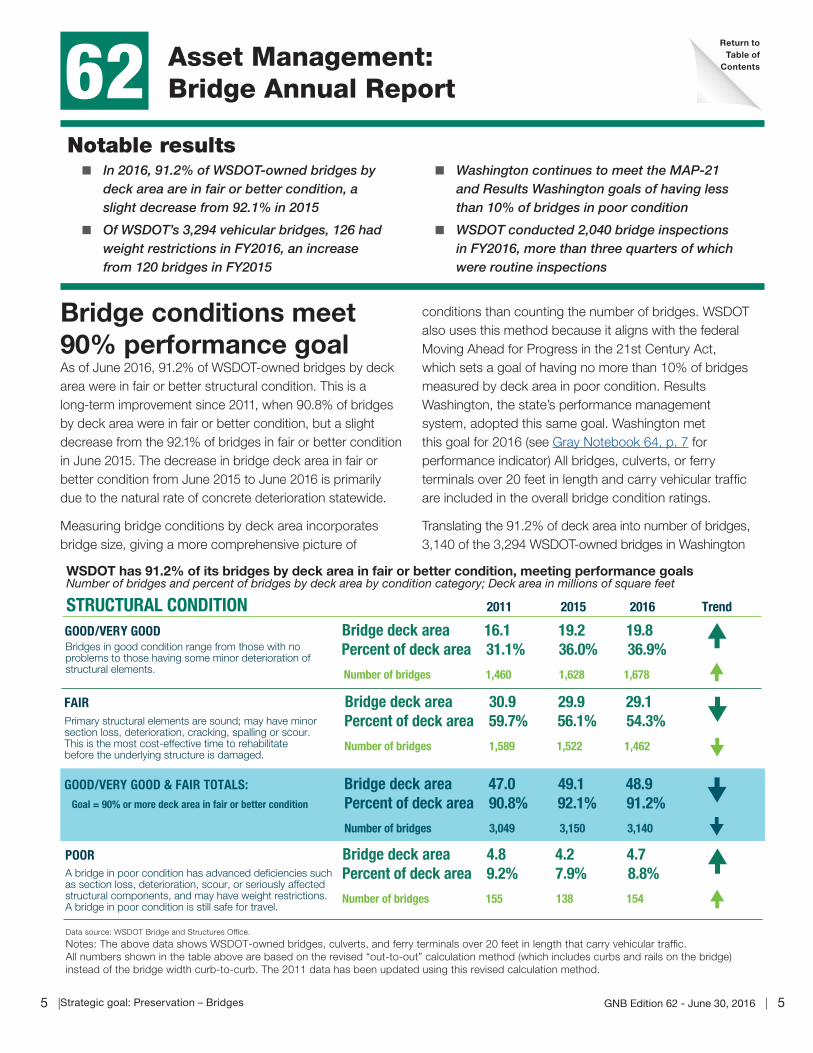
Notable results � In 2016, 91.2% of WSDOT-owned bridges by
deck area are in fair or better condition, a slight decrease from 92.1% in 2015
� Of WSDOT’s 3,294 vehicular bridges, 126 had weight restrictions in FY2016, an increase from 120 bridges in FY2015
� Washington continues to meet the MAP-21 and Results Washington goals of having less than 10% of bridges in poor condition
� WSDOT conducted 2,040 bridge inspections in FY2016, more than three quarters of which were routine inspections
conditions than counting the number of bridges. WSDOT also uses this method because it aligns with the federal Moving Ahead for Progress in the 21st Century Act, which sets a goal of having no more than 10% of bridges measured by deck area in poor condition. Results Washington, the state’s performance management system, adopted this same goal. Washington met this goal for 2016 (see Gray Notebook 64, p. 7 for performance indicator) All bridges, culverts, or ferry terminals over 20 feet in length and carry vehicular traffic are included in the overall bridge condition ratings.
Translating the 91.2% of deck area into number of bridges, 3,140 of the 3,294 WSDOT-owned bridges in Washington
Bridge conditions meet 90% performance goalAs of June 2016, 91.2% of WSDOT-owned bridges by deck area were in fair or better structural condition. This is a long-term improvement since 2011, when 90.8% of bridges by deck area were in fair or better condition, but a slight decrease from the 92.1% of bridges in fair or better condition in June 2015. The decrease in bridge deck area in fair or better condition from June 2015 to June 2016 is primarily due to the natural rate of concrete deterioration statewide.
Measuring bridge conditions by deck area incorporates bridge size, giving a more comprehensive picture of
Bridges in good condition range from those with no problems to those having some minor deterioration of structural elements.
STRUCTURAL CONDITION 2011 2015 2016 Trend
Data source: WSDOT Bridge and Structures Office.
Notes: The above data shows WSDOT-owned bridges, culverts, and ferry terminals over 20 feet in length that carry vehicular traffic. All numbers shown in the table above are based on the revised “out-to-out” calculation method (which includes curbs and rails on the bridge) instead of the bridge width curb-to-curb. The 2011 data has been updated using this revised calculation method.
WSDOT has 91.2% of its bridges by deck area in fair or better condition, meeting performance goalsNumber of bridges and percent of bridges by deck area by condition category; Deck area in millions of square feet
Primary structural elements are sound; may have minorsection loss, deterioration, cracking, spalling or scour. This is the most cost-effective time to rehabilitatebefore the underlying structure is damaged.
FAIR Bridge deck area 30.9 29.9 29.1 Percent of deck area 59.7% 56.1% 54.3%
Number of bridges 1,589 1,522 1,462
GOOD/VERY GOOD & FAIR TOTALS: Bridge deck area 47.0 49.1 48.9 Percent of deck area 90.8% 92.1% 91.2%
Number of bridges 3,049 3,150 3,140
POOR Bridge deck area 4.8 4.2 4.7 Percent of deck area 9.2% 7.9% 8.8%
Number of bridges 155 138 154
GOOD/VERY GOOD Bridge deck area 16.1 19.2 19.8 Percent of deck area 31.1% 36.0% 36.9%
Number of bridges 1,460 1,628 1,678
A bridge in poor condition has advanced deficiencies such as section loss, deterioration, scour, or seriously affected structural components, and may have weight restrictions.A bridge in poor condition is still safe for travel.
Goal = 90% or more deck area in fair or better condition
Return toTable of
Contents
6 | GNB Edition 62 - June 30, 2016 Strategic goal: Preservation – Bridges
Washington meets federal, state bridge condition goal
or truck terminals, pipeline terminals and other transport facilities (see Gray Notebook 54, p. 6). Washington’s NHS includes 2,448 bridges; 2,259 (92.3%) are managed by WSDOT and 189 (7.7%) are managed by cities and counties.
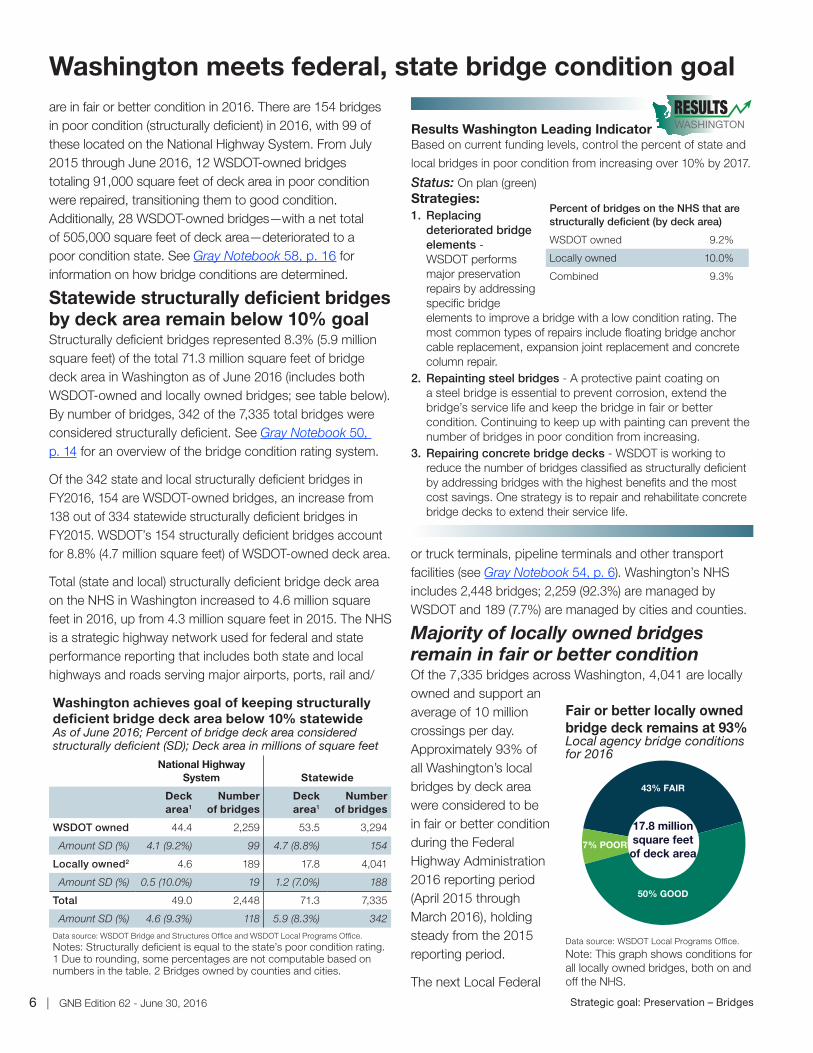
Majority of locally owned bridges remain in fair or better conditionOf the 7,335 bridges across Washington, 4,041 are locally owned and support an average of 10 million crossings per day. Approximately 93% of all Washington’s local bridges by deck area were considered to be in fair or better condition during the Federal Highway Administration 2016 reporting period (April 2015 through March 2016), holding steady from the 2015 reporting period.
The next Local Federal
are in fair or better condition in 2016. There are 154 bridges in poor condition (structurally deficient) in 2016, with 99 of these located on the National Highway System. From July 2015 through June 2016, 12 WSDOT-owned bridges totaling 91,000 square feet of deck area in poor condition were repaired, transitioning them to good condition. Additionally, 28 WSDOT-owned bridges—with a net total of 505,000 square feet of deck area—deteriorated to a poor condition state. See Gray Notebook 58, p. 16 for information on how bridge conditions are determined.
Statewide structurally deficient bridges by deck area remain below 10% goalStructurally deficient bridges represented 8.3% (5.9 million square feet) of the total 71.3 million square feet of bridge deck area in Washington as of June 2016 (includes both WSDOT-owned and locally owned bridges; see table below). By number of bridges, 342 of the 7,335 total bridges were considered structurally deficient. See Gray Notebook 50, p. 14 for an overview of the bridge condition rating system.
Of the 342 state and local structurally deficient bridges in FY2016, 154 are WSDOT-owned bridges, an increase from 138 out of 334 statewide structurally deficient bridges in FY2015. WSDOT’s 154 structurally deficient bridges account for 8.8% (4.7 million square feet) of WSDOT-owned deck area.
Total (state and local) structurally deficient bridge deck area on the NHS in Washington increased to 4.6 million square feet in 2016, up from 4.3 million square feet in 2015. The NHS is a strategic highway network used for federal and state performance reporting that includes both state and local highways and roads serving major airports, ports, rail and/
Washington achieves goal of keeping structurally deficient bridge deck area below 10% statewideAs of June 2016; Percent of bridge deck area considered structurally deficient (SD); Deck area in millions of square feet
National Highway System Statewide
Deck area1
Number of bridges
Deck area1
Number of bridges
WSDOT owned 44.4 2,259 53.5 3,294
Amount SD (%) 4.1 (9.2%) 99 4.7 (8.8%) 154
Locally owned2 4.6 189 17.8 4,041
Amount SD (%) 0.5 (10.0%) 19 1.2 (7.0%) 188
Total 49.0 2,448 71.3 7,335
Amount SD (%) 4.6 (9.3%) 118 5.9 (8.3%) 342
Data source: WSDOT Bridge and Structures Office and WSDOT Local Programs Office.
Notes: Structurally deficient is equal to the state’s poor condition rating. 1 Due to rounding, some percentages are not computable based on numbers in the table. 2 Bridges owned by counties and cities.
Results Washington Leading IndicatorBased on current funding levels, control the percent of state and
local bridges in poor condition from increasing over 10% by 2017.
Status: On plan (green)Strategies: 1. Replacing
deteriorated bridge elements - WSDOT performs major preservation repairs by addressing specific bridge elements to improve a bridge with a low condition rating. The most common types of repairs include floating bridge anchor cable replacement, expansion joint replacement and concrete column repair.
2. Repainting steel bridges - A protective paint coating on a steel bridge is essential to prevent corrosion, extend the bridge’s service life and keep the bridge in fair or better condition. Continuing to keep up with painting can prevent the number of bridges in poor condition from increasing.
3. Repairing concrete bridge decks - WSDOT is working to reduce the number of bridges classified as structurally deficient by addressing bridges with the highest benefits and the most cost savings. One strategy is to repair and rehabilitate concrete bridge decks to extend their service life.
Percent of bridges on the NHS that are structurally deficient (by deck area)
WSDOT owned 9.2%
Locally owned 10.0%
Combined 9.3%
17.8 millionsquare feet
of deck area
50% GOOD
43% FAIR
7% POOR
Data source: WSDOT Local Programs Office.
Note: This graph shows conditions forall locally owned bridges, both on and off the NHS.
Fair or better locally owned bridge deck remains at 93%Local agency bridge conditions for 2016
GNB Edition 62 - June 30, 2016 | 7Strategic goal: Preservation – Bridges
Bridge Program call for projects will occur in late fall 2016, and eligible projects selected by the program will be awarded funds in fall 2017. The WSDOT-funded Local Federal Bridge Program aims to preserve and improve the conditions of city and county bridges that are physically deteriorated or structurally deficient through bridge replacements, bridge rehabilitation and preservation methods (such as scour repair, paint for steel structures, seismic retrofit, deck overlays and joint replacement).
Cities and counties are responsible for managing local bridges and are held to the same standards as WSDOT. Federal, state and local funding sources continue to help local agencies build new or maintain existing bridges.
Washington’s bridge inventory grows by 98 structuresThe WSDOT-owned bridge inventory includes 3,865 structures as of June 2016, with 53.5 million square feet of deck area. The inventory includes WSDOT-owned bridges, structures less than 20 feet long and structures not open to vehicular traffic (see table at right). The replacement value of all bridges on the state highway system is estimated to be nearly $51 billion.
Additionally, there are 5,929 locally owned bridge structures in Washington as of June 2016, an increase of 82 structures from June 2015. Vehicular bridges longer than 20 feet account for 68% of the local bridge inventory, and total 17.8 million square feet of statewide deck area.
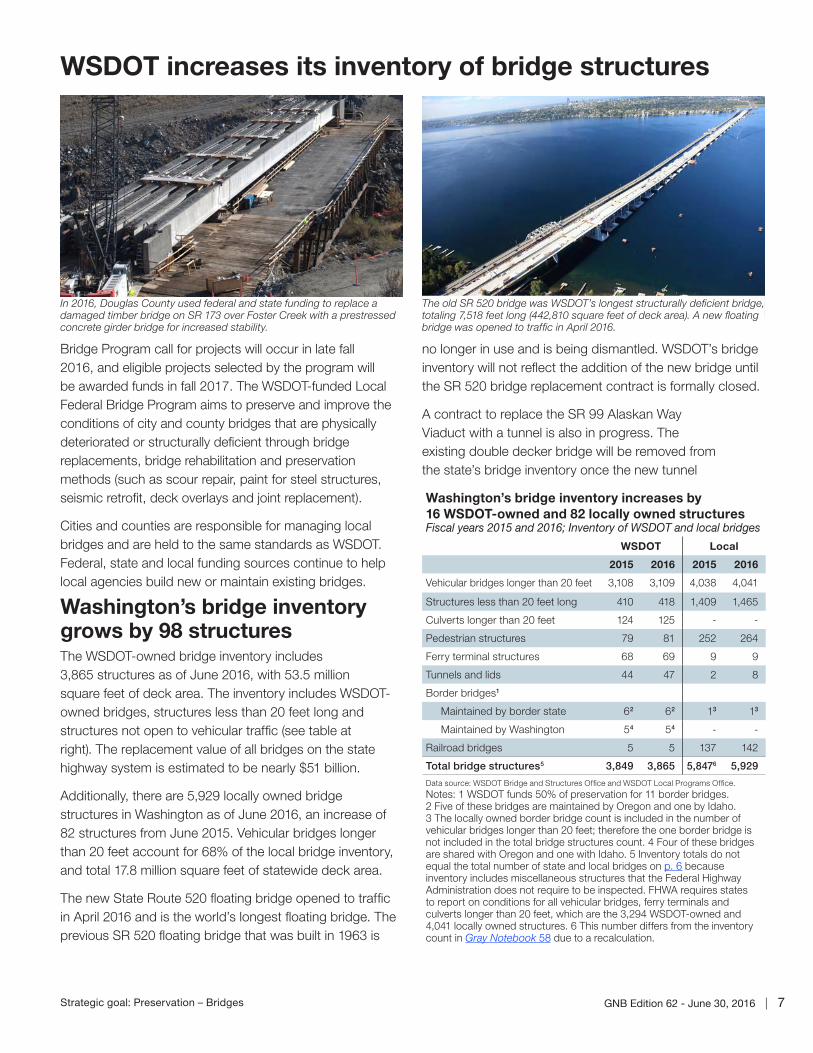
The new State Route 520 floating bridge opened to traffic in April 2016 and is the world’s longest floating bridge. The previous SR 520 floating bridge that was built in 1963 is
WSDOT increases its inventory of bridge structures
no longer in use and is being dismantled. WSDOT’s bridge inventory will not reflect the addition of the new bridge until the SR 520 bridge replacement contract is formally closed.
A contract to replace the SR 99 Alaskan Way Viaduct with a tunnel is also in progress. The existing double decker bridge will be removed from the state’s bridge inventory once the new tunnel
The old SR 520 bridge was WSDOT’s longest structurally deficient bridge, totaling 7,518 feet long (442,810 square feet of deck area). A new floating bridge was opened to traffic in April 2016.
Washington’s bridge inventory increases by 16 WSDOT-owned and 82 locally owned structures Fiscal years 2015 and 2016; Inventory of WSDOT and local bridges
WSDOT Local
2015 2016 2015 2016
Vehicular bridges longer than 20 feet 3,108 3,109 4,038 4,041
Structures less than 20 feet long 410 418 1,409 1,465
Culverts longer than 20 feet 124 125 - -
Pedestrian structures 79 81 252 264
Ferry terminal structures 68 69 9 9
Tunnels and lids 44 47 2 8
Border bridges1
Maintained by border state 62 62 13 13
Maintained by Washington 54 54 - -
Railroad bridges 5 5 137 142
Total bridge structures5 3,849 3,865 5,8476 5,929
Data source: WSDOT Bridge and Structures Office and WSDOT Local Programs Office.
Notes: 1 WSDOT funds 50% of preservation for 11 border bridges. 2 Five of these bridges are maintained by Oregon and one by Idaho. 3 The locally owned border bridge count is included in the number of vehicular bridges longer than 20 feet; therefore the one border bridge is not included in the total bridge structures count. 4 Four of these bridges are shared with Oregon and one with Idaho. 5 Inventory totals do not equal the total number of state and local bridges on p. 6 because inventory includes miscellaneous structures that the Federal Highway Administration does not require to be inspected. FHWA requires states to report on conditions for all vehicular bridges, ferry terminals and culverts longer than 20 feet, which are the 3,294 WSDOT-owned and 4,041 locally owned structures. 6 This number differs from the inventory count in Gray Notebook 58 due to a recalculation.
In 2016, Douglas County used federal and state funding to replace a damaged timber bridge on SR 173 over Foster Creek with a prestressed concrete girder bridge for increased stability.
8 | GNB Edition 62 - June 30, 2016 Strategic goal: Preservation – Bridges
and meet defined FHWA criteria are inspected on a four-year cycle. WSDOT performs federally required inspections on all WSDOT-owned bridges as outlined in the National Bridge Inspection Standards to determine bridge conditions, maintain bridge safety, and identify preservation and maintenance needs.
Local agencies performed 2,356 bridge inspections in FY2016, 96% (2,264) of which were routine. In addition, they conducted 55 inspections on fracture critical structures (bridges that contain support pieces or members that are under tension, where failure would likely cause a portion of or the entire bridge to collapse) and 29 underwater inspections. Local agencies follow the same federal guidance for inspections as the state. Even though most local governments inspect their own bridges, WSDOT conducts field reviews and provides training and technical assistance to Washington cities and counties for inspecting bridges on local roads.
Under Bridge Inspection Trucks are vital for inspections and maintenanceWSDOT owns six Under Bridge Inspection Trucks with four used to conduct bridge inspections and one used for bridge maintenance activities such as annual steel bridge cleaning. WSDOT is currently refurbishing the sixth UBIT that will be used by the Eastern Region for bridge maintenance. A cost comparison analysis conducted by WSDOT found that refurbishing a UBIT in its fleet is a better value than purchasing a new vehicle.
UBIT operation requires one truck driver and two bridge
WSDOT performs 1,584 routine bridge inspectionsFiscal year 2016; Number of inspections by type
Type of inspection Number
WSDOT routine bridge inspections 1,584
WSDOT Under Bridge Inspection Truck bridge inspections
204
Special bridge inspections1 46
WSDOT local agency inspections 60
Underwater bridge inspections 65
Mechanical and electrical inspections 48
WSDOT routine ferry terminal inspections 21
Fracture critical ferry terminal inspections 12
Total WSDOT bridge inspections 2,040
Data source: WSDOT Bridge and Structures Office.
Notes: These inspections are for WSDOT-owned bridges only. FHWA requires inspections on vehicular bridges longer than 20 feet. WSDOT performs inspections on all structures included in the inventory on p. 7, but only reports on the inspections required by FHWA. 1 These are discretionary and based on known or suspected deficiencies.
WSDOT maintains six bridges 100 years or olderopens to traffic and the bridge can be removed.
Currently, six WSDOT-owned bridges and 117 locally owned bridges are 100 years or older. Five of the WSDOT-owned bridges are concrete earth-filled arches, which use concrete walls to retain the roadway fill—in most cases, earth—in an arch design with an asphalt overlay. These arch bridges, common in the early 1900s, were originally built to last about 50 years, but with continued inspection and maintenance they can remain in service for longer depending on the bridge material condition. Five out of the six WSDOT-owned bridges over 100 years are currently in fair or better condition.
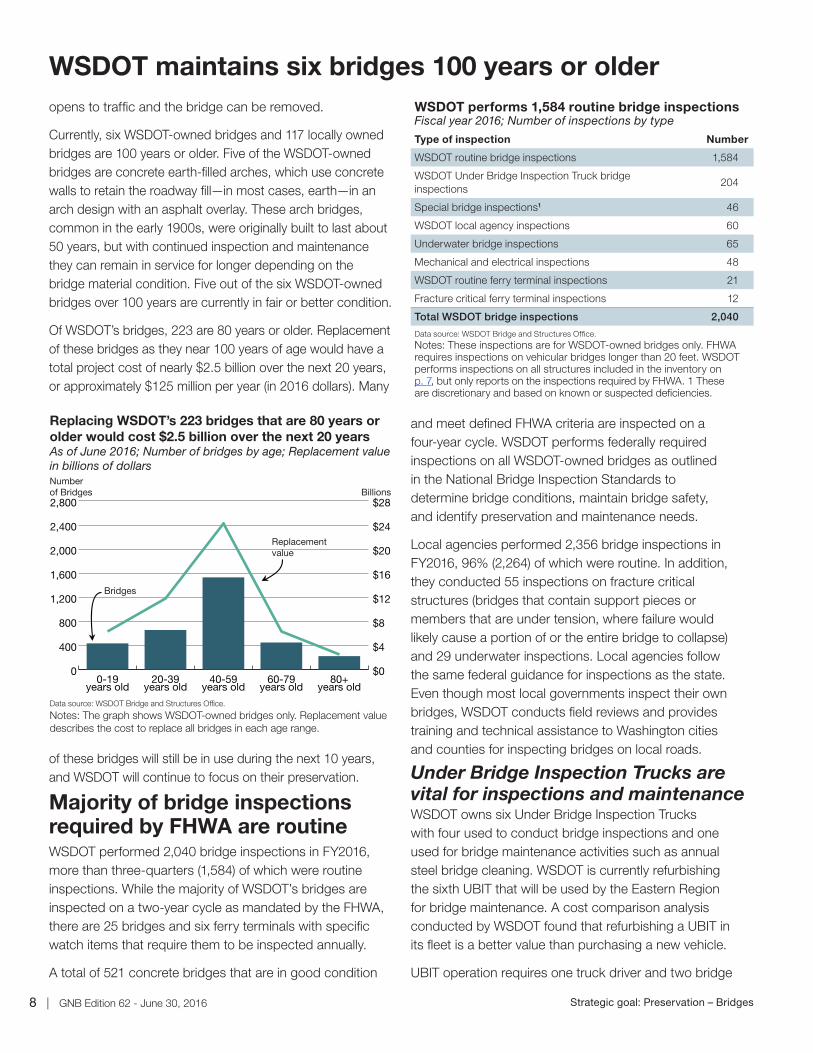
Of WSDOT’s bridges, 223 are 80 years or older. Replacement of these bridges as they near 100 years of age would have a total project cost of nearly $2.5 billion over the next 20 years, or approximately $125 million per year (in 2016 dollars). Many
of these bridges will still be in use during the next 10 years, and WSDOT will continue to focus on their preservation.
Majority of bridge inspections required by FHWA are routineWSDOT performed 2,040 bridge inspections in FY2016, more than three-quarters (1,584) of which were routine inspections. While the majority of WSDOT’s bridges are inspected on a two-year cycle as mandated by the FHWA, there are 25 bridges and six ferry terminals with specific watch items that require them to be inspected annually.
A total of 521 concrete bridges that are in good condition
Replacing WSDOT’s 223 bridges that are 80 years or older would cost $2.5 billion over the next 20 yearsAs of June 2016; Number of bridges by age; Replacement valuein billions of dollars
Data source: WSDOT Bridge and Structures Office.
Notes: The graph shows WSDOT-owned bridges only. Replacement value describes the cost to replace all bridges in each age range.
0
400
800
1,200
1,600
2,000
2,400
2,800
$0
$4
$8
$12
$16
$20
$24
$28
80+years old
60-79years old
40-59years old
20-39years old
0-19years old
Bridges
Replacementvalue
Numberof Bridges Billions
GNB Edition 62 - June 30, 2016 | 9Strategic goal: Preservation – Bridges
lower. If load rating evaluation results show the structure cannot safely carry certain loads because of when it was built or bridge deterioration or damage, WSDOT implements weight restrictions to reduce the risk of further damage and ensure bridges are safe to the traveling public.
A bridge may first be “load restricted,” making it illegal for any overloaded truck to use the bridge. If the condition worsens and the bridge’s capacity to carry heavy loads decreases, then the bridge will be “load posted.” This limits the allowable weight of trucks to below typical legal weights. Preservation activities are required to correct load restricted or posted bridges.
WSDOT identifies potential risks affecting bridge service lifeThe federal MAP-21 legislation requires states to develop a risk-based asset management plan for the National Highway System within their boundaries. The plan outlines risk management techniques to improve or preserve the condition of assets and performance of the NHS (see box above).
Risk management is the systematic process used to identify risks, analyze consequences and develop treatment strategies. WSDOT encounters several types of risks related to preserving the bridge inventory such as deterioration, scour of foundations, earthquakes and over-height trucks. Each of these risks must be evaluated and preservation strategies must be determined for inclusion in the asset management plan.
Deterioration—the primary risk—is a natural occurrence that is determined by the material, design type, and the amount of maintenance and preservation received over the service life of the bridge. Most bridges are preserved
Number of load restricted and posted bridges increase
inspectors or maintenance personnel stationed in the truck’s bucket. One employee operates the movement of the bucket while the second employee performs the inspection or maintenance work. Operation of the UBIT must be done in daylight hours to ensure employee safety.
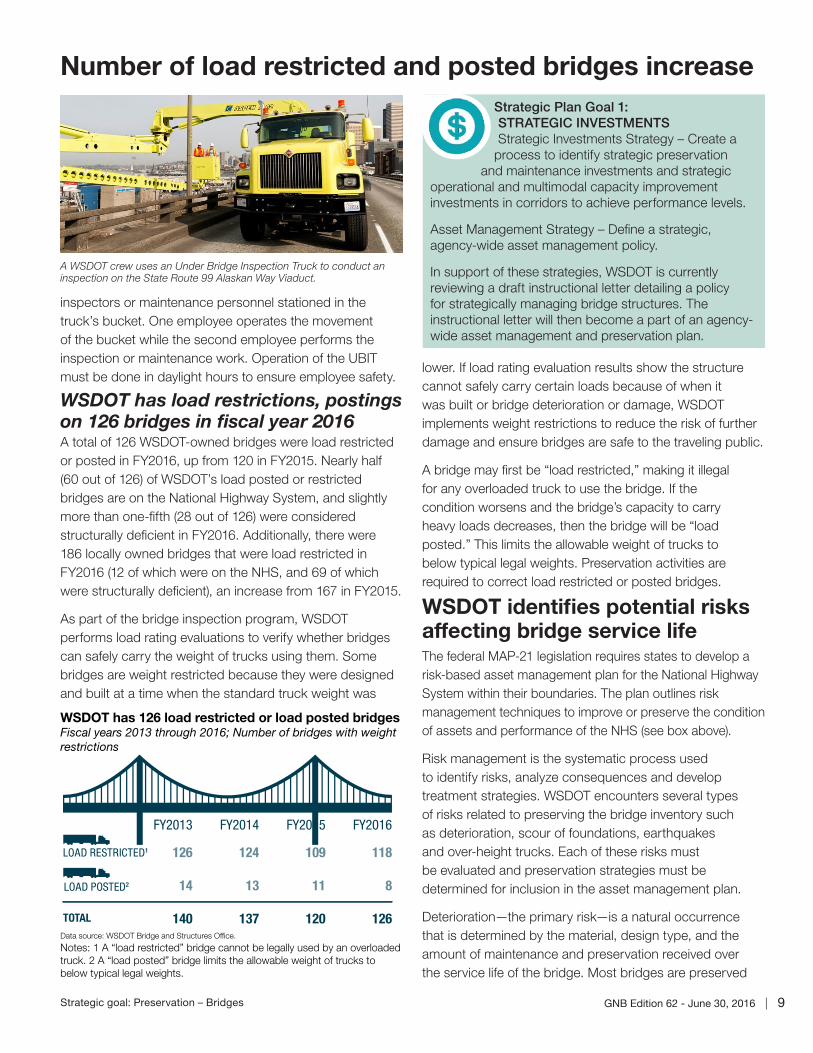
WSDOT has load restrictions, postings on 126 bridges in fiscal year 2016A total of 126 WSDOT-owned bridges were load restricted or posted in FY2016, up from 120 in FY2015. Nearly half (60 out of 126) of WSDOT’s load posted or restricted bridges are on the National Highway System, and slightly more than one-fifth (28 out of 126) were considered structurally deficient in FY2016. Additionally, there were 186 locally owned bridges that were load restricted in FY2016 (12 of which were on the NHS, and 69 of which were structurally deficient), an increase from 167 in FY2015.
As part of the bridge inspection program, WSDOT performs load rating evaluations to verify whether bridges can safely carry the weight of trucks using them. Some bridges are weight restricted because they were designed and built at a time when the standard truck weight was
FY2014
124
13
137
FY2015
109
11
120
FY2016
118
8
126
FY2013
126
14
140
LOAD POSTED2
LOAD RESTRICTED1
Data source: WSDOT Bridge and Structures Office.
Notes: 1 A “load restricted” bridge cannot be legally used by an overloadedtruck. 2 A “load posted” bridge limits the allowable weight of trucks to below typical legal weights.
TOTAL
WSDOT has 126 load restricted or load posted bridgesFiscal years 2013 through 2016; Number of bridges with weightrestrictions
A WSDOT crew uses an Under Bridge Inspection Truck to conduct an inspection on the State Route 99 Alaskan Way Viaduct.
Strategic Plan Goal 1: STRATEGIC INVESTMENTSStrategic Investments Strategy – Create a
process to identify strategic preservation and maintenance investments and strategic
operational and multimodal capacity improvement investments in corridors to achieve performance levels.
Asset Management Strategy – Define a strategic, agency-wide asset management policy.
In support of these strategies, WSDOT is currently reviewing a draft instructional letter detailing a policy for strategically managing bridge structures. The instructional letter will then become a part of an agency-wide asset management and preservation plan.
10 | GNB Edition 62 - June 30, 2016 Strategic goal: Preservation – Bridges
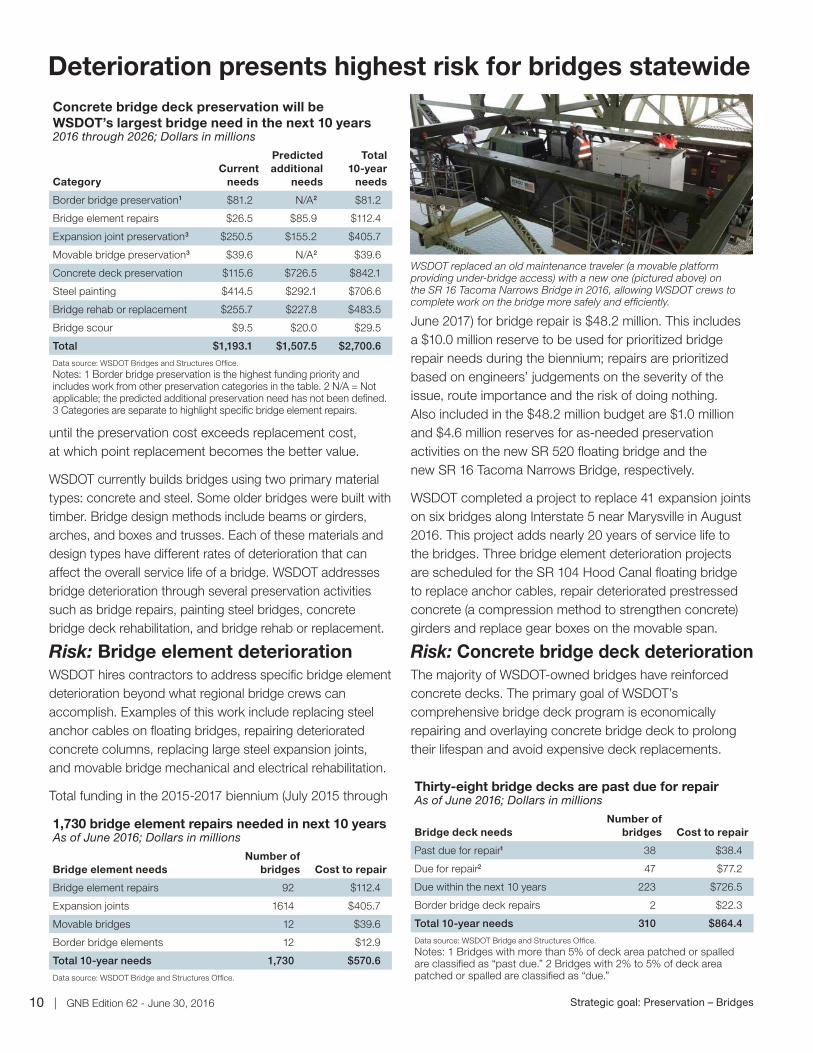
June 2017) for bridge repair is $48.2 million. This includes a $10.0 million reserve to be used for prioritized bridge repair needs during the biennium; repairs are prioritized based on engineers’ judgements on the severity of the issue, route importance and the risk of doing nothing. Also included in the $48.2 million budget are $1.0 million and $4.6 million reserves for as-needed preservation activities on the new SR 520 floating bridge and the new SR 16 Tacoma Narrows Bridge, respectively.
WSDOT completed a project to replace 41 expansion joints on six bridges along Interstate 5 near Marysville in August 2016. This project adds nearly 20 years of service life to the bridges. Three bridge element deterioration projects are scheduled for the SR 104 Hood Canal floating bridge to replace anchor cables, repair deteriorated prestressed concrete (a compression method to strengthen concrete) girders and replace gear boxes on the movable span.
Risk: Concrete bridge deck deteriorationThe majority of WSDOT-owned bridges have reinforced concrete decks. The primary goal of WSDOT’s comprehensive bridge deck program is economically repairing and overlaying concrete bridge deck to prolong their lifespan and avoid expensive deck replacements.
Deterioration presents highest risk for bridges statewide
until the preservation cost exceeds replacement cost, at which point replacement becomes the better value.
WSDOT currently builds bridges using two primary material types: concrete and steel. Some older bridges were built with timber. Bridge design methods include beams or girders, arches, and boxes and trusses. Each of these materials and design types have different rates of deterioration that can affect the overall service life of a bridge. WSDOT addresses bridge deterioration through several preservation activities such as bridge repairs, painting steel bridges, concrete bridge deck rehabilitation, and bridge rehab or replacement.
Risk: Bridge element deteriorationWSDOT hires contractors to address specific bridge element deterioration beyond what regional bridge crews can accomplish. Examples of this work include replacing steel anchor cables on floating bridges, repairing deteriorated concrete columns, replacing large steel expansion joints, and movable bridge mechanical and electrical rehabilitation.
Total funding in the 2015-2017 biennium (July 2015 through Thirty-eight bridge decks are past due for repairAs of June 2016; Dollars in millions
Bridge deck needsNumber of
bridges Cost to repair
Past due for repair1 38 $38.4
Due for repair2 47 $77.2
Due within the next 10 years 223 $726.5
Border bridge deck repairs 2 $22.3
Total 10-year needs 310 $864.4
Data source: WSDOT Bridge and Structures Office.
Notes: 1 Bridges with more than 5% of deck area patched or spalled are classified as “past due.” 2 Bridges with 2% to 5% of deck area patched or spalled are classified as “due.”
WSDOT replaced an old maintenance traveler (a movable platform providing under-bridge access) with a new one (pictured above) on the SR 16 Tacoma Narrows Bridge in 2016, allowing WSDOT crews to complete work on the bridge more safely and efficiently.
Concrete bridge deck preservation will be WSDOT’s largest bridge need in the next 10 years2016 through 2026; Dollars in millions
CategoryCurrent
needs
Predicted additional
needs
Total 10-year
needs
Border bridge preservation1 $81.2 N/A2 $81.2
Bridge element repairs $26.5 $85.9 $112.4
Expansion joint preservation3 $250.5 $155.2 $405.7
Movable bridge preservation3 $39.6 N/A2 $39.6
Concrete deck preservation $115.6 $726.5 $842.1
Steel painting $414.5 $292.1 $706.6
Bridge rehab or replacement $255.7 $227.8 $483.5
Bridge scour $9.5 $20.0 $29.5
Total $1,193.1 $1,507.5 $2,700.6
Data source: WSDOT Bridges and Structures Office.
Notes: 1 Border bridge preservation is the highest funding priority and includes work from other preservation categories in the table. 2 N/A = Not applicable; the predicted additional preservation need has not been defined. 3 Categories are separate to highlight specific bridge element repairs.
1,730 bridge element repairs needed in next 10 yearsAs of June 2016; Dollars in millions
Bridge element needsNumber of
bridges Cost to repair
Bridge element repairs 92 $112.4
Expansion joints 1614 $405.7
Movable bridges 12 $39.6
Border bridge elements 12 $12.9
Total 10-year needs 1,730 $570.6
Data source: WSDOT Bridge and Structures Office.
GNB Edition 62 - June 30, 2016 | 11Strategic goal: Preservation – Bridges
WSDOT manages 16 bridges that need replacing
three additional projects under contract. The total planned biennial funding for steel bridge painting is $45.3 million.
Bridges are prioritized for repainting based on the amount of corrosion and the route on which they are located. Bridges on primary freight routes and those leading to islands are given top priority. Steel truss bridges require repainting every 20 to 25 years on average and steel girder bridges require painting every 30 to 40 years on average. WSDOT will need to repaint 182 of its 311 steel bridges within the next 10 years (see table above).
Painting steel bridges is the best economic decision based on the lowest lifecycle cost. A full paint removal and repainting project is approximately 20-25% of the cost to replace a bridge and provides an additional 20 to 25 years of service life.
Risk: Deterioration requiring bridge rehabilitation or replacementWSDOT currently manages 16 bridges that are structurally deficient and require replacement (excluding the SR 99 Alaskan Way Viaduct bridge as it has an active replacement contract). An additional 16 structurally deficient bridges have been identified as needing rehabilitation (a
When funding becomes available, WSDOT hires contractors to perform deck repairs and add a protective overlay, normally a 1.5-inch thick layer of modified concrete. A full bridge deck rehabilitation and concrete overlay extends the bridge’s service life by at least 25 to 30 years and is more cost-effective than replacing the entire deck or bridge for bridge decks that have repeat deterioration.
Using the modified concrete overlay method, WSDOT has extended the service life of 343 bridge decks (8.2 million square feet) by at least 25 years. As a result of WSDOT utilizing this overlay method as a bridge deck preservation strategy, only 14 total deck replacements have been necessary to date. WSDOT has identified another 198 overlays (6.5 million square feet) that are predicted to need replacing during the next 10 years.
Once the reinforcing steel in concrete bridge decks starts to corrode (for example, due to winter weather or the use of deicing salt), the concrete starts to “spall” (pothole) and deteriorate. WSDOT crews repair spalled areas annually, but these repairs are considered to be temporary and typically last one to three years. Once the total area of repairs and/or patching exceed 2% of the total deck area, the bridge is added to the list of future needs and classified as structurally deficient. Bridge deck overlay projects are prioritized based on the total square footage of deterioration and the type of freight route (see GNB 62, p. 40) on which the bridge is located. Bridges on the most vital freight routes and those leading to islands get higher priority.
WSDOT has one concrete overlay project under contract out of the 16 statewide projects planned to be completed or under contract in the 2015-2017 biennium. WSDOT plans to spend $4.1 million for concrete bridge deck overlays during the biennium. Additionally, a six-year preservation funding plan includes $84.1 million for concrete bridge deck rehabilitation and overlay.
Risk: Steel bridge deteriorationWSDOT preserves steel bridges on state highways by painting them as needed to protect the steel elements against premature corrosion. WSDOT currently maintains 311 steel bridges and eight steel border bridges that require painting on a regular basis. Though WSDOT does not directly manage all eight of the steel border bridges, painting costs are shared equally between the bordering states. WSDOT has completed six painting projects on steel bridges in the 2015-2017 biennium, with
WSDOT determines a need of $742 million to fully fund its 10-year steel bridge painting planAs of June 2016; Dollars in millions
Painting needsNumber of
bridgesCost to
paint
Past due for painting1 39 $163.2
Due for painting2 70 $251.3
Due within the next 10 years 70 $292.1
Border bridge painting 3 $36.0
10-year total need 182 $742.6
Data source: WSDOT Bridge and Structures Office.
Notes: 1 Steel bridges with more than 5% of steel exposed are classified as “past due for painting.” 2 Steel bridges with 2% to 5% of steel exposed are classified as “due for painting.”
WSDOT currently needs to replace 16 bridgesAs of June 2016; Dollars in millions
Bridge needsNumber of
bridgesCost to replace
Current replacement need 16 $148.1
Current rehabilitation need 16 $107.6
Replacement/rehabilitation need within the next 10 years
60
$227.8
Border bridge replacement/rehabilitation need 1 $10.0
10-year total need 93 $493.5
Data source: WSDOT Bridge and Structures Office.
12 | GNB Edition 62 - June 30, 2016 Strategic goal: Preservation – Bridges
Three bridges to be repaired after impact damages
three bridges: the I-5 northbound bridge over 41st Division Drive near Joint Base Lewis-McChord, the I-5/Birch Bay Road undercrossing in Custer and the I-90 eastbound bridge over Front Street in Issaquah.
Three bridges are currently under design to be repaired:
�SR 121/93rd Ave. bridge – A northbound truck impacted the bridge in 2015. Bridge engineers determined the damaged girder needs replacement. Work is scheduled to be completed in 2017.
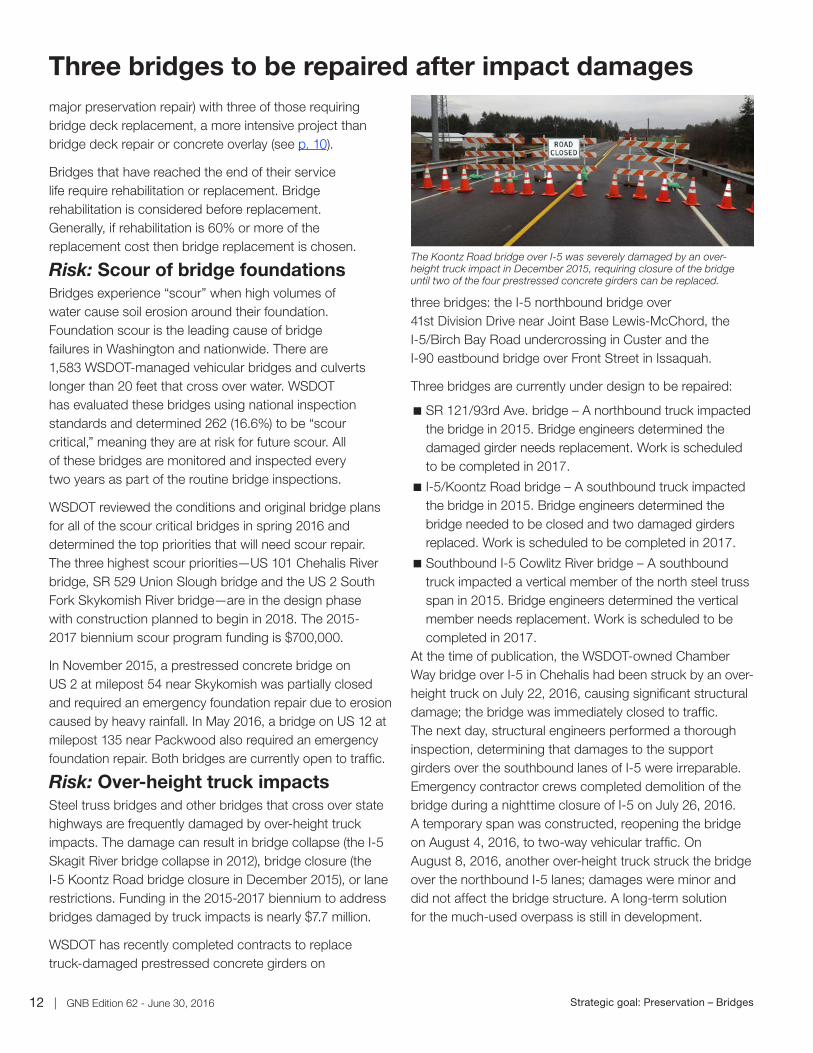
� I-5/Koontz Road bridge – A southbound truck impacted the bridge in 2015. Bridge engineers determined the bridge needed to be closed and two damaged girders replaced. Work is scheduled to be completed in 2017.
�Southbound I-5 Cowlitz River bridge – A southbound truck impacted a vertical member of the north steel truss span in 2015. Bridge engineers determined the vertical member needs replacement. Work is scheduled to be completed in 2017.
At the time of publication, the WSDOT-owned Chamber Way bridge over I-5 in Chehalis had been struck by an over-height truck on July 22, 2016, causing significant structural damage; the bridge was immediately closed to traffic. The next day, structural engineers performed a thorough inspection, determining that damages to the support girders over the southbound lanes of I-5 were irreparable. Emergency contractor crews completed demolition of the bridge during a nighttime closure of I-5 on July 26, 2016. A temporary span was constructed, reopening the bridge on August 4, 2016, to two-way vehicular traffic. On August 8, 2016, another over-height truck struck the bridge over the northbound I-5 lanes; damages were minor and did not affect the bridge structure. A long-term solution for the much-used overpass is still in development.
major preservation repair) with three of those requiring bridge deck replacement, a more intensive project than bridge deck repair or concrete overlay (see p. 10).
Bridges that have reached the end of their service life require rehabilitation or replacement. Bridge rehabilitation is considered before replacement. Generally, if rehabilitation is 60% or more of the replacement cost then bridge replacement is chosen.
Risk: Scour of bridge foundationsBridges experience “scour” when high volumes of water cause soil erosion around their foundation. Foundation scour is the leading cause of bridge failures in Washington and nationwide. There are 1,583 WSDOT-managed vehicular bridges and culverts longer than 20 feet that cross over water. WSDOT has evaluated these bridges using national inspection standards and determined 262 (16.6%) to be “scour critical,” meaning they are at risk for future scour. All of these bridges are monitored and inspected every two years as part of the routine bridge inspections.
WSDOT reviewed the conditions and original bridge plans for all of the scour critical bridges in spring 2016 and determined the top priorities that will need scour repair. The three highest scour priorities—US 101 Chehalis River bridge, SR 529 Union Slough bridge and the US 2 South Fork Skykomish River bridge—are in the design phase with construction planned to begin in 2018. The 2015-2017 biennium scour program funding is $700,000.
In November 2015, a prestressed concrete bridge on US 2 at milepost 54 near Skykomish was partially closed and required an emergency foundation repair due to erosion caused by heavy rainfall. In May 2016, a bridge on US 12 at milepost 135 near Packwood also required an emergency foundation repair. Both bridges are currently open to traffic.
Risk: Over-height truck impactsSteel truss bridges and other bridges that cross over state highways are frequently damaged by over-height truck impacts. The damage can result in bridge collapse (the I-5 Skagit River bridge collapse in 2012), bridge closure (the I-5 Koontz Road bridge closure in December 2015), or lane restrictions. Funding in the 2015-2017 biennium to address bridges damaged by truck impacts is nearly $7.7 million.
WSDOT has recently completed contracts to replace truck-damaged prestressed concrete girders on
The Koontz Road bridge over I-5 was severely damaged by an over-height truck impact in December 2015, requiring closure of the bridge until two of the four prestressed concrete girders can be replaced.
GNB Edition 62 - June 30, 2016 | 13Strategic goal: Preservation – Bridges
Risk: EarthquakesWashington state bridges are at risk of earthquake damage, and risk is highest for those bridges west of the Cascade Mountains. WSDOT participated with federal agencies, California and Oregon during the “Cascadia Rising” earthquake drill in June 2016 which assumed a 9.0 magnitude earthquake along the Cascadia Subduction Zone along with a potential tsunami. Lessons learned from this drill will help agencies better understand how they will be able to respond to a major seismic event.
New bridges are designed based on current seismic design standards. Bridges may sustain some damage in large earthquakes, but should not collapse, and would need to be repaired following an extreme event like the Cascadia
Connecting Washington aids in bridge preservation
Connecting Washington addresses bridge preservation needs
As part of the $16 billion Connecting Washington transportation revenue package, $1.2 billion is allocated to state highway preservation, which includes maintaining pavement, bridges and traffic operations. WSDOT is working to identify bridge preservation projects as part of this investment. Three specific bridge projects identified by the Legislature will be addressed in the next six years:
�SR 241 Yakima River bridge near Mabton – $12 million
�US 12 Wildcat Creek bridge near White Pass – $12 million
�SR 107 Chehalis River bridge near Montesano – $12.5 million
In addition to the $1.2 billion, another $57.5 million from Connecting Washington is allocated to bridge preservation and repair projects over the next 16 years. No specific projects have been identified as part of this investment.
Connecting Washington funding will not clear WSDOT’s list of structurally deficient bridges. Structurally deficient does not mean that the bridge is unsafe or needs to be replaced; it generally indicates that one or more of the bridge components requires either repair or preservation. In delivering preservation strategies using a lowest lifecycle cost approach, there will continue to be bridge components that need to be addressed.
Connecting Washington will help address the most critical needs for bridges. In particular, it will help eliminate most of the weight restrictions on many of the deficient bridges and help prevent new weight restrictions from being imposed.
$A closer look at MAP-21, Results Washington and GASB bridge condition requirementsThe federal Moving Ahead for Progress in the 21st Century legislation (see Gray Notebook 64, p. 7) requires that states have no more than 10% of bridge deck area classified as structurally deficient (poor condition) on the National Highway System. States failing to meet this target for three consecutive years must devote a portion of National Highway Performance Program funds to improve bridge conditions. The Results Washington goal mirrors this federal requirement (see Gray Notebook 64, p. 9 for more on Results Washington; see Gray Notebook 64, p. 7 for the progress toward this goal).
WSDOT also follows infrastructure asset reporting policies adopted by the state from the Governmental Accounting Standards Board, which establishes reporting standards for state and local governments that follow Generally Accepted Accounting Principles. For GASB reporting, WSDOT has set a condition goal of 90% of WSDOT-owned bridge deck area in fair or better condition. WSDOT is required to maintain an inventory of assets, document asset conditions, and estimate the annual preservation costs needed to
Bridge condition reporting requirementsCondition targets by performance reporting system
Reporting system Target Included bridges
Moving Ahead for Progress in the 21st Century
<10% of deck area on structurally deficient (poor condition) bridges
All NHS bridges (WSDOT- and locally owned)
Results Washington<10% of deck area on structurally deficient (poor condition) bridges
All NHS bridges (WSDOT- and locally owned)
Governmental Accounting Standards Board
>90% of bridge deck area in fair or better condition
All WSDOT-owned bridges (NHS and non-NHS)
Data source: WSDOT Office of Strategic Assessment and Performance Analysis.
Note: NHS = National Highway System.
Rising earthquake simulation. WSDOT has coordinated with the state Department of Emergency Management and others to identify key routes (such as I-5 from JBLM to the I-405/SR 518 interchange, I-405 and I-90) determined to be critical to have open following a seismic event to help move emergency vehicles, goods and supplies for the response.
WSDOT has addressed bridge seismic retrofit needs for the past two decades, including identifying and retrofitting all or part of more than 400 bridges. WSDOT has invested nearly $195 million since 1991 to strengthen bridges to better withstand earthquakes in Washington.
14 | GNB Edition 64 – December 31, 2016 Strategic goal: Preservation – Pavement
Asset Management: Pavement Annual Report64 Asset Management:
Pavement Annual Report 64
(see p. 17 for details), which enable the agency to improve system performance at the least cost.
The agency evaluates the condition of asphalt and concrete pavement on state-managed roadways annually using three indicators:
�Surface cracking (an indicator of structural deterioration);
�Rutting (which is monitored for safety and structural reasons); and,
�Smoothness (measured using the International Roughness Index).
These criteria are used to classify pavement conditions into five categories: very good, good, fair, poor and very poor.
The categories very good, good and fair show pavement conditions that are considered adequate. Pavement
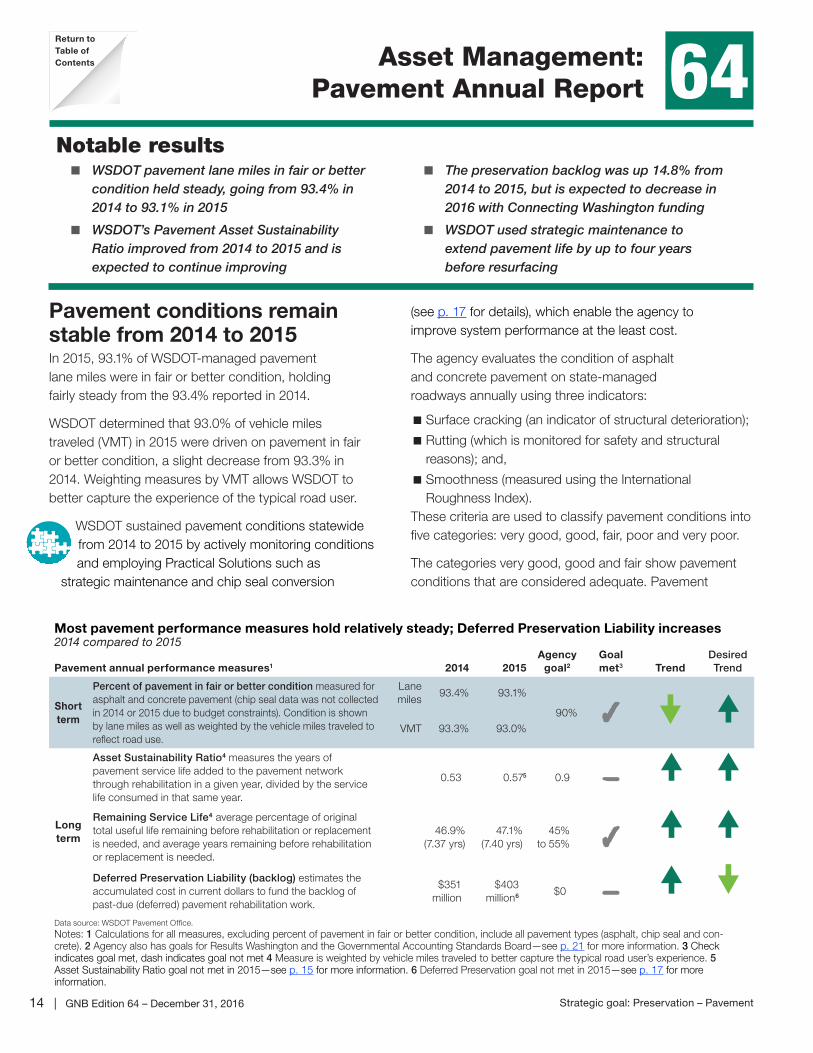
Pavement conditions remain stable from 2014 to 2015In 2015, 93.1% of WSDOT-managed pavement lane miles were in fair or better condition, holding fairly steady from the 93.4% reported in 2014.
WSDOT determined that 93.0% of vehicle miles traveled (VMT) in 2015 were driven on pavement in fair or better condition, a slight decrease from 93.3% in 2014. Weighting measures by VMT allows WSDOT to better capture the experience of the typical road user.
WSDOT sustained pavement conditions statewide from 2014 to 2015 by actively monitoring conditions and employing Practical Solutions such as
strategic maintenance and chip seal conversion
Notable results � WSDOT pavement lane miles in fair or better
condition held steady, going from 93.4% in 2014 to 93.1% in 2015
� WSDOT’s Pavement Asset Sustainability Ratio improved from 2014 to 2015 and is expected to continue improving
� The preservation backlog was up 14.8% from 2014 to 2015, but is expected to decrease in 2016 with Connecting Washington funding
� WSDOT used strategic maintenance to extend pavement life by up to four years before resurfacing
Most pavement performance measures hold relatively steady; Deferred Preservation Liability increases2014 compared to 2015
Pavement annual performance measures1 2014 2015Agency
goal2
Goal met3 Trend
Desired Trend
Short term
Percent of pavement in fair or better condition measured for asphalt and concrete pavement (chip seal data was not collected in 2014 or 2015 due to budget constraints). Condition is shown by lane miles as well as weighted by the vehicle miles traveled to reflect road use.
Lane miles
93.4% 93.1%
90%
VMT 93.3% 93.0%
Long term
Asset Sustainability Ratio4 measures the years of pavement service life added to the pavement network through rehabilitation in a given year, divided by the service life consumed in that same year.
0.53 0.575 0.9
Remaining Service Life4 average percentage of original total useful life remaining before rehabilitation or replacement is needed, and average years remaining before rehabilitation or replacement is needed.
46.9%(7.37 yrs)
47.1% (7.40 yrs)
45% to 55%
Deferred Preservation Liability (backlog) estimates the accumulated cost in current dollars to fund the backlog of past-due (deferred) pavement rehabilitation work.
$351 million
$403 million6 $0
Data source: WSDOT Pavement Office.
Notes: 1 Calculations for all measures, excluding percent of pavement in fair or better condition, include all pavement types (asphalt, chip seal and con-crete). 2 Agency also has goals for Results Washington and the Governmental Accounting Standards Board—see p. 21 for more information. 3 Check indicates goal met, dash indicates goal not met 4 Measure is weighted by vehicle miles traveled to better capture the typical road user’s experience. 5 Asset Sustainability Ratio goal not met in 2015—see p. 15 for more information. 6 Deferred Preservation goal not met in 2015—see p. 17 for more information.
Return toTable of Contents
GNB Edition 64 – December 31, 2016 | 15Strategic goal: Preservation – Pavement
Connecting Washington improves pavement outlook
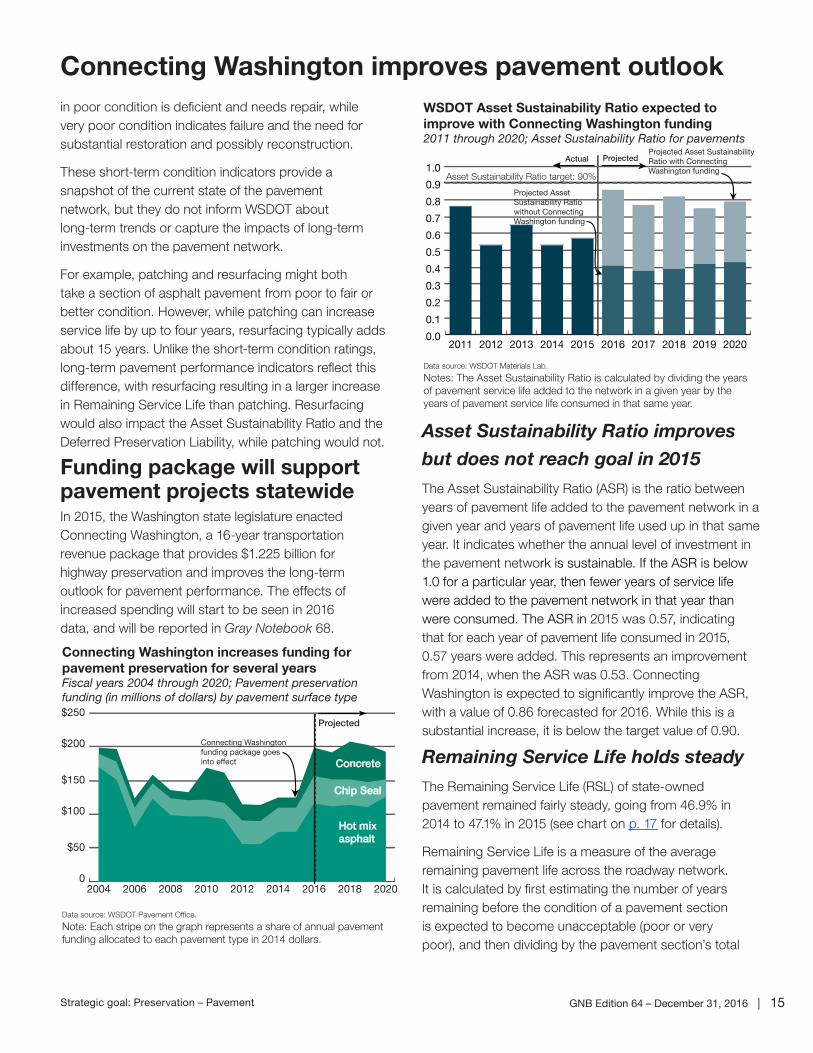
Asset Sustainability Ratio improves
but does not reach goal in 2015
The Asset Sustainability Ratio (ASR) is the ratio between years of pavement life added to the pavement network in a given year and years of pavement life used up in that same year. It indicates whether the annual level of investment in the pavement network is sustainable. If the ASR is below 1.0 for a particular year, then fewer years of service life were added to the pavement network in that year than were consumed. The ASR in 2015 was 0.57, indicating that for each year of pavement life consumed in 2015, 0.57 years were added. This represents an improvement from 2014, when the ASR was 0.53. Connecting Washington is expected to significantly improve the ASR, with a value of 0.86 forecasted for 2016. While this is a substantial increase, it is below the target value of 0.90.
Remaining Service Life holds steady
The Remaining Service Life (RSL) of state-owned pavement remained fairly steady, going from 46.9% in 2014 to 47.1% in 2015 (see chart on p. 17 for details).
Remaining Service Life is a measure of the average remaining pavement life across the roadway network. It is calculated by first estimating the number of years remaining before the condition of a pavement section is expected to become unacceptable (poor or very poor), and then dividing by the pavement section’s total
in poor condition is deficient and needs repair, while very poor condition indicates failure and the need for substantial restoration and possibly reconstruction.
These short-term condition indicators provide a snapshot of the current state of the pavement network, but they do not inform WSDOT about long-term trends or capture the impacts of long-term investments on the pavement network.
For example, patching and resurfacing might both take a section of asphalt pavement from poor to fair or better condition. However, while patching can increase service life by up to four years, resurfacing typically adds about 15 years. Unlike the short-term condition ratings, long-term pavement performance indicators reflect this difference, with resurfacing resulting in a larger increase in Remaining Service Life than patching. Resurfacing would also impact the Asset Sustainability Ratio and the Deferred Preservation Liability, while patching would not.
Funding package will support pavement projects statewideIn 2015, the Washington state legislature enacted Connecting Washington, a 16-year transportation revenue package that provides $1.225 billion for highway preservation and improves the long-term outlook for pavement performance. The effects of increased spending will start to be seen in 2016 data, and will be reported in Gray Notebook 68.
WSDOT Asset Sustainability Ratio expected to improve with Connecting Washington funding2011 through 2020; Asset Sustainability Ratio for pavements
Data source: WSDOT Materials Lab.
Notes: The Asset Sustainability Ratio is calculated by dividing the years of pavement service life added to the network in a given year by the years of pavement service life consumed in that same year.
0.0
0.1
0.2
0.3
0.4
0.5
0.6
0.7
0.8
0.9
1.0
2020201920182017201620152014201320122011
Asset Sustainability Ratio target: 90%
Projected Asset Sustainability Ratio without ConnectingWashington funding
Projected Asset SustainabilityRatio with Connecting Washington funding
ProjectedActual
Connecting Washington increases funding for pavement preservation for several yearsFiscal years 2004 through 2020; Pavement preservation funding (in millions of dollars) by pavement surface type
Data source: WSDOT Pavement Office.
Note: Each stripe on the graph represents a share of annual pavement funding allocated to each pavement type in 2014 dollars.
0
$50
$100
$150
$200
$250
202020182016201420122010200820062004
Concrete
Chip Seal
Hot mix asphalt
Projected
Connecting Washington funding package goes into effect
16 | GNB Edition 64 – December 31, 2016 Strategic goal: Preservation – Pavement
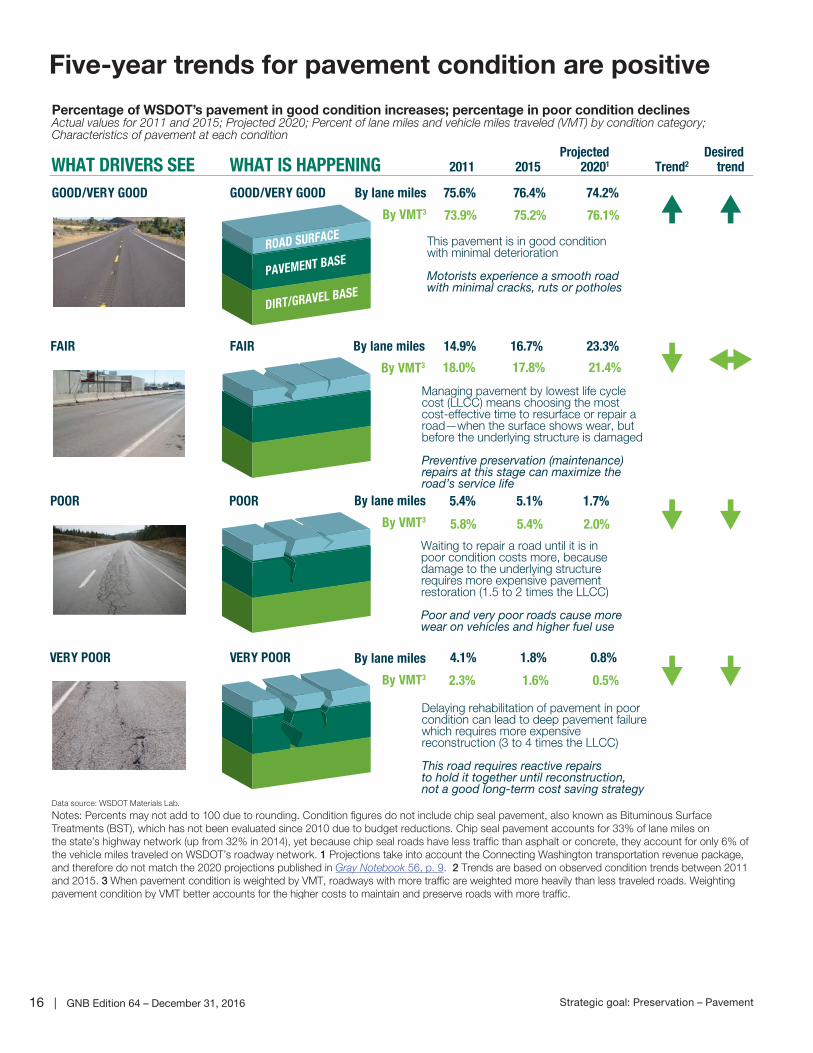
Five-year trends for pavement condition are positive
GOOD/VERY GOOD GOOD/VERY GOOD 75.6% 76.4% 74.2%
This pavement is in good conditionwith minimal deterioration
Motorists experience a smooth roadwith minimal cracks, ruts or potholes
Managing pavement by lowest life cycle cost (LLCC) means choosing the most cost-effective time to resurface or repair a road—when the surface shows wear, but before the underlying structure is damaged
Preventive preservation (maintenance) repairs at this stage can maximize the road’s service life
Waiting to repair a road until it is inpoor condition costs more, because damage to the underlying structure requires more expensive pavement restoration (1.5 to 2 times the LLCC)
Poor and very poor roads cause morewear on vehicles and higher fuel use
FAIR FAIR 14.9% 16.7% 23.3%
POOR POOR 5.4% 5.1% 1.7%
WHAT DRIVERS SEE WHAT IS HAPPENING 2011 2015 20201 Trend2 trend
Data source: WSDOT Materials Lab.
Notes: Percents may not add to 100 due to rounding. Condition figures do not include chip seal pavement, also known as Bituminous SurfaceTreatments (BST), which has not been evaluated since 2010 due to budget reductions. Chip seal pavement accounts for 33% of lane miles onthe state’s highway network (up from 32% in 2014), yet because chip seal roads have less traffic than asphalt or concrete, they account for only 6% of the vehicle miles traveled on WSDOT’s roadway network. 1 Projections take into account the Connecting Washington transportation revenue package, and therefore do not match the 2020 projections published in Gray Notebook 56, p. 9. 2 Trends are based on observed condition trends between 2011 and 2015. 3 When pavement condition is weighted by VMT, roadways with more traffic are weighted more heavily than less traveled roads. Weighting pavement condition by VMT better accounts for the higher costs to maintain and preserve roads with more traffic.
Delaying rehabilitation of pavement in poor condition can lead to deep pavement failure which requires more expensive reconstruction (3 to 4 times the LLCC)
This road requires reactive repairsto hold it together until reconstruction,not a good long-term cost saving strategy
VERY POOR VERY POOR 4.1% 1.8% 0.8%
Percentage of WSDOT’s pavement in good condition increases; percentage in poor condition declinesActual values for 2011 and 2015; Projected 2020; Percent of lane miles and vehicle miles traveled (VMT) by condition category; Characteristics of pavement at each condition
DesiredProjected
73.9% 75.2% 76.1%
By lane miles
By VMT3
18.0% 17.8% 21.4%
By lane miles
By VMT3
By lane miles
By VMT3 5.8% 5.4% 2.0%
By lane miles
By VMT3 2.3% 1.6% 0.5%
GNB Edition 64 – December 31, 2016 | 17Strategic goal: Preservation – Pavement
expected lifetime. This number is then averaged over all of the pavement sections in the network to yield the statewide RSL. Due to Connecting Washington funding, RSL is expected to remain within WSDOT’s target range (45% to 55%) into the future (see graph at right).
Preservation backlog increases, but is expected to decrease in 2016WSDOT uses Deferred Preservation Liability, an estimate of the accumulated cost of performing all past-due pavement rehabilitation work, to track how much investment is needed to restore the entire pavement network to an adequate condition.
WSDOT’s goal is to have a Deferred Preservation Liability of $0. The Deferred Preservation Liability increased from $351 million in 2014 to $403 million in 2015. WSDOT uses Practical Solutions approaches such as strategic maintenance to keep pavement condition and RSL within acceptable ranges (see chart at left for RSL target, p. 14 for condition targets), but the lack of long-term investment results in an increased backlog. Connecting Washington funding is expected to substantially decrease the Deferred Preservation Liability beginning in 2016 (see chart below).
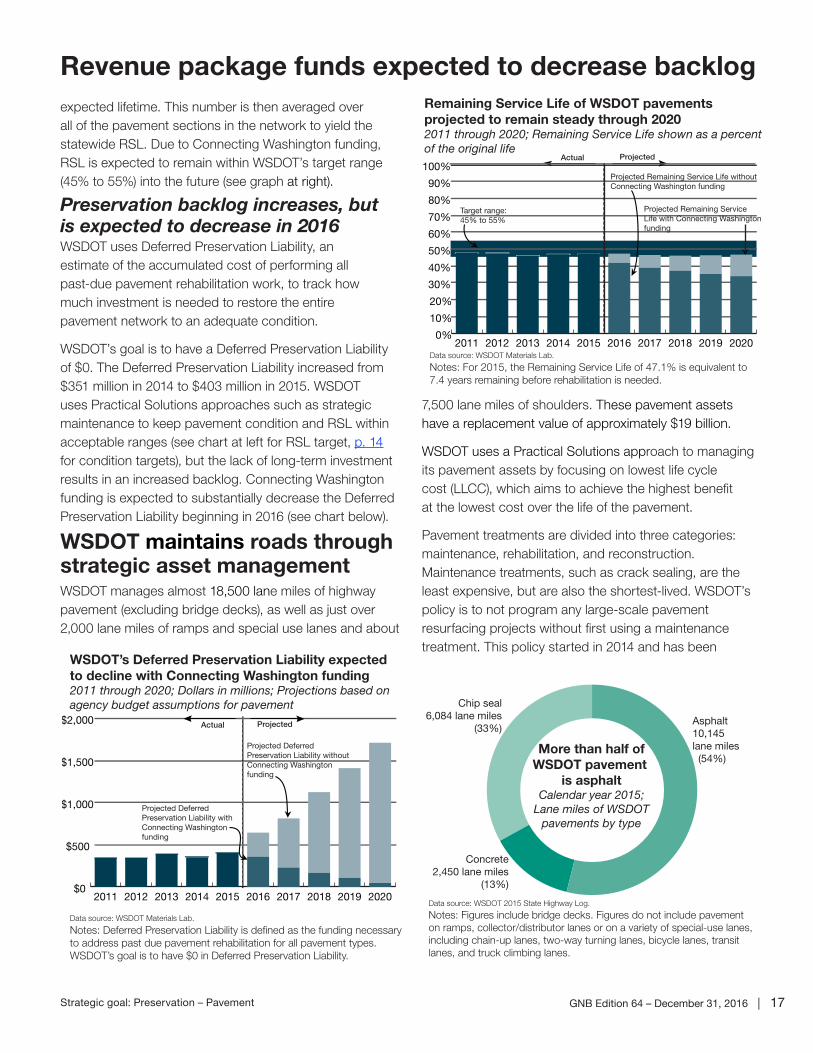
WSDOT maintains roads through strategic asset managementWSDOT manages almost 18,500 lane miles of highway pavement (excluding bridge decks), as well as just over 2,000 lane miles of ramps and special use lanes and about
Revenue package funds expected to decrease backlog
WSDOT’s Deferred Preservation Liability expected to decline with Connecting Washington funding2011 through 2020; Dollars in millions; Projections based on agency budget assumptions for pavement
Data source: WSDOT Materials Lab.
Notes: Deferred Preservation Liability is defined as the funding necessaryto address past due pavement rehabilitation for all pavement types. WSDOT’s goal is to have $0 in Deferred Preservation Liability.
$0
$500
$1,000
$1,500
$2,000
2020201920182017201620152014201320122011
ProjectedActual
Projected Deferred Preservation Liability with Connecting Washington funding
Projected Deferred Preservation Liability without Connecting Washington funding
7,500 lane miles of shoulders. These pavement assets have a replacement value of approximately $19 billion.
WSDOT uses a Practical Solutions approach to managing its pavement assets by focusing on lowest life cycle cost (LLCC), which aims to achieve the highest benefit at the lowest cost over the life of the pavement.
Pavement treatments are divided into three categories: maintenance, rehabilitation, and reconstruction. Maintenance treatments, such as crack sealing, are the least expensive, but are also the shortest-lived. WSDOT’s policy is to not program any large-scale pavement resurfacing projects without first using a maintenance treatment. This policy started in 2014 and has been
Remaining Service Life of WSDOT pavements projected to remain steady through 20202011 through 2020; Remaining Service Life shown as a percent of the original life
Data source: WSDOT Materials Lab.
Notes: For 2015, the Remaining Service Life of 47.1% is equivalent to7.4 years remaining before rehabilitation is needed.
0%
10%
20%
30%
40%
50%
60%
70%
80%
90%
100%
2020201920182017201620152014201320122011
ProjectedActual
Projected Remaining Service Life without Connecting Washington funding
Projected Remaining Service Life with Connecting Washington funding
Target range:45% to 55%
Concrete2,450 lane miles
(13%)
Asphalt10,145 lane miles (54%)
Chip seal6,084 lane miles
(33%)
More than half ofWSDOT pavement
is asphaltCalendar year 2015;
Lane miles of WSDOTpavements by type
Data source: WSDOT 2015 State Highway Log.
Notes: Figures include bridge decks. Figures do not include pavement on ramps, collector/distributor lanes or on a variety of special-use lanes, including chain-up lanes, two-way turning lanes, bicycle lanes, transit lanes, and truck climbing lanes.
18 | GNB Edition 64 – December 31, 2016 Strategic goal: Preservation – Pavement
WSDOT uses cost-effective pavement managementmore successful than anticipated, with maintenance treatments extending pavement life by up to four years.
Pavement rehabilitation is more expensive than maintenance but can extend pavement life by 10 to 20 years depending on surface type. Reconstruction, the most expensive option, provides the longest extension of pavement life (15 to 50 years, depending on surface type).
Majority of WSDOT concrete pavement in use for twice original design life While only 2,080 lane miles of the state’s highway network (excluding bridge decks) is concrete, this pavement makes up 50% of interstate highway pavements in Washington and carries 28% of statewide vehicle miles traveled. Much of this pavement was constructed as part of the interstate highway construction program in the 1960s and 1970s, when concrete roadways were constructed without dowels and were expected to last for about 20 years.
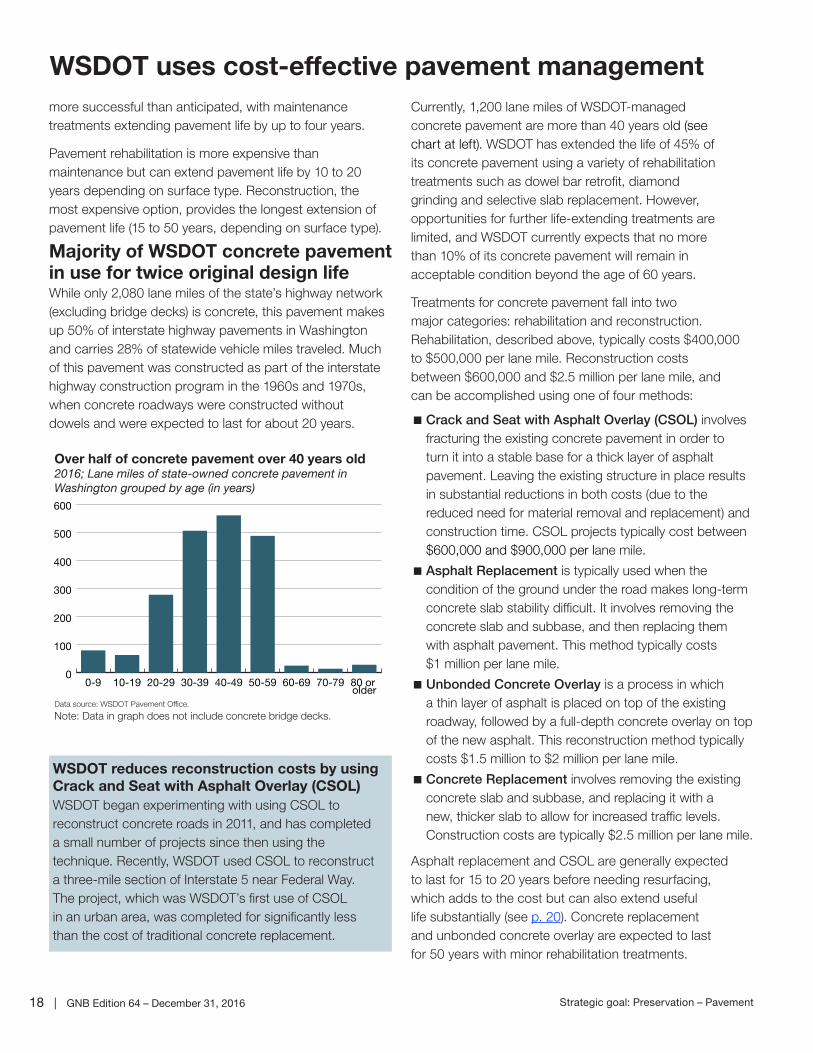
Currently, 1,200 lane miles of WSDOT-managed concrete pavement are more than 40 years old (see chart at left). WSDOT has extended the life of 45% of its concrete pavement using a variety of rehabilitation treatments such as dowel bar retrofit, diamond grinding and selective slab replacement. However, opportunities for further life-extending treatments are limited, and WSDOT currently expects that no more than 10% of its concrete pavement will remain in acceptable condition beyond the age of 60 years.
Treatments for concrete pavement fall into two major categories: rehabilitation and reconstruction. Rehabilitation, described above, typically costs $400,000 to $500,000 per lane mile. Reconstruction costs between $600,000 and $2.5 million per lane mile, and can be accomplished using one of four methods:
�Crack and Seat with Asphalt Overlay (CSOL) involves fracturing the existing concrete pavement in order to turn it into a stable base for a thick layer of asphalt pavement. Leaving the existing structure in place results in substantial reductions in both costs (due to the reduced need for material removal and replacement) and construction time. CSOL projects typically cost between $600,000 and $900,000 per lane mile.
�Asphalt Replacement is typically used when the condition of the ground under the road makes long-term concrete slab stability difficult. It involves removing the concrete slab and subbase, and then replacing them with asphalt pavement. This method typically costs $1 million per lane mile.
�Unbonded Concrete Overlay is a process in which a thin layer of asphalt is placed on top of the existing roadway, followed by a full-depth concrete overlay on top of the new asphalt. This reconstruction method typically costs $1.5 million to $2 million per lane mile.
�Concrete Replacement involves removing the existing concrete slab and subbase, and replacing it with a new, thicker slab to allow for increased traffic levels. Construction costs are typically $2.5 million per lane mile.
Asphalt replacement and CSOL are generally expected to last for 15 to 20 years before needing resurfacing, which adds to the cost but can also extend useful life substantially (see p. 20). Concrete replacement and unbonded concrete overlay are expected to last for 50 years with minor rehabilitation treatments.
Over half of concrete pavement over 40 years old2016; Lane miles of state-owned concrete pavement in Washington grouped by age (in years)
Data source: WSDOT Pavement Office.
Note: Data in graph does not include concrete bridge decks.
0
100
200
300
400
500
600
80 or older
70-7960-6950-5940-4930-3920-2910-190-9
WSDOT reduces reconstruction costs by using Crack and Seat with Asphalt Overlay (CSOL)WSDOT began experimenting with using CSOL to reconstruct concrete roads in 2011, and has completed a small number of projects since then using the technique. Recently, WSDOT used CSOL to reconstruct a three-mile section of Interstate 5 near Federal Way. The project, which was WSDOT’s first use of CSOL in an urban area, was completed for significantly less than the cost of traditional concrete replacement.
GNB Edition 64 – December 31, 2016 | 19Strategic goal: Preservation – Pavement
WSDOT developing 10- and 30-year plans for concreteWSDOT using Practical Solutions approach in Concrete Pavement Plan To address the problem of Washington’s aging concrete roadways, WSDOT has drafted 10- and 30-year plans for the rehabilitation and reconstruction of the state’s concrete pavement network. Both plans will be refined over time, with the goal of minimizing overall costs using Practical Solutions.
For the 10-year plan, which covers the years 2016 through 2025, a detailed list of proposed projects was developed, and the rehabilitation or reconstruction strategy that provided the longest pavement life for the lowest annual cost was selected for each project. The 30-year plan, which extends through 2045, is primarily based on pavement age and rehabilitation history.
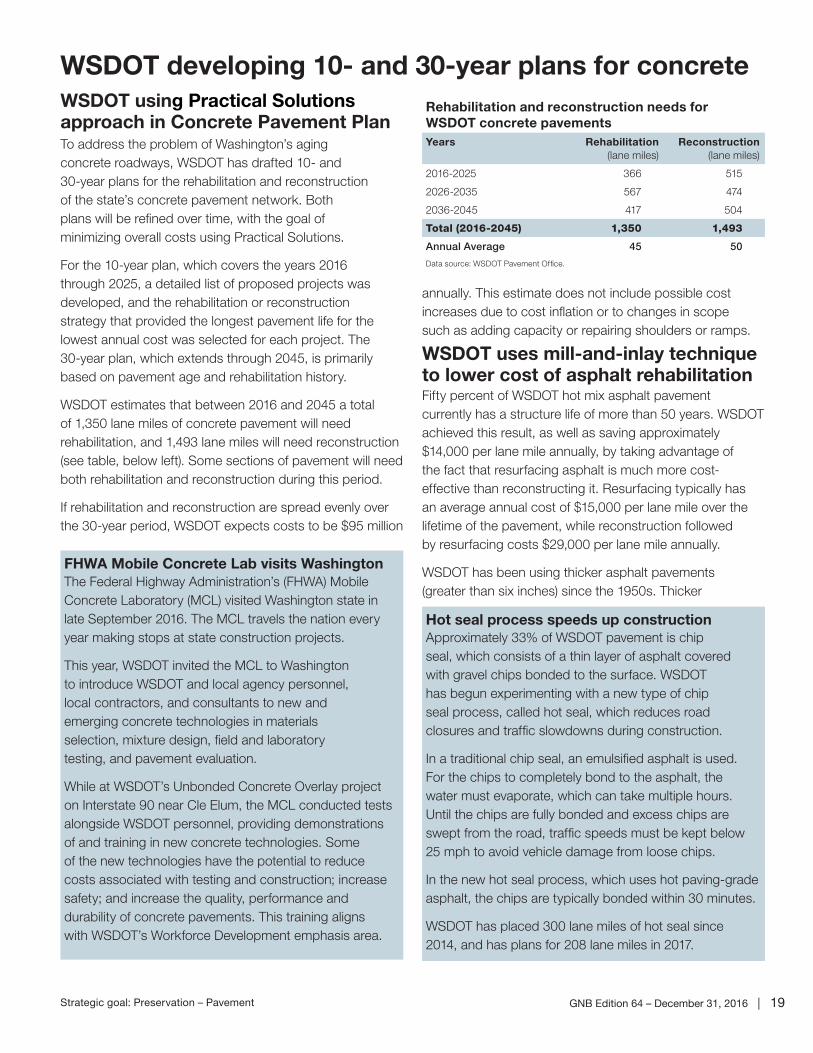
WSDOT estimates that between 2016 and 2045 a total of 1,350 lane miles of concrete pavement will need rehabilitation, and 1,493 lane miles will need reconstruction (see table, below left). Some sections of pavement will need both rehabilitation and reconstruction during this period.
If rehabilitation and reconstruction are spread evenly over the 30-year period, WSDOT expects costs to be $95 million
annually. This estimate does not include possible cost increases due to cost inflation or to changes in scope such as adding capacity or repairing shoulders or ramps.
WSDOT uses mill-and-inlay technique to lower cost of asphalt rehabilitationFifty percent of WSDOT hot mix asphalt pavement currently has a structure life of more than 50 years. WSDOT achieved this result, as well as saving approximately $14,000 per lane mile annually, by taking advantage of the fact that resurfacing asphalt is much more cost-effective than reconstructing it. Resurfacing typically has an average annual cost of $15,000 per lane mile over the lifetime of the pavement, while reconstruction followed by resurfacing costs $29,000 per lane mile annually.
WSDOT has been using thicker asphalt pavements (greater than six inches) since the 1950s. Thicker
Rehabilitation and reconstruction needs for WSDOT concrete pavements Years Rehabilitation
(lane miles)Reconstruction
(lane miles)
2016-2025 366 515
2026-2035 567 474
2036-2045 417 504
Total (2016-2045) 1,350 1,493
Annual Average 45 50
Data source: WSDOT Pavement Office.
Hot seal process speeds up construction Approximately 33% of WSDOT pavement is chip seal, which consists of a thin layer of asphalt covered with gravel chips bonded to the surface. WSDOT has begun experimenting with a new type of chip seal process, called hot seal, which reduces road closures and traffic slowdowns during construction.
In a traditional chip seal, an emulsified asphalt is used. For the chips to completely bond to the asphalt, the water must evaporate, which can take multiple hours. Until the chips are fully bonded and excess chips are swept from the road, traffic speeds must be kept below 25 mph to avoid vehicle damage from loose chips.
In the new hot seal process, which uses hot paving-grade asphalt, the chips are typically bonded within 30 minutes.
WSDOT has placed 300 lane miles of hot seal since 2014, and has plans for 208 lane miles in 2017.
FHWA Mobile Concrete Lab visits WashingtonThe Federal Highway Administration’s (FHWA) Mobile Concrete Laboratory (MCL) visited Washington state in late September 2016. The MCL travels the nation every year making stops at state construction projects.
This year, WSDOT invited the MCL to Washington to introduce WSDOT and local agency personnel, local contractors, and consultants to new and emerging concrete technologies in materials selection, mixture design, field and laboratory testing, and pavement evaluation.
While at WSDOT’s Unbonded Concrete Overlay project on Interstate 90 near Cle Elum, the MCL conducted tests alongside WSDOT personnel, providing demonstrations of and training in new concrete technologies. Some of the new technologies have the potential to reduce costs associated with testing and construction; increase safety; and increase the quality, performance and durability of concrete pavements. This training aligns with WSDOT’s Workforce Development emphasis area.
20 | GNB Edition 64 – December 31, 2016 Strategic goal: Preservation – Pavement
WSDOT meets pavement performance targets
Strategic Plan Goal 1: STRATEGIC INVESTMENTSStrategy 1.1 (Strategic Investments) - Create
a process to identify strategic preservation and maintenance investments and strategic operational and multimodal capacity improvement investments in corridors to achieve performance levels.
WSDOT developed a policy for planning, programming and managing asphalt and chip seal pavements in order to improve the agency’s effective management of these assets in a declining revenue climate. The policy, called the Integrated Approach for Pavement Preservation, was implemented in 2014. The instructional letter for this policy was renewed in 2015 and again in 2016. For more detailed information related to these efforts, see Gray Notebook 60 p. 15.
Results Washington Leading Indicator
Based on current funding levels, control the
percent of state and local pavements in poor
condition from increasing over 10% by 2017.
Status: On plan (green)Strategies:
Percent of National Highway System pavement (by VMT) in poor condition
State-owned roads 5%
Locally-owned roads 13%
Total 7%
1. Convert asphalt surfaces to chip seal - The life-cycle annual cost for a chip seal surfaced pavement is approximately one-third the cost of an asphalt surface. By 2016, it is expected that the cumulative six-year cost reduction due to chip seal conversion will be $100 million.
2. Implement practical solutions - WSDOT uses the practical design approach to make project decisions that focus on the specific problem that the project is intended to address. This performance-based approach looks for lower cost solutions in order to meet specific performance criteria.
3. Strategic pavement maintenance - Performing maintenance treatments at the appropriate time (before rehabilitation is needed) extends pavement life and results in lower annual cost. WSDOT’s policy is that no pavement rehabilitation takes place until strategic maintenance has been used to extend pavement life. WSDOT has found that strategic pavement maintenance can extend pavement life by as much as four years. This treatment, which is not yet fully implemented, is currently being used on 40% of asphalt pavement and saving WSDOT about $6.7 million each year.
4. Prioritize cost effective projects - The WSDOT prioritization process avoids reconstruction, emphasizes lower annual cost, and takes traffic volume into consideration.
asphalt pavement tends to crack from the top down (as illustrated in the graphic on p. 16), which allows WSDOT to resurface asphalt roads by milling off the top two inches of pavement and replacing it with a new layer of hot mix asphalt of the same thickness.
Pavement that has been resurfaced by milling and inlaying will be the same thickness after rehabilitation as it was before, unlike pavement resurfaced by adding a layer of asphalt on top of the existing pavement. This often makes it possible to use milling and inlaying to resurface only those lanes in immediate need of preservation without creating an uneven road surface. In many areas, inlaying allows WSDOT to pave less-used lanes (such as shoulders and turn lanes) less often, reducing the cost of the asphalt pavement preservation program.
Additionally, resurfacing thick pavements while the pavement is still in fair condition preserves the underlying structure of the pavement. While WSDOT currently designs hot mix asphalt pavement to last 50 years (with resurfacing every 15 years), the agency’s experience has been that resurfacing by mill and inlay can extend the life of the road even further.
Results Washington progressesResults Washington, Gov. Jay Inslee’s performance management system for the state, includes a measure for pavement conditions for state and local roads on the National Highway System (NHS). The target for this measure is to have no more than 10% of pavements (weighted by vehicle miles traveled) on state and local NHS roads in poor condition by 2017. In 2015, 7% of NHS pavements were in poor or very poor condition—a one percentage-point increase from 2014.
The National Highway System (NHS) The National Highway System (NHS) is a network of strategic highways within the United States, and includes both state and local highways as well as roads serving major airports, ports, rail and/or truck terminals, and other transport facilities. Washington’s NHS network includes 14,718 lane miles of pavement, of which 78% is state-owned roadway and 22% is owned by local agencies. The pavement performance targets in both Results Washington and MAP-21 (see p. 21) apply specifically to pavement on the NHS.
$
GNB Edition 64 – December 31, 2016 | 21Strategic goal: Preservation – Pavement
with local agencies to set pavement performance targets for both interstate and non-interstate roadways.
In anticipation of this rule, WSDOT collaborated with Washington state Metropolitan Planning Organizations (MPOs) to set up a series of teams to work on setting targets for MAP-21. These teams will analyze proposed targets and their implications for WSDOT, MPOs, and the 102 cities and counties with pavement on the NHS; they will also make recommendations based on their analyses. For more information on MAP-21, see Gray Notebook 64, pp. 9-10.
Contributors include David Luhr, Ruth McIntyre, Tim Rydholm, Jeff Uhlmeyer, Kim Willoughby, Helen Goldstein and Joe Irwin
WSDOT follows Governmental Accounting Standards BoardThe state is also required to follow Generally Accepted Accounting Principles, which include pronouncements from the Governmental Accounting Standards Board (GASB). This board governs the financial reporting of infrastructure assets, and requires WSDOT to maintain an up-to-date inventory of assets and to document condition assessments.
For the purpose of GASB reporting, WSDOT has a pavement condition goal of 85% of state-owned lane miles in fair or better condition. WSDOT exceeded this goal in 2015 with 93.1% of lane miles in fair or better condition. Pavement conditions for GASB are evaluated based on roughness (assessed using the International Roughness Index), cracking and rutting.
Updates on MAP-21 requirementsThe Federal Highway Administration (FHWA) recently released two rules under the Moving Ahead for Progress in the 21st Century Act (MAP-21) that apply to pavement. On October 24, 2016, the FHWA released the final rule requiring states to develop and implement a risk-based asset management plan, referred to as the Transportation Asset Management Plan (TAMP). The TAMP covers a 10-year period and includes all roadways on the National Highway System (NHS). The rule requires an initial TAMP to be submitted by the state by April 30, 2018, and a final plan (following a review process) to be submitted by June 30, 2019.
A second final rule related to pavement was announced on January 9, 2017, and finalized on January 18, 2017; it documents the methods and minimum acceptable criteria to be used to measure pavement condition on the NHS. The rule also requires the state to coordinate
WSDOT prepares to implement federal regulations WSDOT’s Pavement Notebook WSDOT’s Pavement Notebook is a series of detailed performance reports on the Washington state pavement network. One of those reports, Pavement Asset Management, is a comprehensive overview of how WSDOT systematically manages its pavement, is also available. The Pavement Notebook can be accessed at: http://www.wsdot.wa.gov/Business/MaterialsLab/Pavements/PavementNotebook.htm
Pavement condition reporting requirements Condition targets by performance reporting system
Reporting system Target Included pavement
Moving Ahead for Progress in the 21st Century Act (MAP-21)
Not yet established
All NHS pavement (WSDOT and locally owned)
Results Washington
Less than 10% of pavement (by VMT) in poor condition
All NHS pavement (WSDOT and locally owned)
GovernmentalAccounting Standards Board
85% of state-owned lane miles in fair or better condition
All WSDOT-owned pavement (NHS and non-NHS)
Data source: WSDOT Office of Strategic Assessment and Performance Analysis.
Note: NHS = National Highway System
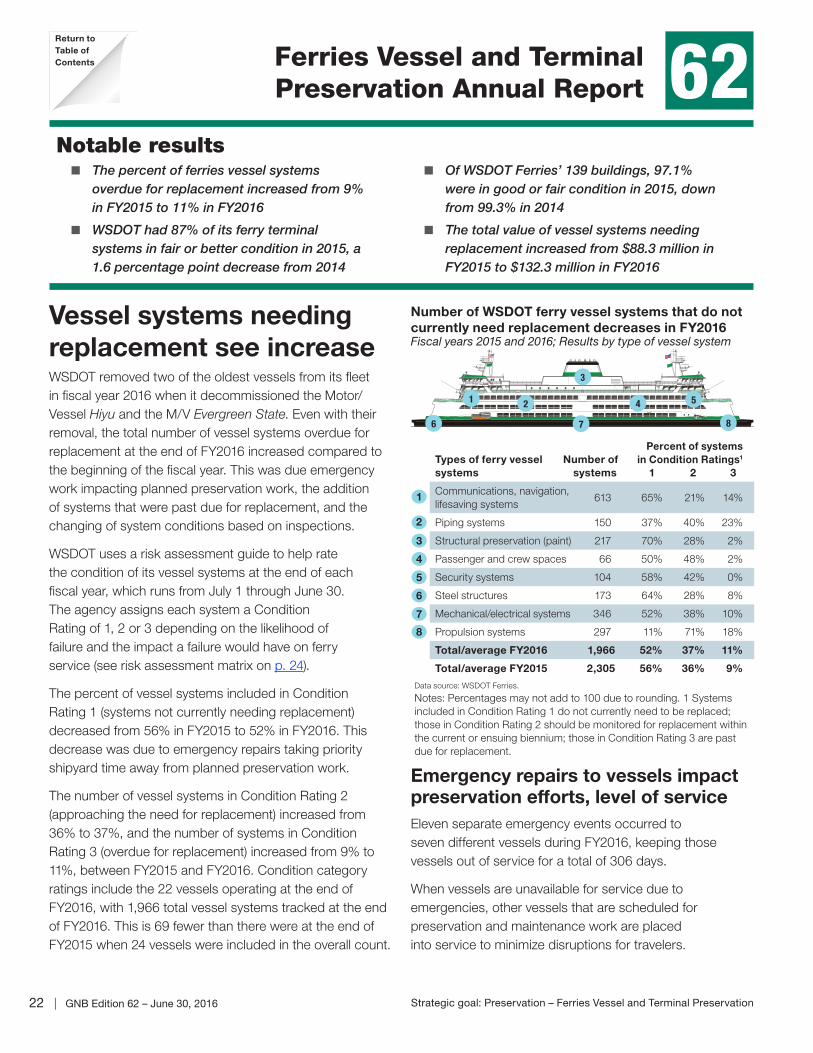
22 | GNB Edition 62 – June 30, 2016 Strategic goal: Preservation – Ferries Vessel and Terminal Preservation
Ferries Vessel and Terminal Preservation Annual Report62 Ferries Vessel and Terminal
Preservation Annual Report 62Notable results
� The percent of ferries vessel systems overdue for replacement increased from 9% in FY2015 to 11% in FY2016
� WSDOT had 87% of its ferry terminal systems in fair or better condition in 2015, a 1.6 percentage point decrease from 2014
� Of WSDOT Ferries’ 139 buildings, 97.1% were in good or fair condition in 2015, down from 99.3% in 2014
� The total value of vessel systems needing replacement increased from $88.3 million in FY2015 to $132.3 million in FY2016
Vessel systems needing replacement see increaseWSDOT removed two of the oldest vessels from its fleet in fiscal year 2016 when it decommissioned the Motor/Vessel Hiyu and the M/V Evergreen State. Even with their removal, the total number of vessel systems overdue for replacement at the end of FY2016 increased compared to the beginning of the fiscal year. This was due emergency work impacting planned preservation work, the addition of systems that were past due for replacement, and the changing of system conditions based on inspections.
WSDOT uses a risk assessment guide to help rate the condition of its vessel systems at the end of each fiscal year, which runs from July 1 through June 30. The agency assigns each system a Condition Rating of 1, 2 or 3 depending on the likelihood of failure and the impact a failure would have on ferry service (see risk assessment matrix on p. 24).
The percent of vessel systems included in Condition Rating 1 (systems not currently needing replacement) decreased from 56% in FY2015 to 52% in FY2016. This decrease was due to emergency repairs taking priority shipyard time away from planned preservation work.
The number of vessel systems in Condition Rating 2 (approaching the need for replacement) increased from 36% to 37%, and the number of systems in Condition Rating 3 (overdue for replacement) increased from 9% to 11%, between FY2015 and FY2016. Condition category ratings include the 22 vessels operating at the end of FY2016, with 1,966 total vessel systems tracked at the end of FY2016. This is 69 fewer than there were at the end of FY2015 when 24 vessels were included in the overall count.
Emergency repairs to vessels impact preservation efforts, level of serviceEleven separate emergency events occurred to seven different vessels during FY2016, keeping those vessels out of service for a total of 306 days.
When vessels are unavailable for service due to emergencies, other vessels that are scheduled for preservation and maintenance work are placed into service to minimize disruptions for travelers.
Types of ferry vessel Number of systems systems
Percent of systems in Condition Ratings1
1 2 3
Communications, navigation, lifesaving systems
613 65% 21% 14%
Piping systems 150 37% 40% 23%
Structural preservation (paint) 217 70% 28% 2%
Passenger and crew spaces 66 50% 48% 2%
Security systems 104 58% 42% 0%
Steel structures 173 64% 28% 8%
Mechanical/electrical systems 346 52% 38% 10%
Propulsion systems 297 11% 71% 18%
Total/average FY2016 1,966 52% 37% 11%
Total/average FY2015 2,305 56% 36% 9%
Data source: WSDOT Ferries.
Notes: Percentages may not add to 100 due to rounding. 1 Systems included in Condition Rating 1 do not currently need to be replaced; those in Condition Rating 2 should be monitored for replacement within the current or ensuing biennium; those in Condition Rating 3 are past due for replacement.
4
2
1
3
6
8
5
7
Number of WSDOT ferry vessel systems that do not currently need replacement decreases in FY2016Fiscal years 2015 and 2016; Results by type of vessel system
1 2
3
8
4
7
5
6
Return toTable of Contents
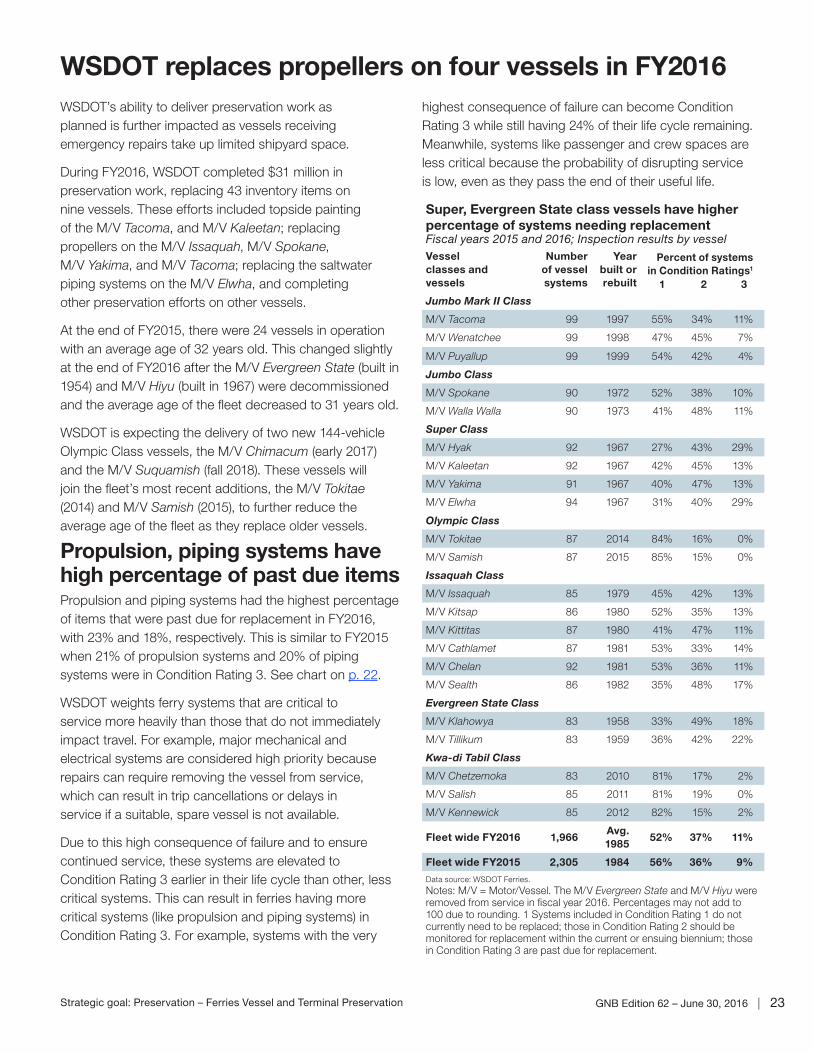
GNB Edition 62 – June 30, 2016 | 23Strategic goal: Preservation – Ferries Vessel and Terminal Preservation
highest consequence of failure can become Condition Rating 3 while still having 24% of their life cycle remaining. Meanwhile, systems like passenger and crew spaces are less critical because the probability of disrupting service is low, even as they pass the end of their useful life.
WSDOT’s ability to deliver preservation work as planned is further impacted as vessels receiving emergency repairs take up limited shipyard space.
During FY2016, WSDOT completed $31 million in preservation work, replacing 43 inventory items on nine vessels. These efforts included topside painting of the M/V Tacoma, and M/V Kaleetan; replacing propellers on the M/V Issaquah, M/V Spokane, M/V Yakima, and M/V Tacoma; replacing the saltwater piping systems on the M/V Elwha, and completing other preservation efforts on other vessels.
At the end of FY2015, there were 24 vessels in operation with an average age of 32 years old. This changed slightly at the end of FY2016 after the M/V Evergreen State (built in 1954) and M/V Hiyu (built in 1967) were decommissioned and the average age of the fleet decreased to 31 years old.
WSDOT is expecting the delivery of two new 144-vehicle Olympic Class vessels, the M/V Chimacum (early 2017) and the M/V Suquamish (fall 2018). These vessels will join the fleet’s most recent additions, the M/V Tokitae (2014) and M/V Samish (2015), to further reduce the average age of the fleet as they replace older vessels.
Propulsion, piping systems have high percentage of past due itemsPropulsion and piping systems had the highest percentage of items that were past due for replacement in FY2016, with 23% and 18%, respectively. This is similar to FY2015 when 21% of propulsion systems and 20% of piping systems were in Condition Rating 3. See chart on p. 22.
WSDOT weights ferry systems that are critical to service more heavily than those that do not immediately impact travel. For example, major mechanical and electrical systems are considered high priority because repairs can require removing the vessel from service, which can result in trip cancellations or delays in service if a suitable, spare vessel is not available.
Due to this high consequence of failure and to ensure continued service, these systems are elevated to Condition Rating 3 earlier in their life cycle than other, less critical systems. This can result in ferries having more critical systems (like propulsion and piping systems) in Condition Rating 3. For example, systems with the very
Super, Evergreen State class vessels have higher percentage of systems needing replacement Fiscal years 2015 and 2016; Inspection results by vesselVessel classes and vessels
Number of vessel systems
Year built or rebuilt
Percent of systems in Condition Ratings1
1 2 3
Jumbo Mark II Class
M/V Tacoma 99 1997 55% 34% 11%
M/V Wenatchee 99 1998 47% 45% 7%
M/V Puyallup 99 1999 54% 42% 4%
Jumbo Class
M/V Spokane 90 1972 52% 38% 10%
M/V Walla Walla 90 1973 41% 48% 11%
Super Class
M/V Hyak 92 1967 27% 43% 29%
M/V Kaleetan 92 1967 42% 45% 13%
M/V Yakima 91 1967 40% 47% 13%
M/V Elwha 94 1967 31% 40% 29%
Olympic Class
M/V Tokitae 87 2014 84% 16% 0%
M/V Samish 87 2015 85% 15% 0%
Issaquah Class
M/V Issaquah 85 1979 45% 42% 13%
M/V Kitsap 86 1980 52% 35% 13%
M/V Kittitas 87 1980 41% 47% 11%
M/V Cathlamet 87 1981 53% 33% 14%
M/V Chelan 92 1981 53% 36% 11%
M/V Sealth 86 1982 35% 48% 17%
Evergreen State Class
M/V Klahowya 83 1958 33% 49% 18%
M/V Tillikum 83 1959 36% 42% 22%
Kwa-di Tabil Class
M/V Chetzemoka 83 2010 81% 17% 2%
M/V Salish 85 2011 81% 19% 0%
M/V Kennewick 85 2012 82% 15% 2%
Fleet wide FY2016 1,966Avg. 1985
52% 37% 11%
Fleet wide FY2015 2,305 1984 56% 36% 9%
Data source: WSDOT Ferries.
Notes: M/V = Motor/Vessel. The M/V Evergreen State and M/V Hiyu were removed from service in fiscal year 2016. Percentages may not add to 100 due to rounding. 1 Systems included in Condition Rating 1 do not currently need to be replaced; those in Condition Rating 2 should be monitored for replacement within the current or ensuing biennium; those in Condition Rating 3 are past due for replacement.
WSDOT replaces propellers on four vessels in FY2016
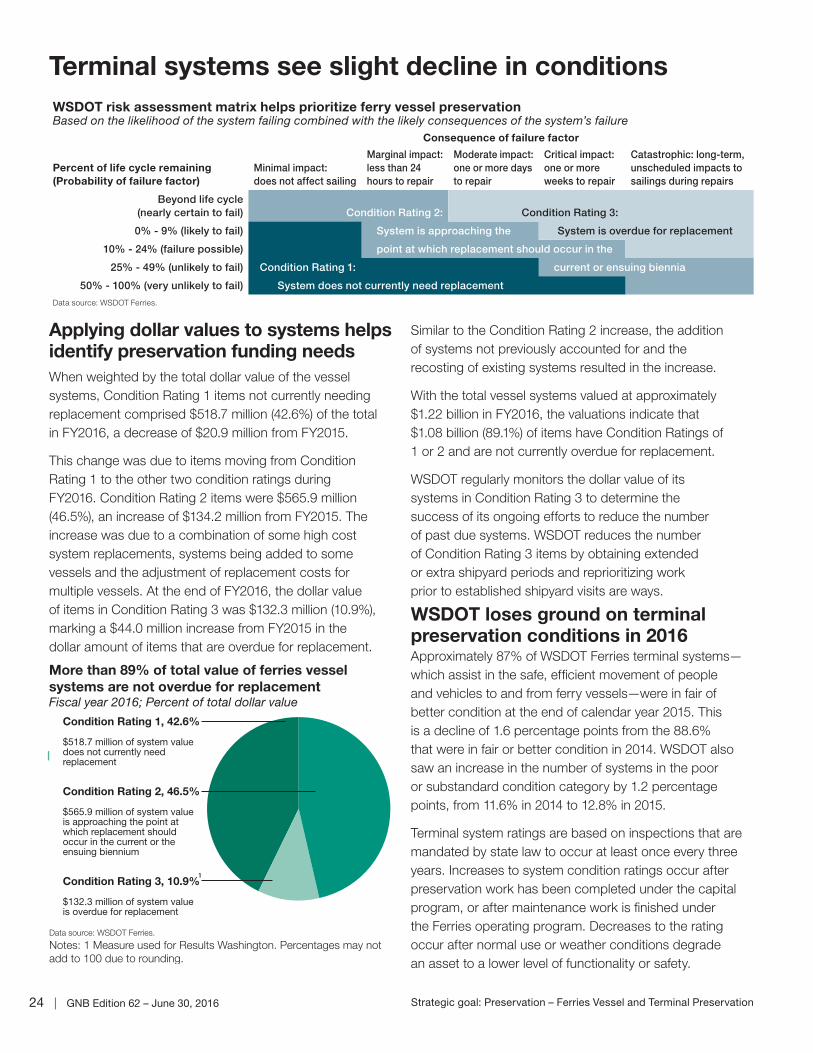
24 | GNB Edition 62 – June 30, 2016 Strategic goal: Preservation – Ferries Vessel and Terminal Preservation
Similar to the Condition Rating 2 increase, the addition of systems not previously accounted for and the recosting of existing systems resulted in the increase.
With the total vessel systems valued at approximately $1.22 billion in FY2016, the valuations indicate that $1.08 billion (89.1%) of items have Condition Ratings of 1 or 2 and are not currently overdue for replacement.
WSDOT regularly monitors the dollar value of its systems in Condition Rating 3 to determine the success of its ongoing efforts to reduce the number of past due systems. WSDOT reduces the number of Condition Rating 3 items by obtaining extended or extra shipyard periods and reprioritizing work prior to established shipyard visits are ways.
WSDOT loses ground on terminal preservation conditions in 2016Approximately 87% of WSDOT Ferries terminal systems—which assist in the safe, efficient movement of people and vehicles to and from ferry vessels—were in fair of better condition at the end of calendar year 2015. This is a decline of 1.6 percentage points from the 88.6% that were in fair or better condition in 2014. WSDOT also saw an increase in the number of systems in the poor or substandard condition category by 1.2 percentage points, from 11.6% in 2014 to 12.8% in 2015.
Terminal system ratings are based on inspections that are mandated by state law to occur at least once every three years. Increases to system condition ratings occur after preservation work has been completed under the capital program, or after maintenance work is finished under the Ferries operating program. Decreases to the rating occur after normal use or weather conditions degrade an asset to a lower level of functionality or safety.
Applying dollar values to systems helps identify preservation funding needs When weighted by the total dollar value of the vessel systems, Condition Rating 1 items not currently needing replacement comprised $518.7 million (42.6%) of the total in FY2016, a decrease of $20.9 million from FY2015.
This change was due to items moving from Condition Rating 1 to the other two condition ratings during FY2016. Condition Rating 2 items were $565.9 million (46.5%), an increase of $134.2 million from FY2015. The increase was due to a combination of some high cost system replacements, systems being added to some vessels and the adjustment of replacement costs for multiple vessels. At the end of FY2016, the dollar value of items in Condition Rating 3 was $132.3 million (10.9%), marking a $44.0 million increase from FY2015 in the dollar amount of items that are overdue for replacement.
Terminal systems see slight decline in conditions
More than 89% of total value of ferries vessel systems are not overdue for replacementFiscal year 2016; Percent of total dollar value
Data source: WSDOT Ferries.
Notes: 1 Measure used for Results Washington. Percentages may not add to 100 due to rounding.
Condition Rating 1, 42.6%
$518.7 million of system value does not currently need replacement
Condition Rating 2, 46.5%
$565.9 million of system value is approaching the point at which replacement should occur in the current or the ensuing biennium
Condition Rating 3, 10.9%
$132.3 million of system value is overdue for replacement
1
WSDOT risk assessment matrix helps prioritize ferry vessel preservation Based on the likelihood of the system failing combined with the likely consequences of the system’s failure
Percent of life cycle remaining(Probability of failure factor)
Consequence of failure factor
Minimal impact: does not affect sailing
Marginal impact: less than 24 hours to repair
Moderate impact: one or more days to repair
Critical impact: one or more weeks to repair
Catastrophic: long-term, unscheduled impacts to sailings during repairs
Beyond life cycle (nearly certain to fail) Condition Rating 2: Condition Rating 3:
0% - 9% (likely to fail) System is approaching the System is overdue for replacement
10% - 24% (failure possible) point at which replacement should occur in the
25% - 49% (unlikely to fail) Condition Rating 1: current or ensuing biennia
50% - 100% (very unlikely to fail) System does not currently need replacement
Data source: WSDOT Ferries.
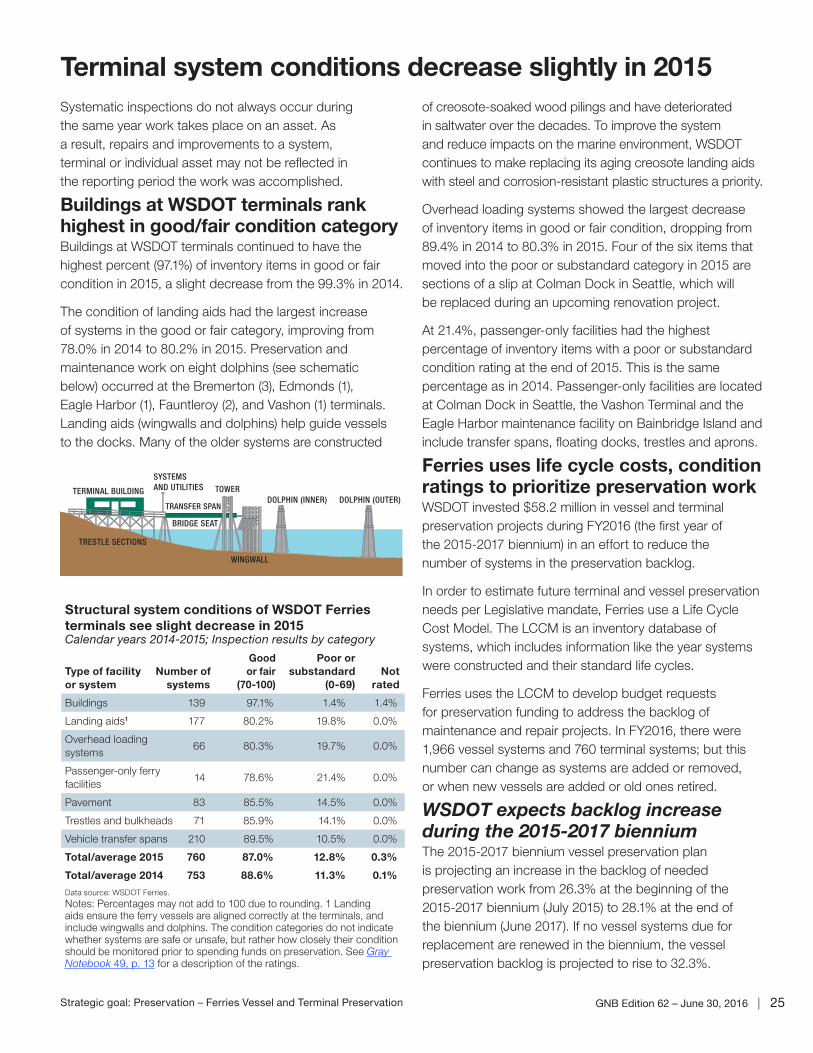
GNB Edition 62 – June 30, 2016 | 25Strategic goal: Preservation – Ferries Vessel and Terminal Preservation
of creosote-soaked wood pilings and have deteriorated in saltwater over the decades. To improve the system and reduce impacts on the marine environment, WSDOT continues to make replacing its aging creosote landing aids with steel and corrosion-resistant plastic structures a priority.
Overhead loading systems showed the largest decrease of inventory items in good or fair condition, dropping from 89.4% in 2014 to 80.3% in 2015. Four of the six items that moved into the poor or substandard category in 2015 are sections of a slip at Colman Dock in Seattle, which will be replaced during an upcoming renovation project.
At 21.4%, passenger-only facilities had the highest percentage of inventory items with a poor or substandard condition rating at the end of 2015. This is the same percentage as in 2014. Passenger-only facilities are located at Colman Dock in Seattle, the Vashon Terminal and the Eagle Harbor maintenance facility on Bainbridge Island and include transfer spans, floating docks, trestles and aprons.
Ferries uses life cycle costs, condition ratings to prioritize preservation workWSDOT invested $58.2 million in vessel and terminal preservation projects during FY2016 (the first year of the 2015-2017 biennium) in an effort to reduce the number of systems in the preservation backlog.
In order to estimate future terminal and vessel preservation needs per Legislative mandate, Ferries use a Life Cycle Cost Model. The LCCM is an inventory database of systems, which includes information like the year systems were constructed and their standard life cycles.
Ferries uses the LCCM to develop budget requests for preservation funding to address the backlog of maintenance and repair projects. In FY2016, there were 1,966 vessel systems and 760 terminal systems; but this number can change as systems are added or removed, or when new vessels are added or old ones retired.
WSDOT expects backlog increase during the 2015-2017 bienniumThe 2015-2017 biennium vessel preservation plan is projecting an increase in the backlog of needed preservation work from 26.3% at the beginning of the 2015-2017 biennium (July 2015) to 28.1% at the end of the biennium (June 2017). If no vessel systems due for replacement are renewed in the biennium, the vessel preservation backlog is projected to rise to 32.3%.
Systematic inspections do not always occur during the same year work takes place on an asset. As a result, repairs and improvements to a system, terminal or individual asset may not be reflected in the reporting period the work was accomplished.
Buildings at WSDOT terminals rank highest in good/fair condition category Buildings at WSDOT terminals continued to have the highest percent (97.1%) of inventory items in good or fair condition in 2015, a slight decrease from the 99.3% in 2014.
The condition of landing aids had the largest increase of systems in the good or fair category, improving from 78.0% in 2014 to 80.2% in 2015. Preservation and maintenance work on eight dolphins (see schematic below) occurred at the Bremerton (3), Edmonds (1), Eagle Harbor (1), Fauntleroy (2), and Vashon (1) terminals. Landing aids (wingwalls and dolphins) help guide vessels to the docks. Many of the older systems are constructed
Terminal system conditions decrease slightly in 2015
Structural system conditions of WSDOT Ferries terminals see slight decrease in 2015Calendar years 2014-2015; Inspection results by category
Type of facility Number ofor system systems
Good or fair
(70-100)
Poor or substandard
(0-69)Not
rated
Buildings 139 97.1% 1.4% 1.4%
Landing aids1 177 80.2% 19.8% 0.0%
Overhead loading systems
66 80.3% 19.7% 0.0%
Passenger-only ferry facilities
14 78.6% 21.4% 0.0%
Pavement 83 85.5% 14.5% 0.0%
Trestles and bulkheads 71 85.9% 14.1% 0.0%
Vehicle transfer spans 210 89.5% 10.5% 0.0%
Total/average 2015 760 87.0% 12.8% 0.3%
Total/average 2014 753 88.6% 11.3% 0.1%
Data source: WSDOT Ferries.
Notes: Percentages may not add to 100 due to rounding. 1 Landing aids ensure the ferry vessels are aligned correctly at the terminals, and include wingwalls and dolphins. The condition categories do not indicate whether systems are safe or unsafe, but rather how closely their condition should be monitored prior to spending funds on preservation. See Gray Notebook 49, p. 13 for a description of the ratings.
DOLPHIN (OUTER)
SYSTEMSAND UTILITIES
TRANSFER SPAN
TERMINAL BUILDING
BRIDGE SEAT
TOWERDOLPHIN (INNER)
TRESTLE SECTIONS
TRESTLE SECTIONS
WINGWALL
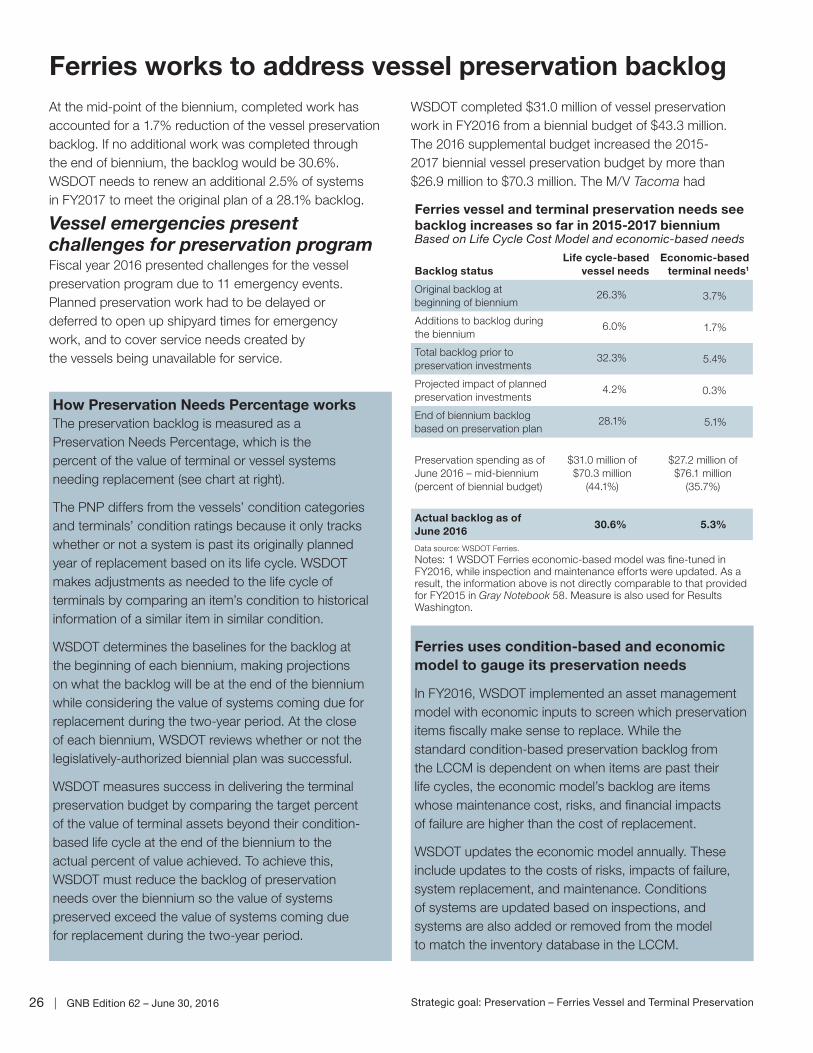
26 | GNB Edition 62 – June 30, 2016 Strategic goal: Preservation – Ferries Vessel and Terminal Preservation
WSDOT completed $31.0 million of vessel preservation work in FY2016 from a biennial budget of $43.3 million. The 2016 supplemental budget increased the 2015-2017 biennial vessel preservation budget by more than $26.9 million to $70.3 million. The M/V Tacoma had
At the mid-point of the biennium, completed work has accounted for a 1.7% reduction of the vessel preservation backlog. If no additional work was completed through the end of biennium, the backlog would be 30.6%. WSDOT needs to renew an additional 2.5% of systems in FY2017 to meet the original plan of a 28.1% backlog.
Vessel emergencies present challenges for preservation programFiscal year 2016 presented challenges for the vessel preservation program due to 11 emergency events. Planned preservation work had to be delayed or deferred to open up shipyard times for emergency work, and to cover service needs created by the vessels being unavailable for service.
Ferries vessel and terminal preservation needs see backlog increases so far in 2015-2017 biennium Based on Life Cycle Cost Model and economic-based needs
Backlog statusLife cycle-based
vessel needsEconomic-based
terminal needs1
Original backlog at beginning of biennium
26.3% 3.7%
Additions to backlog during the biennium
6.0% 1.7%
Total backlog prior to preservation investments
32.3% 5.4%
Projected impact of planned preservation investments
4.2% 0.3%
End of biennium backlog based on preservation plan
28.1% 5.1%
Preservation spending as of June 2016 – mid-biennium (percent of biennial budget)
$31.0 million of $70.3 million
(44.1%)
$27.2 million of $76.1 million
(35.7%)
Actual backlog as of June 2016
30.6% 5.3%
Data source: WSDOT Ferries.
Notes: 1 WSDOT Ferries economic-based model was fine-tuned in FY2016, while inspection and maintenance efforts were updated. As a result, the information above is not directly comparable to that provided for FY2015 in Gray Notebook 58. Measure is also used for Results Washington.
Ferries works to address vessel preservation backlog
How Preservation Needs Percentage worksThe preservation backlog is measured as a Preservation Needs Percentage, which is the percent of the value of terminal or vessel systems needing replacement (see chart at right).
The PNP differs from the vessels’ condition categories and terminals’ condition ratings because it only tracks whether or not a system is past its originally planned year of replacement based on its life cycle. WSDOT makes adjustments as needed to the life cycle of terminals by comparing an item’s condition to historical information of a similar item in similar condition.
WSDOT determines the baselines for the backlog at the beginning of each biennium, making projections on what the backlog will be at the end of the biennium while considering the value of systems coming due for replacement during the two-year period. At the close of each biennium, WSDOT reviews whether or not the legislatively-authorized biennial plan was successful.
WSDOT measures success in delivering the terminal preservation budget by comparing the target percent of the value of terminal assets beyond their condition-based life cycle at the end of the biennium to the actual percent of value achieved. To achieve this, WSDOT must reduce the backlog of preservation needs over the biennium so the value of systems preserved exceed the value of systems coming due for replacement during the two-year period.
Ferries uses condition-based and economic model to gauge its preservation needs
In FY2016, WSDOT implemented an asset management model with economic inputs to screen which preservation items fiscally make sense to replace. While the standard condition-based preservation backlog from the LCCM is dependent on when items are past their life cycles, the economic model’s backlog are items whose maintenance cost, risks, and financial impacts of failure are higher than the cost of replacement.
WSDOT updates the economic model annually. These include updates to the costs of risks, impacts of failure, system replacement, and maintenance. Conditions of systems are updated based on inspections, and systems are also added or removed from the model to match the inventory database in the LCCM.
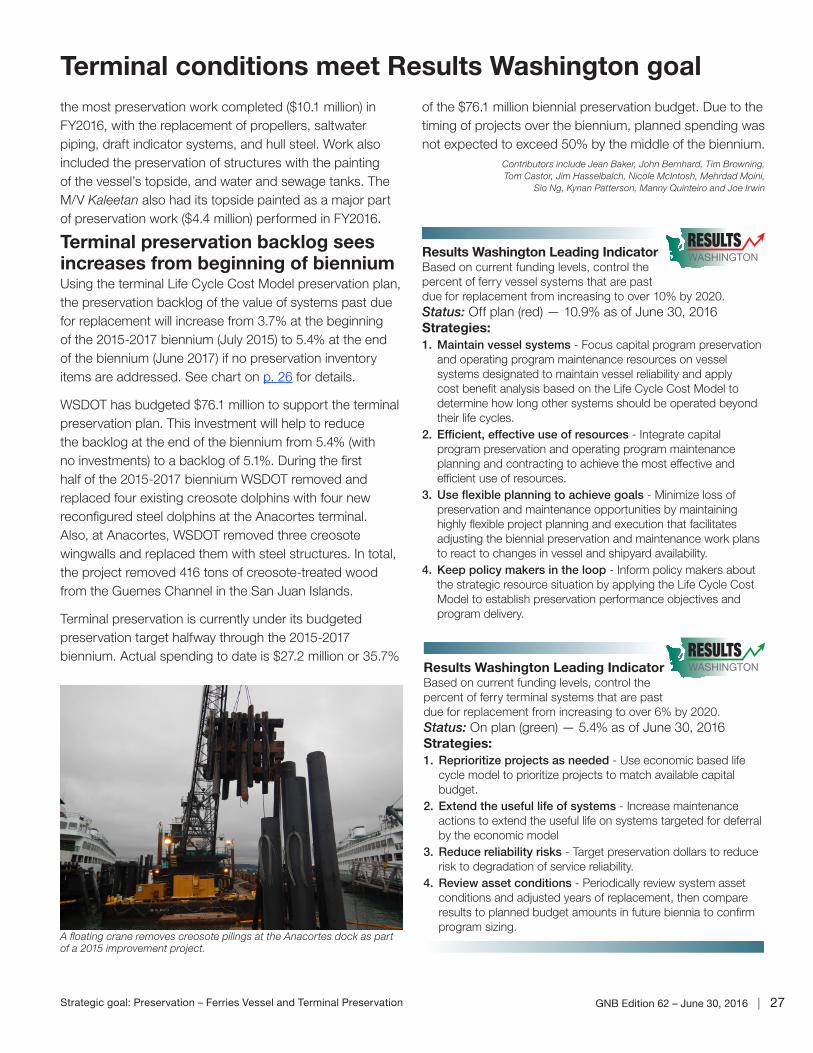
GNB Edition 62 – June 30, 2016 | 27Strategic goal: Preservation – Ferries Vessel and Terminal Preservation
of the $76.1 million biennial preservation budget. Due to the timing of projects over the biennium, planned spending was not expected to exceed 50% by the middle of the biennium.
Contributors include Jean Baker, John Bernhard, Tim Browning, Tom Castor, Jim Hasselbalch, Nicole McIntosh, Mehrdad Moini,
Sio Ng, Kynan Patterson, Manny Quinteiro and Joe Irwin
the most preservation work completed ($10.1 million) in FY2016, with the replacement of propellers, saltwater piping, draft indicator systems, and hull steel. Work also included the preservation of structures with the painting of the vessel’s topside, and water and sewage tanks. The M/V Kaleetan also had its topside painted as a major part of preservation work ($4.4 million) performed in FY2016.
Terminal preservation backlog sees increases from beginning of bienniumUsing the terminal Life Cycle Cost Model preservation plan, the preservation backlog of the value of systems past due for replacement will increase from 3.7% at the beginning of the 2015-2017 biennium (July 2015) to 5.4% at the end of the biennium (June 2017) if no preservation inventory items are addressed. See chart on p. 26 for details.
WSDOT has budgeted $76.1 million to support the terminal preservation plan. This investment will help to reduce the backlog at the end of the biennium from 5.4% (with no investments) to a backlog of 5.1%. During the first half of the 2015-2017 biennium WSDOT removed and replaced four existing creosote dolphins with four new reconfigured steel dolphins at the Anacortes terminal. Also, at Anacortes, WSDOT removed three creosote wingwalls and replaced them with steel structures. In total, the project removed 416 tons of creosote-treated wood from the Guemes Channel in the San Juan Islands.
Terminal preservation is currently under its budgeted preservation target halfway through the 2015-2017 biennium. Actual spending to date is $27.2 million or 35.7%
Results Washington Leading IndicatorBased on current funding levels, control the percent of ferry vessel systems that are past due for replacement from increasing to over 10% by 2020.Status: Off plan (red) — 10.9% as of June 30, 2016Strategies: 1. Maintain vessel systems - Focus capital program preservation
and operating program maintenance resources on vessel systems designated to maintain vessel reliability and apply cost benefit analysis based on the Life Cycle Cost Model to determine how long other systems should be operated beyond their life cycles.
2. Efficient, effective use of resources - Integrate capital program preservation and operating program maintenance planning and contracting to achieve the most effective and efficient use of resources.
3. Use flexible planning to achieve goals - Minimize loss of preservation and maintenance opportunities by maintaining highly flexible project planning and execution that facilitates adjusting the biennial preservation and maintenance work plans to react to changes in vessel and shipyard availability.
4. Keep policy makers in the loop - Inform policy makers about the strategic resource situation by applying the Life Cycle Cost Model to establish preservation performance objectives and program delivery.
Results Washington Leading IndicatorBased on current funding levels, control the percent of ferry terminal systems that are past due for replacement from increasing to over 6% by 2020.Status: On plan (green) — 5.4% as of June 30, 2016Strategies: 1. Reprioritize projects as needed - Use economic based life
cycle model to prioritize projects to match available capital budget.
2. Extend the useful life of systems - Increase maintenance actions to extend the useful life on systems targeted for deferral by the economic model
3. Reduce reliability risks - Target preservation dollars to reduce risk to degradation of service reliability.
4. Review asset conditions - Periodically review system asset conditions and adjusted years of replacement, then compare results to planned budget amounts in future biennia to confirm program sizing.
Terminal conditions meet Results Washington goal
A floating crane removes creosote pilings at the Anacortes dock as part of a 2015 improvement project.
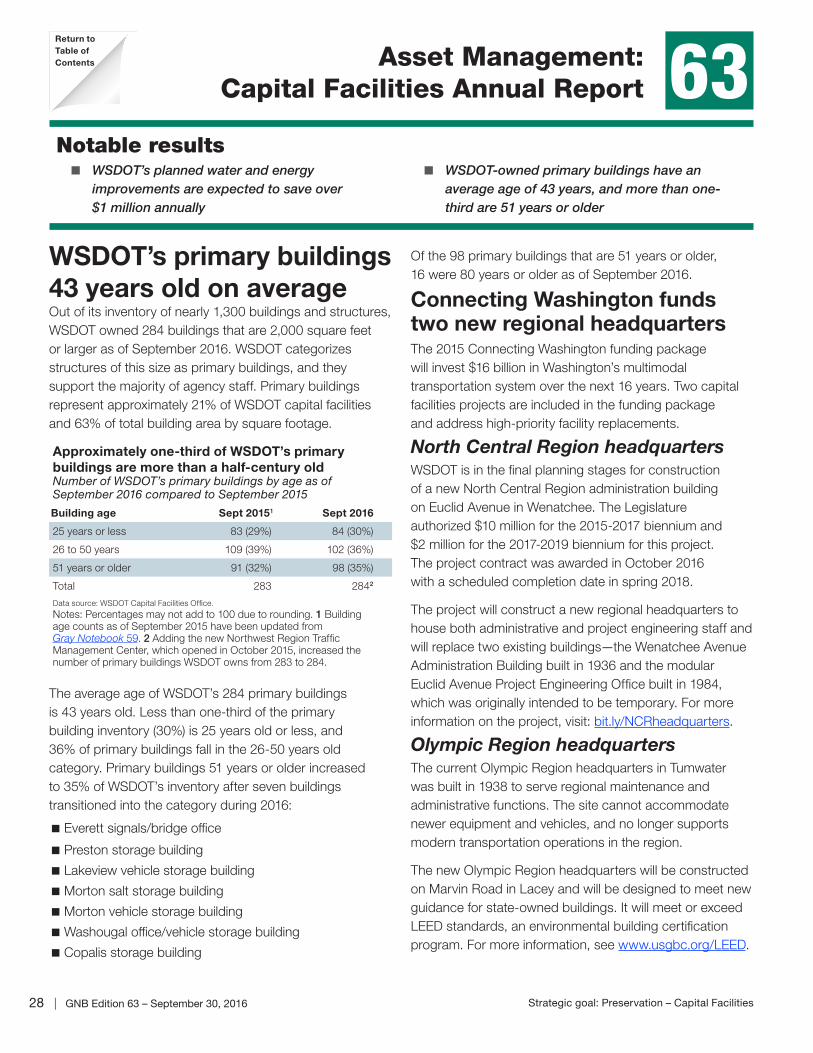
28 | GNB Edition 63 – September 30, 2016 Strategic goal: Preservation – Capital Facilities
Asset Management:Capital Facilities Annual Report63 Asset Management:
Capital Facilities Annual Report 63
Of the 98 primary buildings that are 51 years or older, 16 were 80 years or older as of September 2016.
Connecting Washington funds two new regional headquartersThe 2015 Connecting Washington funding package will invest $16 billion in Washington’s multimodal transportation system over the next 16 years. Two capital facilities projects are included in the funding package and address high-priority facility replacements.
North Central Region headquartersWSDOT is in the final planning stages for construction of a new North Central Region administration building on Euclid Avenue in Wenatchee. The Legislature authorized $10 million for the 2015-2017 biennium and $2 million for the 2017-2019 biennium for this project. The project contract was awarded in October 2016 with a scheduled completion date in spring 2018.
The project will construct a new regional headquarters to house both administrative and project engineering staff and will replace two existing buildings—the Wenatchee Avenue Administration Building built in 1936 and the modular Euclid Avenue Project Engineering Office built in 1984 , which was originally intended to be temporary. For more information on the project, visit: bit.ly/NCRheadquarters.
Olympic Region headquartersThe current Olympic Region headquarters in Tumwater was built in 1938 to serve regional maintenance and administrative functions. The site cannot accommodate newer equipment and vehicles, and no longer supports modern transportation operations in the region.
The new Olympic Region headquarters will be constructed on Marvin Road in Lacey and will be designed to meet new guidance for state-owned buildings. It will meet or exceed LEED standards, an environmental building certification program. For more information, see www.usgbc.org/LEED.
WSDOT’s primary buildings 43 years old on averageOut of its inventory of nearly 1,300 buildings and structures, WSDOT owned 284 buildings that are 2,000 square feet or larger as of September 2016. WSDOT categorizes structures of this size as primary buildings, and they support the majority of agency staff. Primary buildings represent approximately 21% of WSDOT capital facilities and 63% of total building area by square footage.
The average age of WSDOT’s 284 primary buildings is 43 years old. Less than one-third of the primary building inventory (30%) is 25 years old or less, and 36% of primary buildings fall in the 26-50 years old category. Primary buildings 51 years or older increased to 35% of WSDOT’s inventory after seven buildings transitioned into the category during 2016:
�Everett signals/bridge office
�Preston storage building
�Lakeview vehicle storage building
�Morton salt storage building
�Morton vehicle storage building
�Washougal office/vehicle storage building
�Copalis storage building
Approximately one-third of WSDOT’s primary buildings are more than a half-century oldNumber of WSDOT’s primary buildings by age as of September 2016 compared to September 2015
Building age Sept 20151 Sept 2016
25 years or less 83 (29%) 84 (30%)
26 to 50 years 109 (39%) 102 (36%)
51 years or older 91 (32%) 98 (35%)
Total 283 2842
Data source: WSDOT Capital Facilities Office.
Notes: Percentages may not add to 100 due to rounding. 1 Building age counts as of September 2015 have been updated from Gray Notebook 59. 2 Adding the new Northwest Region Traffic Management Center, which opened in October 2015, increased the number of primary buildings WSDOT owns from 283 to 284.
Notable results � WSDOT’s planned water and energy
improvements are expected to save over $1 million annually
� WSDOT-owned primary buildings have an average age of 43 years, and more than one-third are 51 years or older
Return toTable of Contents
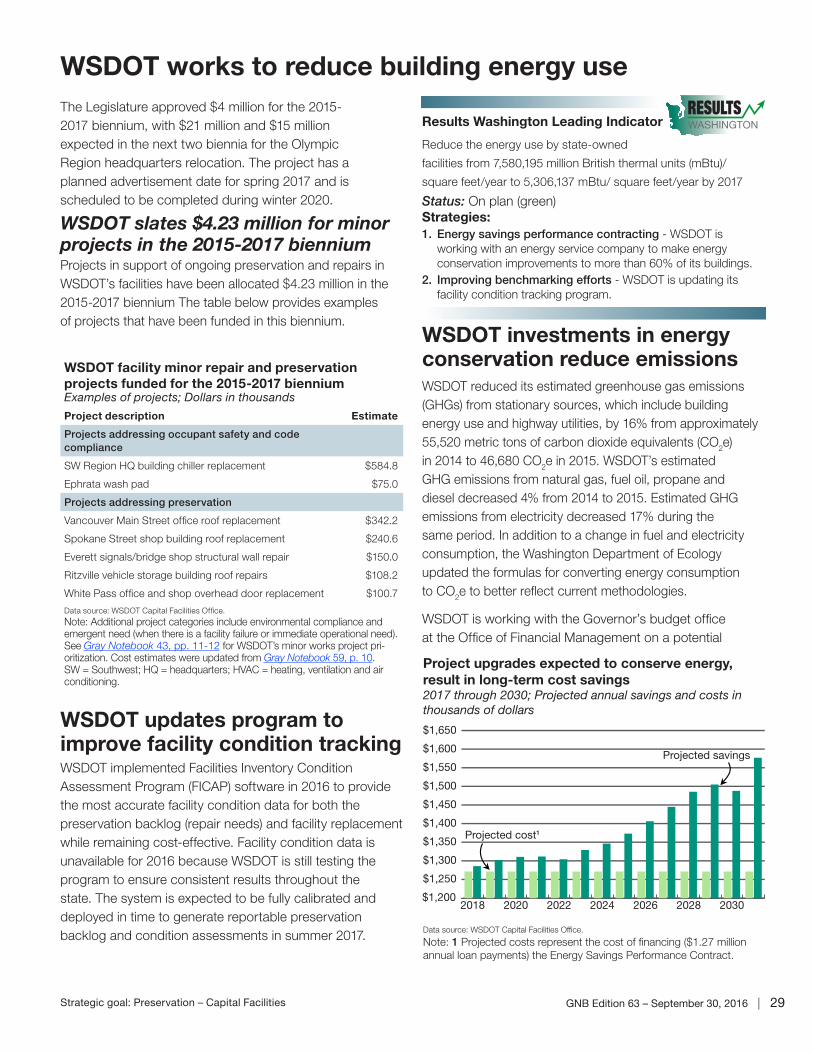
GNB Edition 63 – September 30, 2016 | 29Strategic goal: Preservation – Capital Facilities
WSDOT works to reduce building energy useThe Legislature approved $4 million for the 2015-2017 biennium, with $21 million and $15 million expected in the next two biennia for the Olympic Region headquarters relocation. The project has a planned advertisement date for spring 2017 and is scheduled to be completed during winter 2020.
WSDOT slates $4.23 million for minor projects in the 2015-2017 bienniumProjects in support of ongoing preservation and repairs in WSDOT’s facilities have been allocated $4.23 million in the 2015-2017 biennium The table below provides examples of projects that have been funded in this biennium.
WSDOT updates program to improve facility condition trackingWSDOT implemented Facilities Inventory Condition Assessment Program (FICAP) software in 2016 to provide the most accurate facility condition data for both the preservation backlog (repair needs) and facility replacement while remaining cost-effective. Facility condition data is unavailable for 2016 because WSDOT is still testing the program to ensure consistent results throughout the state. The system is expected to be fully calibrated and deployed in time to generate reportable preservation backlog and condition assessments in summer 2017.
WSDOT investments in energy conservation reduce emissionsWSDOT reduced its estimated greenhouse gas emissions (GHGs) from stationary sources, which include building energy use and highway utilities, by 16% from approximately 55,520 metric tons of carbon dioxide equivalents (CO2e) in 2014 to 46,680 CO2e in 2015. WSDOT’s estimated GHG emissions from natural gas, fuel oil, propane and diesel decreased 4% from 2014 to 2015. Estimated GHG emissions from electricity decreased 17% during the same period. In addition to a change in fuel and electricity consumption, the Washington Department of Ecology updated the formulas for converting energy consumption to CO2e to better reflect current methodologies.
WSDOT is working with the Governor’s budget office at the Office of Financial Management on a potential
WSDOT facility minor repair and preservation projects funded for the 2015-2017 bienniumExamples of projects; Dollars in thousands
Project description Estimate
Projects addressing occupant safety and code compliance
SW Region HQ building chiller replacement $584.8
Ephrata wash pad $75.0
Projects addressing preservation
Vancouver Main Street office roof replacement $342.2
Spokane Street shop building roof replacement $240.6
Everett signals/bridge shop structural wall repair $150.0
Ritzville vehicle storage building roof repairs $108.2
White Pass office and shop overhead door replacement $100.7
Data source: WSDOT Capital Facilities Office.
Note: Additional project categories include environmental compliance and emergent need (when there is a facility failure or immediate operational need). See Gray Notebook 43, pp. 11-12 for WSDOT’s minor works project pri-oritization. Cost estimates were updated from Gray Notebook 59, p. 10. SW = Southwest; HQ = headquarters; HVAC = heating, ventilation and air conditioning.
Project upgrades expected to conserve energy, result in long-term cost savings2017 through 2030; Projected annual savings and costs in thousands of dollars
Data source: WSDOT Capital Facilities Office.
Note: 1 Projected costs represent the cost of financing ($1.27 million annual loan payments) the Energy Savings Performance Contract.
$1,200
$1,250
$1,300
$1,350
$1,400
$1,450
$1,500
$1,550
$1,600
$1,650
2030202820262024202220202018
Projected cost1
Projected savings
Results Washington Leading Indicator
Reduce the energy use by state-owned
facilities from 7,580,195 million British thermal units (mBtu)/
square feet/year to 5,306,137 mBtu/ square feet/year by 2017
Status: On plan (green)Strategies: 1. Energy savings performance contracting - WSDOT is
working with an energy service company to make energy conservation improvements to more than 60% of its buildings.
2. Improving benchmarking efforts - WSDOT is updating its facility condition tracking program.
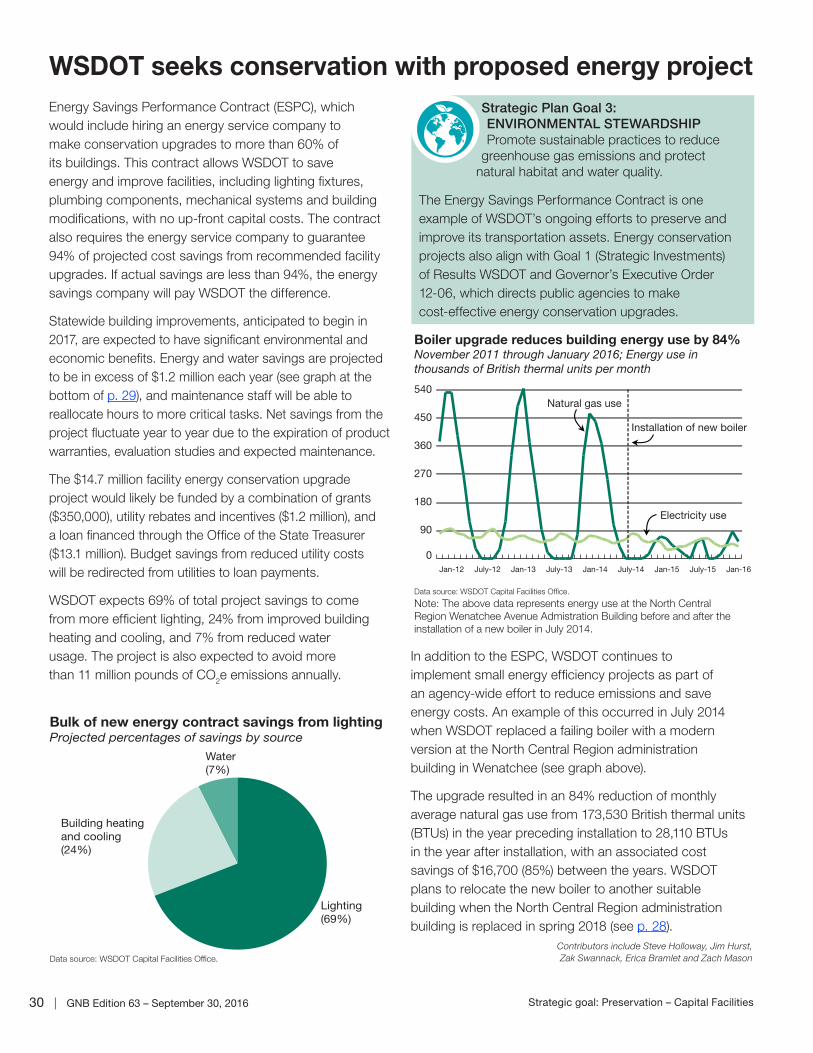
30 | GNB Edition 63 – September 30, 2016 Strategic goal: Preservation – Capital Facilities
WSDOT seeks conservation with proposed energy projectEnergy Savings Performance Contract (ESPC), which would include hiring an energy service company to make conservation upgrades to more than 60% of its buildings. This contract allows WSDOT to save energy and improve facilities, including lighting fixtures, plumbing components, mechanical systems and building modifications, with no up-front capital costs. The contract also requires the energy service company to guarantee 94% of projected cost savings from recommended facility upgrades. If actual savings are less than 94%, the energy savings company will pay WSDOT the difference.
Statewide building improvements, anticipated to begin in 2017, are expected to have significant environmental and economic benefits. Energy and water savings are projected to be in excess of $1.2 million each year (see graph at the bottom of p. 29), and maintenance staff will be able to reallocate hours to more critical tasks. Net savings from the project fluctuate year to year due to the expiration of product warranties, evaluation studies and expected maintenance.
The $14.7 million facility energy conservation upgrade project would likely be funded by a combination of grants ($350,000), utility rebates and incentives ($1.2 million), and a loan financed through the Office of the State Treasurer ($13.1 million). Budget savings from reduced utility costs will be redirected from utilities to loan payments.
WSDOT expects 69% of total project savings to come from more efficient lighting, 24% from improved building heating and cooling, and 7% from reduced water usage. The project is also expected to avoid more than 11 million pounds of CO2e emissions annually.
In addition to the ESPC, WSDOT continues to implement small energy efficiency projects as part of an agency-wide effort to reduce emissions and save energy costs. An example of this occurred in July 2014 when WSDOT replaced a failing boiler with a modern version at the North Central Region administration building in Wenatchee (see graph above).
The upgrade resulted in an 84% reduction of monthly average natural gas use from 173,530 British thermal units (BTUs) in the year preceding installation to 28,110 BTUs in the year after installation, with an associated cost savings of $16,700 (85%) between the years. WSDOT plans to relocate the new boiler to another suitable building when the North Central Region administration building is replaced in spring 2018 (see p. 28).
Contributors include Steve Holloway, Jim Hurst, Zak Swannack, Erica Bramlet and Zach Mason
Bulk of new energy contract savings from lightingProjected percentages of savings by source
Data source: WSDOT Capital Facilities Office.
Lighting(69%)
Building heatingand cooling(24%)
Water(7%)
Boiler upgrade reduces building energy use by 84%November 2011 through January 2016; Energy use in thousands of British thermal units per month
Data source: WSDOT Capital Facilities Office.
Note: The above data represents energy use at the North Central Region Wenatchee Avenue Admistration Building before and after the installation of a new boiler in July 2014.
0
90
180
270
360
450
540
Jan-16July-15Jan-15July-14Jan-14July-13Jan-13July-12Jan-12
Natural gas use
Electricity use
Installation of new boiler
Strategic Plan Goal 3: ENVIRONMENTAL STEWARDSHIPPromote sustainable practices to reduce
greenhouse gas emissions and protect natural habitat and water quality.
The Energy Savings Performance Contract is one example of WSDOT’s ongoing efforts to preserve and improve its transportation assets. Energy conservation projects also align with Goal 1 (Strategic Investments) of Results WSDOT and Governor’s Executive Order 12-06, which directs public agencies to make cost-effective energy conservation upgrades.
GNB Edition 63 – September 30, 2016 | 31Strategic goal: Preservation – Aviation
Asset Management: Aviation Annual Report63
Projects that preserve and improve airport pavement account for 43% of the total dollars ($25.7 million), with the remaining 7% ($4.0 million) allocated for planning, maintenance, security, and equipment acquisition projects. For more information about WSDOT’s Airport Aid Grant Program, visit: www.wsdot.wa.gov/aviation/Grants.
Aviation tax reallocation funds state’s public-use airportsIn 2015, Gov. Jay Inslee signed the Transportation Appropriations Bill, which mandated that 100% of state
State awards $1.8 million to leverage federal fundsWSDOT awarded $1.8 million for airport investments through its Airport Aid Grant Program in fiscal year (FY) 2017 (July 2016 through June 2017), and public-use airports in the state leveraged $1.3 million of those funds to secure $51.3 million from federal sources. These grant awards will benefit 30 projects at 32 airports in FY2017. WSDOT’s leveraged dollars are a subset of the $1.8 million in total state funds for the Airport Aid Grant Program (see table below). Approximately $500,000 will go to airports not eligible for federal funding.
The state and federal funds, combined with $6.6 million in local and other matching contributions, amount to $59.7 million in total dollars for FY2017, 50% of which ($30.0 million) is slated for safety projects. One major recipient of those safety funds will be a runway realignment project at the Pullman-Moscow Regional Airport that includes property acquisition, power line relocation, and construction of airfield improvements to further separate runway and taxiway to meet federal safety standards and reduce the potential for accidents.
Notable results � WSDOT’s Airport Aid Grant Program leveraged
federal funding, making $59.7 million available for airport investments in fiscal year 2017
� Reallocation of the aircraft excise tax is estimated to create 104 jobs and return $1.7 million to the state’s general fund
� WSDOT completed 100% of the Airport Master Record inspections scheduled for calendar year 2016
� WSDOT streamlined the aircraft registration process, saving customers 3,200 hours of time and letting WSDOT redeploy 29 labor hours
Half of total airport investment funding slated for safety projects in FY2017Funding by source, project type; Millions of dollars
Funding Source
Project type Total Local State Federal Other
Pavement $25.7 (43%) $3.6 $1.2 $20.3 $0.6
Safety $30.0 (50%) $2.2 $0.3 $27.5 $0.0
Other1 $4.0 (7%) $0.2 $0.3 $3.5 $0.0
Total $59.7 (100%) $6.0 $1.8 $51.3 $0.6
Data source: WSDOT Aviation Division.
Note: 1 “Other” project types include planning, maintenance, security, and equipment acquisition.
Statewide general aviation passenger safetyWSDOT actively tracks general aviation safety by monitoring the percent of investments allocated to airport safety projects such as runway obstruction removal. In FY2016, 50% of Airport Aid Grant funding went to safety projects. While WSDOT does not track passenger safety, it assists the National Transportation Safety Board (NTSB) after aviation accidents, providing information to help NTSB investigations.
WSDOT also supports general aviation passenger safety efforts through its Aviation Emergency Services Program, which manages aerial search and rescue missions. For more information on aerial search and rescue within the state, see: www.wsdot.wa.gov/aviation/SAR/.
General aviation1 fatalities in Washington state show little change during five-year periodCalendar year 2011 through 2015; General aviation passenger boardings and fatalities only
2011 2012 2013 2014 2015
Total boardings 60,952 37,380 10,062 46,944 43,309
Total fatalities(percent)
8(0.01%)
8(0.02%)
1(0.01%)
10(0.02%)
9(0.02%)
Data sources: Federal Aviation Administration; National Traffic Safety Board, Aviation Accident Database.
Note: 1 General aviation includes all non-commercial passenger aviation.
Return toTable of
Contents
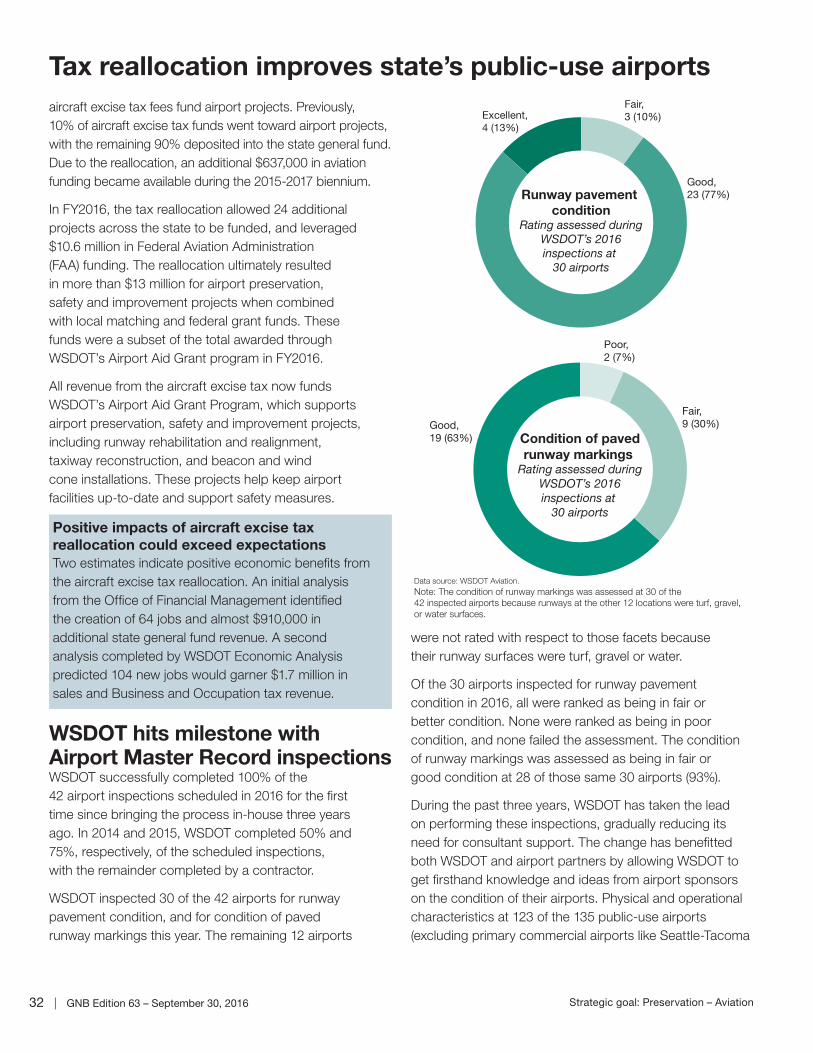
32 | GNB Edition 63 – September 30, 2016 Strategic goal: Preservation – Aviation
Tax reallocation improves state’s public-use airports
were not rated with respect to those facets because their runway surfaces were turf, gravel or water.
Of the 30 airports inspected for runway pavement condition in 2016, all were ranked as being in fair or better condition. None were ranked as being in poor condition, and none failed the assessment. The condition of runway markings was assessed as being in fair or good condition at 28 of those same 30 airports (93%).
During the past three years, WSDOT has taken the lead on performing these inspections, gradually reducing its need for consultant support. The change has benefitted both WSDOT and airport partners by allowing WSDOT to get firsthand knowledge and ideas from airport sponsors on the condition of their airports. Physical and operational characteristics at 123 of the 135 public-use airports (excluding primary commercial airports like Seattle-Tacoma
aircraft excise tax fees fund airport projects. Previously, 10% of aircraft excise tax funds went toward airport projects, with the remaining 90% deposited into the state general fund. Due to the reallocation, an additional $637,000 in aviation funding became available during the 2015-2017 biennium.
In FY2016, the tax reallocation allowed 24 additional projects across the state to be funded, and leveraged $10.6 million in Federal Aviation Administration (FAA) funding. The reallocation ultimately resulted in more than $13 million for airport preservation, safety and improvement projects when combined with local matching and federal grant funds. These funds were a subset of the total awarded through WSDOT’s Airport Aid Grant program in FY2016.
All revenue from the aircraft excise tax now funds WSDOT’s Airport Aid Grant Program, which supports airport preservation, safety and improvement projects, including runway rehabilitation and realignment, taxiway reconstruction, and beacon and wind cone installations. These projects help keep airport facilities up-to-date and support safety measures.
WSDOT hits milestone with Airport Master Record inspectionsWSDOT successfully completed 100% of the 42 airport inspections scheduled in 2016 for the first time since bringing the process in-house three years ago. In 2014 and 2015, WSDOT completed 50% and 75%, respectively, of the scheduled inspections, with the remainder completed by a contractor.
WSDOT inspected 30 of the 42 airports for runway pavement condition, and for condition of paved runway markings this year. The remaining 12 airports
Good,23 (77%)
Excellent,4 (13%)
Runway pavement condition
Rating assessed duringWSDOT’s 2016inspections at
30 airports
Fair,3 (10%)
Data source: WSDOT Aviation. Note: The condition of runway markings was assessed at 30 of the 42 inspected airports because runways at the other 12 locations were turf, gravel,or water surfaces.
Fair,9 (30%)Good,
19 (63%)
Poor,2 (7%)
Condition of pavedrunway markings
Rating assessed duringWSDOT’s 2016inspections at
30 airportsPositive impacts of aircraft excise tax reallocation could exceed expectationsTwo estimates indicate positive economic benefits from the aircraft excise tax reallocation. An initial analysis from the Office of Financial Management identified the creation of 64 jobs and almost $910,000 in additional state general fund revenue. A second analysis completed by WSDOT Economic Analysis predicted 104 new jobs would garner $1.7 million in sales and Business and Occupation tax revenue.
GNB Edition 63 – September 30, 2016 | 33Strategic goal: Preservation – Aviation
WSDOT streamlines aircraft registration programowners to pay. The bill was signed by Gov. Jay Inslee and went into effect July 2016.
�WSDOT stopped requiring backup documentation for non-airworthy aircraft requesting exemption from registration, as this was not required per Revised Code of Washington.
�WSDOT launched an online exemption request form to improve customer service and user-friendliness, and reduce administrative paperwork.
�WSDOT’s Aviation Division routed aircraft registration payments directly to WSDOT’s Accounting Division, centralizing the processing system and avoiding duplication.
�Accounting and Aviation staff received training on methods to increase efficiencies and communications.
Because this Lean project created policy changes and internal reorganization of duties, no costs were associated with this phase of the project. WSDOT has set aside funding for the final phase to redesign the current registration system by providing automated programs for customers to access their accounts and complete their registrations. WSDOT continues to review feedback and suggestions from customers for streamlining this program.
Washington state law requires that most airworthy general aviation aircraft be registered with WSDOT. Aircraft registration fees directly support WSDOT’s airport preservation, maintenance and improvement programs.
Capital improvement program prioritizes projects efficiently After the Statewide Capital Improvement Program (SCIP) submission window closed on October 31, 2016, WSDOT analyzed 480 projects valued at $441 million. WSDOT analyzed more than 500 airport projects totaling approximately $454 million during last year’s cycle. The SCIP helps WSDOT and the FAA prioritize projects at the state’s 135 public-use airports. The five-year list of prioritized projects helps WSDOT and the FAA better allocate resources and award grants, and increases the predictability, consistency and efficiency among airport authorities requesting funds.
WSDOT hosts joint planning conferences with the FAA and airport sponsors after projects are submitted. These conferences allow open discussion about projects, helping refine the airports’ project lists into an approved plan for each airport.
International) are inspected approximately every three years in order to update the Airport Master Record for the FAA.
Approximately every five years, WSDOT conducts a study to assess the relative condition of pavements for selected Washington state airports. Results from the prior 2012 study are featured in GNB 51, p. 8, and online at: bit.ly/WSDOTAviationPavement. Look for highlights from the upcoming 2017 pavement condition study in future editions of the Gray Notebook.
Aircraft registration program undergoes process improvementDuring the 2016 renewal cycle (November 2015 through February 2016), WSDOT registered 6,519 aircraft and provided 3,469 total exemptions to aircraft that qualified, reaching its goal of registering 95% of aircraft for the fifth consecutive year.
WSDOT undertook an innovative effort to improve this aircraft registration program after listening to customer feedback. The Aircraft Registration Lean Project has made the program more efficient, user-friendly and cost-effective.
WSDOT saved customers 3,239 hours during the 2016 renewal cycle by reducing the average time needed for non-airworthy aircraft to submit an exemption request from two hours to two minutes, a 98% reduction. There were 1,647 such aircraft owners requesting this type of exemption, amounting to 47% of all exemptions. There were 1,270 such cases in the 2015 renewal cycle.
Time spent processing all exemption request types also decreased for WSDOT staff after program improvements were made. The average time required to process any type of exemption request was reduced from 90 to 45 seconds, making 29 hours of staff time available for redeployment during the 2016 renewal cycle.
To streamline the program for customers and staff, the following changes were implemented:
�The Legislature passed a bill to eliminate escalating late-registration penalties in favor of a one-time, $100 late fee. Through the Lean process, WSDOT conducted a customer satisfaction survey and determined the previous penalty system was cumbersome to customers and staff. The prior system involved issuing escalating penalties over time, resulting in numerous notifications for staff to process and steep late penalties for aircraft
34 | GNB Edition 63 – September 30, 2016 Strategic goal: Preservation – Aviation
exercise to prepare the Pacific Northwest for a coordinated response to a major Cascadia Subduction Zone earthquake and resulting tsunami. The scenario simulated a 9.0 magnitude earthquake lasting 5-10 minutes, a 13-foot peak tsunami, and landslide incidents affecting areas from Canada to California. WSDOT integrated liaisons from Civil Air Patrol, Washington Military Department, Northwest Regional Aviation, Washington State Guard, Washington National Guard, Kansas Air National Guard, and NORTHCOM Joint Personnel Recovery Center. All participants operated within WSDOT’s Aviation Emergency Coordination Center alongside WSDOT staff serving as the state’s Air Operations Branch (AOB).
WSDOT focused on refining processes that support airport operations and the availability of critical aviation resources during a post-disaster response. WSDOT strengthened partnerships with aviation stakeholders critical to emergency response and recovery efforts. Major tasks accomplished included:
�Further training of staff positions within the state AOB
�Coordinating and reporting airfield damage assessments
�Coordinating airfield repairs
�Monitoring aviation-related resources at airports
�Strengthening emergency communications with the public
�Developing an all-hazards plan for state aviation operations during large-scale emergencies
Incorporating lessons learned from last year’s “Evergreen Tremor” exercise, WSDOT improved disaster response communications and equipment during “Cascadia Rising” by coordinating a mobile, high-bandwidth, satellite communications capability referred to as a Joint Incident Site Communications Capability through the Kansas Air National Guard. This preserves WSDOT’s ability to correspond via phone, internet and radio in situations when communications would normally deteriorate.
WSDOT continues to work with the FAA, Federal Emergency Management Agency, State Emergency Management Division, National Guard and other critical aviation partners to better prepare the state’s aviation system for the risks associated with a major event in the Cascadia Subduction Zone. An aviation exercise is scheduled for summer 2017 to further refine areas of improvement identified during “Cascadia Rising.”
Contributors include Eric Johnson, John Macarthur, Nisha Marvel, Matt Clark and Dan Davis
WSDOT’s Airport Investment Study leads to improved airport fundingThe Airport Investment Solutions Handbook was released in 2015 as the second and final phase of WSDOT’s Airport Investment Study, which identified $3.6 billion in needed investment and a $1.6 billion gap between needs and available funding over the coming 20 years. The new handbook proposed solutions to cover the state’s share—$8.4 million annually—of the current airport investment funding gap. Among the top solutions resulting from the study were:
1. Establish a state-sponsored revolving aviation infrastructure loan fund
2. Realign current transportation revenue allocations
3. Modify the state aircraft excise tax program
4. Develop a best management practices guidebook/toolkit for state airports
Of these solutions, modifying the state aircraft excise tax (Solution 3) has been implemented through legislative action. Approximately $637,000 in state aviation funding was reallocated to fund airport projects during the 2015-2017 biennium (see p. 31).
WSDOT is moving forward with Solution 4 by developing a best management practices guidebook/toolkit for state airports. The guidebook is planned to be available by summer 2018.
WSDOT is providing technical assistance to the Washington State Aviation Alliance (WSAA) as that group prepares proposals for the upcoming legislative session based on findings from the 2014 Airport Investment Study and the 2015 Airport Investment Solutions Handbook. WSDOT is also assisting WSAA to propose an increase to the cap for WSDOT Airport Aid Grants. The higher cap would enable the state to match the typical 5% share of larger federally-funded projects more often. It would also increase grant aid contributions to larger infrastructure preservation and improvement projects at smaller airports, decreasing the need to phase work over serval grant periods, thereby increasing the efficiency of both project implementation and grant administration.
“Cascadia Rising” exercise improves disaster responseIn June 2016, WSDOT led aviation partners from across the nation during “Cascadia Rising,” a multi-state, multi-agency
WSDOT’s Airport Investment Study sparks legislation
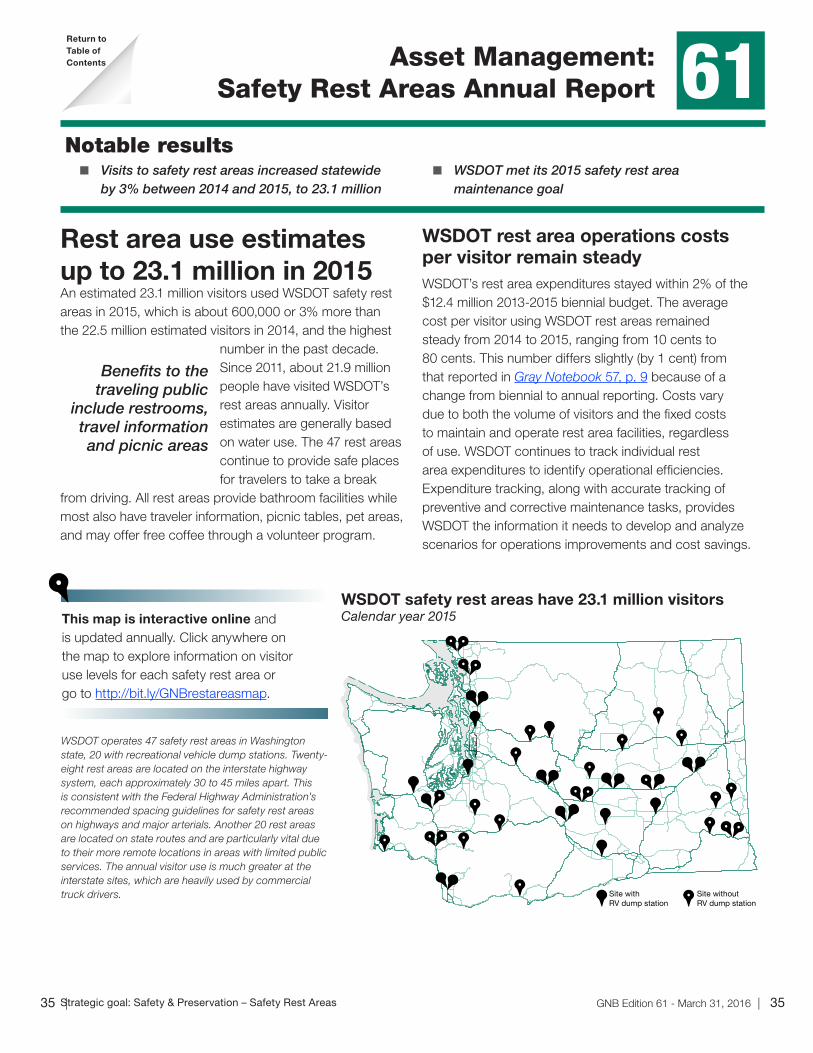
GNB Edition 61 - March 31, 2016 | 35Strategic goal: Safety & Preservation – Safety Rest Areas35 |
Asset Management:Safety Rest Areas Annual Report 61
WSDOT rest area operations costs per visitor remain steadyWSDOT’s rest area expenditures stayed within 2% of the $12.4 million 2013-2015 biennial budget. The average cost per visitor using WSDOT rest areas remained steady from 2014 to 2015, ranging from 10 cents to 80 cents. This number differs slightly (by 1 cent) from that reported in Gray Notebook 57, p. 9 because of a change from biennial to annual reporting. Costs vary due to both the volume of visitors and the fixed costs to maintain and operate rest area facilities, regardless of use. WSDOT continues to track individual rest area expenditures to identify operational efficiencies. Expenditure tracking, along with accurate tracking of preventive and corrective maintenance tasks, provides WSDOT the information it needs to develop and analyze scenarios for operations improvements and cost savings.
Rest area use estimates up to 23.1 million in 2015An estimated 23.1 million visitors used WSDOT safety rest areas in 2015, which is about 600,000 or 3% more than the 22.5 million estimated visitors in 2014, and the highest
number in the past decade. Since 2011, about 21.9 million people have visited WSDOT’s rest areas annually. Visitor estimates are generally based on water use. The 47 rest areas continue to provide safe places for travelers to take a break
from driving. All rest areas provide bathroom facilities while most also have traveler information, picnic tables, pet areas, and may offer free coffee through a volunteer program.
Notable results � Visits to safety rest areas increased statewide
by 3% between 2014 and 2015, to 23.1 million � WSDOT met its 2015 safety rest area
maintenance goal
Benefits to the traveling public
include restrooms, travel information and picnic areas
Site with RV dump station
Site without RV dump station
This map is interactive online and is updated annually. Click anywhere on the map to explore information on visitor use levels for each safety rest area or go to http://bit.ly/GNBrestareasmap.
WSDOT operates 47 safety rest areas in Washington state, 20 with recreational vehicle dump stations. Twenty-eight rest areas are located on the interstate highway system, each approximately 30 to 45 miles apart. This is consistent with the Federal Highway Administration’s recommended spacing guidelines for safety rest areas on highways and major arterials. Another 20 rest areas are located on state routes and are particularly vital due to their more remote locations in areas with limited public services. The annual visitor use is much greater at the interstate sites, which are heavily used by commercial truck drivers.
WSDOT safety rest areas have 23.1 million visitorsCalendar year 2015
Return toTable of Contents
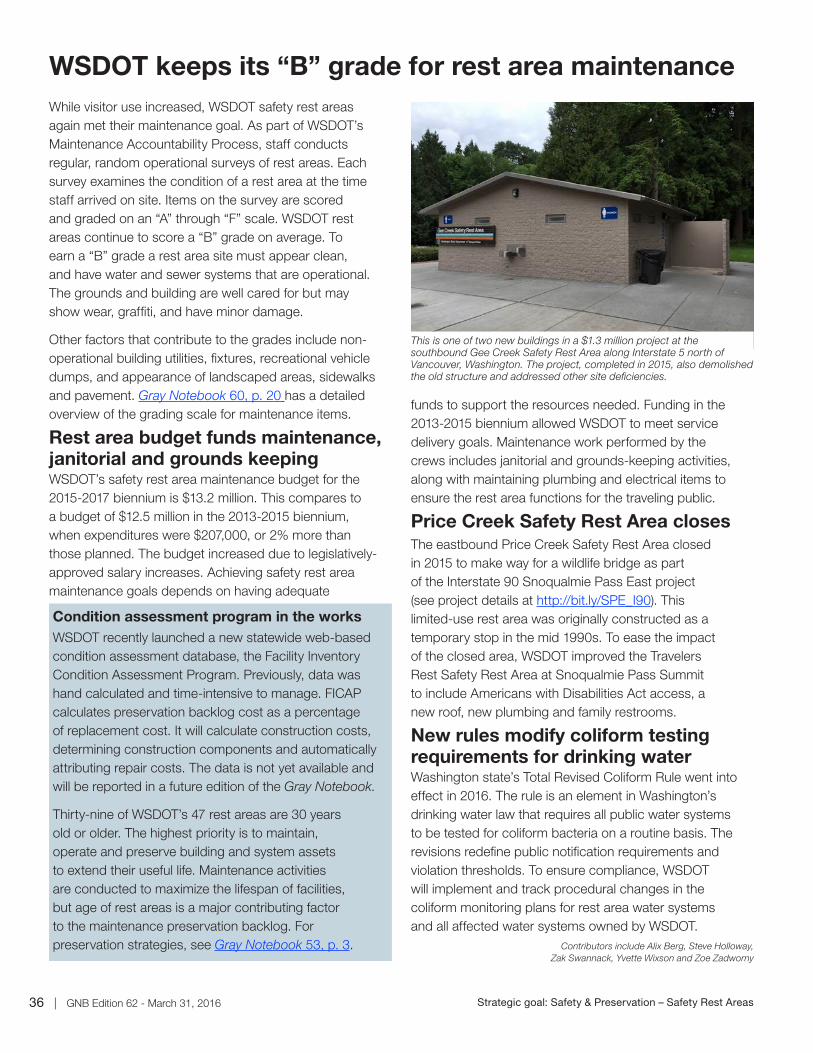
36 | GNB Edition 62 - March 31, 2016 Strategic goal: Safety & Preservation – Safety Rest Areas
WSDOT keeps its “B” grade for rest area maintenanceWhile visitor use increased, WSDOT safety rest areas again met their maintenance goal. As part of WSDOT’s Maintenance Accountability Process, staff conducts regular, random operational surveys of rest areas. Each survey examines the condition of a rest area at the time staff arrived on site. Items on the survey are scored and graded on an “A” through “F” scale. WSDOT rest areas continue to score a “B” grade on average. To earn a “B” grade a rest area site must appear clean, and have water and sewer systems that are operational. The grounds and building are well cared for but may show wear, graffiti, and have minor damage.
Other factors that contribute to the grades include non-operational building utilities, fixtures, recreational vehicle dumps, and appearance of landscaped areas, sidewalks and pavement. Gray Notebook 60, p. 20 has a detailed overview of the grading scale for maintenance items.
Rest area budget funds maintenance, janitorial and grounds keepingWSDOT’s safety rest area maintenance budget for the 2015-2017 biennium is $13.2 million. This compares to a budget of $12.5 million in the 2013-2015 biennium, when expenditures were $207,000, or 2% more than those planned. The budget increased due to legislatively-approved salary increases. Achieving safety rest area maintenance goals depends on having adequate
funds to support the resources needed. Funding in the 2013-2015 biennium allowed WSDOT to meet service delivery goals. Maintenance work performed by the crews includes janitorial and grounds-keeping activities, along with maintaining plumbing and electrical items to ensure the rest area functions for the traveling public.
Price Creek Safety Rest Area closesThe eastbound Price Creek Safety Rest Area closed in 2015 to make way for a wildlife bridge as part of the Interstate 90 Snoqualmie Pass East project (see project details at http://bit.ly/SPE_I90). This limited-use rest area was originally constructed as a temporary stop in the mid 1990s. To ease the impact of the closed area, WSDOT improved the Travelers Rest Safety Rest Area at Snoqualmie Pass Summit to include Americans with Disabilities Act access, a new roof, new plumbing and family restrooms.
New rules modify coliform testing requirements for drinking waterWashington state’s Total Revised Coliform Rule went into effect in 2016. The rule is an element in Washington’s drinking water law that requires all public water systems to be tested for coliform bacteria on a routine basis. The revisions redefine public notification requirements and violation thresholds. To ensure compliance, WSDOT will implement and track procedural changes in the coliform monitoring plans for rest area water systems and all affected water systems owned by WSDOT.
Contributors include Alix Berg, Steve Holloway, Zak Swannack, Yvette Wixson and Zoe Zadworny
Condition assessment program in the worksWSDOT recently launched a new statewide web-based condition assessment database, the Facility Inventory Condition Assessment Program. Previously, data was hand calculated and time-intensive to manage. FICAP calculates preservation backlog cost as a percentage of replacement cost. It will calculate construction costs, determining construction components and automatically attributing repair costs. The data is not yet available and will be reported in a future edition of the Gray Notebook.
Thirty-nine of WSDOT’s 47 rest areas are 30 years old or older. The highest priority is to maintain, operate and preserve building and system assets to extend their useful life. Maintenance activities are conducted to maximize the lifespan of facilities, but age of rest areas is a major contributing factor to the maintenance preservation backlog. For preservation strategies, see Gray Notebook 53, p. 3.
This is one of two new buildings in a $1.3 million project at the southbound Gee Creek Safety Rest Area along Interstate 5 north of Vancouver, Washington. The project, completed in 2015, also demolished the old structure and addressed other site deficiencies.
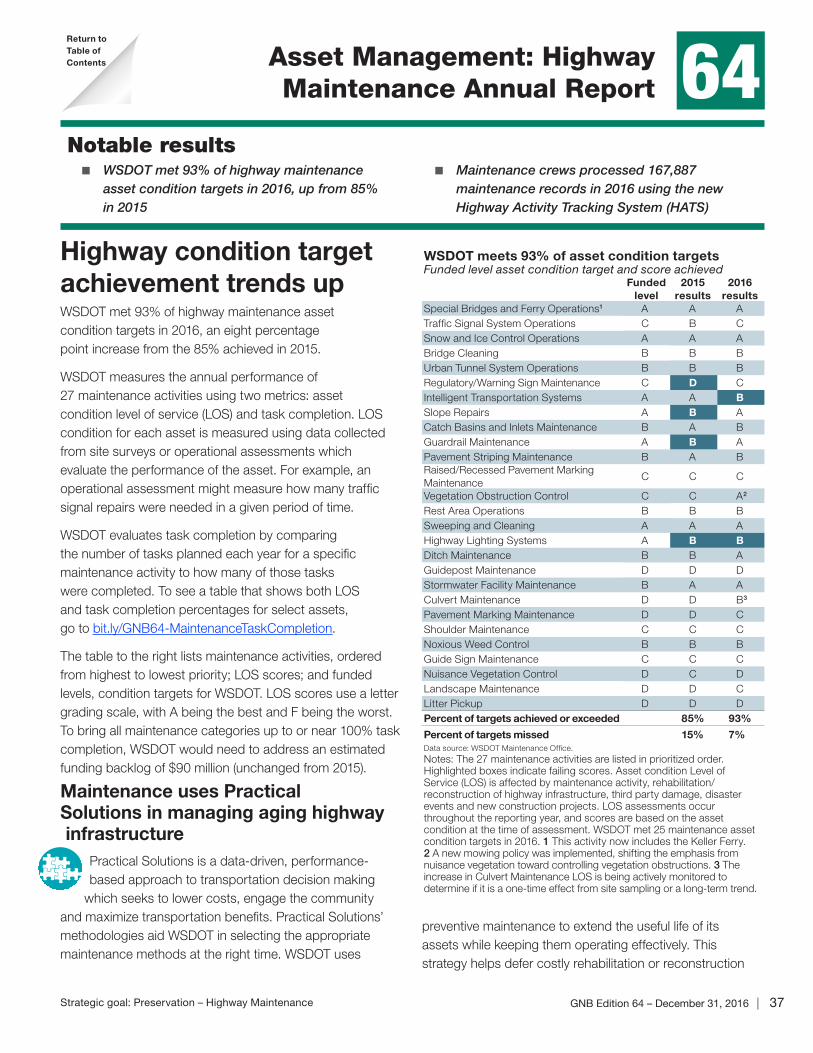
GNB Edition 64 – December 31, 2016 | 37Strategic goal: Preservation – Highway Maintenance
Asset Management: Highway Maintenance Annual Report 64
preventive maintenance to extend the useful life of its assets while keeping them operating effectively. This strategy helps defer costly rehabilitation or reconstruction
Highway condition target achievement trends upWSDOT met 93% of highway maintenance asset condition targets in 2016, an eight percentage point increase from the 85% achieved in 2015.
WSDOT measures the annual performance of 27 maintenance activities using two metrics: asset condition level of service (LOS) and task completion. LOS condition for each asset is measured using data collected from site surveys or operational assessments which evaluate the performance of the asset. For example, an operational assessment might measure how many traffic signal repairs were needed in a given period of time.
WSDOT evaluates task completion by comparing the number of tasks planned each year for a specific maintenance activity to how many of those tasks were completed. To see a table that shows both LOS and task completion percentages for select assets, go to bit.ly/GNB64-MaintenanceTaskCompletion.
The table to the right lists maintenance activities, ordered from highest to lowest priority; LOS scores; and funded levels, condition targets for WSDOT. LOS scores use a letter grading scale, with A being the best and F being the worst. To bring all maintenance categories up to or near 100% task completion, WSDOT would need to address an estimated funding backlog of $90 million (unchanged from 2015).
Maintenance uses Practical Solutions in managing aging highway infrastructure
Practical Solutions is a data-driven, performance-based approach to transportation decision making
which seeks to lower costs, engage the community and maximize transportation benefits. Practical Solutions’ methodologies aid WSDOT in selecting the appropriate maintenance methods at the right time. WSDOT uses
Notable results � WSDOT met 93% of highway maintenance
asset condition targets in 2016, up from 85% in 2015
� Maintenance crews processed 167,887 maintenance records in 2016 using the new Highway Activity Tracking System (HATS)
WSDOT meets 93% of asset condition targetsFunded level asset condition target and score achieved
Funded level
2015 results
2016 results
Special Bridges and Ferry Operations1 A A ATraffic Signal System Operations C B CSnow and Ice Control Operations A A ABridge Cleaning B B BUrban Tunnel System Operations B B BRegulatory/Warning Sign Maintenance C D CIntelligent Transportation Systems A A BSlope Repairs A B ACatch Basins and Inlets Maintenance B A BGuardrail Maintenance A B APavement Striping Maintenance B A BRaised/Recessed Pavement Marking Maintenance
C C C
Vegetation Obstruction Control C C A2
Rest Area Operations B B BSweeping and Cleaning A A AHighway Lighting Systems A B BDitch Maintenance B B AGuidepost Maintenance D D DStormwater Facility Maintenance B A ACulvert Maintenance D D B3
Pavement Marking Maintenance D D CShoulder Maintenance C C CNoxious Weed Control B B BGuide Sign Maintenance C C CNuisance Vegetation Control D C DLandscape Maintenance D D CLitter Pickup D D DPercent of targets achieved or exceeded 85% 93%
Percent of targets missed 15% 7%Data source: WSDOT Maintenance Office.
Notes: The 27 maintenance activities are listed in prioritized order. Highlighted boxes indicate failing scores. Asset condition Level of Service (LOS) is affected by maintenance activity, rehabilitation/reconstruction of highway infrastructure, third party damage, disaster events and new construction projects. LOS assessments occur throughout the reporting year, and scores are based on the asset condition at the time of assessment. WSDOT met 25 maintenance asset condition targets in 2016. 1 This activity now includes the Keller Ferry. 2 A new mowing policy was implemented, shifting the emphasis from nuisance vegetation toward controlling vegetation obstructions. 3 The increase in Culvert Maintenance LOS is being actively monitored to determine if it is a one-time effect from site sampling or a long-term trend.
Return toTable of Contents
38 | GNB Edition 64 – December 31, 2016 Strategic goal: Preservation – Highway Maintenance
WSDOT implements strategic bridge repair investmentsprojects. When the number of WSDOT preservation projects declines, maintenance activities must increase to care for aging assets. In conjunction with preservation activities and Practical Solutions, WSDOT is incorporating timely maintenance into an asset management plan which reflects the costs and benefits of assets.
Intelligent Traffic Systems (ITS) missed its target of A, receiving a B rating. WSDOT’s inventory of electrical infrastructure is both increasing and aging while maintenance has remained steady. This reduces WSDOT’s ability to complete necessary preventive maintenance, resulting in increased malfunctions over time. Continued copper wire theft translates to crews spending more time repairing damaged ITS systems and less time completing preventive maintenance.
Highway Lighting Systems missed its target of A, receiving a B rating. Highway Lighting Systems’ LOS is measured by the average number of repairs needed per lighting system and related electrical services during the year. Malfunctions in lower-priority lighting (compared to traffic signal system operations or ITS) can go for longer periods of time without causing significant impacts and are often deferred to accommodate increased workloads in other areas.
Strategic bridge preservation seeks to address funding shortfallWhile 91.2% of WSDOT bridges are in fair or better condition, the statewide bridge network faces several risks over the next 10 years (e.g., bridge scour, element deterioration, and seismic activity). Current and projected bridge preservation needs total $2.7 billion over the next 10 years, and planned preservation and maintenance funding is insufficient to meet this need. For a more comprehensive look at the condition of the statewide bridge network, risks and funding, see the Annual Bridge Report in Gray Notebook 62.
For the 2017-2019 biennium, WSDOT will employ a Practical Solutions strategy of performing approximately $5 million of small, cost-effective bridge repairs. Funding for these investments is made available by reallocating funds that could have been used for more capital intensive projects, such as rehabilitating bridge decks. Practical Solutions calls for the efficient delivery of projects with fewer resources,
and these small preservation activities allow WSDOT to cost-effectively maximize bridge performance until funding is available for critical bridge infrastructure work.
Workforce development continues with maintenance activity trackingThe Highway Activities Tracking System (HATS), a tool designed to support staff in documenting maintenance activities, has become integral in many maintenance tasks. Maintenance personnel can access HATS at the worksite via tablets and record information about field work as it is completed in real time. For example, as cable barrier inspections are performed, maintenance technicians can immediately record the data in the appropriate form. As the use of HATS is refined and employees become comfortable and proficient with the system, data entry times decrease, making WSDOT more effective and efficient at tracking maintenance activities.
During 2016, 59,211 existing features were added to asset inventories via HATS. During the same time period, maintenance crews created 167,887 HATS records with details of maintenance work completed. WSDOT employees are now averaging over 300 maintenance records entered per day statewide.
HATS has expanded capabilities compared to the previous maintenance tracking system, including improved accuracy and details for performance management data, as well as resources needed for task completion. The data collected is building a strong information baseline which can be leveraged by maintenance program managers to create a more efficient and effective program. By better understanding the current condition of highway assets and the impact maintenance has, program managers will be better equipped to target maintenance activities where they are most needed and effective.
Contributors include Rico Baroga, Kelly Shields, Todd Lamphere and Zach Mason
WSDOT completes 100% of cable barrier inspections in 2016Cable barrier inspections are an important subset of the Guardrail Maintenance activity. Cable barriers help prevent vehicles from crossing over medians. To remain effective, cable barriers must be regularly inspected to ensure proper tensioning. To view the interactive map of cable barrier inspections, visit bit.ly/GNBcablebarriermap.
| 39Multimodal Asset Performance Report Information Guide
Americans with Disabilities Act information for the publicAccommodation requests for people with disabilities can be made by contacting the WSDOT Diversity/ADA Affairs team at [email protected] or by calling toll-free, 855-362-4ADA (4232). Persons who are deaf or hard of hearing may make a request by calling the Washington State Relay at 711.
Civil Rights Act of 1964, Title VI Statement to the PublicIt is the Washington State Department of Transportation’s policy to assure that no person shall, on the grounds of race, color, national origin, or sex, as provided by Title VI of the Civil Rights Act of 1964, be excluded from participation in, be denied the benefits of, or be otherwise subjected to discrimination under any of its federally funded programs and activities. Any person who believes his/her Title VI protection has been violated may file a complaint with WSDOT’s Office of Equal Opportunity. For additional information regarding Title VI complaint procedures and/or information regarding our non-discrimination obligations, contact OEO’s Title VI Coordinator at (360) 705-7082.
The Multimodal Asset Management Report is prepared by theOffice of Strategic Assessment and Performance Analysis Washington State Department of Transportation 310 Maple Park Ave SE, Olympia, WA 98504
© 2016 WSDOT. All rights reserved.
Calendar, fiscal and federal fiscal quarters
Jan Feb Mar Apr May Jun Jul Aug Sep Oct Nov Dec
GNB 61 GNB 62 GNB 63 GNB 64
Q1 2016 Q2 2016 Q3 2016 Q4 2016
Q3 FY2016 Q4 FY2016 Q1 FY2017 Q2 FY2017
Q2 FFY2016 Q3 FFY2016 Q4 FFY2016 Q1 FFY2017
2015-2017 biennial quarters
Period Quarter Period Quarter
Jul – Sep 2015 Q1 Jul – Sep 2016 Q5
Oct – Dec 2015 Q2 Oct – Dec 2016 Q6
Jan – Mar 2016 Q3 Jan – Mar 2017 Q7
Apr – Jun 2016 Q4 Apr – Jun 2017 Q8
Notes: A calendar year begins January 1 and ends December 31. Washington state’s fiscal year begins July 1 and ends June 30. The federal fiscal year begins October 1 and ends September 30. Biennia begin July 1 and end two years later on June 30.
Understanding reporting periodsWSDOT programs report their performance data during different periods to best fit the work they do. For example, a program that receives substantial federal funds may report performance based on the federal fiscal year.
Asset Performance Report Information Guide


![Monitoria multimodal cerebral multimodal monitoring[2]](https://static.fdocuments.us/doc/165x107/552957004a79599a158b46fd/monitoria-multimodal-cerebral-multimodal-monitoring2.jpg)