Brookfield Asset Management/media/Files/B/BrookField...Brookfield Asset Management | Q3 /2009...
50
SUPPLEMENTAL INFORMATION FOR THE QUARTER ENDED SEPTEMBER 30, 2009 Brookfield Asset Management CONTENTS Page Part 1 Introduction 2 Part 2 Performance Review 3 Part 3 Capitalization and Liquidity 36 Part 4 Supplemental Information 44 The information in this Supplemental Information (“Supplemental”) should be read in conjunction with the Corporation’s most recently issued Annual Report. The Annual Report and additional information, including the Corporation’s Annual Information Form, is available on the Corporation’s web site at www.brookfield.com and on SEDAR’s web site at www.sedar.com. www.brookfield.com NYSE: BAM TSX: BAM.A EURONEXT: BAMA
Transcript of Brookfield Asset Management/media/Files/B/BrookField...Brookfield Asset Management | Q3 /2009...
SUPPLEMENTAL INFORMATION FOR THE QUARTER ENDED SEPTEMBER 30, 2009
Brookfield Asset Management
CONTENTS Page
Part 1 Introduction 2
Part 2 Performance Review 3
Part 3 Capitalization and Liquidity 36
Part 4 Supplemental Information 44
The information in this Supplemental Information (“Supplemental”) should be read in conjunction with the Corporation’s most recently issued Annual Report. The Annual Report and additional information, including the Corporation’s Annual Information Form, is available on the Corporation’s web site at www.brookfield.com and on SEDAR’s web site at www.sedar.com.
www.brookfield.com NYSE: BAM TSX: BAM.A EURONEXT: BAMA
Brookfield Asset Management | Q3 /2009 Supplemental Information2
PART 1 – INTRODUCTIONThe information in this Supplemental Information (“Supplemental”) should be read in conjunction with the most recently issued Annual Report of the company. The Annual Report, and additional information, including the company’s Annual Information Form, is available on the Corporation’s web site at www.brookfield.com and on SEDAR’s web site at www.sedar.com.
Business OverviewBrookfield is a global asset management company, with a primary focus on property, power and infrastructure assets. We have established leading operating platforms in these sectors and, through them, own and manage a broad portfolio of high quality assets that generate long-term cash flows and opportunities to create value for us and our partners. Our objective is to increase, over time, the cash flows generated from the capital that we have invested in these businesses as well as the income earned by managing them for our partners. Part 5 of the Management’s Discussion and Analysis of Financial Results (“MD&A”) in our 2008 Annual Report describes our Business Strategy in further detail.
Basis Of PresentatiOnWe have organized this Supplemental on a basis that is consistent with how we operate the business. We organize our activities into a Corporate Group and individual Operating Platforms which focus on specific business segments. We segregate our financial results between Asset Management (i.e., what we earn as the manager of the assets or operations) and Operations (i.e., what we earn as an investor in the assets or operations). We also segregate our financial results and our assets, liabilities and capital by Operating Platform. Operating Platforms include commercial properties, renewable power generation, infrastructure, development and other properties and specialty funds. We also have an investment management group which manages fixed income and equity securities on behalf of institutional clients. The results of the investment management activities are included within our Asset Management segment, along with the asset management activities associated with the Operating Platforms, including property management services, as well as investment banking services.
We present invested capital and operating cash flows on a “total” basis, which is similar to our consolidated financial statements and a “net” basis which represents our pro rata interest in the underlying net assets and cash flows. The net basis includes the operations of the company and Brookfield Properties Corporation (“Brookfield Properties”) collectively, and is presented on a deconsolidated basis meaning that assets are presented net of associated liabilities and non-controlling interests. Similarly, cash flows are presented net of carrying charges associated with related liabilities and cash flow attributable to related non-controlling interests such as minority shareholders and investment partners. Net invested capital and net operating cash flows, in our view, represent a more consistently comparable basis of presentation than our consolidated financial statements which include the operations conducted through subsidiary or affiliated entities under various methods, including equity accounting, proportionate consolidation and full consolidation.
We provide reconciliations between the basis of presentation in this Supplemental and our consolidated financial statements. In particular, we reconcile operating cash flow and net income on page 8. The tables on pages 45 to 47 provide a reconciliation between our consolidated financial statements and the basis of presentation used herein.
Unless the context indicates otherwise, references in this Supplemental to the “Corporation” refer to Brookfield Asset Management Inc., and references to “Brookfield,” “the company,” “we,” “us” and “our” refer to the Corporation and its direct and indirect subsidiaries and consolidated entities. All financial data included in the Supplemental has been prepared in accordance with Canadian generally accepted accounting principles (“GAAP”) and specified non-GAAP measures unless otherwise noted. All figures are presented in U.S. dollars, unless otherwise noted.

Brookfield Asset Management | Q3 /2009 Supplemental Information 3
Part 2 – PERFORMANCE REVIEW
summaryHighlights of the third quarter included the following:
• Operating cash flow totalled $520 million for the third quarter of 2009, or $0.88 per share, compared with $355 million or $0.58 per share in the third quarter of 2008.
• We generated additional capital of $8 billion since the end of the second quarter, bringing the year-to-date total to $12 billion.
- Financings and asset monetizations in the quarter totalled $1.8 billion, including the issuance to co-investors of $800 million of common and preferred share equity in our North American property operations and the monetization of a 49.9% interest in our directly held Canadian renewable power facilities for a further $500 million.
- New co-investor capital pledges and commitments totalled $7 billion, including a $4 billion real estate turnaround consortium, a $1.2 billion debtor-in-possession fund and a $260 million Columbian infrastructure fund.
• We invested $900 million for future value creation in a variety of initiatives, including our participation in the issuance of common shares in our North American property operations, and the expansion of our Canadian renewable power fund.
Subsequent to quarter-end, we announced a recapitalization plan for Babcock & Brown Infrastructure (“BBI”), a listed Australian infrastructure company that owns interests in A$8 billion of diversified high quality global infrastructure assets. The recapitalization involved a $1.8 billion capital raising arranged by us, of which we committed to invest $1.1 billion. The recapitalization is subject to a shareholder vote on November 16, 2009. To fund part of our commitment, we recently completed a $950 million equity issue in Brookfield Infrastructure Partners, of which we purchased our participation of approximately $435 million and other shareholders purchased $515 million.
The following table summarizes our underlying values, net invested capital and net operating cash flows from our operations for the third quarter of 2009 and 2008:
Underlying Value 1 Net Invested Capital 2
Net Operating
Cash Flow 2
AS AT AND FOR THE THREE MONTHS ENDED
(MIllIONS, EXCEPT PER SHARE AMOUNTS)
Dec. 31
2008
Sept. 30
2009
Dec. 31
2008
Sept. 30
2009
Sept. 30
2008
Asset management income $ 157 $ 109Operating platforms
Commercial properties $ 7,485 $ 5,451 $ 4,575 176 $ 272
Renewable power generation 6,639 1,182 1,215 387 106
Infrastructure 974 745 761 9 27
Development and other properties 3,313 4,315 3,334 54 62
Specialty funds 903 992 870 14 (9)
Investments 701 656 704 (20) 3
Cash and financial assets 1,073 1,503 1,073 85 178
Other assets 2,650 3,054 2,551 — —
$ 23,738 $ 17,898 $ 15,083 $ 862 $ 748
Liabilities
Corporate borrowings/interest $ 2,284 $ 2,209 2,284 $ 40 $ 41
Subsidiary borrowings/interest 733 786 733 22 18
Capital securities/interest 1,425 1,616 1,425 23 23
Other liabilities/operating expenses 3,267 2,848 2,654 184 161
7,709 7,459 7,096 269 243
Capitalization
Co-investor interests in operations2 3,228 3,044 2,206 73 150
Shareholders’ equity/operating cash flow 12,801 7,395 5,781 520 355
16,029 10,439 7,987 593 505$ 23,738 $ 17,898 $ 15,083 $ 862 $ 748
Per share– including future tax liability $ 20.62 $ 11.32 $ 8.92 $ 0.88 $ 0.58
– excluding future tax liability $ 24.32
1 Prepared using procedures and processes expected to be followed in preparing IFRS financial statements2 Includes the operations of Brookfield Properties Corporation
Brookfield Asset Management | Q3 /2009 Supplemental Information4
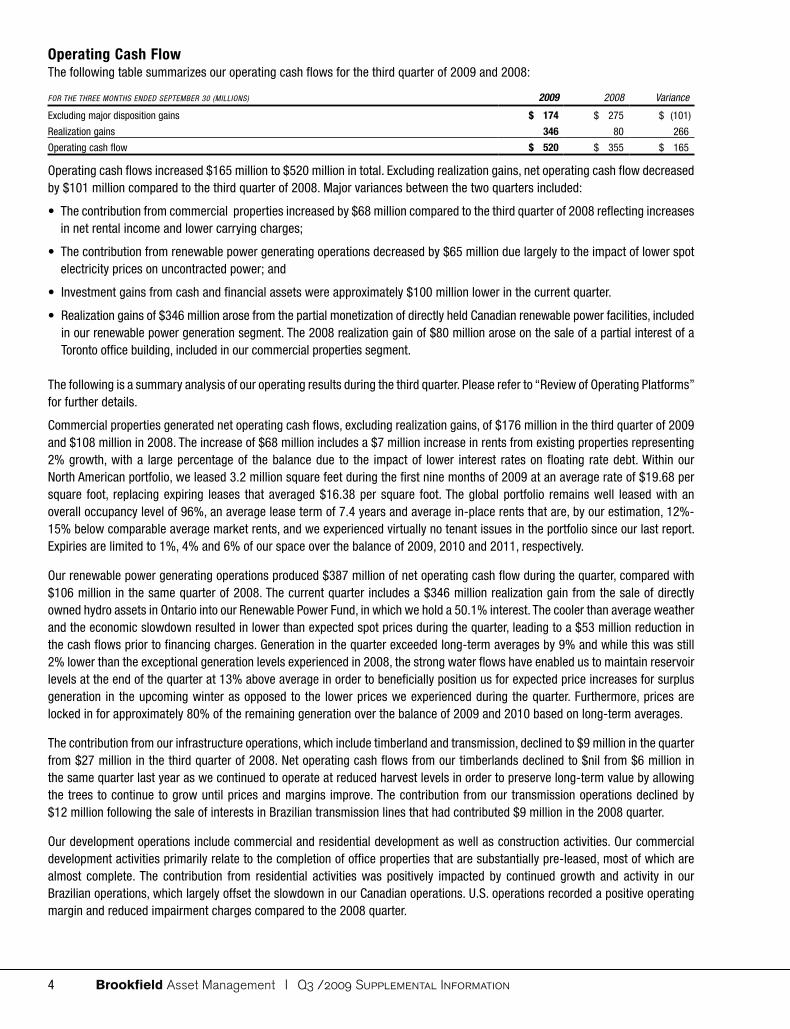
Operating Cash FlowThe following table summarizes our operating cash flows for the third quarter of 2009 and 2008:
FOR THE THREE MONTHS ENDED SEPTEMBER 30 (MIllIONS) 2009 2008 Variance
Excluding major disposition gains $ 174 $ 275 $ (101)
Realization gains 346 80 266
Operating cash flow $ 520 $ 355 $ 165
Operating cash flows increased $165 million to $520 million in total. Excluding realization gains, net operating cash flow decreased by $101 million compared to the third quarter of 2008. Major variances between the two quarters included:
• The contribution from commercial properties increased by $68 million compared to the third quarter of 2008 reflecting increases in net rental income and lower carrying charges;
• The contribution from renewable power generating operations decreased by $65 million due largely to the impact of lower spot electricity prices on uncontracted power; and
• Investment gains from cash and financial assets were approximately $100 million lower in the current quarter.
• Realization gains of $346 million arose from the partial monetization of directly held Canadian renewable power facilities, included in our renewable power generation segment. The 2008 realization gain of $80 million arose on the sale of a partial interest of a Toronto office building, included in our commercial properties segment.
The following is a summary analysis of our operating results during the third quarter. Please refer to “Review of Operating Platforms” for further details.
Commercial properties generated net operating cash flows, excluding realization gains, of $176 million in the third quarter of 2009 and $108 million in 2008. The increase of $68 million includes a $7 million increase in rents from existing properties representing 2% growth, with a large percentage of the balance due to the impact of lower interest rates on floating rate debt. Within our North American portfolio, we leased 3.2 million square feet during the first nine months of 2009 at an average rate of $19.68 per square foot, replacing expiring leases that averaged $16.38 per square foot. The global portfolio remains well leased with an overall occupancy level of 96%, an average lease term of 7.4 years and average in-place rents that are, by our estimation, 12%-15% below comparable average market rents, and we experienced virtually no tenant issues in the portfolio since our last report. Expiries are limited to 1%, 4% and 6% of our space over the balance of 2009, 2010 and 2011, respectively.
Our renewable power generating operations produced $387 million of net operating cash flow during the quarter, compared with $106 million in the same quarter of 2008. The current quarter includes a $346 million realization gain from the sale of directly owned hydro assets in Ontario into our Renewable Power Fund, in which we hold a 50.1% interest. The cooler than average weather and the economic slowdown resulted in lower than expected spot prices during the quarter, leading to a $53 million reduction in the cash flows prior to financing charges. Generation in the quarter exceeded long-term averages by 9% and while this was still 2% lower than the exceptional generation levels experienced in 2008, the strong water flows have enabled us to maintain reservoir levels at the end of the quarter at 13% above average in order to beneficially position us for expected price increases for surplus generation in the upcoming winter as opposed to the lower prices we experienced during the quarter. Furthermore, prices are locked in for approximately 80% of the remaining generation over the balance of 2009 and 2010 based on long-term averages.
The contribution from our infrastructure operations, which include timberland and transmission, declined to $9 million in the quarter from $27 million in the third quarter of 2008. Net operating cash flows from our timberlands declined to $nil from $6 million in the same quarter last year as we continued to operate at reduced harvest levels in order to preserve long-term value by allowing the trees to continue to grow until prices and margins improve. The contribution from our transmission operations declined by $12 million following the sale of interests in Brazilian transmission lines that had contributed $9 million in the 2008 quarter.
Our development operations include commercial and residential development as well as construction activities. Our commercial development activities primarily relate to the completion of office properties that are substantially pre-leased, most of which are almost complete. The contribution from residential activities was positively impacted by continued growth and activity in our Brazilian operations, which largely offset the slowdown in our Canadian operations. U.S. operations recorded a positive operating margin and reduced impairment charges compared to the 2008 quarter.
Brookfield Asset Management | Q3 /2009 Supplemental Information 5
Specialty funds contributed $14 million, compared to a cash outflow of $9 million in 2008. Our restructuring business benefitted from government incentives recently put into place to promote energy efficiency initiatives, which offset losses related to industrial businesses in the U.S. housing industry.
The contribution from our cash and financial assets declined to $85 million in the recent quarter compared to $178 million in the third quarter of 2008 due to a lower level of investment gains. Interest charges at the corporate level were lower during the quarter due to declines in floating rates, although the effect is relatively modest because most of our debt is fixed rate.
Balance Sheet and Liquidity
We provide a summary of changes in our financial position, capitalization and liquidity in this section. For further information please refer to the “Review of Operating Platforms” and “Capitalization and Liquidity”.
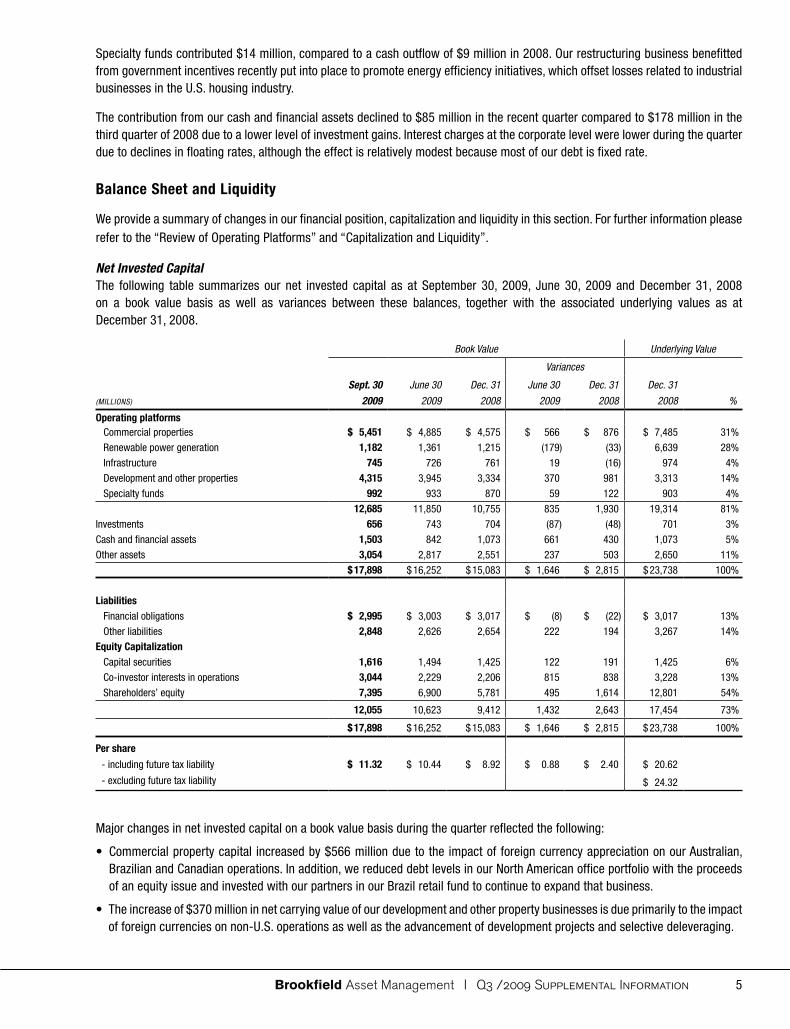
Net Invested CapitalThe following table summarizes our net invested capital as at September 30, 2009, June 30, 2009 and December 31, 2008 on a book value basis as well as variances between these balances, together with the associated underlying values as at December 31, 2008.
Book Value Underlying Value
Variances
(MIllIONS)
Sept. 30
2009
June 30
2009
Dec. 31
2008
June 30
2009
Dec. 31
2008
Dec. 31
2008 %
Operating platforms Commercial properties $ 5,451 $ 4,885 $ 4,575 $ 566 $ 876 $ 7,485 31%
Renewable power generation 1,182 1,361 1,215 (179) (33) 6,639 28%
Infrastructure 745 726 761 19 (16) 974 4%
Development and other properties 4,315 3,945 3,334 370 981 3,313 14%
Specialty funds 992 933 870 59 122 903 4%12,685 11,850 10,755 835 1,930 19,314 81%
Investments 656 743 704 (87) (48) 701 3%
Cash and financial assets 1,503 842 1,073 661 430 1,073 5%
Other assets 3,054 2,817 2,551 237 503 2,650 11%$ 17,898 $ 16,252 $ 15,083 $ 1,646 $ 2,815 $ 23,738 100%
Liabilities Financial obligations $ 2,995 $ 3,003 $ 3,017 $ (8) $ (22) $ 3,017 13%
Other liabilities 2,848 2,626 2,654 222 194 3,267 14%Equity Capitalization Capital securities 1,616 1,494 1,425 122 191 1,425 6%
Co-investor interests in operations 3,044 2,229 2,206 815 838 3,228 13%
Shareholders’ equity 7,395 6,900 5,781 495 1,614 12,801 54%
12,055 10,623 9,412 1,432 2,643 17,454 73%
$ 17,898 $ 16,252 $ 15,083 $ 1,646 $ 2,815 $ 23,738 100%
Per share
- including future tax liability $ 11.32 $ 10.44 $ 8.92 $ 0.88 $ 2.40 $ 20.62
- excluding future tax liability $ 24.32
Major changes in net invested capital on a book value basis during the quarter reflected the following:
• Commercial property capital increased by $566 million due to the impact of foreign currency appreciation on our Australian, Brazilian and Canadian operations. In addition, we reduced debt levels in our North American office portfolio with the proceeds of an equity issue and invested with our partners in our Brazil retail fund to continue to expand that business.
• The increase of $370 million in net carrying value of our development and other property businesses is due primarily to the impact of foreign currencies on non-U.S. operations as well as the advancement of development projects and selective deleveraging.

Brookfield Asset Management | Q3 /2009 Supplemental Information6
• Cash and financial assets increased by $661 million due primarily to proceeds from equity issuances within our North American property business and Canadian Renewable Power operations.
• Other assets and liabilities increased by $237 million and $222 million, respectively, primarily due to stronger currencies on our foreign denominated working capital balances.
• Equity capitalization increased by $1.4 billion. We issued $519 million of common equity and C$288 million of preferred equity to co-investors from our North American office business, which contributed to the $815 million increase in co-investor interests. Net income during the period and currency appreciation, offset by dividends, added a further $600 million.
Underlying Values and International Financial Reporting Standards (“IFRS”)We utilize underlying values of our business throughout the Supplemental. These values have been prepared using the procedures and assumptions that we intend to follow in preparing our pro-forma opening balance sheet for our adoption of IFRS, under which we intend to report our financial results commencing in 2010, and are as at December 31, 2008, with the anticipated date of our opening balance sheet for IFRS adoption being January 1, 2009. Please refer to the MD&A in our 2008 Annual Report for more information.
We are required to adopt IFRS reporting beginning in 2011, however we have chosen to begin reporting on this basis in 2010 because we believe that it provides a more relevant basis of presentation of our financial results than U.S. or Canadian generally accepted accounting principles and it is generally consistent with how we measure our performance internally and for our asset management clients. We already utilize IFRS reporting in many of our operations and it is already implemented throughout almost all of the other regions in which we operate.
The underlying values reflect most, but not all, of our tangible assets at fair value as at that date, with corresponding adjustments to minority interests and shareholders’ equity, but do not include any upward revaluation of land and other inventories to reflect current value nor have we adjusted the carrying values of our borrowings positively or negatively at this time. Furthermore, the underlying values are reduced by accounting provisions that reflect a theoretical tax liability that might arise if we were to liquidate the business based on the underlying values in the balance sheet at that date, consistent with IFRS accounting principles. Our intention, however, is to hold most of these assets for an extended period of time or at least plan our affairs to minimize the amount of tax paid compared with this theoretical calculation. Accordingly, we present underlying values including and excluding this liability.
The following table reconciles our Canadian GAAP common share equity as at December 31, 2008 to our underlying values based on IFRS calculations at that date. The table also identifies our estimate of the value of certain assets that are not carried at fair value for IFRS purposes, such as land inventories. In addition, we have experienced significant changes in currency values during the first nine months of 2009 and we have provided an internal estimate of the impact of these changes, together with cash flow generated thus far in 2009, excluding realization gains.
(MIllIONS, EXCEPT PER SHARE AMOUNTS) Total Per Share
Book value per share under historical accounting at December 31, 2008 $ 4,911 $ 8.92Add: Underlying value adjustments to bring some, but not all of our assets to appraisal value 9,240 15.39
Underlying value as at December 31, 2008 14,151 24.31
Add: Estimated excess value of assets over book value that are not included within the
IFRS fair value framework (such as historical cost land and other inventories)1 1,500 2.50
Adjusted underlying value as at December 31, 2008 15,651 26.81
Add: Increase due to cash flows and currency movements during the nine months ended September 30, 20091 1,800 3.00
Underlying value - as adjusted $ 17,451 $ 29.81
1 Management estimate
As mentioned above, the foregoing table reflects Internal Rate of Return (“IRR”) assumptions, such as discount and capitalization rates, as at December 31, 2008. While we believe that the assumptions used at that time are appropriate, we also recognize that IRR’s will vary in different circumstances. For example, on a liquidation basis in the less liquid markets that we have experienced in recent months, the IRR rates could be higher (and the valuations lower). Correspondingly, if you believe that a company should be valued as a going concern in a normal market at the value that buyers and sellers would transact, then the IRR rates would likely be lower (and valuations higher), which is consistent with our prior experience.
Brookfield Asset Management | Q3 /2009 Supplemental Information 7
For reference in this regard, a 100 basis point change to the IRR’s for our commercial office and renewable power businesses would add or subtract approximately $1.5 billion or $2.50 per share on a pre-tax basis to the values presented in the table above.
We also note that the table summarizes the tangible values of our business, but does not include any additional intrinsic values, nor does it assume we grow or utilize our franchise to invest capital in the future.
CapitalizationOur capitalization is relatively unchanged over the third quarter and since the beginning of the year. Debt levels are nearly equal to those at the beginning of the year on both a deconsolidated basis and on a net invested basis. Meanwhile, the book value of our equity capitalization has increased by $2.6 billion on a net invested basis since January 1st of this year and by $1.7 billion on a deconsolidated basis over the same period. We believe that our underlying values have increased by at least this much over the first nine months of the year with the result that our current deconsolidated debt to total capitalization ratio has improved from the 15% ratio at the beginning of 2009. Our proportionate debt-to-total-capitalization ratio was 44% at the beginning of the year and we believe that it also has improved as a result of increases in underlying values and lower debt levels.
LiquidityWe completed a number of capital raising initiatives to date in 2009, including public issuances of common and preferred equity, debt securities and capital for managed funds. These initiatives have generated a total of $12 billion, of which $7 billion was completed during the third quarter. Core liquidity at the Corporation and our major operating platforms totalled $3.8 billion at quarter end, substantially higher than historical levels. In addition, we have a total of $6.7 billion of uninvested capital allocated by investors to our various mandates for total capital of $10.5 billion that could potentially be deployed into new investment opportunities.
Subsequent to the third quarter we also completed two additional equity issues, one in Brookfield Infrastructure Partners, and one in our Brazilian residential business that together raised a further $1.2 billion, of which we purchased $435 million. These issues further bolstered our liquidity and in the case of Brookfield Infrastructure, represented $950 million of the capital necessary to fund our $1.1 billion commitment to the $1.8 billion restructuring of Babcock & Brown Infrastructure that we have sponsored. We raised $560 million of the remaining capital required to complete the restructuring in the third quarter through an Australian public offering and the cash is being held in escrow awaiting closing of the transaction.
Highlights during the quarter included:
Equity Issues
• $1,300 million of common and preferred shares issued by Brookfield Properties (we subscribed for $519 million of common shares); and
• $690 million of common equity issued by Brookfield Renewable Power Fund (we subscribed for $345 million).
Managed funds and investment consortiums
• $5 billion of equity capital allocations to the Brookfield Global Real Estate Turnaround Consortium (we have allocated $1 billion);
• $1.3 billion of capital allocations to a Debtor-in-Possession fund (we have allocated $185 million);
• $260 million towards a $360 million Columbia Infrastructure Fund (we have committed $50 million); and
• We secured the mandate to launch a $500 million Peru Infrastructure Fund.
Debt Financings
• We completed an additional $750 million of public and private debt financings including mortgage bonds and corporate financings.

Brookfield Asset Management | Q3 /2009 Supplemental Information8
Asset Management ActivitiesThe following table presents key metrics relating to our asset management activities over the third quarter of 2009 and 2008:
(MIllIONS) 2009 2008 Variance
Asset management revenues (for the three months ended September 30) $ 157 $ 109 $ 48
Third-party capital allocations (as at September 30 and December 31)
– Unlisted fund and specialty issuers $ 14,389 $ 9,174 $ 5,215– Public securities 23,058 18,040 5,018
$ 37,447 $ 27,214 $ 10,233
Asset management income increased by $48 million from the 2008 quarter. Property service fees increased by $35 million reflecting the acquisition of property service businesses in the U.S. and Australia. Asset management fees increased by $13 million due to higher base management fees as well as an increase in transaction fees.
We continued to expand our asset management activities during the quarter. Capital allocations from third-party clients increased by $10.2 billion since year-end and totalled $37.4 billion at the end of the quarter. Allocations to our unlisted funds and specialty issuers increased by $5.2 billion as new mandates focused on distressed real estate opportunities, infrastructure and debtor-in-possession lending were formed in the quarter. The majority of allocations are earmarked for specialized mandates intended to capitalize on opportunities arising from the current economic downturn. Public securities under management increased by $5.0 billion, of which $3.9 billion related to higher market values and $1.1 billion to new mandates.
We provide additional information on our asset management activities beginning on page 27.
Net IncomeThe following table presents net income for the third quarter of 2009 and 2008 determined in accordance with GAAP. We do not utilize GAAP net income as a key metric in assessing the performance of our business because, in our view, it contains measures that may distort the ongoing performance and intrinsic value of the underlying operations. Nevertheless we recognize the importance of net income as a key measure for many users and provide a discussion of net income and a reconciliation to operating cash flow.
Net 1
FOR THE THREE MONTHS ENDED SEPTEMBER 30 (MIllIONS) 2009 2008 Variance
Operating cash flow and gains $ 520 $ 355 $ 165
Non-cash items
Depreciation and amortization (180) (202) 22
Equity accounted results — (11) 11
Future income taxes (103) (36) (67)Net income excluding revaluation and other items 237 106 131
Revaluation and other items, net of tax (125) 65 (190)
Net income $ 112 $ 171 $ (59)
Per share $ 0.17 $ 0.27 $ (0.10)
1 Net of non-controlling and associated minority interests
Net income prior to the impact of revaluation and other items was $237 million compared to $106 million in the third quarter of 2008. As discussed earlier, operating cash flow and gains increased by $165 million. Depreciation declined in the quarter due to lower levels of depletion expense reflecting lower harvest levels in our timber operations and a lower level of intangible assets that are amortized. Future income taxes in each quarter include provisions of $105 million and $32 million, respectively, in respect of realization gains.
Revaluation and other items include $44 million of mark-to-market adjustments on hedging and forward sale arrangements relating to physical assets that are not themselves marked-to-market for accounting purposes, $60 million of adjustments to the carrying value of certain development assets to reflect lower recoverable values and $30 million of provisions arising from the restructuring of an investment in the pulp and paper sector. These items are offset by corresponding tax benefits of $32 million. The 2008 results included meaningful gains from the fair valuing of certain power sales agreements. We provide additional information on net income beginning on page 32.
Brookfield Asset Management | Q3 /2009 Supplemental Information 9
OutlookIn the short term, we remain focused on maintaining strong liquidity levels and increasing third party capital allocations. The current economic environment may result in continued downward pressure on operating margins and our ability to record investment gains. We believe, however, that our approach to business protects us in this environment because many of our revenue streams are contractually supported and our financings are largely long-term and fixed rate in nature. Furthermore, our businesses that are shorter duration in nature have already experienced declines and we believe are gradually entering a recovery phase.
As a result, we believe that our businesses are well positioned to not only withstand the difficult current environment but to also invest and build for the future. This provides us with confidence that we will meet our long-term performance objectives with respect to cash flow growth and value creation, and continue to build Brookfield as a world-class asset manager.

Brookfield Asset Management | Q3 /2009 Supplemental Information10
review Of OPerating PlatfOrms
Commercial PropertiesThe following table summarizes the invested capital and operating cash flows contributed by our commercial property operations:
Invested Capital Operating Cash Flow
Total Net Total Net
AS AT AND FOR THE THREE MONTHS ENDED
(MIllIONS)
Sept. 30
2009
Dec. 31
2008
Sept. 30
2009
Dec. 31
2008
Sept. 30
2009
Sept. 30
2008
Sept. 30
2009
Sept. 30
2008
Office properties $ 21,077 $ 19,657 $ 5,285 $ 4,485 $ 406 $ 398 $ 176 $ 119Retail properties 1,761 1,326 166 90 34 41 — (11)
Realization gains — — — — — 164 — 164$ 22,838 $ 20,983 $ 5,451 $ 4,575 $ 440 $ 603 $ 176 $ 272
Underlying value $ 23,877 $ 7,485
Our commercial property operations contributed net operating cash flow of $176 million in the third quarter of 2009 compared to $108 million in the third quarter of 2008. The 2008 results also included a $164 million realization gain on the sale of a partial interest in a Toronto office building. The increase reflects modest growth in net rents on re-leasing and lower interest expense on floating rate debt. Consolidated assets and net invested capital increased from year end due to the completion of office properties that were previously included within our development activities as well as currency appreciation.
Net invested capital increased in the quarter as we raised $1.0 billion of common equity capital within our publicly listed North American commercial office subsidiary. We subscribed for 50% of the issue, investing $519 million to maintain our pro-rata interest. In addition, we invested $140 million into our Brazil Retail Fund alongside our partners to continue to fund development activities and repay debt.
Office PropertiesWe own and manage one of the highest quality commercial office portfolios in the world, located in major financial, energy and government centre cities in North America, Australasia and Europe. Our strategy is to concentrate our operations in high growth, supply-constrained markets that have high barriers to entry and attractive tenant bases. Our goal is to maintain a meaningful presence in each of our primary markets so as to build on the strength of our tenant relationships. As at September 30, 2009, we owned, directly and indirectly, over 160 properties containing total leasable area of 94 million square feet. Our net leasable area on a consolidated basis was approximately 70 million square feet.
The following table shows the sources of operating cash flow by geographic region:
Operating Cash Flow
2009 2008
FOR THE THREE MONTHS ENDED SEPTEMBER 30
(MIllIONS) Total
Interest
Expense
Co-investor
Interests Net Total
Interest
Expense
Co-investor
Interests Net
North America $ 333 $ 150 $ 37 1 $ 146 $ 324 $ 182 $ 30 1 $ 112Australasia 60 30 — 30 63 56 3 4
United Kingdom 13 13 — — 11 8 — 3
Realization gains — — — — 164 — — 164
$ 406 $ 193 $ 37 $ 176 $ 562 $ 246 $ 33 $ 283
1 Includes $6 million (2008 – $14 million) attributable to co-investor interests classified as liabilities and interest expenses for accounting purposes
Brookfield Asset Management | Q3 /2009 Supplemental Information 11
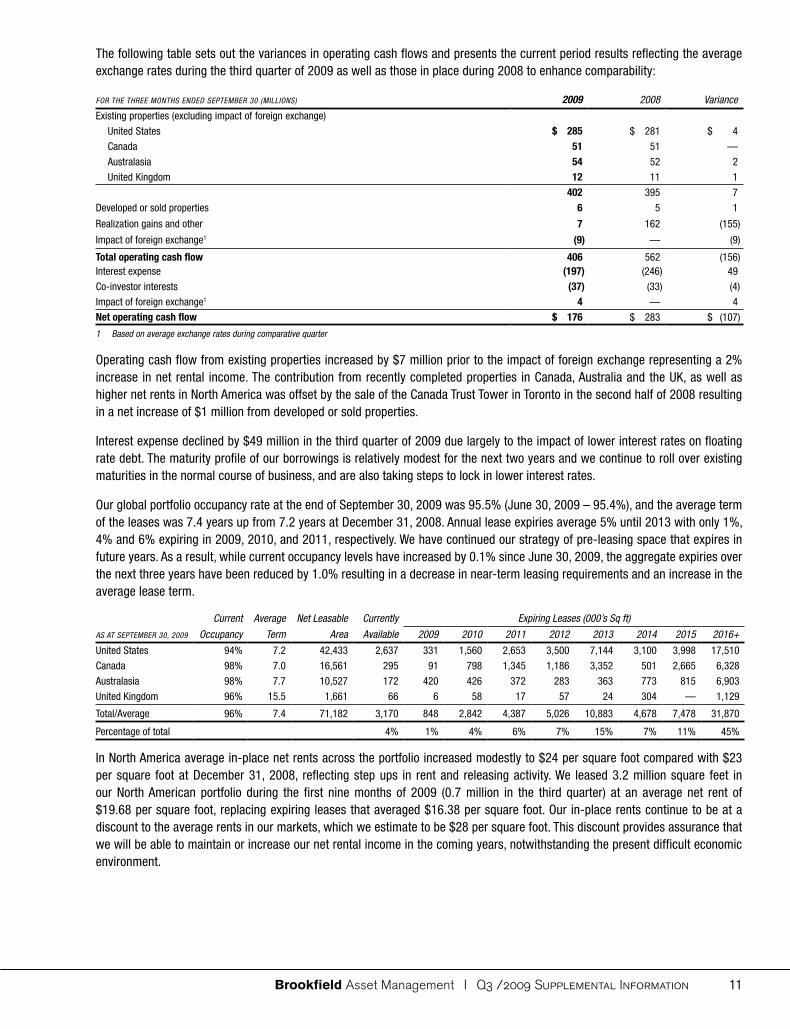
The following table sets out the variances in operating cash flows and presents the current period results reflecting the average exchange rates during the third quarter of 2009 as well as those in place during 2008 to enhance comparability:
FOR THE THREE MONTHS ENDED SEPTEMBER 30 (MIllIONS) 2009 2008 Variance
Existing properties (excluding impact of foreign exchange)
United States $ 285 $ 281 $ 4
Canada 51 51 —
Australasia 54 52 2
United Kingdom 12 11 1402 395 7
Developed or sold properties 6 5 1
Realization gains and other 7 162 (155)
Impact of foreign exchange1 (9) — (9)
Total operating cash flow 406 562 (156)Interest expense (197) (246) 49
Co-investor interests (37) (33) (4)
Impact of foreign exchange1 4 — 4Net operating cash flow $ 176 $ 283 $ (107)
1 Based on average exchange rates during comparative quarter
Operating cash flow from existing properties increased by $7 million prior to the impact of foreign exchange representing a 2% increase in net rental income. The contribution from recently completed properties in Canada, Australia and the UK, as well as higher net rents in North America was offset by the sale of the Canada Trust Tower in Toronto in the second half of 2008 resulting in a net increase of $1 million from developed or sold properties.
Interest expense declined by $49 million in the third quarter of 2009 due largely to the impact of lower interest rates on floating rate debt. The maturity profile of our borrowings is relatively modest for the next two years and we continue to roll over existing maturities in the normal course of business, and are also taking steps to lock in lower interest rates.
Our global portfolio occupancy rate at the end of September 30, 2009 was 95.5% (June 30, 2009 – 95.4%), and the average term of the leases was 7.4 years up from 7.2 years at December 31, 2008. Annual lease expiries average 5% until 2013 with only 1%, 4% and 6% expiring in 2009, 2010, and 2011, respectively. We have continued our strategy of pre-leasing space that expires in future years. As a result, while current occupancy levels have increased by 0.1% since June 30, 2009, the aggregate expiries over the next three years have been reduced by 1.0% resulting in a decrease in near-term leasing requirements and an increase in the average lease term.
Current Average Net leasable Currently Expiring leases (000’s Sq ft)
AS AT SEPTEMBER 30, 2009 Occupancy Term Area Available 2009 2010 2011 2012 2013 2014 2015 2016+
United States 94% 7.2 42,433 2,637 331 1,560 2,653 3,500 7,144 3,100 3,998 17,510
Canada 98% 7.0 16,561 295 91 798 1,345 1,186 3,352 501 2,665 6,328
Australasia 98% 7.7 10,527 172 420 426 372 283 363 773 815 6,903
United Kingdom 96% 15.5 1,661 66 6 58 17 57 24 304 — 1,129
Total/Average 96% 7.4 71,182 3,170 848 2,842 4,387 5,026 10,883 4,678 7,478 31,870
Percentage of total 4% 1% 4% 6% 7% 15% 7% 11% 45%
In North America average in-place net rents across the portfolio increased modestly to $24 per square foot compared with $23 per square foot at December 31, 2008, reflecting step ups in rent and releasing activity. We leased 3.2 million square feet in our North American portfolio during the first nine months of 2009 (0.7 million in the third quarter) at an average net rent of $19.68 per square foot, replacing expiring leases that averaged $16.38 per square foot. Our in-place rents continue to be at a discount to the average rents in our markets, which we estimate to be $28 per square foot. This discount provides assurance that we will be able to maintain or increase our net rental income in the coming years, notwithstanding the present difficult economic environment.
Brookfield Asset Management | Q3 /2009 Supplemental Information12
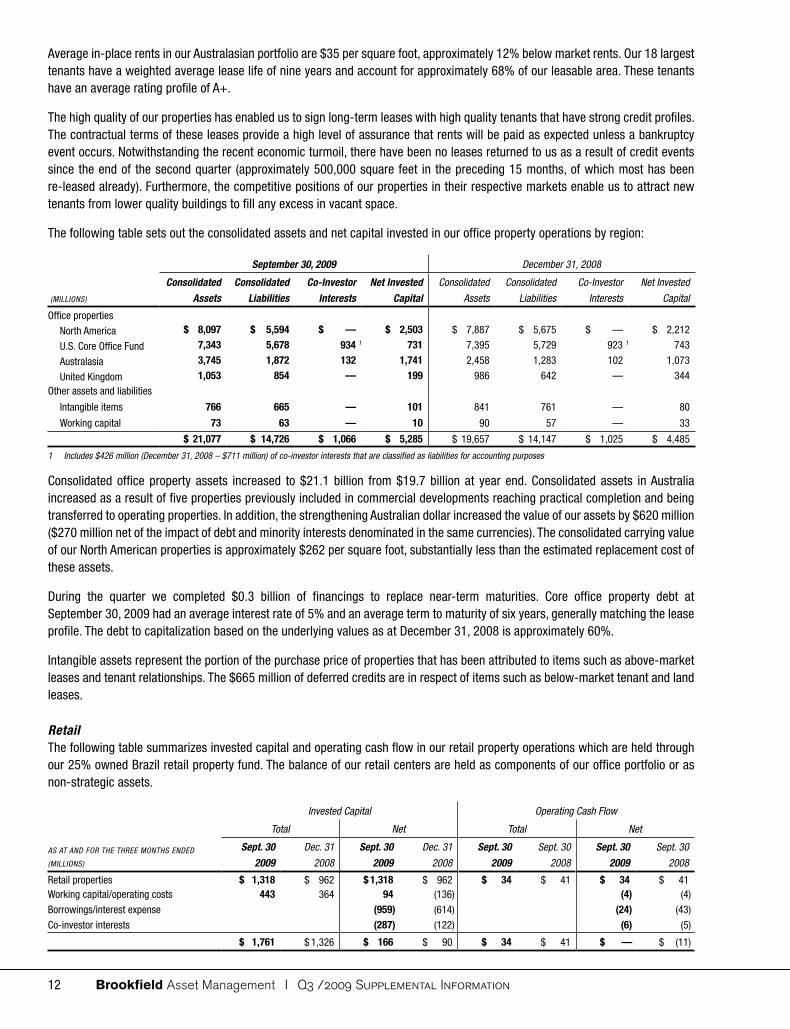
Average in-place rents in our Australasian portfolio are $35 per square foot, approximately 12% below market rents. Our 18 largest tenants have a weighted average lease life of nine years and account for approximately 68% of our leasable area. These tenants have an average rating profile of A+.
The high quality of our properties has enabled us to sign long-term leases with high quality tenants that have strong credit profiles. The contractual terms of these leases provide a high level of assurance that rents will be paid as expected unless a bankruptcy event occurs. Notwithstanding the recent economic turmoil, there have been no leases returned to us as a result of credit events since the end of the second quarter (approximately 500,000 square feet in the preceding 15 months, of which most has been re-leased already). Furthermore, the competitive positions of our properties in their respective markets enable us to attract new tenants from lower quality buildings to fill any excess in vacant space.
The following table sets out the consolidated assets and net capital invested in our office property operations by region:
September 30, 2009 December 31, 2008
(MIllIONS)
Consolidated
Assets
Consolidated
Liabilities
Co-Investor
Interests
Net Invested
Capital
Consolidated
Assets
Consolidated
liabilities
Co-Investor
Interests
Net Invested
Capital
Office properties
North America $ 8,097 $ 5,594 $ — $ 2,503 $ 7,887 $ 5,675 $ — $ 2,212
U.S. Core Office Fund 7,343 5,678 934 1 731 7,395 5,729 923 1 743
Australasia 3,745 1,872 132 1,741 2,458 1,283 102 1,073
United Kingdom 1,053 854 — 199 986 642 — 344
Other assets and liabilities
Intangible items 766 665 — 101 841 761 — 80
Working capital 73 63 — 10 90 57 — 33
$ 21,077 $ 14,726 $ 1,066 $ 5,285 $ 19,657 $ 14,147 $ 1,025 $ 4,485
1 Includes $426 million (December 31, 2008 – $711 million) of co-investor interests that are classified as liabilities for accounting purposes
Consolidated office property assets increased to $21.1 billion from $19.7 billion at year end. Consolidated assets in Australia increased as a result of five properties previously included in commercial developments reaching practical completion and being transferred to operating properties. In addition, the strengthening Australian dollar increased the value of our assets by $620 million ($270 million net of the impact of debt and minority interests denominated in the same currencies). The consolidated carrying value of our North American properties is approximately $262 per square foot, substantially less than the estimated replacement cost of these assets.
During the quarter we completed $0.3 billion of financings to replace near-term maturities. Core office property debt at September 30, 2009 had an average interest rate of 5% and an average term to maturity of six years, generally matching the lease profile. The debt to capitalization based on the underlying values as at December 31, 2008 is approximately 60%.
Intangible assets represent the portion of the purchase price of properties that has been attributed to items such as above-market leases and tenant relationships. The $665 million of deferred credits are in respect of items such as below-market tenant and land leases.
RetailThe following table summarizes invested capital and operating cash flow in our retail property operations which are held through our 25% owned Brazil retail property fund. The balance of our retail centers are held as components of our office portfolio or as non-strategic assets.
Invested Capital Operating Cash Flow
Total Net Total Net
AS AT AND FOR THE THREE MONTHS ENDED
(MIllIONS)
Sept. 30
2009
Dec. 31
2008
Sept. 30
2009
Dec. 31
2008
Sept. 30
2009
Sept. 30
2008
Sept. 30
2009
Sept. 30
2008
Retail properties $ 1,318 $ 962 $ 1,318 $ 962 $ 34 $ 41 $ 34 $ 41Working capital/operating costs 443 364 94 (136) (4) (4)
Borrowings/interest expense (959) (614) (24) (43)
Co-investor interests (287) (122) (6) (5)
$ 1,761 $ 1,326 $ 166 $ 90 $ 34 $ 41 $ — $ (11)
Brookfield Asset Management | Q3 /2009 Supplemental Information 13
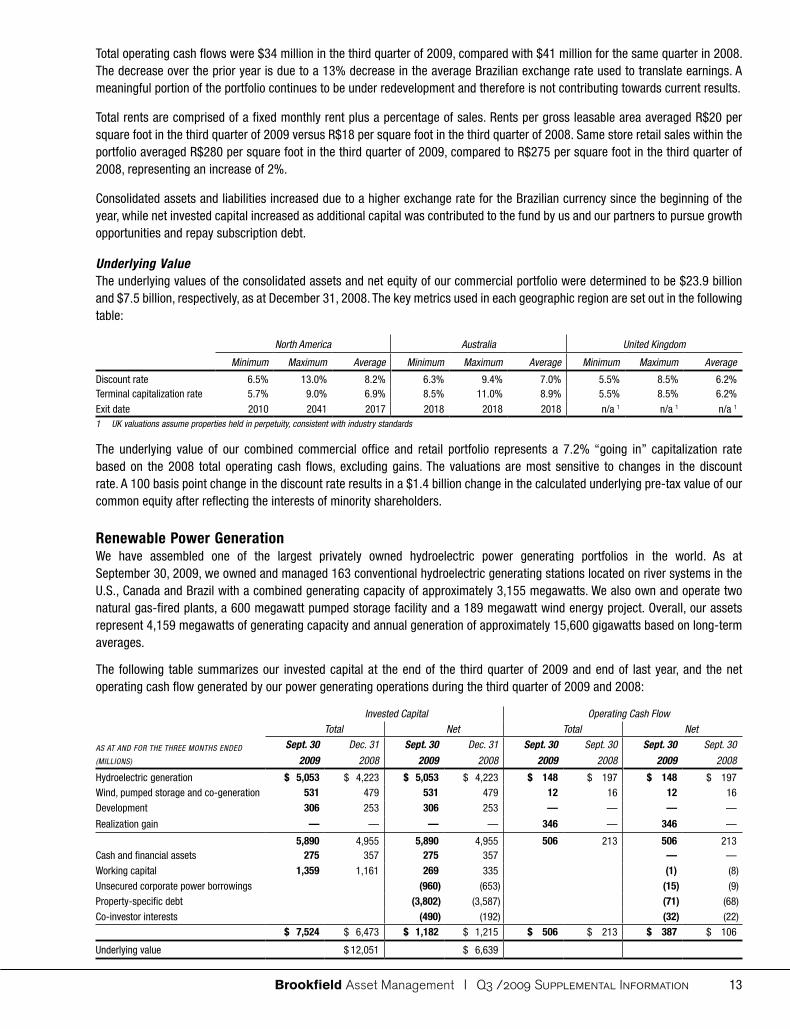
Total operating cash flows were $34 million in the third quarter of 2009, compared with $41 million for the same quarter in 2008. The decrease over the prior year is due to a 13% decrease in the average Brazilian exchange rate used to translate earnings. A meaningful portion of the portfolio continues to be under redevelopment and therefore is not contributing towards current results.
Total rents are comprised of a fixed monthly rent plus a percentage of sales. Rents per gross leasable area averaged R$20 per square foot in the third quarter of 2009 versus R$18 per square foot in the third quarter of 2008. Same store retail sales within the portfolio averaged R$280 per square foot in the third quarter of 2009, compared to R$275 per square foot in the third quarter of 2008, representing an increase of 2%.
Consolidated assets and liabilities increased due to a higher exchange rate for the Brazilian currency since the beginning of the year, while net invested capital increased as additional capital was contributed to the fund by us and our partners to pursue growth opportunities and repay subscription debt.
Underlying ValueThe underlying values of the consolidated assets and net equity of our commercial portfolio were determined to be $23.9 billion and $7.5 billion, respectively, as at December 31, 2008. The key metrics used in each geographic region are set out in the following table:
North America Australia United Kingdom
Minimum Maximum Average Minimum Maximum Average Minimum Maximum Average
Discount rate 6.5% 13.0% 8.2% 6.3% 9.4% 7.0% 5.5% 8.5% 6.2%Terminal capitalization rate 5.7% 9.0% 6.9% 8.5% 11.0% 8.9% 5.5% 8.5% 6.2%
Exit date 2010 2041 2017 2018 2018 2018 n/a 1 n/a 1 n/a 1
1 UK valuations assume properties held in perpetuity, consistent with industry standards
The underlying value of our combined commercial office and retail portfolio represents a 7.2% “going in” capitalization rate based on the 2008 total operating cash flows, excluding gains. The valuations are most sensitive to changes in the discount rate. A 100 basis point change in the discount rate results in a $1.4 billion change in the calculated underlying pre-tax value of our common equity after reflecting the interests of minority shareholders.
Renewable Power GenerationWe have assembled one of the largest privately owned hydroelectric power generating portfolios in the world. As at September 30, 2009, we owned and managed 163 conventional hydroelectric generating stations located on river systems in the U.S., Canada and Brazil with a combined generating capacity of approximately 3,155 megawatts. We also own and operate two natural gas-fired plants, a 600 megawatt pumped storage facility and a 189 megawatt wind energy project. Overall, our assets represent 4,159 megawatts of generating capacity and annual generation of approximately 15,600 gigawatts based on long-term averages.
The following table summarizes our invested capital at the end of the third quarter of 2009 and end of last year, and the net operating cash flow generated by our power generating operations during the third quarter of 2009 and 2008:
Invested Capital Operating Cash Flow
Total Net Total Net
AS AT AND FOR THE THREE MONTHS ENDED
(MIllIONS)
Sept. 30
2009
Dec. 31
2008
Sept. 30
2009
Dec. 31
2008
Sept. 30
2009
Sept. 30
2008
Sept. 30
2009
Sept. 30
2008
Hydroelectric generation $ 5,053 $ 4,223 $ 5,053 $ 4,223 $ 148 $ 197 $ 148 $ 197Wind, pumped storage and co-generation 531 479 531 479 12 16 12 16
Development 306 253 306 253 — — — —
Realization gain — — — — 346 — 346 —
5,890 4,955 5,890 4,955 506 213 506 213Cash and financial assets 275 357 275 357 — —
Working capital 1,359 1,161 269 335 (1) (8)
Unsecured corporate power borrowings (960) (653) (15) (9)
Property-specific debt (3,802) (3,587) (71) (68)
Co-investor interests (490) (192) (32) (22)$ 7,524 $ 6,473 $ 1,182 $ 1,215 $ 506 $ 213 $ 387 $ 106
Underlying value $ 12,051 $ 6,639

Brookfield Asset Management | Q3 /2009 Supplemental Information14
Net operating cash flow and realization gains totalled $387 million in the third quarter of 2009 compared with $106 million in the comparable quarter last year. Generation was relatively unchanged from last year at approximately 3,400 gigawatt hours but realized electricity prices were lower by approximately $14 per megawatt hour, leading to a reduction in the operating cash flow from our hydroelectric facilities of $49 million. This resulted from lower than average prices this year, compounded by higher than average prices last year in the comparable quarter. After deducting carrying charges, net operating cash flow was $41 million, compared to $106 million in the third quarter of 2008 and $91 million in the second quarter of 2009. The third quarter is typically our lowest quarter in terms of operating cash flow due to seasonal fluctuations in water levels, whereas financing charges and certain operating expenses are incurred on a more even basis over the year, with the result that the third quarter operating cash flows appear unusually low in contrast to the full year.
We realized a $346 million gain in the current quarter on the sale of certain hydro assets in Ontario to our partners in the Brookfield Renewable Power Fund. We continue to own 50% of these assets through the fund and continue to purchase all of the power under a long-term agreement. This enabled us to monetize a portion of the value of these relatively mature assets while retaining the potential upside (and downside) of future changes in energy prices. The transaction raised C$560 million of proceeds for us and repositioned the Fund as our primary investment vehicle for renewable power in Canada. As discussed below, we are working on securing an agreement in principal for a long-term contract for this power on favourable terms.
Realized Prices and Operating MarginsThe following table illustrates revenues and operating costs for our hydroelectric facilities:
2009 2008
FOR THE THREE MONTHS ENDED SEPTEMBER 30 Actual Realized Operating Operating Actual Realized Operating Operating(GIGAwATT HOURS AND $ MIllIONS) Production Revenues Costs Cash Flows Production Revenues Costs Cash Flows
United States 1,373 $ 98 $ 31 $ 67 1,396 $ 114 $ 35 $ 79
Canada 1,317 71 29 42 1,348 105 27 78Brazil 714 58 19 39 634 55 15 40
Total 3,404 $ 227 $ 79 $ 148 3,378 $ 274 $ 77 $ 197
Per MWh $ 67 $ 23 $ 44 $ 81 $ 23 $ 58
Our strategy of forward selling generation (described below under “Contract Profile”) reduces the impact of short-term fluctuations in market prices on our results. During the quarter, 81% of our long-term average generation was sold or hedged pursuant to long-term and financial contracts achieving realized prices well in excess of spot prices during the period. The unhedged balance of 571 gigawatt hours, together with the 398 gigawatt hours of generation in excess of long-term averages, (969 gigawatt hours in total; 2008 – 1,020 gigawatt hours) was sold into the spot market without the benefit of hedges. This resulted in a lower average realized price, although we did benefit from above average generation during the period.
Realized prices also reflected the impact of lower Canadian and Brazilian currencies, relative to 2008 levels which negatively impacted the revenues in those jurisdictions. Operating costs remained consistent with last year on an aggregate and per unit basis compared to the third quarter of 2008, although they are higher on a per unit basis than the levels experienced in other quarters due to the impact of lower volumes.
Cash flow from our non-hydro facilities declined to $12 million compared with $16 million in the third quarter of 2008. Results were negatively impacted by higher fuel costs at our gas-fired facility located in Ontario due to expiration of our long-term, low-cost supply agreement at the end of 2008. Last year’s results were positively impacted by the resale of the low-cost contracted gas at higher market prices in that period.

Brookfield Asset Management | Q3 /2009 Supplemental Information 15
GenerationThe following table summarizes generation during the third quarter of 2009 and 2008:
Actual Production Variance to
FOR THE THREE MONTHS ENDED SEPTEMBER 30 long-Term long-Term Actual(GIGAwATT HOURS) Average 2009 2008 Average 2008
Existing capacity 2,657 3,076 3,132 419 (56)Acquisitions – during 2008 and 2009 349 328 246 (21) 82
Total hydroelectric operations 3,006 3,404 3,378 398 26
Wind energy 102 70 78 (32) (8)
Co-generation 217 118 225 (99) (107)
Pumped storage 96 128 125 32 3
Total generation 3,421 3,720 3,806 299 (86)
Hydroelectric generation from existing capacity (i.e., “same store” basis) during the third quarter was 16% above our long-term average plans, although comparable to the 2008 quarter, in which we also experienced water flows that were well above average. Year-to-date results are 7% above expected averages. Recently acquired or commissioned assets contributed 328 gigawatt hours, representing an increase of 82 gigawatt hours.
Our geographic distribution provides diversification of water flows to minimize the overall impact of hydrology fluctuations. In North America, most of our systems have access to water reservoirs in which we can store approximately 21% of our annual generation, providing partial protection against short-term changes in water supply and enabling us to optimize selling prices by generating and selling power during higher-priced peak periods. In this regard, we retained a portion of the strong inflows such that reservoir levels were approximately 13% above average levels at quarter end, which we hope positions us to benefit from higher prices in the fourth quarter.
Almost all of our facilities in Brazil participate in a national program that levelizes hydrology results among regions, resulting in particularly stable generation results. This further minimizes the impact of water variations on almost 20% of our generation.
Contract ProfileConsistent with our strategy to establish lower volatility revenue streams, the prices for approximately 80% of our projected generation for 2009 and 2010 are contracted pursuant to long-term bilateral power sales agreements or shorter-term financial contracts. The remaining generation is sold into wholesale electricity markets when certainty of generation is confirmed.
Our long-term sales contracts, which account for approximately 50% of total generation have an average term of 13 years. The majority of our counterparties are investment grade in nature, including a number of government agencies. The financial contracts typically have a term of less than two years and are with high credit-worthy counterparties or otherwise supported by credit-mitigation features such as parental guarantees or collateral arrangements.
We are working on securing a long-term contract for our currently uncontracted hydro-electric production in Ontario (approximately 2,300 gigawatt hours per year). If completed, we expect the contract will have a base price, which will escalate annually, with additional payments for on-peak production and ancillary services. This agreement would increase the amount of generation currently under long-term contract from approximately 50% to approximately 70%, and reduce our reliance on shorter-term contracts achieving a goal we set a few years ago.
Brookfield Asset Management | Q3 /2009 Supplemental Information16
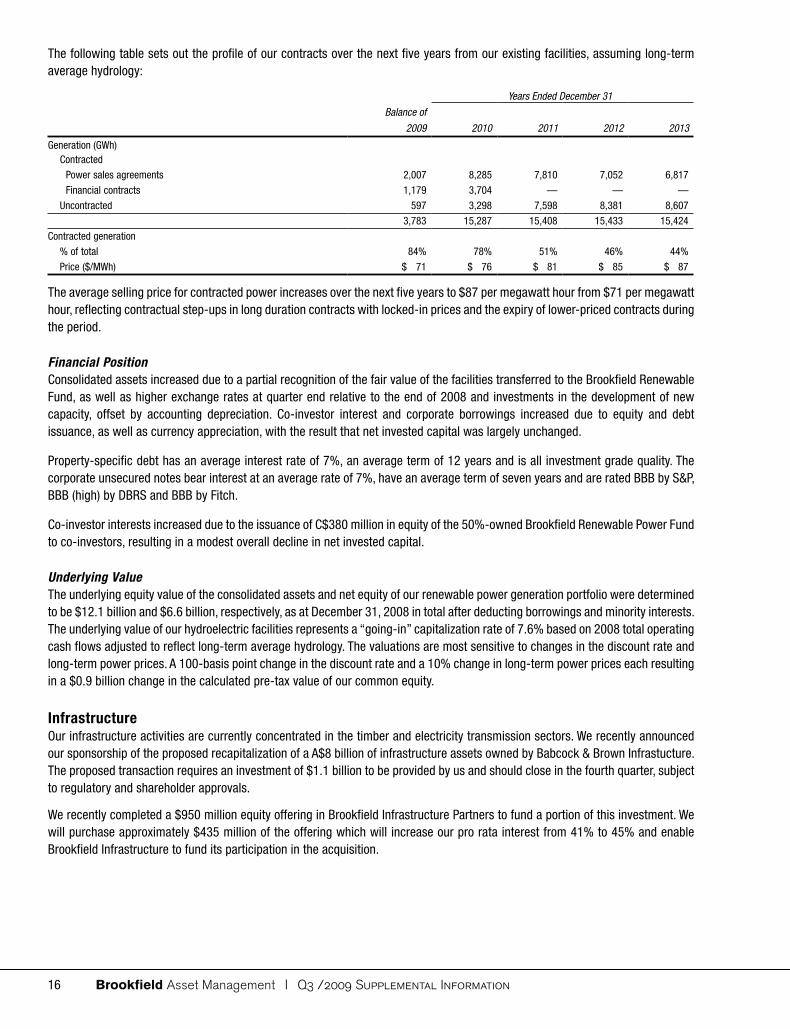
The following table sets out the profile of our contracts over the next five years from our existing facilities, assuming long-term average hydrology:
Years Ended December 31
Balance of
2009 2010 2011 2012 2013
Generation (GWh)Contracted
Power sales agreements 2,007 8,285 7,810 7,052 6,817
Financial contracts 1,179 3,704 — — —
Uncontracted 597 3,298 7,598 8,381 8,607
3,783 15,287 15,408 15,433 15,424
Contracted generation
% of total 84% 78% 51% 46% 44%
Price ($/MWh) $ 71 $ 76 $ 81 $ 85 $ 87
The average selling price for contracted power increases over the next five years to $87 per megawatt hour from $71 per megawatt hour, reflecting contractual step-ups in long duration contracts with locked-in prices and the expiry of lower-priced contracts during the period.
Financial PositionConsolidated assets increased due to a partial recognition of the fair value of the facilities transferred to the Brookfield Renewable Fund, as well as higher exchange rates at quarter end relative to the end of 2008 and investments in the development of new capacity, offset by accounting depreciation. Co-investor interest and corporate borrowings increased due to equity and debt issuance, as well as currency appreciation, with the result that net invested capital was largely unchanged.
Property-specific debt has an average interest rate of 7%, an average term of 12 years and is all investment grade quality. The corporate unsecured notes bear interest at an average rate of 7%, have an average term of seven years and are rated BBB by S&P, BBB (high) by DBRS and BBB by Fitch.
Co-investor interests increased due to the issuance of C$380 million in equity of the 50%-owned Brookfield Renewable Power Fund to co-investors, resulting in a modest overall decline in net invested capital.
Underlying ValueThe underlying equity value of the consolidated assets and net equity of our renewable power generation portfolio were determined to be $12.1 billion and $6.6 billion, respectively, as at December 31, 2008 in total after deducting borrowings and minority interests. The underlying value of our hydroelectric facilities represents a “going-in” capitalization rate of 7.6% based on 2008 total operating cash flows adjusted to reflect long-term average hydrology. The valuations are most sensitive to changes in the discount rate and long-term power prices. A 100-basis point change in the discount rate and a 10% change in long-term power prices each resulting in a $0.9 billion change in the calculated pre-tax value of our common equity.
InfrastructureOur infrastructure activities are currently concentrated in the timber and electricity transmission sectors. We recently announced our sponsorship of the proposed recapitalization of a A$8 billion of infrastructure assets owned by Babcock & Brown Infrastucture. The proposed transaction requires an investment of $1.1 billion to be provided by us and should close in the fourth quarter, subject to regulatory and shareholder approvals.
We recently completed a $950 million equity offering in Brookfield Infrastructure Partners to fund a portion of this investment. We will purchase approximately $435 million of the offering which will increase our pro rata interest from 41% to 45% and enable Brookfield Infrastructure to fund its participation in the acquisition.

Brookfield Asset Management | Q3 /2009 Supplemental Information 17
Our existing operations are located primarily in the United States, Canada, Chile and Brazil and are primarily owned through funds and specialty listed issuers that we manage. The invested capital and net operating cash flows contributed by these operations are summarized in the following table:
Invested Capital Operating Cash Flow
Total Net Total Net
AS AT AND FOR THE THREE MONTHS ENDED
(MIllIONS)
Sept. 30
2009
Dec. 31
2008
Sept. 30
2009
Dec. 31
2008
Sept. 30
2009
Sept. 30
2008
Sept. 30
2009
Sept. 30
2008
Timberlands $ 3,621 $ 3,557 $ 469 $ 439 $ 25 $ 33 $ — $ 6Transmission 633 856 276 322 22 45 9 21
$ 4,254 $ 4,413 $ 745 $ 761 $ 47 $ 78 $ 9 $ 27
Underlying value $ 5,059 $ 974
TimberTimber operations contributed $25 million of total operating cash flow during the third quarter of 2009 compared to $33 million in 2008. Net operating cash flow was $nil in 2009 compared to $6 million in 2008. Consolidated assets held within our timber operations and related borrowing levels were relatively unchanged during the quarter.
Invested Capital Operating Cash Flow
Total Net Total Net
AS AT AND FOR THE THREE MONTHS ENDED
(MIllIONS)
Sept. 30
2009
Dec. 31
2008
Sept. 30
2009
Dec. 31
2008
Sept. 30
2009
Sept. 30
2008
Sept. 30
2009
Sept. 30
2008
TimberlandsWestern North America $ 2,592 $ 2,613 $ 23 $ 27
Eastern North America 167 150 2 3
Brazil 135 63 — 32,894 2,826 $ 2,894 $ 2,826 25 33 $ 25 $ 33
Working capital/other expenses 727 731 164 158 (1) (4)
Property-specific debt/interest expense (1,556) (1,550) (22) (20)
Co-investor interests (1,033) (995) (2) (3)$ 3,621 $ 3,557 $ 469 $ 439 $ 25 $ 33 $ — $ 6
Underlying value $ 4,164 $ 613
The decline in operating cash flow was due largely to lower demand for timber, which led to lower prices in both the domestic and export markets in 2009. In response, we continued to operate at lower harvest levels until prices recover and allow the trees to continue to grow, which we believe will maximize the value of this business over the long term. We were able to selectively focus our harvest levels to capture market opportunities in both domestic and export markets, which limited the decline in realized prices across our operations to approximately 20% compared to the third quarter of 2008. Interest costs were in line with the prior year as the debt is long-term and fixed rate, while co-investor interests in operating cash flows declined due to the reduction in operating cash flows. The following table summarizes the sales results from our timber operations:
2009 2008
FOR THE THREE MONTHS ENDED SEPTEMBER 30
Sales
(000’s m3)
Revenue
per m3
Revenue
($ millions)
Sales
(000’s m3)
Revenue
per m3
Revenue
($ millions)
Western North AmericaDouglas fir 359 $ 77 $ 28 574 $ 88 $ 50
Whitewood 263 60 16 339 58 20
Other species 209 62 13 173 104 18831 68 57 1,086 81 88
Eastern North America and Brazil 675 28 19 742 33 24
1,506 $ 50 $ 76 1,828 $ 62 $ 112
We sold 1.5 million cubic metres of timber during the third quarter of 2009, compared to 1.8 million cubic metres in the third quarter of 2008. We continue to reduce harvest and sales levels in North America as margins on high quality timber such as Douglas fir and Whitewood species remain low. We increased harvest levels moderately in Brazil reflecting the relative strength in that market.

Brookfield Asset Management | Q3 /2009 Supplemental Information18
We intend to continue harvesting our Western North American timberlands at reduced levels for the remainder of 2009 in order to preserve inventory and maximize future value. Accordingly, we expect harvest levels in Canada and the U.S. to be approximately 30% and 50% below 2008 levels, respectively.
TransmissionTransmission operations contributed $22 million of total operating cash flow during the third quarter of 2009 compared to $45 million in the same period in 2008. Net operating cash flow totalled $9 million in the third quarter of 2009 compared to $21 million in the same period in 2008. The 2008 results reflect total and net operating cash flow from a Brazilian transmission business which was sold in the first half of 2009 for $28 million and $9 million, respectively.
Invested Capital Operating Cash Flow
Total Net Total Net
AS AT AND FOR THE THREE MONTHS ENDED
(MIllIONS)
Sept. 30
2009
Dec. 31
2008
Sept. 30
2009
Dec. 31
2008
Sept. 30
2009
Sept. 30
2008
Sept. 30
2009
Sept. 30
2008
Transmission facilities and investmentsChile $ 358 $ 324 $ 14 $ 8
North America 188 158 8 9
Brazil — 207 — 28
546 689 $ 546 $ 689 22 45 $ 22 $ 45
Working capital/other expenses 87 167 65 116 — — — (1)
Property-specific debt/interest expense (111) (237) — — (2) (3)
633 856 500 568 22 45 20 41
Co-investor interests (224) (246) — — (11) (20)$ 633 $ 856 $ 276 $ 322 $ 22 $ 45 $ 9 $ 21
Underlying value $ 895 $ 361
Our transmission operations generate stable revenues that are largely governed by regulated frameworks and long-term contracts. Accordingly, we expect this segment to produce consistent revenue and margins over the long-term that should increase with inflation and other factors such as operational improvements.
We also expect to achieve continued growth in revenues and income by investing additional capital into our existing operations. The operating margin at our Chilean transmission operations was 83%, which is in line with historical levels.
Consolidated assets and net invested capital held within our transmission operations decreased, following the completion of the sale of our Brazilian transmission lines and associated reduction in borrowings during the second quarter. We received total proceeds of $275 million inclusive of hedge proceeds. Subsequent to quarter end, we sold our North American electricity distribution business for gross proceeds of C$75 million, resulting in a minimal gain over the book value.
We are in the initial stages of developing a $500 million transmission system in the state of Texas with a 50% joint venture partner although we do not expect to invest any meaningful level of capital until late 2010. The development is expected to be completed in 2011.
Underlying ValueThe underlying value of the net invested capital in our infrastructure operations was determined to be $1.0 billion as at December 31, 2008 after deducting borrowings and minority interests consisting of $613 million in our timber business and $361 million in our transmission business.
The valuations of our timberlands are based on independent appraisals. Key assumptions include a weighted average discount and terminal capitalization rate of 6.5% at a terminal valuation date of 72 years on average. Timber prices were based on a combination of forward prices available in the market and the price forecasts of each appraisal firm.
The valuation of our transmission operations is based on the contractual sale price for our Brazilian interests, an independent valuation of our Chilean transmission business, and an internal valuation of our Northern Ontario operations based on the regulated rate base. In valuing our Chilean transmission business, key assumptions included a weighted average discount rate of 11.0%, a terminal capitalization rate of 8.6% and an average terminal valuation date of 2023.

Brookfield Asset Management | Q3 /2009 Supplemental Information 19
Development and Other PropertiesDevelopment and other properties include our opportunity investment funds, residential operations, properties that are under development and held for development, and construction activities.
Invested Capital Operating Cash Flow
Total Net Total Net
AS AT AND FOR THE THREE MONTHS ENDED
(MIllIONS)
Sept. 30
2009
Dec. 31
2008
Sept. 30
2009
Dec. 31
2008
Sept. 30
2009
Sept. 30
2008
Sept. 30
2009
Sept. 30
2008
Opportunity investments $ 1,314 $ 1,295 $ 164 $ 183 $ 25 $ 24 $ 11 $ 11
Residential 5,312 3,820 766 171 47 17 29 35
Under development 1,936 1,970 893 742 4 1 3 1
Held for development 2,426 2,260 1,742 1,693 — — — —
Construction activities 1,554 1,299 750 545 11 15 11 15$ 12,542 $ 10,644 $ 4,315 $ 3,334 $ 87 $ 57 $ 54 $ 62
Underlying value $ 10,619 $ 3,313
Opportunity InvestmentsWe manage niche real estate opportunity funds with $502 million of committed capital (Brookfield’s share – $210 million).
Total property assets within the funds were approximately $1.3 billion at September 30, 2009, unchanged from year end. The portfolio of 83 properties is comprised predominantly of office properties in a number of cities across North America as well as smaller investments in industrial, student housing, multi-family and other property asset classes.
Net operating cash flows were $11 million in the current quarter, similar to the third quarter in 2008. Due to the focus on value enhancement and the relatively short hold period for properties, we expect that most of our returns will come from disposition gains, as opposed to net rental income.
ResidentialOur residential operations reflect strong sales activity and higher margins in Brazil, stable margins but lower sales in Canada and challenging conditions in the U.S. evidenced by lower volumes and operating margins. That said, we are experiencing a stabilization of land values in our U.S. markets and a corresponding decrease in impairment charges, and we believe we have started to see the bottoming of the residential markets in the U.S. Our Brazil operations experienced record sales during the quarter, and advanced construction on a number of projects resulting in increased revenues because these are recognized progressively as construction is completed.
Invested Capital Operating Cash Flow
Total Net Total Net
AS AT AND FOR THE THREE MONTHS ENDED
(MIllIONS)
Sept. 30
2009
Dec. 31
2008
Sept. 30
2009
Dec. 31
2008
Sept. 30
2009
Sept. 30
2008
Sept. 30
2009
Sept. 30
2008
Residential properties $ 5,312 $ 3,820 $ 3,304 $ 2,520 $ 47 $ 17 $ 47 $ 17Subsidiary borrowings/interest expense 1 (1,794) (1,727) (5) (4)
Cash taxes — — 1 15
Co-investor interests (744) (622) (14) 7
$ 5,312 $ 3,820 $ 766 $ 171 $ 47 $ 17 $ 29 $ 35
1 Portion of interest expensed through cost of sales
Total assets, which include property assets as well as housing inventory, cash and cash equivalents and other working capital balances, increased since 2008. This was principally due to the expansion of our Brazil operations as well as the substantial appreciation in the Brazil currency against the U.S. dollar. Subsidiary borrowings consist primarily of construction financings which are repaid with the proceeds received from sales of building lots, single-family houses and condominiums, and are generally renewed on a rolling basis as new construction commences. Borrowings in local currency values declined as a result of cash flows and equity issues, although this was largely offset by currency appreciation. Net invested capital increased by nearly $600 million, reflecting $350 million of equity invested by us in our U.S. and Brazilian homebuilding operations, $150 million lower debt levels in our Canadian operations, currency appreciation and retained earnings.

Brookfield Asset Management | Q3 /2009 Supplemental Information20
The net operating cash flows attributable to each of these business units, reflecting the 50% interest of Brookfield Properties shareholders in our Canadian operations, are presented in the following table. Taking these interests into consideration, the decline in the net contribution from our Canadian operations was partially offset by the increased contribution from our Brazilian operations and lower U.S. impairment charges.
FOR THE THREE MONTHS ENDED SEPTEMBER 30 (MIllIONS) 2009 2008 Variance
Canada 1 $ 11 $ 23 $ (12)Brazil and Australia 7 3 4
United States 1 (13) 1419 13 6
Add back: minority interests of Brookfield Properties in Canadian operations 10 22 (12)
$ 29 $ 35 $ (6)
1 Net of 50% interest held by minority shareholders of Brookfield Properties
CanadaWe continue to benefit, albeit at a slower pace, from our strong market position and low-cost land bank, particularly in Alberta where we hold a 25% market share in Calgary. We share approximately 50% of the cash flows (and the changes therein) with the minority shareholders of Brookfield Properties. Net of these minority interests, our Canadian operations contributed $11 million of operating cash flow ($21 million in total) during the third quarter of 2009, compared to $23 million ($45 million in total) during the third quarter of 2008. The decrease in cash flows is due primarily to lower home sales, which declined from 179 units in 2008 to 116 units in 2009. Operating margins were 22% in the third quarter of 2009 compared to 33% in the third quarter of 2008.
BrazilIn October 2009, we completed an equity offering in our Brazilian residential business which raised R$476 million. The proceeds from the offering will be used to continue to expand the business in our key markets and increase our development pipeline. We elected to not participate in this offering, following our over-subscription to a rights offering earlier in the year. Accordingly, our interest in this business will decline to approximately 44% and we will record a modest accounting gain in the fourth quarter.
AustraliaThe carrying values of Australian projects reflect our acquisition of this business in 2007 and therefore already include much of the expected development profits. Accordingly, margins are expected to be low in the first few years of ownership and a modest decline in prices can result in operating losses. We did record non-cash impairment charges of $47 million in “Revaluation and Other Items” that represent a portion of these development profits.
United StatesOur U.S. operations contributed $1 million of cash flows after interest, taxes, impairment charges and non-controlling interests during the third quarter of 2009, compared to $13 million of cash outflows during the third quarter of 2008. The gross margin from housing sales was approximately 14% during the third quarter of 2009, compared with 11% last year. Our share of these results, reflecting minority interests and taxes, represents operating margins of $5 million (2008 – $1 million) offset by impairment charges of $4 million (2008 – $14 million). We closed on 192 units during the quarter (2008 – 184 units) at an average selling price of $468,000 (2008 – $578,000). The sales backlog at the end of the quarter increased to 326 units compared to 266 units in the third quarter of 2008.
Brookfield Asset Management | Q3 /2009 Supplemental Information 21
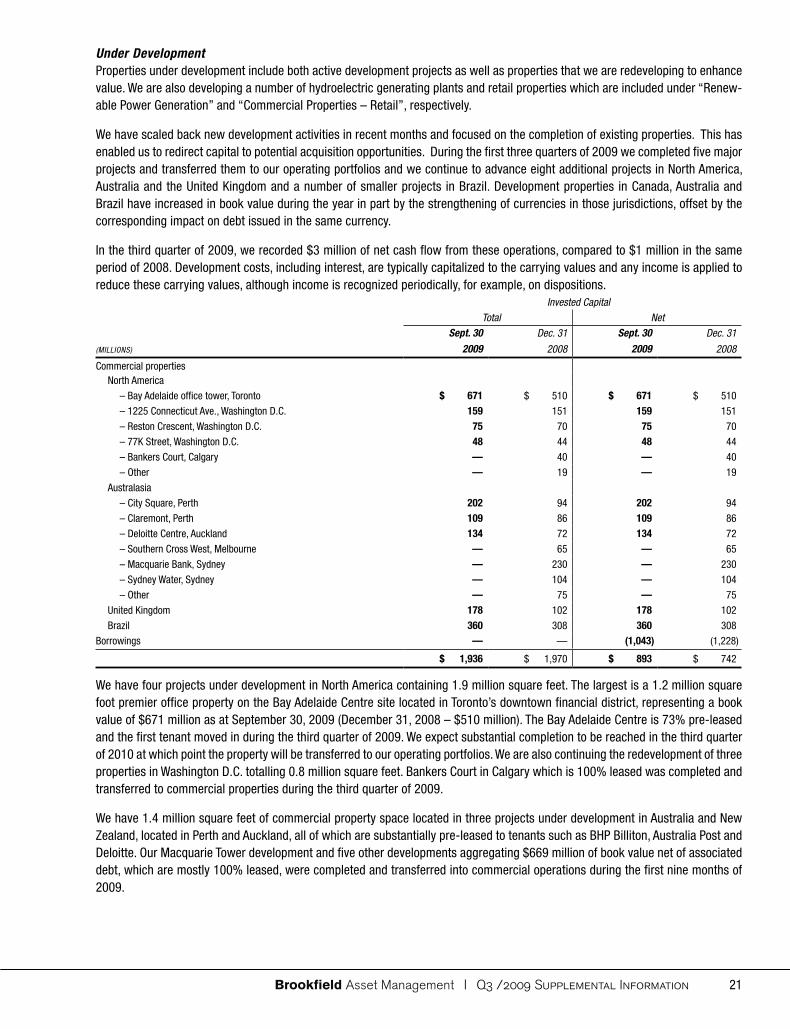
Under DevelopmentProperties under development include both active development projects as well as properties that we are redeveloping to enhance value. We are also developing a number of hydroelectric generating plants and retail properties which are included under “Renew-able Power Generation” and “Commercial Properties – Retail”, respectively.
We have scaled back new development activities in recent months and focused on the completion of existing properties. This has enabled us to redirect capital to potential acquisition opportunities. During the first three quarters of 2009 we completed five major projects and transferred them to our operating portfolios and we continue to advance eight additional projects in North America, Australia and the United Kingdom and a number of smaller projects in Brazil. Development properties in Canada, Australia and Brazil have increased in book value during the year in part by the strengthening of currencies in those jurisdictions, offset by the corresponding impact on debt issued in the same currency.
In the third quarter of 2009, we recorded $3 million of net cash flow from these operations, compared to $1 million in the same period of 2008. Development costs, including interest, are typically capitalized to the carrying values and any income is applied to reduce these carrying values, although income is recognized periodically, for example, on dispositions.
Invested Capital
Total Net
(MIllIONS)
Sept. 30
2009
Dec. 31
2008
Sept. 30
2009
Dec. 31
2008
Commercial propertiesNorth America
– Bay Adelaide office tower, Toronto $ 671 $ 510 $ 671 $ 510
– 1225 Connecticut Ave., Washington D.C. 159 151 159 151
– Reston Crescent, Washington D.C. 75 70 75 70
– 77K Street, Washington D.C. 48 44 48 44
– Bankers Court, Calgary — 40 — 40
– Other — 19 — 19
Australasia
– City Square, Perth 202 94 202 94
– Claremont, Perth 109 86 109 86
– Deloitte Centre, Auckland 134 72 134 72
– Southern Cross West, Melbourne — 65 — 65
– Macquarie Bank, Sydney — 230 — 230
– Sydney Water, Sydney — 104 — 104
– Other — 75 — 75
United Kingdom 178 102 178 102
Brazil 360 308 360 308
Borrowings — — (1,043) (1,228)
$ 1,936 $ 1,970 $ 893 $ 742
We have four projects under development in North America containing 1.9 million square feet. The largest is a 1.2 million square foot premier office property on the Bay Adelaide Centre site located in Toronto’s downtown financial district, representing a book value of $671 million as at September 30, 2009 (December 31, 2008 – $510 million). The Bay Adelaide Centre is 73% pre-leased and the first tenant moved in during the third quarter of 2009. We expect substantial completion to be reached in the third quarter of 2010 at which point the property will be transferred to our operating portfolios. We are also continuing the redevelopment of three properties in Washington D.C. totalling 0.8 million square feet. Bankers Court in Calgary which is 100% leased was completed and transferred to commercial properties during the third quarter of 2009.
We have 1.4 million square feet of commercial property space located in three projects under development in Australia and New Zealand, located in Perth and Auckland, all of which are substantially pre-leased to tenants such as BHP Billiton, Australia Post and Deloitte. Our Macquarie Tower development and five other developments aggregating $669 million of book value net of associated debt, which are mostly 100% leased, were completed and transferred into commercial operations during the first nine months of 2009.

Brookfield Asset Management | Q3 /2009 Supplemental Information22
In the United Kingdom, we own a 15% proportionate share in approximately eight million square feet of commercial space development density at Canary Wharf in London, the carrying value of which is included in our investment in Canary Wharf (in Commercial Properties).
Property-specific financing, which includes debt secured by Bay Adelaide Centre in North America as well as debt associated with developments in Australia and the United Kingdom, declined with the transfer of debt secured by properties in Canada and Australia completed during the second and third quarters.
Held for DevelopmentWe acquire land and long-term rights on land, seek entitlements to construct, and then either sell the development once it has been improved or build the project ourselves. We do not typically record ongoing cash flow in respect of properties held for development and the associated development costs are capitalized until this event occurs, at which time any disposition gain or loss is recognized.
Invested Capital
Total Net
(MIllIONS)
Sept. 30
2009
Dec. 31
2008
Sept. 30
2009
Dec. 31
2008
Commercial office propertiesNinth Avenue, New York $ 280 $ 269 $ 280 $ 269
Other North America 125 122 125 122
Australia 316 310 316 310
Residential lots
North America 796 718 796 718
Australia 420 353 420 353
Brazil 303 352 303 352
Rural development lands
Brazil 186 136 174 136
Borrowings / working capital — — (672) (567)
$ 2,426 $ 2,260 $ 1,742 $ 1,693
Commercial Office PropertiesWe own well-positioned land on Ninth Avenue between 31st Street and 33rd Street in New York City which is entitled for 5.4 million square feet of commercial office space. We will commence construction of this property once the necessary pre-leasing has occurred, similar to our strategy with other commercial developments. We also own development sites in our other core markets including North American and Australian locations.
Residential lotsResidential development properties include land, both owned and optioned, which is in the process of being developed for sale as residential lots, but not expected to enter the homebuilding process for more than three years. We utilize options to control lots for future years in our higher land cost markets in order to reduce risk. We hold options on approximately 11,000 lots located predominantly in California and Virginia. We hold 14,853 acres of development land in Alberta and approximately 10,000 residential lots, homes and condominium units in our markets in Australia and New Zealand. We also hold development land in Brazil which can accommodate up to 80.7 million square feet of residential development and represent a total potential sales value of $9.3 billion.
Rural Development landsWe own approximately 372,000 acres of prime agricultural development land in the Brazilian States of São Paulo, Minas Gerais, Mato Grosso do Sul and Mato Grosso. These properties are being used for cattle raising and agricultural purposes, including the harvest of sugar cane for the production of ethanol, which is used largely as a gasoline substitute. We also hold 33,200 acres of potentially higher and better use land adjacent to our Western North American timberlands, included within our Timberlands segment, which we intend to convert into residential and other purpose land over time.

Brookfield Asset Management | Q3 /2009 Supplemental Information 23
Construction ActivitiesThe following table summarizes the operating results from our construction operations, which fluctuate based on the timing of project completion:
Invested Capital Operating Cash Flow
Total Net Total Net
AS AT AND FOR THE THREE MONTHS ENDED
(MIllIONS)
Sept. 30
2009
Dec. 31
2008
Sept. 30
2009
Dec. 31
2008
Sept. 30
2009
Sept. 30
2008
Sept. 30
2009
Sept. 30
2008
Australia $ — $ 1 $ 3 $ 8Middle East 21 49 8 10
United Kingdom 83 74 — (3)104 124 $ 104 $ 124 11 15 $ 11 $ 15
Working capital and other 1,450 1,175 646 421 — — — —
$ 1,554 $ 1,299 $ 750 $ 545 $ 11 $ 15 $ 11 $ 15
We conduct third-party construction activities in Australia, Brazil, UK and the Middle East (Dubai, Abu Dhabi and Qatar). Our construction activities are focused on large scale construction of real estate and infrastructure assets.
The revenue work book totalled $4.8 billion at the end of the third quarter (December 31, 2008 – $3.5 billion) and represented two years of scheduled activity.
We measure our construction workbook in terms of the total revenue to be received over the life of a project for both internal and external work (i.e., gross) and total revenue remaining to be earned on external work (i.e., net). The increase in our work book reflects new projects awarded in Australia and the Middle East during the year.
The following table summarizes the gross and net workbook in our largest markets at the end of the third quarter of 2009 and end of last year:
Gross Net
Sept. 30 Dec. 31 Sept. 30 Dec. 31
(MIllIONS) 2009 2008 2009 2008
Australia $ 2,760 $ 2,254 $ 1,889 $ 1,084Middle East 2,231 1,828 2,231 1,828
United Kingdom 801 727 679 615
$ 5,792 $ 4,809 $ 4,799 $ 3,527
Underlying ValueThe underlying value of our development assets after deducting borrowings and minority interests was $3.3 billion as at December 31, 2008, roughly equal to the net book value of our invested capital at that time.
The valuation of residential development lots, which are considered inventory for these purposes, reflects the lower of the existing carrying value and their expected net realizable value. Net realizable value is determined as the value at the anticipated time of sale less costs to complete, typically discounted at a rate of 12%-15%. Many of our land holdings, particularly those located in Alberta, were acquired many years ago. Accordingly, while we believe the fair value of these lands significantly exceeds existing carrying value, the carrying value for IFRS purposes is required to be set at the lower amount.
Values attributable to commercial office property developments reflect the estimated value at completion less the remaining capital expenditures, all discounted to the current period using discount rates of 7%-9%.
Specialty FundsWe conduct restructuring, real estate finance and bridge lending activities. Although our primary focus throughout the broader organization is property, power and infrastructure assets, our mandates within our bridge lending and restructuring funds also include these and other industries which have tangible assets and visible cash flows, particularly where we have expertise as a result of previous investment experience.
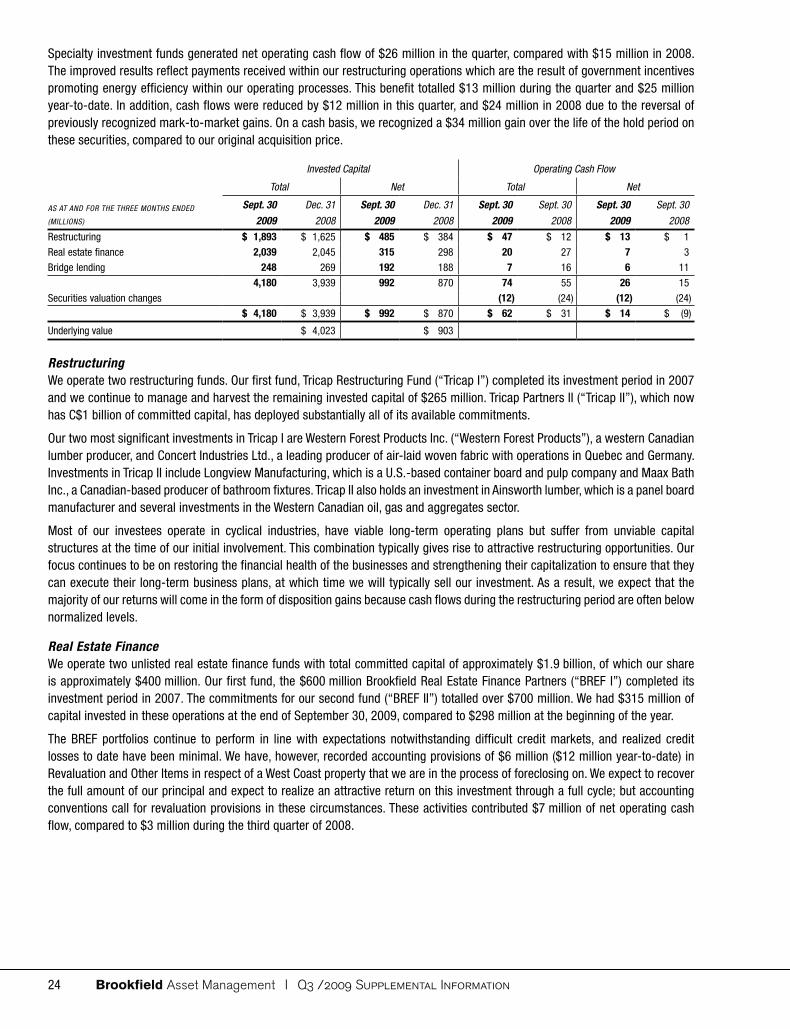
Brookfield Asset Management | Q3 /2009 Supplemental Information24
Specialty investment funds generated net operating cash flow of $26 million in the quarter, compared with $15 million in 2008. The improved results reflect payments received within our restructuring operations which are the result of government incentives promoting energy efficiency within our operating processes. This benefit totalled $13 million during the quarter and $25 million year-to-date. In addition, cash flows were reduced by $12 million in this quarter, and $24 million in 2008 due to the reversal of previously recognized mark-to-market gains. On a cash basis, we recognized a $34 million gain over the life of the hold period on these securities, compared to our original acquisition price.
Invested Capital Operating Cash Flow
Total Net Total Net
AS AT AND FOR THE THREE MONTHS ENDED
(MIllIONS)
Sept. 30
2009
Dec. 31
2008
Sept. 30
2009
Dec. 31
2008
Sept. 30
2009
Sept. 30
2008
Sept. 30
2009
Sept. 30
2008
Restructuring $ 1,893 $ 1,625 $ 485 $ 384 $ 47 $ 12 $ 13 $ 1
Real estate finance 2,039 2,045 315 298 20 27 7 3
Bridge lending 248 269 192 188 7 16 6 11 4,180 3,939 992 870 74 55 26 15
Securities valuation changes (12) (24) (12) (24)$ 4,180 $ 3,939 $ 992 $ 870 $ 62 $ 31 $ 14 $ (9)
Underlying value $ 4,023 $ 903
RestructuringWe operate two restructuring funds. Our first fund, Tricap Restructuring Fund (“Tricap I”) completed its investment period in 2007
and we continue to manage and harvest the remaining invested capital of $265 million. Tricap Partners II (“Tricap II”), which now has C$1 billion of committed capital, has deployed substantially all of its available commitments.
Our two most significant investments in Tricap I are Western Forest Products Inc. (“Western Forest Products”), a western Canadian lumber producer, and Concert Industries Ltd., a leading producer of air-laid woven fabric with operations in Quebec and Germany. Investments in Tricap II include Longview Manufacturing, which is a U.S.-based container board and pulp company and Maax Bath Inc., a Canadian-based producer of bathroom fixtures. Tricap II also holds an investment in Ainsworth lumber, which is a panel board manufacturer and several investments in the Western Canadian oil, gas and aggregates sector.
Most of our investees operate in cyclical industries, have viable long-term operating plans but suffer from unviable capital structures at the time of our initial involvement. This combination typically gives rise to attractive restructuring opportunities. Our focus continues to be on restoring the financial health of the businesses and strengthening their capitalization to ensure that they can execute their long-term business plans, at which time we will typically sell our investment. As a result, we expect that the majority of our returns will come in the form of disposition gains because cash flows during the restructuring period are often below normalized levels.
Real Estate FinanceWe operate two unlisted real estate finance funds with total committed capital of approximately $1.9 billion, of which our share is approximately $400 million. Our first fund, the $600 million Brookfield Real Estate Finance Partners (“BREF I”) completed its investment period in 2007. The commitments for our second fund (“BREF II”) totalled over $700 million. We had $315 million of capital invested in these operations at the end of September 30, 2009, compared to $298 million at the beginning of the year.
The BREF portfolios continue to perform in line with expectations notwithstanding difficult credit markets, and realized credit losses to date have been minimal. We have, however, recorded accounting provisions of $6 million ($12 million year-to-date) in Revaluation and Other Items in respect of a West Coast property that we are in the process of foreclosing on. We expect to recover the full amount of our principal and expect to realize an attractive return on this investment through a full cycle; but accounting conventions call for revaluation provisions in these circumstances. These activities contributed $7 million of net operating cash flow, compared to $3 million during the third quarter of 2008.
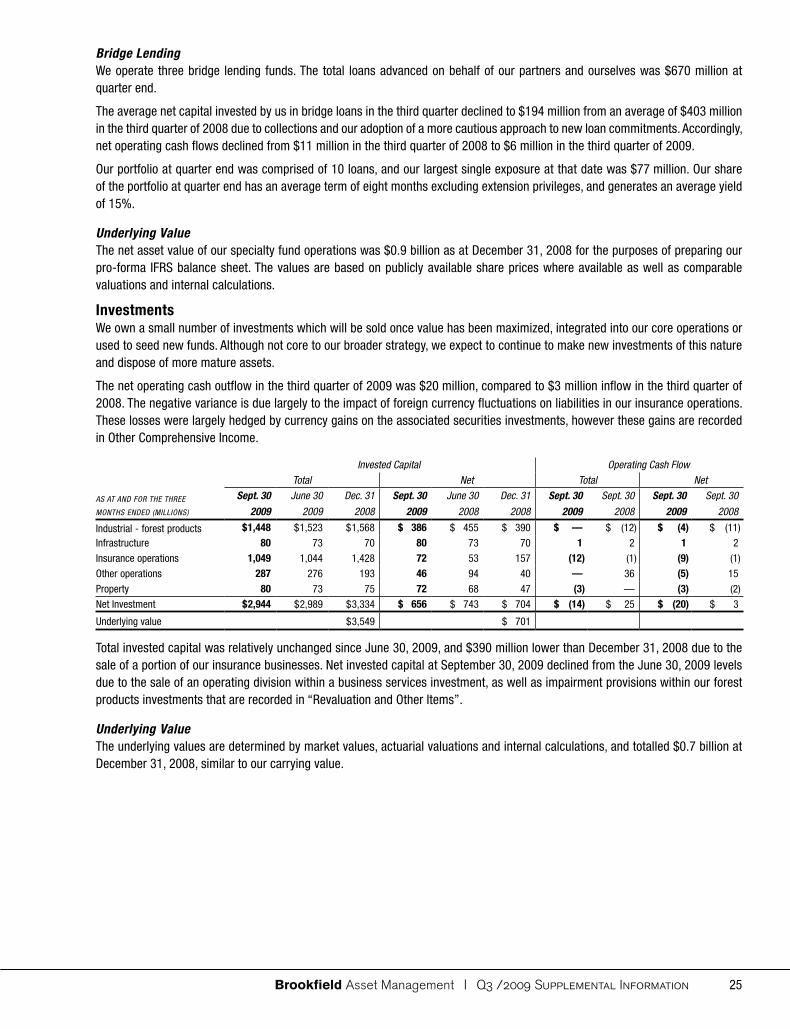
Brookfield Asset Management | Q3 /2009 Supplemental Information 25
Bridge LendingWe operate three bridge lending funds. The total loans advanced on behalf of our partners and ourselves was $670 million at quarter end.
The average net capital invested by us in bridge loans in the third quarter declined to $194 million from an average of $403 million in the third quarter of 2008 due to collections and our adoption of a more cautious approach to new loan commitments. Accordingly, net operating cash flows declined from $11 million in the third quarter of 2008 to $6 million in the third quarter of 2009.
Our portfolio at quarter end was comprised of 10 loans, and our largest single exposure at that date was $77 million. Our share of the portfolio at quarter end has an average term of eight months excluding extension privileges, and generates an average yield of 15%.
Underlying ValueThe net asset value of our specialty fund operations was $0.9 billion as at December 31, 2008 for the purposes of preparing our pro-forma IFRS balance sheet. The values are based on publicly available share prices where available as well as comparable valuations and internal calculations.
InvestmentsWe own a small number of investments which will be sold once value has been maximized, integrated into our core operations or used to seed new funds. Although not core to our broader strategy, we expect to continue to make new investments of this nature and dispose of more mature assets.
The net operating cash outflow in the third quarter of 2009 was $20 million, compared to $3 million inflow in the third quarter of 2008. The negative variance is due largely to the impact of foreign currency fluctuations on liabilities in our insurance operations. These losses were largely hedged by currency gains on the associated securities investments, however these gains are recorded in Other Comprehensive Income.
Invested Capital Operating Cash Flow
Total Net Total Net
AS AT AND FOR THE THREE
MONTHS ENDED (MIllIONS)
Sept. 30
2009
June 30
2009
Dec. 31
2008
Sept. 30
2009
June 30
2008
Dec. 31
2008
Sept. 30
2009
Sept. 30
2008
Sept. 30
2009
Sept. 30
2008
Industrial - forest products $ 1,448 $ 1,523 $ 1,568 $ 386 $ 455 $ 390 $ — $ (12) $ (4) $ (11)
Infrastructure 80 73 70 80 73 70 1 2 1 2
Insurance operations 1,049 1,044 1,428 72 53 157 (12) (1) (9) (1)
Other operations 287 276 193 46 94 40 — 36 (5) 15
Property 80 73 75 72 68 47 (3) — (3) (2)
Net Investment $ 2,944 $ 2,989 $ 3,334 $ 656 $ 743 $ 704 $ (14) $ 25 $ (20) $ 3
Underlying value $ 3,549 $ 701
Total invested capital was relatively unchanged since June 30, 2009, and $390 million lower than December 31, 2008 due to the sale of a portion of our insurance businesses. Net invested capital at September 30, 2009 declined from the June 30, 2009 levels due to the sale of an operating division within a business services investment, as well as impairment provisions within our forest products investments that are recorded in “Revaluation and Other Items”.
Underlying ValueThe underlying values are determined by market values, actuarial valuations and internal calculations, and totalled $0.7 billion at December 31, 2008, similar to our carrying value.

Brookfield Asset Management | Q3 /2009 Supplemental Information26
Cash and Financial AssetsWe hold a substantial amount of financial assets, cash and equivalents that are available to fund operating activities and investment initiatives.
Invested Capital Operating Cash Flow
Total Net Total NetAS AT AND FOR THE THREE
MONTHS ENDED (MIllIONS)
Sept. 30
2009
June 30
2009
Dec. 31
2008
Sept. 30
2009
June 30
2009
Dec. 31
2008
Sept. 30
2009
Sept. 30
2008
Sept. 30
2009
Sept. 30
2008
Financial assetsGovernment bonds $ 243 $ 197 $ 177 $ 243 $ 197 $ 177
Corporate bonds 172 152 123 172 152 123
Fixed income 9 9 10 9 9 10
High-yield bonds and
distressed debt
411 60 88 411 60 88
Preferred shares 36 33 25 36 33 25
Common shares 168 182 230 168 182 230
Loans receivable 388 60 317 388 60 317
Total financial assets 1,427 693 970 1,427 693 970 $ 92 $ 178 $ 92 $ 178
Cash and cash equivalents 609 536 290 609 536 290 — —
Deposits and other liabilities — — — (533) (387) (187) (7) —
$ 2,036 $ 1,229 $ 1,260 $ 1,503 $ 842 $ 1,073 $ 92 $ 178 $ 85 $ 178
Underlying value $ 1,260 $ 1,073
Total cash and financial asset balances were $2.0 billion at the end of the third quarter of 2009 compared to $1.3 billion at the end of 2008, and net of deposits and other liabilities were $1.5 billion versus $1.1 billion. The increase resulted from equity raised in our North American property operations (Brookfield Properties) to invest in growth initiatives, operating cash flows and an increase in value of investment positions. During the third quarter we substantially increased our holdings in high yield bonds and distressed debt at values that represent attractive valuations of the underlying assets. Net invested capital includes liabilities such as broker deposits and a small number of borrowed securities that have been sold short.
In addition to the carrying values of financial assets, we hold protection against widening credit spreads through credit default swaps with a total notional value of $0.5 billion (December 31, 2008 – $2.5 billion). We have continued to reduce our holdings of credit default swaps in response to improvements in market sentiment. These positions, together with other items gave rise to a large level of investment gain in the third quarter of 2008, which exceeded the 2009 results by approximately $100 million.
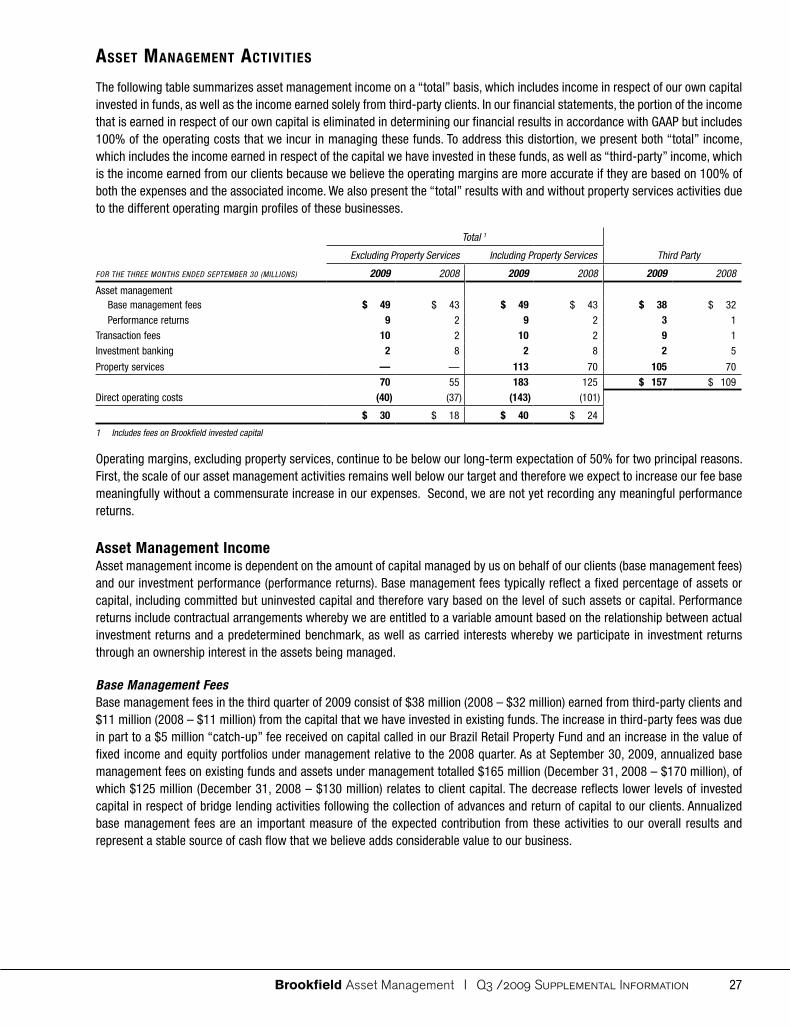
Brookfield Asset Management | Q3 /2009 Supplemental Information 27
asset management activities
The following table summarizes asset management income on a “total” basis, which includes income in respect of our own capital invested in funds, as well as the income earned solely from third-party clients. In our financial statements, the portion of the income that is earned in respect of our own capital is eliminated in determining our financial results in accordance with GAAP but includes 100% of the operating costs that we incur in managing these funds. To address this distortion, we present both “total” income, which includes the income earned in respect of the capital we have invested in these funds, as well as “third-party” income, which is the income earned from our clients because we believe the operating margins are more accurate if they are based on 100% of both the expenses and the associated income. We also present the “total” results with and without property services activities due to the different operating margin profiles of these businesses.
Total 1
Excluding Property Services Including Property Services Third Party
FOR THE THREE MONTHS ENDED SEPTEMBER 30 (MIllIONS) 2009 2008 2009 2008 2009 2008
Asset managementBase management fees $ 49 $ 43 $ 49 $ 43 $ 38 $ 32
Performance returns 9 2 9 2 3 1
Transaction fees 10 2 10 2 9 1
Investment banking 2 8 2 8 2 5
Property services — — 113 70 105 7070 55 183 125 $ 157 $ 109
Direct operating costs (40) (37) (143) (101)
$ 30 $ 18 $ 40 $ 24
1 Includes fees on Brookfield invested capital
Operating margins, excluding property services, continue to be below our long-term expectation of 50% for two principal reasons. First, the scale of our asset management activities remains well below our target and therefore we expect to increase our fee base meaningfully without a commensurate increase in our expenses. Second, we are not yet recording any meaningful performance returns.
Asset Management IncomeAsset management income is dependent on the amount of capital managed by us on behalf of our clients (base management fees) and our investment performance (performance returns). Base management fees typically reflect a fixed percentage of assets or capital, including committed but uninvested capital and therefore vary based on the level of such assets or capital. Performance returns include contractual arrangements whereby we are entitled to a variable amount based on the relationship between actual investment returns and a predetermined benchmark, as well as carried interests whereby we participate in investment returns through an ownership interest in the assets being managed.
Base Management FeesBase management fees in the third quarter of 2009 consist of $38 million (2008 – $32 million) earned from third-party clients and $11 million (2008 – $11 million) from the capital that we have invested in existing funds. The increase in third-party fees was due in part to a $5 million “catch-up” fee received on capital called in our Brazil Retail Property Fund and an increase in the value of fixed income and equity portfolios under management relative to the 2008 quarter. As at September 30, 2009, annualized base management fees on existing funds and assets under management totalled $165 million (December 31, 2008 – $170 million), of which $125 million (December 31, 2008 – $130 million) relates to client capital. The decrease reflects lower levels of invested capital in respect of bridge lending activities following the collection of advances and return of capital to our clients. Annualized base management fees are an important measure of the expected contribution from these activities to our overall results and represent a stable source of cash flow that we believe adds considerable value to our business.
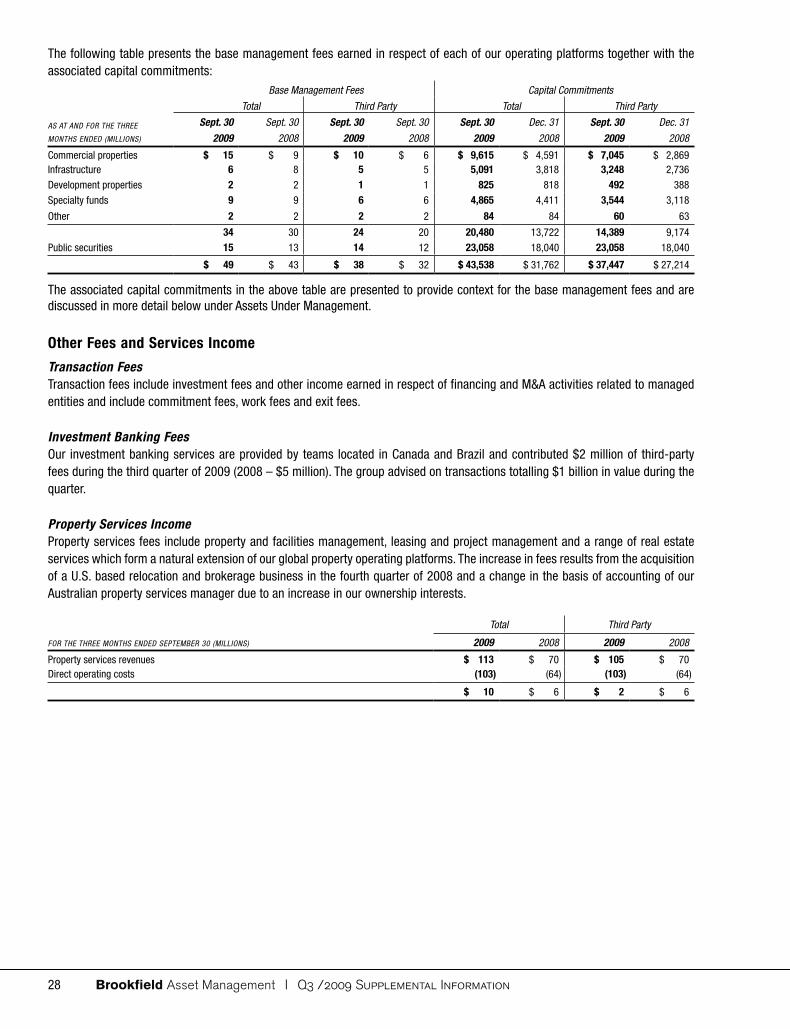
Brookfield Asset Management | Q3 /2009 Supplemental Information28
The following table presents the base management fees earned in respect of each of our operating platforms together with the associated capital commitments:
Base Management Fees Capital Commitments
Total Third Party Total Third Party
AS AT AND FOR THE THREE
MONTHS ENDED (MIllIONS)
Sept. 30
2009
Sept. 30
2008
Sept. 30
2009
Sept. 30
2008
Sept. 30
2009
Dec. 31
2008
Sept. 30
2009
Dec. 31
2008
Commercial properties $ 15 $ 9 $ 10 $ 6 $ 9,615 $ 4,591 $ 7,045 $ 2,869Infrastructure 6 8 5 5 5,091 3,818 3,248 2,736
Development properties 2 2 1 1 825 818 492 388
Specialty funds 9 9 6 6 4,865 4,411 3,544 3,118
Other 2 2 2 2 84 84 60 63
34 30 24 20 20,480 13,722 14,389 9,174
Public securities 15 13 14 12 23,058 18,040 23,058 18,040
$ 49 $ 43 $ 38 $ 32 $ 43,538 $ 31,762 $ 37,447 $ 27,214
The associated capital commitments in the above table are presented to provide context for the base management fees and are discussed in more detail below under Assets Under Management.
Other Fees and Services Income
Transaction Fees Transaction fees include investment fees and other income earned in respect of financing and M&A activities related to managed entities and include commitment fees, work fees and exit fees.
Investment Banking FeesOur investment banking services are provided by teams located in Canada and Brazil and contributed $2 million of third-party fees during the third quarter of 2009 (2008 – $5 million). The group advised on transactions totalling $1 billion in value during the quarter.
Property Services Income Property services fees include property and facilities management, leasing and project management and a range of real estate services which form a natural extension of our global property operating platforms. The increase in fees results from the acquisition of a U.S. based relocation and brokerage business in the fourth quarter of 2008 and a change in the basis of accounting of our Australian property services manager due to an increase in our ownership interests.
Total Third Party
FOR THE THREE MONTHS ENDED SEPTEMBER 30 (MIllIONS) 2009 2008 2009 2008
Property services revenues $ 113 $ 70 $ 105 $ 70Direct operating costs (103) (64) (103) (64)
$ 10 $ 6 $ 2 $ 6
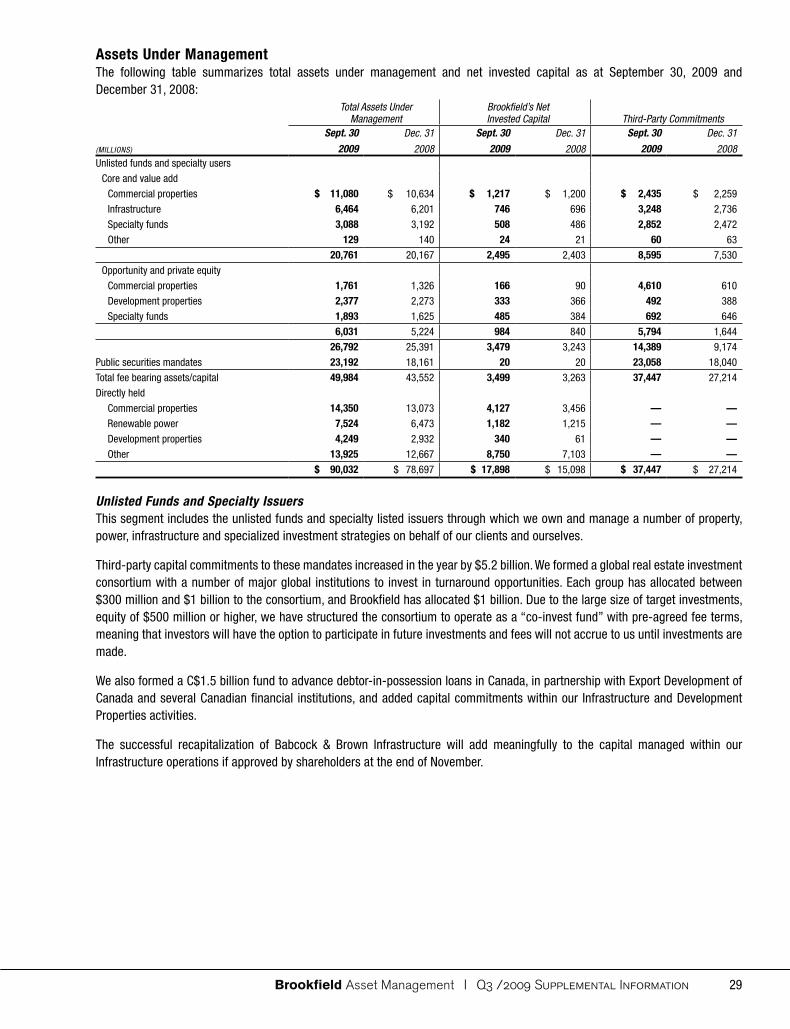
Brookfield Asset Management | Q3 /2009 Supplemental Information 29
Assets Under ManagementThe following table summarizes total assets under management and net invested capital as at September 30, 2009 and December 31, 2008:
Total Assets Under Management
Brookfield’s Net Invested Capital Third-Party Commitments
(MIllIONS)
Sept. 30
2009
Dec. 31
2008
Sept. 30
2009
Dec. 31
2008
Sept. 30
2009
Dec. 31
2008Unlisted funds and specialty users
Core and value add
Commercial properties $ 11,080 $ 10,634 $ 1,217 $ 1,200 $ 2,435 $ 2,259
Infrastructure 6,464 6,201 746 696 3,248 2,736
Specialty funds 3,088 3,192 508 486 2,852 2,472
Other 129 140 24 21 60 63 20,761 20,167 2,495 2,403 8,595 7,530
Opportunity and private equity
Commercial properties 1,761 1,326 166 90 4,610 610
Development properties 2,377 2,273 333 366 492 388
Specialty funds 1,893 1,625 485 384 692 646 6,031 5,224 984 840 5,794 1,644
26,792 25,391 3,479 3,243 14,389 9,174
Public securities mandates 23,192 18,161 20 20 23,058 18,040
Total fee bearing assets/capital 49,984 43,552 3,499 3,263 37,447 27,214
Directly held
Commercial properties 14,350 13,073 4,127 3,456 — — Renewable power 7,524 6,473 1,182 1,215 — — Development properties 4,249 2,932 340 61 — — Other 13,925 12,667 8,750 7,103 — —
$ 90,032 $ 78,697 $ 17,898 $ 15,098 $ 37,447 $ 27,214
Unlisted Funds and Specialty IssuersThis segment includes the unlisted funds and specialty listed issuers through which we own and manage a number of property, power, infrastructure and specialized investment strategies on behalf of our clients and ourselves.
Third-party capital commitments to these mandates increased in the year by $5.2 billion. We formed a global real estate investment consortium with a number of major global institutions to invest in turnaround opportunities. Each group has allocated between $300 million and $1 billion to the consortium, and Brookfield has allocated $1 billion. Due to the large size of target investments, equity of $500 million or higher, we have structured the consortium to operate as a “co-invest fund” with pre-agreed fee terms, meaning that investors will have the option to participate in future investments and fees will not accrue to us until investments are made.
We also formed a C$1.5 billion fund to advance debtor-in-possession loans in Canada, in partnership with Export Development of Canada and several Canadian financial institutions, and added capital commitments within our Infrastructure and Development Properties activities.
The successful recapitalization of Babcock & Brown Infrastructure will add meaningfully to the capital managed within our Infrastructure operations if approved by shareholders at the end of November.

Brookfield Asset Management | Q3 /2009 Supplemental Information30
Public SecuritiesWe manage fixed income and equity securities with a particular focus on distressed real estate and infrastructure. The following table summarizes assets under management within these operations. We typically do not invest our own capital in these strategies as the assets under management are securities as opposed to physical assets.
Total Assets Under
Management Third-Party Commitments
(MIllIONS)
Sept. 30
2009
Dec. 31
2008
Sept. 30
2009
Dec. 31
2008
Public securitiesFixed income $ 18,169 $ 15,199 $ 18,035 $ 15,078
Equity 5,023 2,962 5,023 2,962
$ 23,192 $ 18,161 $ 23,058 $ 18,040
Equity securities and fixed income under management increased in the quarter as market values improved and we secured $1.4 billion of new advisory mandates during the quarter offset by $0.4 billion of redemptions.
financing and OPerating cOsts
InterestInterest costs include interest on corporate borrowings, certain subsidiary borrowings, property-specific borrowings and capital securities as set out in the following table:
Total Net
FOR THE THREE MONTHS ENDED SEPTEMBER 30 (MIllIONS) 2009 2008 Variance 2009 2008 Variance
Corporate borrowings $ 40 $ 41 $ (1) $ 40 $ 41 $ (1)
Subsidiary borrowings1 88 90 (2) 22 18 4
Property-specific borrowings 310 381 (71) — — —
Capital securities 23 23 — 23 23 —
$ 461 $ 535 $ (74) $ 85 $ 82 $ 3
1 Relates to financial obligations that are guaranteed by the Corporation or issued by direct corporate subsidiaries
Total interest costs decreased by $74 million compared with the third quarter of 2008 primarily due to the impact of lower interest rates on floating rate property specific debt. Net interest costs were relatively unchanged as the borrowings are largely fixed rate.
Average borrowing levels and costs for the third quarters of 2009 and 2008 are as follows:
2009 2008
FOR THE THREE MONTHS ENDED SEPTEMBER 30 (MIllIONS)
Average
Outstanding
Interest
Expense
Average
Rate
Average
Outstanding
Interest
Expense
Average
Rate
Corporate borrowings $ 2,225 $ 40 7% $ 2,372 $ 41 7%
Subsidiary borrowings 5,281 88 7% 6,965 90 5%
Property-specific borrowings 23,665 310 5% 23,160 381 7%
Capital securities 1,555 23 6% 1,649 23 6%
$ 32,726 $ 461 6% $ 34,146 $ 535 6%
Average borrowing levels declined due to the application of proceeds from capital raising initiatives to reduce revolving credit facilities and de-levering certain assets, offset by currency appreciation.

Brookfield Asset Management | Q3 /2009 Supplemental Information 31
OperatingOperating costs relate to our asset management and corporate activities, and for the third quarter of 2009 and 2008 were as follows:
Total Net
FOR THE THREE MONTHS ENDED SEPTEMBER 30 (MIllIONS) 2009 2008 Variance 2009 2008 Variance
Asset managementAsset management activities $ 40 $ 37 $ 3 $ 40 $ 37 $ 3
Property services 103 64 39 103 64 39
143 101 42 143 101 42
Corporate and other costs 50 66 (16) 47 57 (10)
$ 193 $ 167 $ 26 $ 190 $ 158 $ 32
Operating costs include those of Brookfield Properties, and reflect the costs of our asset management activities as well as costs which are not directly attributable to specific business units. Property services expenses in the third quarter of 2009 increased due to the acquisition of a U.S. based relocation and brokerage services business in the fourth quarter of 2008 and an increase in the number of contracted service agreements.
Interests of Other Investors in Consolidated Operations
Operating Cash Flow
Total Net
FOR THE THREE MONTHS ENDED SEPTEMBER 30 (MIllIONS) 2009 2008 Variance 2009 2008 Variance
Commercial propertiesBrookfield Properties $ 70 $ 146 $ (76) $ 70 $ 146 $ (76)
Property funds and other 41 26 15 3 4 (1)
Renewable power generation 31 22 9 — — —Infrastructure 8 19 (11) — — —
Development and other properties 23 (2) 25 — — —
Specialty funds 37 16 21 — — —
Investments (5) 8 (13) — — —
$ 205 235 (30) 73 150 (77)
Co-investor interests on a net basis relate primarily to the interests of minority shareholders in Brookfield Properties, which were $70 million during the quarter compared with $146 million for the same quarter last year which consisted of $84 million in respect of a realization gain, and $62 million excluding the gain. Improved commercial office results were offset by a lower contribution from the residential operations conducted by the company.
On a total basis, interest of others declined by $30 million, as the decrease in cash flows attributed to other investors in our commercial properties operations, was offset by other investors’ participation in higher cash flows generated within our Brazilian residential operations and specialty funds.

Brookfield Asset Management | Q3 /2009 Supplemental Information32
net incOme
Net income was $112 million in the third quarter of 2009, compared to $171 million in the same quarter in 2008. Prior to revaluation and other items, net income was $237 million, compared to $106 million in the 2008 quarter.
The following table summarizes our consolidated statements of net income and the subsequent discussion pertains to items not discussed elsewhere in this analysis:
Three Months Ended Sept. 30 Nine Months Ended Sept. 30
(MIllIONS) 2009 2008 2009 2008
Revenues $ 2,996 $ 3,216 $ 8,625 $ 9,862
Net operating income 1,377 1,294 3,518 3,848Expenses
Interest (461) (535) (1,328) (1,537)
Asset management and other operating costs (193) (167) (518) (480)
Current income taxes 2 (2) (40) (40)
Non-controlling interests in the foregoing (205) (235) (563) (615)520 355 1,069 1,176
Other items, net of non-controlling interests (408) (184) (717) (698)
Net income $ 112 $ 171 $ 352 $ 478
RevenuesThree Months Ended Sept. 30 Nine Months Ended Sept. 30
(MIllIONS) 2009 2008 2009 2008
Asset management $ 157 $ 109 $ 385 $ 336
Commercial properties 810 747 2,201 2,210Power generation 299 327 899 1,028
Infrastructure 99 160 309 458
Development and other properties 720 921 2,010 2,749
Specialty funds 488 444 1,371 1,570
Investment income and other 423 508 1,450 1,511$ 2,996 $ 3,216 $ 8,625 $ 9,862
Revenues declined from $3.2 billion in the third quarter of 2008 to $3.0 billion in the third quarter of 2009. The decrease reflects the impact of lower exchange rates on non-U.S. revenues as well as a lower level of activity in our construction, residential, insurance and timber operations. The impact of the lower volumes on operating cash flows is discussed within the review of Operating Platforms.
Net Operating IncomeNet operating income includes the following items from our consolidated statements of income: fees earned; operating revenues less direct operating expenses; and investment and other income. These items are described for each business unit in Part 2 – Performance Review.
Other ItemsOther items are summarized in the following table, and include items that are non-cash in nature or otherwise not considered by us to form part of our operations cash flow.
Total Net 1
FOR THE THREE MONTHS ENDED MARCH 31 (MIllIONS) 2009 2008 2009 2008 Variance
Depreciation and amortization $ 321 $ 333 $ 180 $ 202 $ (22)
Equity accounted results — 11 — 11 (11)
Revaluation and other items 192 (104) 157 (105) 262
Future income taxes 48 105 71 76 (5)
Non-controlling interests (153) (161) — — —
$ 408 $ 184 $ 408 $ 184 $ 224
1 Net of non-controlling and minority interests

Brookfield Asset Management | Q3 /2009 Supplemental Information 33
Depreciation and AmortizationDepreciation and amortization for each principal operating segment is summarized in the following table:
Total Net 1
FOR THE THREE MONTHS ENDED SEPTEMBER 30 (MIllIONS) 2009 2008 2009 2008 Variance
Commercial properties $ 165 $ 165 $ 76 $ 73 $ 3Power generation 49 50 41 45 (4)
Infrastructure 31 34 13 22 (9)
Development and other properties 30 51 18 40 (22)
Specialty funds and investments 45 32 31 21 10
Other 1 1 1 1 —
$ 321 $ 333 $ 180 $ 202 $ (22)
1 Net of non-controlling and minority interests
The reduction on a net basis within our power generating business is due to the transfer of Canadian assets to our 50% owned power fund, increasing the amount of depreciation attributable to co-investors, although consolidated depreciation remained unchanged. We recognize depletion expense in our timberlands operations on a volumetric basis and accordingly have a lower expense in 2009 because we reduced harvest levels in order to capture higher values in future periods. Certain intangible assets recognized in respect of acquisitions were fully amortized over the course of 2008 resulting in lower ongoing expense within the Development segment in 2009.
Equity Accounted ResultsWe recorded net equity accounted losses of $11 million during the third quarter of 2008 from our investment in Norbord. We increased our interest in Norbord to 60% at the end of 2008 and to 75% during the first quarter of 2009. We have continued to account for Norbord on an equity accounted basis for the purposes of this analysis, consistent with prior treatment.
Revaluation and Other ItemsRevaluation and other items are comprised of non-cash accounting adjustments that we are required to record under GAAP to reflect changes in the value of certain contractual arrangements whereas we are not permitted to revalue the corresponding assets or revenues to which these arrangements pertain. Changes in the value of these arrangements contributed a negative $125 million to net income after taking into account non-controlling and minority interests and associated tax provisions, representing a $190 million negative variance over 2008, as illustrated in the following table:
Total Net 1
FOR THE THREE MONTHS ENDED SEPTEMBER 30 (MIllIONS) 2009 2008 2009 2008 Variance
Norbord exchangeable debentures $ — $ (20) $ — $ (20) $ 20
Interest rate contracts 46 30 46 30 16
Power contracts 5 (132) (2) (134) 132
Provisions for potential impairment 72 — 60 — 60
Other 69 18 53 19 34192 (104) 157 (105) 262
Less: future tax provisions (32) 40 (32) 40 (72)$ 160 $ (64) $ 125 $ (65) $ 190
1 Net of non-controlling and minority interests
We hold a $1.4 billion notional amount of interest rate contracts to provide an economic hedge against the impact of higher interest rates on the value of our long-duration interest sensitive physical assets. The relevant interest rate curves changed between June 30, 2009 and September 30, 2009 by nearly 50 basis points, which led to a $46 million decrease in the net value of these contracts. A 10 basis point parallel increase in the 10-year interest rate curves results in a pre-tax gain of approximately $9 million.
In our power operations, we enter into long-term contracts to provide generation capacity, and are required to record changes in the market value of certain contracts through net income. We recorded a small loss on these contracts in the current quarter, whereas we recorded a very large gains in the third quarter of 2008, during which prices experienced a large decline.

Brookfield Asset Management | Q3 /2009 Supplemental Information34
We have recorded provisions in respect of certain residential developments in Australia, the carrying values of which included profits capitalized in the acquisition price and other charges related to the closure of a pulp mill owned by a forest products investee.
The remaining Norbord exchangeable debentures were redeemed in the second quarter of 2009.
Future Income TaxesThe following table presents the provisions recorded in respect of changes in the value of the tax basis of our net assets and tax losses. We continue to maintain substantial tax loss carry forwards, which we expect will reduce the amount of cash taxes payable by us in future years. We accrued a $2 million recovery in respect of cash income taxes during the current quarter, compared with $2 million expense in the third quarter of 2008.
Total Net 1
FOR THE THREE MONTHS ENDED SEPTEMBER 30 (MIllIONS) 2009 2008 2009 2008
Aggregate provisions $ 48 $ 105 $ 71 $ 76Less: attributable to revaluation and other items 32 (40) 32 (40)
$ 80 $ 65 $ 103 $ 36
1 Net of non-controlling and minority interests
The tax provision for the current quarter includes $105 million in respect of the realization gains in 2009, compared with $32 million in the third quarter of 2008.
OutlOOkThe current economic circumstances continue to be challenging, including increasing levels of unemployment, lower consumer and business confidence and spending, and uncertainty with respect to the longer term implications of government sponsored initiatives to restore the health of the global economy. There have been a number of encouraging signs of recovery in recent months, but we are continuing to be cautious in our outlook.
While we have not been immune to these factors, we attempt to organize our operations in a manner that provides an important measure of stability, consistent with our long-term business strategy. In particular, we believe that our focus on owning high quality assets, backing revenue streams with long-term contractual arrangements, match funding long life assets with long-term financings and maintaining a high level of liquidity has, and will continue to, benefit us during these volatile times.
Accordingly, while these events may constrain our ability to increase operating cash flows in the near term, we remain confident in our ability to achieve our long-term objectives. Furthermore, we believe we will have the opportunity to make investments during this period at very favourable prices that will create attractive shareholder value in the future.
We believe that our renewable power operations are well positioned to exceed our targets of long-term average generation in 2009 based on current storage levels if normal hydrology conditions prevail. The forecast for natural gas and electricity prices during the balance of 2009 and 2010 is lower than the spot prices we received in 2008. We have, however, contracted pricing for approximately 80% of our generation until 2011 at prices that significantly exceed current electricity prices. In addition, we are working with to contract our production in Ontario, (approximately 2,300 gigawatt annually or 18% of our long-term average generation).
In our office property sector, leasing demand in most of our markets has tempered while direct and sublease availabilities have increased, resulting in downward pressure on rents and economic fundamentals. Our occupancy levels, however, are at 96% across our portfolio and only 1% and 4% of the space within our portfolio is scheduled to come off lease during the balance of 2009 and 2010, respectively, of which a large portion is customarily renewed in the normal course. The high quality of our properties relative to others in our markets should enable us to attract new tenants if we are unsuccessful in extending leases with the existing tenants. Furthermore, we believe our in-place rents continue to be below market. Within our North American portfolio, our average expiring rates in 2009 are $24 per square foot compared with an estimated average market rate of $28 per square foot, representing a substantial discount. A general lack of development, especially in central business districts, has also created stability from a supply perspective. Nevertheless, a prolonged continuation of the current economic downturn could lead to tenant bankruptcies and lower market rents which could reduce our cash flows. Our strong tenant lease profile, low vacancies and rental rates that in most properties are substantially below current market rates give us a high level of confidence that we can achieve our operating targets in 2009.

Brookfield Asset Management | Q3 /2009 Supplemental Information 35
Within our infrastructure operations, we expect our transmission businesses to provide operating returns in 2009 consistent with those recorded in 2008, excluding non-recurring items. We expect our timber operations to continue to experience reduced demand and pricing due to weakness in the U.S. homebuilding sector. As a result, we have elected to reduce harvest levels in order to preserve value and increase exports to Asia, which we believe will enable us to achieve higher returns as markets recover. We expect harvest levels in Canada and the U.S. to be approximately 30% and 50% below 2008 levels, respectively.
Residential markets remain strong in Brazil; good in Canada; and weak in the U.S. The current supply/demand imbalance in North American markets has reduced operating margins and must be worked through before we experience margin improvements and volume growth. In the U.S. we have been successful in acquiring additional lots at distress prices while preserving value in our existing businesses. Most of the land holdings within our Canadian land operations were purchased in the mid-1990s or earlier and as a result have an embedded cost advantage today. This has led to favourable margins in this region and sales activity has appeared to increase recently. We expanded our Brazilian operations during 2008 which has led to an increased contribution from these markets during 2009.
In our specialty funds operations we are focusing on deploying the capital from new funds, which should lead to long-term growth. In the short-term, we expect that the current difficulties in credit markets will lead to a greater number of opportunities for our restructuring operations, and more attractive pricing for our real estate finance group, although the same conditions will likely reduce opportunities to monetize investments and the opportunity to recognize disposition gains.
Within our asset management activities, our goal is to continue to expand our distribution capabilities, our client base and the amount of capital committed to us, which should, over time, increase the capital available to invest and lead to growth in asset management income. The current environment has made it more challenging to raise additional capital commitments from certain institutions, however we have successfully increased allocations from institutions by $10 billion during 2009 due to new allocation and higher valuations within our managed public securities portfolios. There are a number of investors that, like us, believe that the current environment offers considerable opportunities and wish to commit capital alongside ours. While it is currently more difficult to earn performance income, we expect to record a stable contribution from base management fees in 2009.
The fluctuations in the value of the U.S. dollar against various currencies impacts the contribution from our operations that are denominated in these other currencies, notably the Canadian dollar, the Brazilian real and the Australian dollar in 2009. The recent strengthening of these currencies is generally beneficial to both our operating cash flows and equity values. Lower short term interest rates in most economies has a beneficial impact on our results, although this is limited because most of our financings are fixed rate in nature. Similarly, the long-term nature of our borrowing base and the relatively low proportion of annual debt maturities lessens the impact of higher credit spreads on new financings.
We have endeavoured to extend debt maturities on a proactive basis and reduce near-term financing requirements. Although we expect to renew or replace most of our existing financings at equivalent levels, we may reduce leverage in certain areas of our business. While we expect that any deleveraging will likely have a limited impact on our short term operating results, it would reduce the capital available for investment. We maintain a high level of liquidity as further discussed in Part 3 of this Supplemental, and regularly replenish our liquidity through operating cash flow and asset monetizations.
Over the past eighteen months, the investment market has become less competitive and acquisition prices have declined due in large part to reduced availability of capital for many owners and investors. The access to liquidity from our own balance sheet as well as from our clients, financial partners and the capital markets continues to provide us with funds to invest in our own operations and in new opportunities. We believe the breadth of our operating platforms and our disciplined approach should enable us to invest this capital on a favourable basis for the balance of 2009 through 2011.
There are many factors that could impact our performance in 2009, both positively and negatively. We describe the material aspects of our business environment and risks in Part 5 of the MD&A contained in our 2008 Annual Report.
Brookfield Asset Management | Q3 /2009 Supplemental Information36
PART 3 – CAPITALIzATION AND LIqUIDITyThe strength of our capital structure and the liquidity that we maintain enable us to achieve a low cost of capital for our shareholders and at the same time provide us with the flexibility to react quickly to potential investment opportunities and adverse changes in economic circumstances, such as we have witnessed over the past 18 months.
The following are the key elements of our capital strategy:
• Match fund our long-life assets with long-duration mortgage financings with a diversified maturity schedule;
• Provide recourse only to the specific assets being financed, with limited cross collateralization or parental guarantees;
• Limit financial leverage to investment grade levels based on anticipated performance throughout a business cycle;
• Structure our affairs to facilitate access to capital and liquidity at multiple levels of the organization; and
• Maintain access to a broad range of financing markets.
liquidity
Core LiquidityOur primary sources of liquidity, which we refer to as “core liquidity”, consist of our cash and financial assets, net of deposits and other associated liabilities, and undrawn committed credit facilities at the corporate level and at our principal operating platforms.
Our core liquidity at September 30, 2009 is approximately $3.8 billion, which includes liquidity of $2.8 billion at the corporate level and $1.0 billion at our principal operating platforms. At June 30, 2009, we maintained $2.5 billion of core liquidity.
During the quarter we completed $1.8 billion of financings, asset monetizations and equity issuances at subsidiaries which generated $1.3 billion of liquidity net of associated refinancings and equity participation. Highlights included the issuance of $1.0 billion of common equity by our North American commercial property subsidiary of which we subscribed for 50%. Approximately $0.5 billion of the proceeds were used to repay shorter term revolving lines of credit with the balance included in current liquidity.
We generate substantial liquidity within our operations on an ongoing basis through our operating cash flow, which typically exceeds $1.5 billion on an annual basis, as well as from the turnover of assets with shorter investment horizons and periodic monetization of our longer-dated assets through sales, refinancings or co-investor participations. Accordingly, we believe we have the necessary liquidity to manage our financial commitments and to capitalize on opportunities to invest capital at attractive returns. Nevertheless, we are cognizant of the current instability in the capital markets and continue to place a premium on liquidity and allocate capital in a cautious manner.
Debt Maturities The following table summarizes our corporate and subsidiary debt maturities prior to 2012 based on our proportionate ownership of the borrowing entity. Corporate maturities and our proportionate share of subsidiary maturities which occur prior to 2012 totalled $2.2 billion with only $200 million at the corporate level. We expect to refinance or roll over most, if not all, of this debt in the normal course. We can also fund reductions, if necessary, with our core liquidity.
AS AT SEPTEMBER 30, 2009 (MIllIONS) 2009 2010 2011
Corporate $ — $ 200 $ —
Subsidiary 545 858 626$ 545 $ 1,058 $ 626
Long-term property specific financings represent most of our debt capitalization. These borrowings are typically low loan-to-value, have few restrictive covenants, are secured by our high quality assets and have no recourse to either the Corporation or our subsidiaries. Maturities occurring prior to 2012 are discussed in further detail under “Property-specific Borrowings” below.
Brookfield Asset Management | Q3 /2009 Supplemental Information 37
Our focus on arranging financings with investment grade characteristics ensures that debt levels on any particular asset or group of assets can typically be maintained throughout a business cycle, and also enables us to limit covenants and other performance requirements, thereby reducing the risk of early payment requirements or restrictions on the distribution of cash from the assets being financed. We believe these maturities should be refinanceable at the current borrowing levels on an overall basis and maintain ample liquidity to delever individual properties if necessary.
The carrying values of our financial obligations in our financial statements and this analysis are, in almost all circumstances, based on the original issuance adjusted for currency revaluations and may not necessarily reflect current values. We actively monitor secondary trading levels of our obligations and our counterparty arrangements to identify opportunities to repurchase securities at a discount and to ensure that our counterparties are fulfilling their obligations to us. We repurchased $10 million of our debt obligations during the first nine months of the year at a discount to their par values, resulting in a modest gain. We continue to consider these and other initiatives, and are prepared to commit liquidity to them because, if successful, they could reduce our liabilities by a meaningful discount thereby benefiting our underlying values, improving cash flow from operations on a per share basis and potentially giving rise to meaningful accounting gains. There is, however, no assurance that we will be successful in this regard and we will base our decisions in these matters in the context of the returns available from other opportunities to invest our capital.
caPitalizatiOnAs a result of our financing strategy, only a small proportion of the borrowings within the businesses that we manage has any direct recourse to the Corporation. The majority of the borrowings have recourse only to the specific assets that they finance and are typically in the form of relatively low loan-to-value first mortgages or project financings. Furthermore, most of the borrowings to assets or businesses in which we only own a portion and therefore our pro rata exposure to this debt is much lower. Nevertheless, in many cases accounting guidelines require that we include 100% of these borrowings in our consolidated balance sheets. In addition, we acquired a number of our assets many years ago, often at distress prices, and have depreciated them for accounting purposes since then. As a result, the book values and equity are often significantly understated relative to values on which the current financing was based.
Accordingly, we believe that the two most meaningful bases of presentation of our capitalization are proportionate consolidation and deconsolidated using underlying values as presented in the following table. In our opinion, the consolidated capitalization is less meaningful and can only be assessed in the context of the overall asset base of the company and taking into consideration the full ownership base, including minority shareholders and institutional fund investors, which can be difficult to assess in the context of historical cost consolidated financial statements. The following table presents these balance sheets, using December 31, 2008 underlying values on a pre-tax basis together with the reconciling adjustments.

Brookfield Asset Management | Q3 /2009 Supplemental Information38
AS AT DECEMBER 31, 2008
(MIllIONS)
Deconsolidated
Balance Sheet 1
(Book Value)
Add: Underlying
Value Adjustments 2
Deconsolidated
Balance Sheet 1
(Underlying Value)
Add: Proportionate
Share of Underlying
Assets and
liabilities 3
Proportionate
Balance Sheet
(Underlying
Value)
Add: Assets
and liabilities
Attributable
to Others 4
Total
Balance Sheet
(Underlying
Value)
Commercial properties $ 3,112 $ 1,318 $ 4,430 $ 7,009 $ 11,439 $ $ Renewable power generation 1,215 7,393 8,608 2,930 11,538
Infrastructure 761 293 1,054 477 1,531Development and other properties 2,062 154 2,216 2,549 4,765Specialty funds 849 31 880 427 1,307Investments 704 84 788 1,014 1,802Cash and financial assets 1,043 — 1,043 1,035 2,078Other assets 872 (33) 839 5,696 6,535
$ 10,618 $ 9,240 $ 19,858 $ 21,137 $ 40,995 $ 26,956 $ 67,951
Corporate borrowings $ 2,284 $ — $ 2,284 $ — $ 2,284 $ — $ 2,284Subsidiary borrowings 733 — 733 2,922 3,655 1,447 5,102Property specific mortgages — — — 11,976 11,976 10,913 22,889
Other liabilities 1,277 — 1,277 5,798 7,075 5,041 12,1164,294 — 4,294 20,696 24,990 17,401 42,391
Capitalization
Co-investors interests and capital securities
543 — 543 441 984 9,555 10,539
Shareholders’ equity 5,781 9,240 15,021 — 15,021 — 15,0216,324 9,240 15,564 441 16,005 9,555 25,560
$ 10,618 $ 9,240 $ 19,858 $ 21,137 $ 40,995 $ 26,956 $ 67,951Debt-to-capitalization 28% 15% 44% 45%
1 Includes Brookfield Properties on an equity-accounted basis, whereas the disclosures elsewhere in this analysis presents the operations of Brookfield Properties on a consolidated basis unless stated otherwise
2 Adjusts deconsolidated book values to reflect values determined as at December 31, 2008 using procedures and processes expected to be followed in preparing IFRS financial statements (refer to discussion of underlying values on pages 6 and 7 under “Performance Review”) and excluding future tax liabilities
3 Represents our proportionate interest in the assets and liabilities of our managed funds and operating units4 Represents the liabilities and equity interests in our managed funds and operating units attributable to our co-investors that are included in our consolidated balance sheet under
GAAP
Our strategy of financing primarily at the asset or operating unit level has resulted in us having a relatively low level of debt at the parent company level, as shown in our deconsolidated capitalization. The pro-forma debt to total capitalization on a deconsolidated basis was 15% based on pre-tax underlying values as at December 31, 2008 and 28% based on book values. The higher percentage on a book value basis reflects the impact of accounting depreciation on our long-life assets as well as the relatively low acquisition prices of assets purchased on an opportunistic basis over the years. The pro-forma debt to pre-tax underlying value capitalization was 44% on a proportionately consolidated basis, which we believe is appropriate given the quality of our long-term assets and the level of financing that assets of this nature typically support, as well as our liquidity profile. Even on a fully consolidated basis, our debt-to-capitalization at December 31, 2008 was only 45%. We believe our debt-to-capitalization metrics are similar at the date of this report.
We provide a reconciliation between the deconsolidated balance sheet in the foregoing table and the net invested capital basis employed elsewhere in the Supplemental on page 44.

Brookfield Asset Management | Q3 /2009 Supplemental Information 39
Corporate BorrowingsOur corporate borrowings have a weighted average term of nine years (December 31, 2008 – nine years) and over 90% of the maturities extend into 2012 and beyond. The average interest rate on our corporate borrowings was 7% at September 30, 2009, compared to 5% at December 31, 2008.
Net Invested Capital
(MIllIONS) Average Term
Sept. 30
2009
Dec. 31
2008
Commercial paper and bank borrowings 3 $ 21 $ 649Public term debt 10 2,004 1,485
Private term debt 4 184 150
Total 9 $ 2,209 $ 2,284
The Corporation has $1,445 million of committed corporate two-year and three-year revolving term credit facilities which are utilized principally as back-up credit lines to support commercial paper issuance. At September 30, 2009, $21 million of these facilities were drawn or allocated as back-up to outstanding commercial paper, and approximately $119 million (December 31, 2008 – $104 million) of the facilities were utilized for letters of credit issued to support various business initiatives.
As shown in the table below, our only corporate maturity prior to 2012 is a $200 million bond maturity in 2010.
AS AT SEPTEMBER 30, 2009 (MIllIONS) 2009 2010 20112012
and After Total
Term debt $ — $ 200 $ — $ 1,988 $ 2,188Commercial paper and bank borrowings — — — 21 21
Corporate maturities $ — $ 200 $ — $ 2,009 $ 2,209
Subsidiary BorrowingsWe capitalize our subsidiary entities to facilitate continuous access to the debt capital markets, usually on an investment grade basis, thereby reducing the demand for capital from the Corporation and sharing the cost of financing equally among other equity holders in partly owned subsidiaries.
Subsidiary borrowings have no recourse to the Corporation with only a limited number of exceptions. As at September 30, 2009, subsidiary borrowings included $786 million (December 31, 2008 – $733 million) of financial obligations that are either guaranteed by the Corporation or are issued by direct corporate subsidiaries.
Deconsolidated
Interest
Proportionate
Interest Consolidated
(MIllIONS) Average Term
Sept. 30
2009
Sept. 30
2009
Sept. 30
2009
Dec. 31
2008
Subsidiary borrowingsCommercial properties 1 $ — $ 302 $ 354 $ 441
Power generation 7 — 960 960 652
Infrastructure 1 — 1 7 146
Development and other properties 2 — 1,067 1,426 1,097
Specialty funds 2 — 195 343 386
Investments and other 4 — 770 921 936
Corporate subsidiaries 1 6 786 786 786 733
Co-investor capital
Properties 4 — — 426 711
Total 4 $ 786 $ 4,081 $ 5,223 $ 5,102
1 Includes $746 million of subsidiary obligations which are guaranteed by the Corporation

Brookfield Asset Management | Q3 /2009 Supplemental Information40
The following table presents our proportionate share of subsidiary borrowings, based on our ownership interest in the borrowing entity:
AS AT SEPTEMBER 30, 2009 (MIllIONS) 2009 2010 20112012
and After Total
Brookfield Renewable Power term debt $ 262 $ — $ — $ 698 $ 960
Brookfield Australia term bank facility 132 655 — — 787
Brookfield Properties corporate bank facilities — 49 — — 49
Retractable preferred shares 40 — — — 40
Other subsidiary borrowings 111 154 626 1,354 2,245
$ 545 $ 858 $ 626 $ 2,052 $ 4,081
Brookfield Renewable Power has $262 million of public term notes that mature in December 2009. The substantial cash flow generated within this business and the high quality of its asset base facilitates access to capital markets notwithstanding current volatility, and in that regard we completed a public offering of C$300 million (US$244 million) of three-year notes in February 2009. In April 2009 we exchanged a further C$100 million (US$82 million) of the December maturity for three-year notes. The remaining borrowings consist of public notes that mature in 2018 and 2036.
The Brookfield Australia bank facility represents a loan-to-value ratio of less than 50% and the portfolio is well leased with 99% occupancy and an average lease term of eight years. Our goal is to permanently finance the business with corporate facilities and asset-specific mortgages on the properties prior to the maturity in 2010.
Brookfield Properties corporate bank facilities represents our share of borrowings under $513 million of term credit facilities with a group of major financial institutions. The company extended $413 million of the facilities until 2011. These facilities were undrawn at the end of the quarter. The balance represents a $100 million term loan which matures in 2010.
Property-specific BorrowingsAs part of our financing strategy, we raise the majority of our debt capital in the form of property-specific mortgages that have recourse only to the assets being financed and have no recourse to the Corporation.
Deconsolidated
Interest
Proportionate
Interest Consolidated
(MIllIONS) Average Term
Sept. 30
2009
Sept. 30
2009
Sept. 30
2009
Dec. 31
2008
Commercial properties 6 $ — $ 6,435 $ 14,603 $ 13,870Power generation 12 — 2,978 3,802 3,588
Infrastructure 8 — 659 1,660 1,642
Development and other properties 2 — 1,917 2,759 2,677
Specialty funds 5 — 323 1,022 1,112
Total 6 $ — $ 12,312 $ 23,846 $ 22,889
We continue to raise property-specific borrowing in the normal course of business despite the more challenging credit environment, due to the quality of the assets and the sustainability of the cash flows being financed. The increase in consolidated borrowings is due primarily to the impact of higher currency exchange rates on the carrying values of non-U.S. borrowings.

Brookfield Asset Management | Q3 /2009 Supplemental Information 41
The following table presents our proportionate share of property-specific borrowings based on our ownership interest in the borrowing entity:
AS AT SEPTEMBER 30, 2009 (MIllIONS) 2009 2010 20112012
and After Total
Commercial propertiesOffice – North America $ 44 $ 21 $ 1,146 $ 2,685 $ 3,896
Office – Australia 228 1,109 46 220 1,603
Office – United Kingdom — 26 — 670 696
Retail – Brazil — — — 240 240
Power generation
North America 12 137 52 2,187 2,388
Brazil 220 30 32 308 590
Infrastructure — 17 15 627 659
Development and other properties
North American opportunity funds 7 75 135 177 394
Residential investing and working capital – Canada 77 165 5 230 477
Residential investing and working capital – United States 51 138 16 — 205
Property development – Australia 150 507 28 62 747
Property development – United Kingdom — 94 — — 94
Specialty funds — 98 — 225 323
$ 789 $ 2,417 $ 1,475 $ 7,631 $ 12,312
Commercial property financings are secured by high quality office buildings on an individual or, in certain circumstances, pooled basis. Many of the financings which mature in the next three years were arranged a number of years ago and, accordingly, represent a low loan to value. As a result, we expect to refinance most of these maturities in the normal course at the same or a higher level. The remaining average term of financings was six years as at September 30, 2009. Financing terms in our North American, European and Brazilian operations, exceeded the average. The Australian property market typically utilizes shorter duration financing, which we are rolling over in the normal course and seeking to extend on a longer basis where possible.
Within our power generating operations, our proportionate share of maturities for the following three years is modest in the context of our overall portfolio and the facilities are expected to be refinanced at the same or at higher levels given the strong operating margins and cash flows of these properties. The remaining 2009 maturities include $212 million of acquisition financing put in place to fund the recent purchase of a Brazilian power generating facility at a 42% loan-to-value ratio, which we expect to refinance at similar levels during the balance of 2009.
Development and other properties include property-specific borrowings within our opportunity funds, of which only $217 million are scheduled for repayment before 2012. Our share of residential property borrowings is $477 million within our Canadian-based residential operations and $205 million within our U.S. residential business. These borrowings have been reduced substantially over the past 18 months. The residential and property development borrowings, including those in Australia, are largely of a working capital nature, financing the ongoing development and construction activities for specific projects, and are typically repaid as the projects, lots or homes being financed are completed and sold. In the case of revolving facilities, amounts may be redrawn against new projects.
Capital SecuritiesThe securities are classified as liabilities for GAAP purposes, even though the securities are preferred shares that are convertible into common equity at our option, because the holders of the preferred shares have the right, after a fixed date, to convert the shares into common equity based on the market price of our common shares at that time unless previously redeemed by us.
(MIllIONS)
Average Term
to Conversion
Sept. 30
2009
Dec. 31
2008
Issued by the Corporation 5 $ 622 $ 543Issued by Brookfield Properties 5 994 882
5 $ 1,616 $ 1,425
The carrying values of existing capital securities increased slightly due to the higher Canadian dollar, in which most of these securities are denominated.
Brookfield Asset Management | Q3 /2009 Supplemental Information42
The average distribution yield on the capital securities at September 30, 2009 was 6% (December 31, 2008 – 6%) and the average term to the holders’ conversion date was five years (December 31, 2008 – six years).
Interests of Co-investorsInterests of co-investors in net assets are comprised of two components: participating interests held by other holders in our funds and subsidiary companies, and non-participating preferred equity issued by subsidiaries.
Number of Shares / Brookfield Invested Capital% Interest Total Net
(MIllIONS)
Sept. 30
2009
Sept. 30
2009
Dec. 31
2008
Sept. 30
2009
Dec. 31
2008
Participating interestsCommercial properties
Brookfield Properties Corporation 251.3 / 50% $ 2,268 $ 1,760 $ 2,268 $ 1,760
Property funds and other various 927 437 — —
Power generation various 490 192 — —
Infrastructure
Timberlands various 1,033 995 — —
Transmission various 237 246 — —
Development and other properties
Brookfield Homes Corporation 11.2 / 42% 156 176 — —
Brookfield Incorporações S.A. 173.7 / 49% 588 446 — —
Brookfield Real Estate Opportunity Funds various 153 127 — —
Specialty funds various 1,353 1,186 — —
Investments various 255 310 — —
7,460 5,875 2,268 1,760Non-participating interests
Brookfield Multiplex Group 384 324 384 324
Brookfield Properties Corporation 392 122 392 122776 446 776 446
$ 8,236 $ 6,321 $ 3,044 $ 2,206
We include Brookfield Properties on a fully consolidated basis in our segmented basis of presentation and accordingly the interests of others in these operations are reflected in both the total and net results. The other entities shown above are presented on a deconsolidated basis in our segmented analysis, and, as a result, the interests of other shareholders are presented in total invested capital only. Non-participating interests in Brookfield Properties Corporation increased during the quarter due to the issuance of perpetual preferred shares. The increase in “property funds and other” is due to the reclassification for accounting purposes of interests held by investors in one of our funds following a restructuring of the ownership interests.
Shareholders’ EquityUnderlying Value Book Value
(MIllIONS, EXCEPT PER SHARE AMOUNTS)
Dec. 31
2008
Sept. 30
2009
Dec. 31
2008
Preferred equity $ 870 $ 1,144 $ 870Common equity 11,931 6,251 4,911
$ 12,801 $ 7,395 $ 5,781Per common share
– after tax $ 20.62 $ 11.32 $ 8.92– pre tax $ 24.32
Preferred equity consists of perpetual preferred shares that represent an attractive form of leverage for common shareholders. The average dividend rate at September 30, 2009 was 4%. Further details on the components of our equity and related distributions can be found on page 45 of this Supplemental.
Our book value of $7.4 billion reflects the depreciated historical cost of many assets, such as office properties and hydroelectric facilities, which were acquired many years ago for values significantly below what they are worth today.
Brookfield Asset Management | Q3 /2009 Supplemental Information 43
nOn-cash wOrking caPital
Other AssetsThe following is a summary of other assets:
Consolidated Net Invested Capital
(MIllIONS)
Sept. 30
2009
Dec. 31
2008
Sept. 30
2009
Dec. 31
2008
Accounts receivable $ 3,692 $ 3,056 $ 719 $ 678Restricted cash 628 610 179 294
Goodwill 2,308 2,011 436 385
Intangible assets 1,593 1,632 87 83
Prepaid and other assets 2,550 2,529 818 703
Deferred tax asset 1,131 711 815 408
$ 11,902 $ 10,549 $ 3,054 $ 2,551
Other assets on a net invested basis include working capital balances employed in our business that are not directly attributable to specific operating units. The magnitude of these balances varies somewhat based on seasonal variances and foreign currency translation. The net balances include $1,303 million (December 31, 2008 – $1,144 million) associated with Brookfield Properties, $792 million associated with our Australian property operations (December 31, 2008 – $535 million) and $959 million (December 31, 2008 – $872 million) associated with the Corporation.
Consolidated balances include amounts receivable by the company in respect of contracted revenues owing but not yet collected, and dividends, interest and fees owing to the company. Prepaid expenses and other assets include amounts accrued to reflect the straight-lining of long-term contracted revenues and capitalized lease values in accordance with accounting guidelines. Restricted cash represents cash balances placed on deposit in connection with financing arrangements and insurance contracts, including the defeasement of long-term property-specific mortgages. The distribution of these assets among our business units is presented in the tables on page 45 of this Supplemental.
Other LiabilitiesInvested Capital
Total Net
(MIllIONS)
Sept. 30
2009
Dec. 31
2008
Sept. 30
2009
Dec. 31
2008
Accounts payable $ 4,257 $ 3,487 $ 1,167 $ 1,101Insurance liabilities 841 1,132 — —
Deferred tax liability 1,770 1,462 594 365
Other liabilities 3,979 3,714 1,087 1,188
$ 10,847 $ 9,795 $ 2,848 $ 2,654
Accounts payable and other liabilities include $1,170 million associated with Brookfield Properties (December 31, 2008 – $1,073 million), $373 million associated with our Australian property operations (December 31, 2008 – $304 million) and $1,305 million (December 31, 2008 – $1,277 million) associated with the Corporation. Deferred taxes represent future tax obligations that arise largely due to holding assets whose book value exceeds their value for tax purposes.
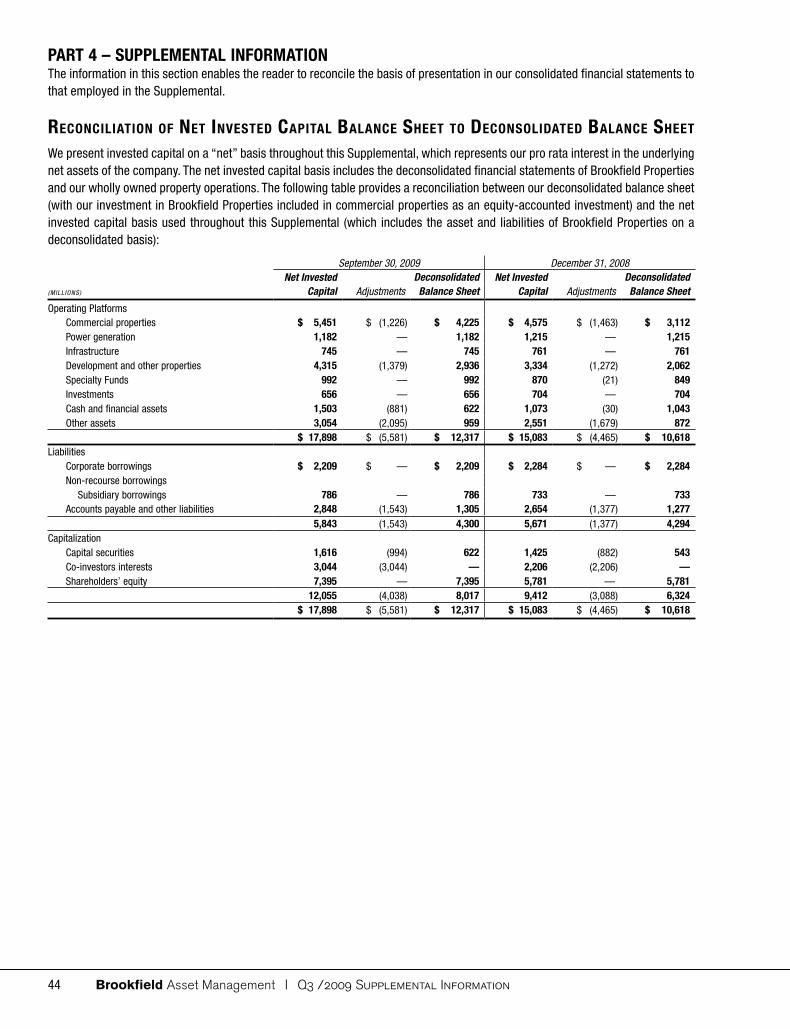
Brookfield Asset Management | Q3 /2009 Supplemental Information44
PART 4 – SUPPLEMENTAL INFORMATIONThe information in this section enables the reader to reconcile the basis of presentation in our consolidated financial statements to that employed in the Supplemental.
recOnciliatiOn Of net invested caPital Balance sheet tO decOnsOlidated Balance sheet
We present invested capital on a “net” basis throughout this Supplemental, which represents our pro rata interest in the underlying net assets of the company. The net invested capital basis includes the deconsolidated financial statements of Brookfield Properties and our wholly owned property operations. The following table provides a reconciliation between our deconsolidated balance sheet (with our investment in Brookfield Properties included in commercial properties as an equity-accounted investment) and the net invested capital basis used throughout this Supplemental (which includes the asset and liabilities of Brookfield Properties on a deconsolidated basis):
September 30, 2009 December 31, 2008Net Invested Deconsolidated Net Invested Deconsolidated
(MIll IONS) Capital Adjustments Balance Sheet Capital Adjustments Balance Sheet
Operating Platforms Commercial properties $ 5,451 $ (1,226) $ 4,225 $ 4,575 $ (1,463) $ 3,112Power generation 1,182 — 1,182 1,215 — 1,215Infrastructure 745 — 745 761 — 761Development and other properties 4,315 (1,379) 2,936 3,334 (1,272) 2,062Specialty Funds 992 — 992 870 (21) 849Investments 656 — 656 704 — 704Cash and financial assets 1,503 (881) 622 1,073 (30) 1,043Other assets 3,054 (2,095) 959 2,551 (1,679) 872
$ 17,898 $ (5,581) $ 12,317 $ 15,083 $ (4,465) $ 10,618Liabilities
Corporate borrowings $ 2,209 $ — $ 2,209 $ 2,284 $ — $ 2,284Non-recourse borrowings
Subsidiary borrowings 786 — 786 733 — 733Accounts payable and other liabilities 2,848 (1,543) 1,305 2,654 (1,377) 1,277
5,843 (1,543) 4,300 5,671 (1,377) 4,294Capitalization
Capital securities 1,616 (994) 622 1,425 (882) 543Co-investors interests 3,044 (3,044) — 2,206 (2,206) —Shareholders’ equity 7,395 — 7,395 5,781 — 5,781
12,055 (4,038) 8,017 9,412 (3,088) 6,324$ 17,898 $ (5,581) $ 12,317 $ 15,083 $ (4,465) $ 10,618

Brookfield Asset Management | Q3 /2009 Supplemental Information 45
recOnciliatiOn Of segmented disclOsure tO cOnsOlidated financial statements
Balance Sheet AS AT SEPTEMBER 30, 2009Operating Platforms Corporate
Commercial Development Specialty Cash and Other
(MIll IONS) Properties Power Infrastructure and Other Funds Investments Financial Assets Assets Corporate Consolidated
AssetsOperating assets
Property, plant and equipment
Commercial properties $ 21,128 $ — $ — $ — $ — $ — $ — $ — $ — $ 21,128
Power generation — 5,889 — — — — — — — 5,889
Infrastructure — — 2,964 — — — — — — 2,964
Development and other properties 5 — 118 8,040 — 76 — — — 8,239
Other plant and equipment 11 — — 38 910 1,172 — — — 2,131
Securities 156 — — — 162 589 — — — 907
Loans and notes receivable — — — — 1,903 42 122 — — 2,067
Cash and cash equivalents 188 314 45 286 208 513 609 — — 2,163
Financial assets 1 (39) 6 (131) 104 — 1,271 — — 1,212
Investments 314 — 363 48 8 3 34 — — 770
Accounts receivable and other 97 1,327 161 2,620 738 527 — 2,531 — 8,001
Intangible assets 779 — 6 593 118 10 — 87 — 1,593
Goodwill 159 33 591 1,048 29 12 — 436 — 2,308
Total assets $ 22,838 $ 7,524 $ 4,254 $ 12,542 $ 4,180 $ 2,944 $ 2,036 $ 3,054 $ — $ 59,372
Liabilities and shareholders’ equityCorporate borrowings $ — $ — $ — $ — $ — $ — $ — $ — $ 2,209 $ 2,209
Property-specific mortgages 14,603 3,802 1,660 2,759 1,022 — — — — 23,846
Other debt of subsidiaries 780 960 7 1,426 343 723 198 — 786 5,223
Accounts payable and other liabilities 1,077 1,090 585 3,131 471 1,310 335 — 2,848 10,847
Capital securities — — — — — — — — 1,616 1,616
Minority interest of others in assets 927 490 1,257 911 1,352 255 — — 3,044 8,236
Preferred equity — — — — — — — — 1,144 1,144
Common equity / net invested capital 5,451 1,182 745 4,315 992 656 1,503 3,054 (11,647) 6,251
Total liabilities and shareholders’ equity $ 22,838 $ 7,524 $ 4,254 $ 12,542 $ 4,180 $ 2,944 $ 2,036 $ 3,054 $ — $ 59,372
AS AT DECEMBER 31, 2008Operating Platforms Corporate
Commercial Development Specialty Cash and Other
(MIll IONS) Properties Power Infrastructure and Other Funds Investments Financial Assets Assets Corporate Consolidated
AssetsOperating assets
Property, plant and equipmentCommercial properties $ 19,274 $ — $ — $ — $ — $ — $ — $ — $ — $ 19,274Power generation — 4,954 — — — — — — — 4,954Infrastructure — — 2,879 — — — — — — 2,879Development and other properties 38 — 105 7,476 — 47 — — — 7,666Other plant and equipment 10 — — 49 709 1,224 — — — 1,992
Securities 143 — — — 206 954 — — — 1,303Loans and notes receivable — — — — 1,921 24 116 — — 2,061
Cash and cash equivalents 166 138 61 160 124 270 323 — — 1,242Financial assets 24 219 — (305) 91 (35) 793 — — 787Investments 252 — 544 37 27 2 28 — — 890Accounts receivable and other 96 1,135 228 1,833 726 805 — 2,083 — 6,906
Intangible assets 859 — 5 560 112 13 — 83 — 1,632Goodwill 121 27 591 834 23 30 — 385 — 2,011
Total assets $ 20,983 $ 6,473 $ 4,413 $ 10,644 $ 3,939 $ 3,334 $ 1,260 $ 2,551 $ — $ 53,597
Liabilities and shareholders’ equityCorporate borrowings $ — $ — $ — $ — $ — $ — $ — $ — $ 2,284 $ 2,284Property-specific mortgages 13,536 3,587 1,642 3,011 1,113 — — — — 22,889Other debt of subsidiaries 1,118 653 145 1,131 387 746 189 — 733 5,102Accounts payable and other liabilities 1,318 826 624 2,419 380 1,574 — — 2,654 9,795Capital securities — — — — — — — — 1,425 1,425Non-controlling interests in net assets 436 192 1,241 749 1,189 310 (2) — 2,206 6,321Preferred equity — — — — — — — — 870 870Common equity / net invested capital 4,575 1,215 761 3,334 870 704 1,073 2,551 (10,172) 4,911
Total liabilities and shareholders’ equity $ 20,983 $ 6,473 $ 4,413 $ 10,644 $ 3,939 $ 3,334 $ 1,260 $ 2,551 $ — $ 53,597

Brookfield Asset Management | Q3 /2009 Supplemental Information46
Results from Operations
FOR THE NINE MONTHS ENDED SEPTEMBER 30, 2009
Operating Platforms Corporate
Investment
Asset Commercial Development Specialty Income /
(MIll IONS) Management Properties Power Infrastructure and Other Funds Investments Gains Corporate Consolidated
Fees earned $ 385 $ — $ — $ — $ — $ — $ — $ — $ — $ 385
Revenues less direct operating costs
Commercial properties — 1,261 — — — — (1) — — 1,260
Power generation — — 956 — — — — — — 956
Infrastructure — — — 84 — — — — — 84
Development and other properties — — — 2 201 — — — — 203
Specialty funds — — — — — 95 — — — 95
Investment and other income — 46 — 64 5 72 74 274 — 535
385 1,307 956 150 206 167 73 274 — 3,518
Expenses
Interest — 630 252 73 36 37 47 17 236 1,328
Asset management and other operating costs — 7 — 3 — — 9 — 499 518
Current income taxes — 5 13 13 1 6 2 1 (1) 40
Non-controlling interests — 101 82 18 48 87 (22) — 249 563
Cash flow from operations $ 385 $ 564 $ 609 $ 43 $ 121 $ 37 $ 37 $ 256 $ (983) $ 1,069
Results from Operations FOR THE NINE MONTHS ENDED SEPTEMBER 30, 2008Operating Platforms Corporate
Investment
Asset Commercial Development Specialty Income /
(MIll IONS) Management Properties Power Infrastructure and Other Funds Investments Gains Corporate Consolidated
Fees earned $ 336 $ — $ — $ — $ — $ — $ — $ — $ — $ 336
Revenues less direct operating costs
Commercial properties — 1,443 — — — — — — — 1,443
Power generation — — 728 — — — — — — 728
Infrastructure — — — 128 — — — — — 128
Development and other properties — (2) — 5 240 — 2 — — 245
Specialty funds — — — — — 255 — — — 255
Investment and other income — 58 — 107 (7) 2 203 350 — 713
336 1,499 728 240 233 257 205 350 — 3,848
Expenses
Interest — 825 237 72 38 69 27 25 244 1,537
Asset management and other operating costs — — — 5 — — 12 — 463 480
Current income taxes — 12 21 10 (20) 5 6 — 6 40
Non-controlling interests — 52 73 58 22 77 12 (10) 331 615
Cash flow from operations $ 336 $ 610 $ 397 $ 95 $ 193 $ 106 $ 148 $ 335 $ (1,044) $ 1,176
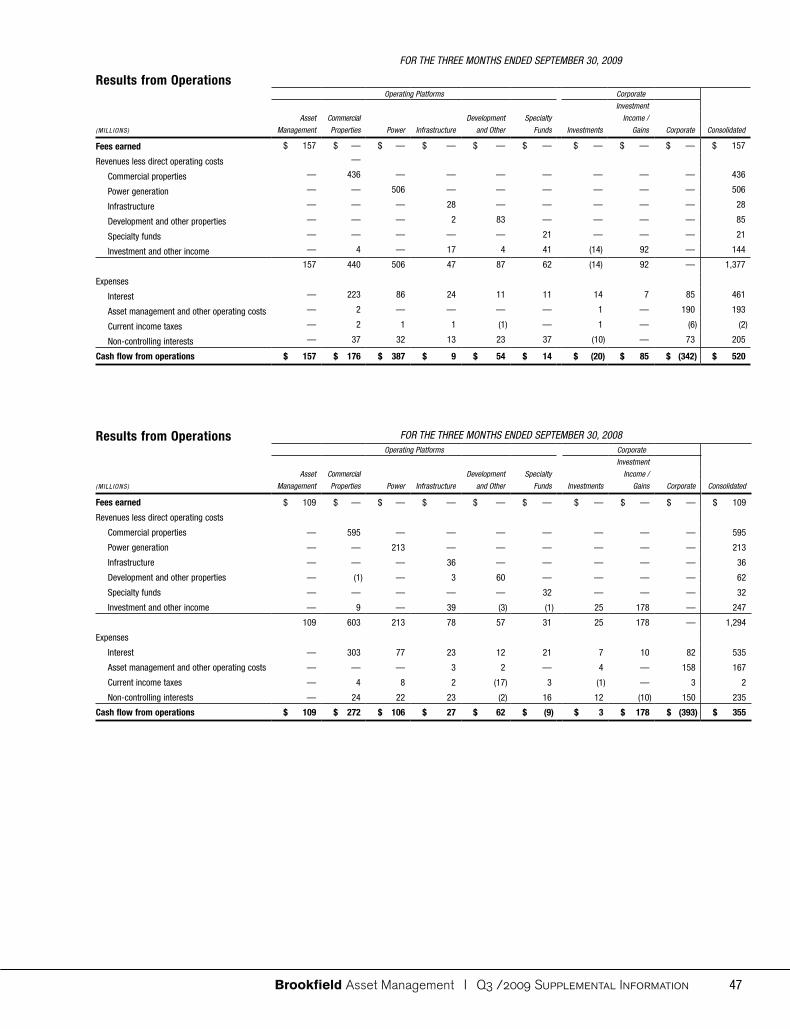
Brookfield Asset Management | Q3 /2009 Supplemental Information 47
Results from Operations
FOR THE THREE MONTHS ENDED SEPTEMBER 30, 2009
Operating Platforms Corporate
Investment
Asset Commercial Development Specialty Income /
(MIll IONS) Management Properties Power Infrastructure and Other Funds Investments Gains Corporate Consolidated
Fees earned $ 157 $ — $ — $ — $ — $ — $ — $ — $ — $ 157
Revenues less direct operating costs —
Commercial properties — 436 — — — — — — — 436
Power generation — — 506 — — — — — — 506
Infrastructure — — — 28 — — — — — 28
Development and other properties — — — 2 83 — — — — 85
Specialty funds — — — — — 21 — — — 21
Investment and other income — 4 — 17 4 41 (14) 92 — 144
157 440 506 47 87 62 (14) 92 — 1,377
Expenses
Interest — 223 86 24 11 11 14 7 85 461
Asset management and other operating costs — 2 — — — — 1 — 190 193
Current income taxes — 2 1 1 (1) — 1 — (6) (2)
Non-controlling interests — 37 32 13 23 37 (10) — 73 205
Cash flow from operations $ 157 $ 176 $ 387 $ 9 $ 54 $ 14 $ (20) $ 85 $ (342) $ 520
Results from Operations FOR THE THREE MONTHS ENDED SEPTEMBER 30, 2008Operating Platforms Corporate
Investment
Asset Commercial Development Specialty Income /
(MIll IONS) Management Properties Power Infrastructure and Other Funds Investments Gains Corporate Consolidated
Fees earned $ 109 $ — $ — $ — $ — $ — $ — $ — $ — $ 109
Revenues less direct operating costs
Commercial properties — 595 — — — — — — — 595
Power generation — — 213 — — — — — — 213
Infrastructure — — — 36 — — — — — 36
Development and other properties — (1) — 3 60 — — — — 62
Specialty funds — — — — — 32 — — — 32
Investment and other income — 9 — 39 (3) (1) 25 178 — 247
109 603 213 78 57 31 25 178 — 1,294
Expenses
Interest — 303 77 23 12 21 7 10 82 535
Asset management and other operating costs — — — 3 2 — 4 — 158 167
Current income taxes — 4 8 2 (17) 3 (1) — 3 2
Non-controlling interests — 24 22 23 (2) 16 12 (10) 150 235
Cash flow from operations $ 109 $ 272 $ 106 $ 27 $ 62 $ (9) $ 3 $ 178 $ (393) $ 355

Brookfield Asset Management | Q3 /2009 Supplemental Information48
quarterly resultsNet income and operating cash flows for the eight recently completed quarters are as follows:
2009 2008 2007
(MIllIONS) Q3 Q2 Q1 Q4 Q3 Q2 Q1 Q4
Total revenues $ 2,996 $ 2,978 $ 2,651 $ 3,006 $ 3,216 $ 3,436 $ 3,210 $ 3,158
Fees earned 157 123 105 113 109 113 114 92
Revenues less direct operating costsCommercial property 436 424 400 388 595 427 421 414
Power generation 506 211 239 158 213 264 251 148
Infrastructure 28 16 40 68 36 44 48 33
Development and other properties 85 95 23 (5) 62 119 64 115
Specialty funds 21 35 39 49 32 119 104 233
Investment and other income 144 222 169 212 247 148 318 343
1,377 1,126 1,015 983 1,294 1,234 1,320 1,378
ExpensesInterest 461 452 415 447 535 475 527 510
Asset management and other operating costs 193 166 159 160 167 148 165 141
Current income taxes (2) 31 11 (47) 2 21 17 28
Non-controlling interest in net income before the following 205 201 157 176 235 212 168 124
Net income before the following 520 276 273 247 355 378 443 575
Equity accounted loss from investments — — — (17) (11) (21) (19) (10)
Depreciation and amortization (321) (300) (329) (355) (333) (328) (314) (294)
Revaluation and other items (192) (73) (3) (262) 104 (46) (63) (95)
Future income taxes (48) 97 2 545 (105) 3 18 35
Non-controlling interests in the foregoing items 153 147 150 13 161 124 132 135
Net income $ 112 $ 147 $ 93 $ 171 $ 171 $ 110 $ 197 $ 346
Cash flow from operations for the last eight quarters are as follows:
2009 2008 2007
(MIllIONS, EXCEPT PER SHARE AMOUNTS) Q3 Q2 Q1 Q4 Q3 Q2 Q1 Q4
Cash flow from operations and gains $ 520 $ 276 $ 273 $ 247 $ 355 $ 378 $ 443 $ 575
Preferred share dividends 12 9 8 9 11 12 12 12
Cash flow to common shareholders $ 508 $ 267 $ 265 $ 238 $ 344 $ 366 $ 431 $ 563
Common equity – book value $ 6,251 $ 5,756 $ 4,976 $ 4,911 $ 5,814 $ 6,277 $ 6,133 $ 6,637
Common shares outstanding 572.1 572.0 571.8 572.6 583.4 583.8 581.7 583.6
Per common shareCash flow from operations $ 0.88 $ 0.46 $ 0.46 $ 0.41 $ 0.58 $ 0.62 $ 0.72 $ 0.94
Net income 0.17 0.24 0.15 0.27 0.27 0.17 0.31 0.56
Dividends 0.13 0.13 0.13 0.13 0.13 0.13 0.12 0.12
Book value 11.32 10.44 9.09 8.92 10.20 11.14 10.93 11.63
Market trading price (NYSE) 22.71 17.07 13.78 15.27 27.44 32.54 26.83 35.67
Commercial office property operations tend to produce consistent results throughout the year due to the long-term nature of the contractual lease arrangements subject to the intermittent recognition of disposition gains. We recorded a gain of $164 million on the sale of a property interest in the third quarter of 2008 and completed the acquisition of a portfolio of Australian properties in the fourth quarter of 2007.
Quarterly seasonality does exist in our power generation and residential property operations. With respect to our power generation operations, seasonality exists in water inflows and pricing. During the fall rainy season and spring thaw, water inflows tend to be the highest leading to higher generation during those periods; however prices tend not to be as strong as the summer and winter seasons due to the more moderate weather conditions during those periods and associated reductions in demand for electricity. We realized a $346 million gain on the sale of certain hydro assets in Ontario in the third quarter of 2009.

Brookfield Asset Management | Q3 /2009 Supplemental Information 49
With respect to our residential operations, included in development and other properties the fourth quarter tends to be the strongest as this is the period during which most of the construction is completed and homes are delivered although in recent periods the company has recorded provisions in respect of higher priced land positions.
We periodically record realization and other gains, special distributions, as well as gains and losses on unhedged financial positions throughout our operations and, while the timing of these items is difficult to predict, the dynamic nature of our asset base tends to result in these items occurring on a relatively frequent basis.
additiOnal share data
Basic and Diluted Earnings Per ShareThe components of basic and diluted earnings per share are summarized in the following table:
Three Months Ended Sept. 30 Nine Months Ended Sept. 30
(MIllIONS) 2009 2008 2009 2008
Net income $ 112 $ 171 $ 352 $ 478Preferred share dividends (12) (11) (29) (35)
Net income available for common shareholders $ 100 $ 160 $ 323 $ 443
Weighted average – common shares 572 584 572 583
Dilutive effect of the conversion of options using treasury stock method 7 11 7 12
Common shares and common share equivalents 579 595 579 595
Issued and Outstanding Common SharesThe number of issued and outstanding common shares changed as follows:
Three Months Ended Sept. 30 Nine Months Ended Sept. 30
(MIllIONS) 2009 2008 2009 2008
Outstanding at beginning of period 572.0 583.8 572.6 583.6Issued (repurchased)
Dividend reinvestment plan — 0.1 0.1 0.1
Management share option plan 0.1 0.1 0.9 3.0
Issuer bid purchases — (0.6) (1.5) (3.3)
Outstanding at end of period 572.1 583.4 572.1 583.4
Unexercised options 35.7 27.9 35.7 27.9
Total diluted common shares at end of period 607.8 611.3 607.8 611.3
In calculating our book value per common share, the cash value of our unexercised options of $630 million as at September 30, 2009 (December 31, 2008 – $446 million) is added to the book value of our common share equity of $6,251 million as at September 30, 2009 (December 31, 2008 – $4,911 million) prior to dividing by the total diluted common shares presented above.

Brookfield Asset Management | Q3 /2009 Supplemental Information50
CAUTIONARy STATEMENT REGARDING FORWARD-LOOkING STATEMENTSThis Supplemental Information contains forward-looking information within the meaning of Canadian provincial securities laws and other “forward-looking statements” within the meaning of certain securities laws
including Section 27A of the U.S. Securities Act of 1933, as amended, Section 21E of the U.S. Securities Exchange Act of 1934, as amended, “safe harbor” provisions of the United States Private Securities Litigation
Reform Act of 1995 and in any applicable Canadian securities regulations. We may make such statements in this report, in other filings with Canadian regulators or the SEC or in other communications. The words “begin,”
“predominantly,” “hope,” “leading,” “ensure,” “increasing,” “achieve,” “strategy,” “contracted,” “intend,” “extend,” “projected,” “periodically,” “enable,” “enhance,” “maintain,” “objective,” “pursue,” “generate,” “build,”
“capitalize,” “create,” “largely,” “continue,” “believe,” “typically,” “expect,” “potential,” “primarily,” “generally,” “anticipate,” “goal,” “might,” “estimated,” “expand,” “usually,” “often,” “scheduled,” “seeking,” “tend”,
“opportunity,” “targets,” “forecast,” “customarily,” “likely,” “growth,” “regularly,” derivations thereof and other expressions of similar import, or the negative variations thereof, and similar expressions of future or
conditional verbs such as “would,” “may,” “will,” “can,” “should,” or “could” are predictions of or indicate future events, trends or prospects, do not relate to historical matters and identify forward-looking statements.
Forward-looking statements in this Supplemental Information include, among others, statements with respect to: expected price increases for surplus renewable power generation resulting from above average reservoir
levels; expansion of our Brazil retail fund activities; the potential for variations in Internal Rate of Return assumptions; deployment of our uninvested apital in new investment opportunities; future income taxes; allocation
of capital for specialized mandates; stability of our cash flows; our ability to invest and build for the future; our ability to build the strength of our tenant relationships; our ability to lock in lower interest rates; our ability
to optimize selling prices for our power generation during higher-priced peak periods; our intended investment in Brookfield Infrastructure Partners’ equity offering; our ability to maximize the value of our timber business
over the long-term; expected revenues from our transmission operations; expansion of our Brazilian residential properties operations; advancement of our properties under development projects in North America,
Australia, the United Kingdom and Brazil; redevelopment of three properties in Washington D.C.; our residential and rural properties held for development; future returns from our real estate finance activities; future fees
from our global real estate investment consortium; potential future managed capital arising from the recapitalization of Babcock & Brown Infrastructure; our plans to use our liquidity and capital commitments from
partners; future transaction closings; value creation gains on transactions, the length of time that we hold assets; future initiatives; generating long-term cash flows and opportunities for value creation for us and our
partners; creating value for shareholders by increasing cash flows; future lease expiries in our commercial properties portfolio; our contracted renewable power generation; our beliefs about our financing strategy; our
ability to pursue business and investment opportunities given our liquidity levels; the ability of the company’s approach to business to mitigate the impact of the current economic environment on its operating margins
and investment gains; our beliefs about future growth in revenues and income by investing capital into existing operations; the ability of our businesses to withstand the short-term environment and invest and build for
the future; our ability to meet long-term performance objectives for cash flow growth and value creation and to continue to build the company as a world-class asset manager; our ability to store water in reservoirs to
protect against short-term changes in water supply; our ability to achieve our short-time and long-term objectives; procedures and assumptions that we intend to follow in preparing our pro-forma opening balance sheet
for our adoption of IFRS; our commercial office strategy and goals; our ability to lock-in lower interest rates; our ability to maintain or increase our net rental income in the coming years; our ability to attract new tenants
to fill excess in our vacant office property space; our ability to retain the benefit and risk of electricity price increases and decreases through purchases of electricity generated through Brookfield Renewable Power Fund;
our strategy of forward selling generation to reduce the impact of short term fluctuations in market prices; our ability to optimize generation selling prices by generating and selling power during higher-priced peak
periods; investment in and completion of the development of our Texas transmission system joint venture project; future returns from our real estate opportunity funds; future performance of the U.S. residential real
estate markets; timing of our residential real estate construction financing renewals; future generation of revenues through contracted real estates sales in Brazil; future margins in our Australian residential real estate
sales; occupancy and completion of the Bay Adelaide Centre; construction on our development land on Ninth Avenue in New York City; conversion of our higher and better use lands; future returns in our restructuring
funds; our ability to react quickly to potential investment opportunities and adverse changes in economic circumstances; focusing on owning high quality assets; backing revenue streams with long-term contractual
arrangements; match funding long life assets with long-term financings and maintaining a high level of liquidity; the forecast for natural gas and electricity prices during the balance of 2009 and 2010; our ability to
renew expired leases in our commercial office portfolio in 2009 and 2010 in the normal course; a reduction in cash flows resulting from the current economic downturn leading to tenant bankruptcies and lower market
rents; achieving our 2009 office property operating targets; operating returns in 2009 for our transmission businesses; expectations for our timber operations and the future effects of reduced harvest levels; our timber
harvest levels in the U.S. and Canada in 2009 relative to 2008; long-term growth from deployed capital from our new funds; the effect of the current difficulties in credit markets on our restructuring operations and real
estate finance group in the short-term and our ability to monetize investments and recognize disposition gains; our goals for our asset management activities including growth in asset management income; contribution
from base management fees; reducing leverage in certain areas of our business and the effects of doing so; our ability to invest our capital on a favourable basis for the balance of 2009 through 2011; achieving the key
elements of our capital strategy; our ability to manage our financial commitments and to capitalize on opportunities to invest capital at attractive returns; our ability to refinance or roll over our corporate and subsidiary
debt maturities and fund reductions with current liquidity; cash flow and asset monetizations; our ability to maintain debt levels on any particular asset or group of assets throughout a business cycle; our ability to
refinance debt maturities at current borrowing levels on an overall basis and maintain ample liquidity to deliver individual properties if necessary; our ability to reduce our liabilities by a meaningful discount; benefit
underlying values; improve cash flow from operations on a per share basis and give rise to accounting gains through debt repurchases or other initiatives; the form of borrowings within the businesses that we manage;
our ability to permanently finance our Australian business with corporate facilities and asset-specific mortgages on its properties prior to maturity of our Brookfield Australia bank facility in 2010; the level of seasonality
of our various operations; our intention to prepare our financial statements in accordance with IFRS for periods beginning January 1, 2010 and the potential and expected impacts of doing so on our balance sheets;
statements of income and cash flows as well as the outlook for the company’s businesses, and other statements with respect to our beliefs, outlooks, plans, expectations and intentions.
Although Brookfield believes that the anticipated future results, performance or achievements expressed or implied by the forward-looking statements and information are based upon reasonable assumptions and
expectations, the reader should not place undue reliance on forward-looking statements and information because they involve known and unknown risks, uncertainties and other factors which may cause the actual
results, performance or achievements of the company to differ materially from anticipated future results, performance or achievement expressed or implied by such forward-looking statements and information.
Factors that could cause actual results to differ materially from those contemplated or implied by forward-looking statements include: economic and financial conditions in the countries in which we do business; rate
of recovery of the current economic downturn; the behaviour of financial markets, including fluctuations in interest and exchange rates; availability of equity and debt financing; strategic actions including dispositions;
the ability to effectively integrate acquisitions into existing operations and the ability to attain expected benefits; the company’s continued ability to attract institutional partners to its specialty funds; adverse hydrology
conditions; timber growth cycles; environmental matters; regulatory and political factors within the countries in which the company operates; tenant renewal rates; availability of new tenants to fill office property
vacancies; tenant bankruptcies; acts of God, such as earthquakes and hurricanes; the possible impact of international conflicts and other developments including terrorist acts; changes in accounting policies to be
adopted under IFRS; and other risks and factors detailed from time to time in the company’s form 40-F filed with the Securities and Exchange Commission and Management’s Discussion and Analysis of Financial Results
as well as other documents filed by the company with the securities regulators in Canada and the United States.
We caution that the foregoing list of important factors that may affect future results is not exhaustive. When relying on our forward-looking statements to make decisions with respect to Brookfield, investors and others
should carefully consider the foregoing factors and other uncertainties and potential events. Except as may be required by law, the company undertakes no obligation to publicly update or revise any forward-looking
statements or information, whether written or oral, that may be as a result of new information, future events or otherwise.
CAUTIONARy STATEMENT REGARDING USE OF NON-GAAP ACCOUNTING MEASURESThis Supplemental Information makes reference to cash flow from operations on a total and per share basis. Management uses cash flow from operations as a key measure to evaluate performance and to determine
the underlying value of its businesses. Brookfield’s consolidated statements of cash flow from operations provides a full reconciliation between this measure and net income. Readers are encouraged to consider both
measures in assessing Brookfield’s results. Operating cash flow is not a generally accepted accounting principle measure and differs from net income, and may differ from definitions of operating cash flow used by
other companies. We define operating cash flow as net income prior to such items as depreciation and amortization, future income tax expense and certain non-cash items that in our view are not reflective of the
underlying operations.
BUSINESS ENVIRONMENT AND RISkSFactors that impact Brookfield’s financial results include: the performance of each of our operations and various external factors influencing the specific sectors and geographic locations in which we operate; macro-
economic factors such as economic growth, changes in currency, inflation and interest rates; regulatory requirements and initiatives; and litigation and claims that arise in the normal course of business.
These and other factors are described in Management’s Discussion and Analysis of Financial Results in the Corporation’s 2008 Annual Report which is available on our web site and at www.sedar.com.