2015 NAGAP Salary Survey
70
This report on the biennial Salary Survey is being provided to members and interested others by NAGAP, the Leader in Graduate Enrollment Management. The Research Committee based this report on the 2015 survey results. The NAGAP Governing Board and the Research Committee gratefully acknowledge NAGAP members for their continued support in answering surveys such as this one. NAGAP SALARY Survey 2015 Report | Spring 2016
-
Upload
graduate-school -
Category
Documents
-
view
231 -
download
0
description
Revised 6/9/16
Transcript of 2015 NAGAP Salary Survey
This report on the biennial Salary Survey is being provided to members and interested others by NAGAP, the Leader in Graduate Enrollment Management. The Research Committee based this report on the 2015 survey results. The NAGAP Governing Board and the Research Committee gratefully acknowledge NAGAP members for their continued support in answering surveys such as this one.
Report | Spring 2016
2015NAGAP SALARY SURVEY
NAGAP SALARY SURVEYTABLE OF CONTENTSTables........................................................................................................................................ 5
Figures.......................................................................................................................................6
2015 Research Committee.......................................................................................................7COMMITTEE MEMBERS..................................................................................................................................... 7
2013-2015 GOVERNING BOARD........................................................................................................................ 7
Purpose and Goals...................................................................................................................8
Methodology..............................................................................................................................8
Limitations of the Study...........................................................................................................8
Respondent Characteristics....................................................................................................9INSTITUTION CHARACTERISTICS..................................................................................................................... 9
Table 1: Respondents by Institution Type......................................................................................................9
Figure 1: Respondents by Institution Setting.................................................................................................9
Figure 2: Respondents by Size of Program's Graduate Population.............................................................10
RESPONDENT CHARACTERISTICS................................................................................................................10
Figure 3: Respondents by Education Level.................................................................................................10
Table 2: Respondents by Age Range..........................................................................................................11
Figure 4: Respondents by Age Range.........................................................................................................11
Table 3: Respondents by Gender................................................................................................................11
Table 4: Respondents by Race/Ethnicity.....................................................................................................12
Figure 5: Respondents by Years of Experience in Higher Education..........................................................13
Table 5: Respondents by Number of Years in Graduate & Undergraduate Enrollment...............................13
Table 6: Respondents by Position Type......................................................................................................14
Table 7: Respondents by Position Title........................................................................................................14
Salary Data and Analysis.......................................................................................................15OVERVIEW......................................................................................................................................................... 15
RESPONDENT SALARY RANGE...................................................................................................................... 15
Figure 6: Respondents by Salary Range.....................................................................................................15
INTERNATIONAL MEMBERSHIP...................................................................................................................... 16
Table 8: International NAGAP Membership by Gender...............................................................................16
NAGAP Salary Survey Report | November 2015 | 2
Figure 7: International NAGAP Member Estimated Annual Gross Salary....................................................16
SALARY BY INSTITUTION CHARACTERISTICS..............................................................................................17
Table 9: Salary by Institution Type...............................................................................................................17
Figure 8: Salary by Institution Type.............................................................................................................18
Table 10: Salary by Graduate Enrollment....................................................................................................18
Table 11: Salary by Institution Setting..........................................................................................................19
Figure 9: Salary by Institution Setting..........................................................................................................20
SALARY BY RESPONDENT CHARACTERISTICS...........................................................................................21
Table 12: Salary by Position Classification..................................................................................................21
Table 13: Salary by Position Title................................................................................................................22
Table 14: Salary by Education Level...........................................................................................................23
Figure 10: Education Level by Salary Range...............................................................................................24
Table 15: Age by Salary Range................................................................................................................... 25
Table 16: Salary Range by Gender.............................................................................................................26
Table 17: Frequency of Degree Conferrals by Gender................................................................................27
Figure 11: Highest Academic Degree by Gender........................................................................................27
Table 18: Salary by Ethnicity....................................................................................................................... 28
Table 19: Salary by Years of Experience in Higher Education.....................................................................29
Figure 12: Years in Higher Education by Salary Range...............................................................................30
Table 20: Salary by Years of Experience in Graduate Enrollment Management.........................................31
Figure 13: GEM Years of Experience by Salary Range...............................................................................32
SALARY INCREASES........................................................................................................................................ 33
Table 21: Frequency of Cost of Living Salary Increases..............................................................................33
Table 22: Percentage Pay Increase, Based on % of Total Salary...............................................................34
Table 23: Procedures for Determining Salary Increases..............................................................................34
SALARY FREEZES............................................................................................................................................ 35
Table 24: Salary Freezes by Institution Type for Upcoming Year................................................................35
Table 25: Period of Salary Freeze by Institution Type.................................................................................35
Job Responsibilities...............................................................................................................36CHANGING RESPONSIBILITIES.......................................................................................................................36
Figure 14: Responsibilities Since Hiring.......................................................................................................36
DIVISION OF RESPONSIBILITIES.................................................................................................................... 37
Table 26: Responsibilities/Percent Time......................................................................................................37
Table 27: GEM Related Duties by Job Title (as percentage of total responsibilities)...................................38
BUDGET AND SUPERVISORY RESPONSIBILITIES........................................................................................39
Table 28: Budget Authority by Range..........................................................................................................39
NAGAP Salary Survey Report | November 2015 | 3
Figure 15: Budget Authority......................................................................................................................... 39
Figure 16: Supervision of Staff.....................................................................................................................40
Professional Development.....................................................................................................41EVALUATIONS................................................................................................................................................... 41
Figure 17: Job Performance is Evaluated at Regular Intervals...................................................................41
Figure 18: Evaluation Responsibilities.........................................................................................................41
PROFESSIONAL DEVELOPMENT.................................................................................................................... 42
Figure 19: Professional Development, Question 1.......................................................................................42
Figure 20: Professional Development, Question 2.......................................................................................42
Figure 21: Professional Development, Question 3.......................................................................................42
Figure 22: Professional Development, Question 4......................................................................................43
Figure 23: Professional Development, Question 5.......................................................................................43
Figure 24: Promotion Opportunities.............................................................................................................44
Summary................................................................................................................................. 44REVIEW OF THE FINDINGS.............................................................................................................................. 45
NAGAP Salary Survey Report | November 2015 | 4
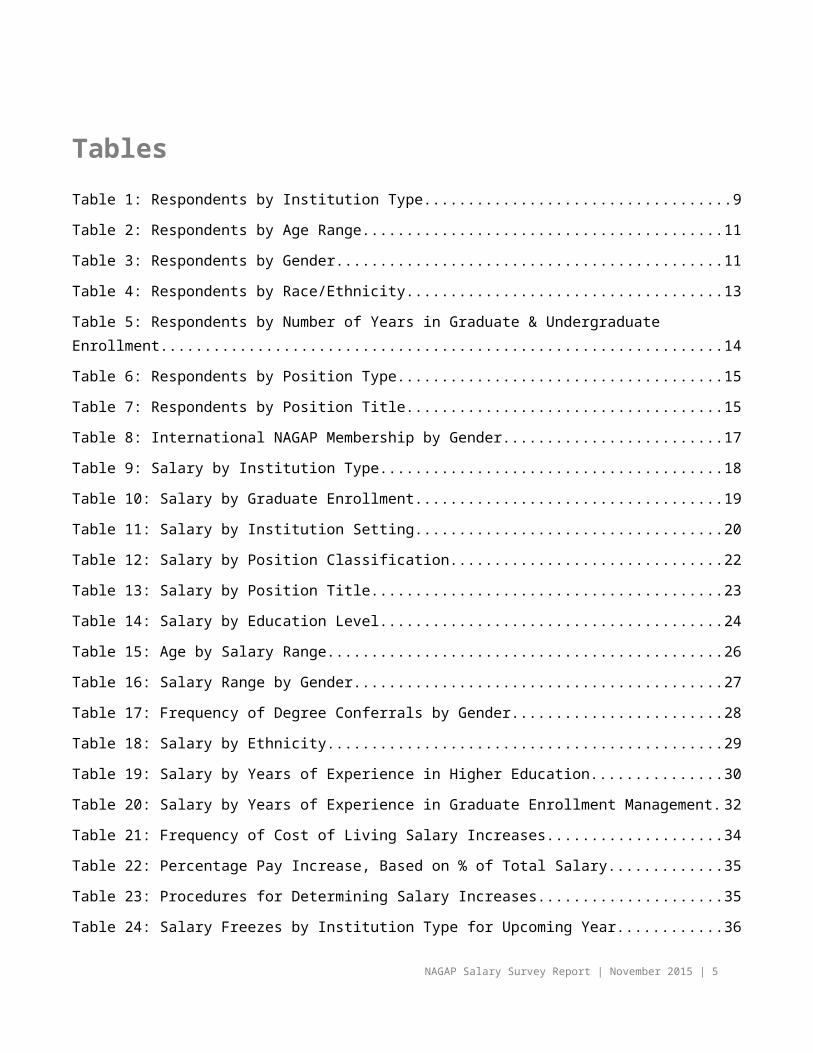
TablesTable 1: Respondents by Institution Type.................................................................................................9
Table 2: Respondents by Age Range.....................................................................................................11
Table 3: Respondents by Gender...........................................................................................................11
Table 4: Respondents by Race/Ethnicity................................................................................................13
Table 5: Respondents by Number of Years in Graduate & Undergraduate Enrollment..........................14
Table 6: Respondents by Position Type..................................................................................................15
Table 7: Respondents by Position Title...................................................................................................15
Table 8: International NAGAP Membership by Gender..........................................................................17
Table 9: Salary by Institution Type..........................................................................................................18
Table 10: Salary by Graduate Enrollment...............................................................................................19
Table 11: Salary by Institution Setting.....................................................................................................20
Table 12: Salary by Position Classification.............................................................................................22
Table 13: Salary by Position Title............................................................................................................23
Table 14: Salary by Education Level.......................................................................................................24
Table 15: Age by Salary Range..............................................................................................................26
Table 16: Salary Range by Gender.........................................................................................................27
Table 17: Frequency of Degree Conferrals by Gender...........................................................................28
Table 18: Salary by Ethnicity...................................................................................................................29
Table 19: Salary by Years of Experience in Higher Education................................................................30
Table 20: Salary by Years of Experience in Graduate Enrollment Management....................................32
Table 21: Frequency of Cost of Living Salary Increases.........................................................................34
Table 22: Percentage Pay Increase, Based on % of Total Salary..........................................................35
Table 23: Procedures for Determining Salary Increases.........................................................................35
Table 24: Salary Freezes by Institution Type for Upcoming Year...........................................................36
Table 25: Period of Salary Freeze by Institution Type............................................................................36
Table 26: Responsibilities/Percent Time.................................................................................................38
Table 27: GEM Related Duties by Job Title (as percentage of total responsibilities).............................39
Table 28: Budget Authority by Range.....................................................................................................40
NAGAP Salary Survey Report | November 2015 | 5
FiguresFigure 1: Respondents by Institution Setting.............................................................................................9
Figure 2: Respondents by Size of Program's Graduate Population........................................................10
Figure 3: Respondents by Education Level.............................................................................................11
Figure 4: Respondents by Age Range....................................................................................................11
Figure 5: Respondents by Years of Experience in Higher Education.....................................................14
Figure 6: Respondents by Salary Range................................................................................................16
Figure 7: International NAGAP Member Estimated Annual Gross Salary...............................................17
Figure 8: Salary by Institution Type.........................................................................................................19
Figure 9: Salary by Institution Setting......................................................................................................21
Figure 10: Education Level by Salary Range..........................................................................................25
Figure 11: Highest Academic Degree by Gender....................................................................................28
Figure 12: Years in Higher Education by Salary Range..........................................................................31
Figure 13: GEM Years of Experience by Salary Range..........................................................................33
Figure 14: Responsibilities Since Hiring..................................................................................................37
Figure 15: Budget Authority.....................................................................................................................40
Figure 16: Supervision of Staff................................................................................................................41
Figure 17: Job Performance is Evaluated at Regular Intervals...............................................................42
Figure 18: Evaluation Responsibilities....................................................................................................42
Figure 19: Professional Development, Question 1..................................................................................43
Figure 20: Professional Development, Question 2..................................................................................43
Figure 21: Professional Development, Question 3..................................................................................44
Figure 22: Professional Development, Question 4..................................................................................44
Figure 23: Professional Development, Question 5..................................................................................44
Figure 24: Promotion Opportunities........................................................................................................45
NAGAP Salary Survey Report | November 2015 | 6
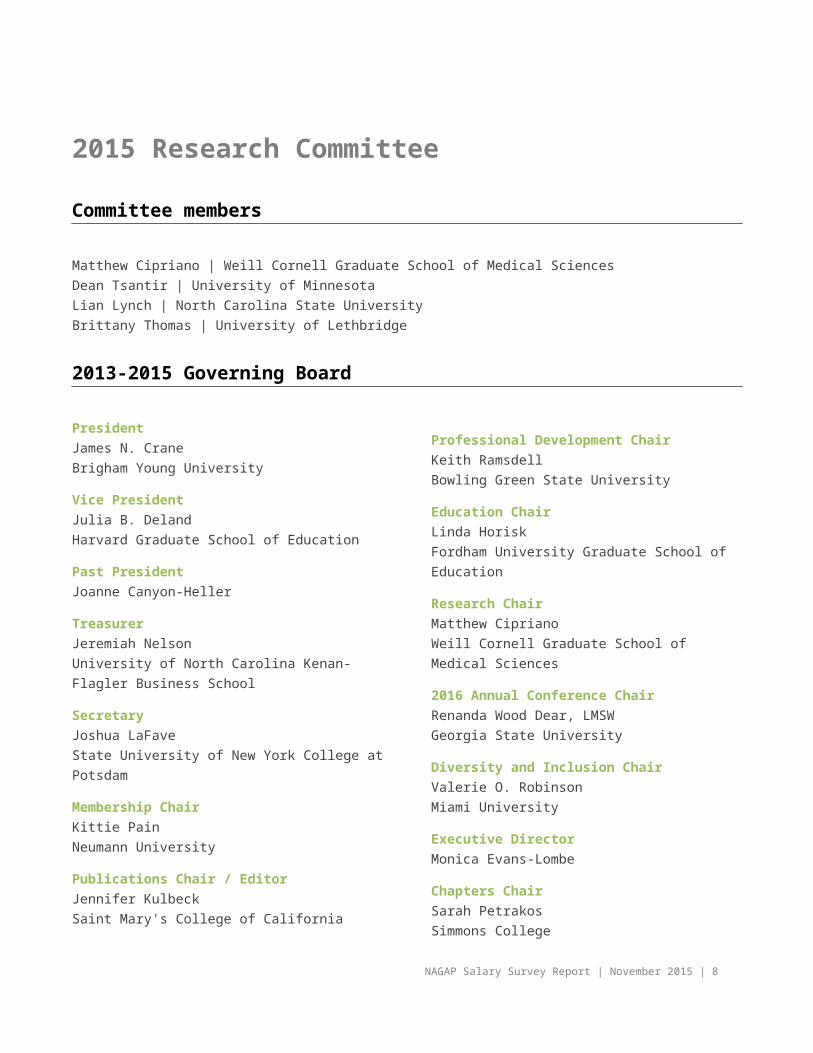
2015 Research Committee
Committee members
Matthew Cipriano | Weill Cornell Graduate School of Medical SciencesDean Tsantir | University of MinnesotaLian Lynch | North Carolina State UniversityBrittany Thomas | University of Lethbridge
2013-2015 Governing Board
PresidentJames N. CraneBrigham Young University
Vice PresidentJulia B. DelandHarvard Graduate School of Education
Past PresidentJoanne Canyon-Heller
TreasurerJeremiah NelsonUniversity of North Carolina Kenan-Flagler Business School
SecretaryJoshua LaFaveState University of New York College at Potsdam
Membership ChairKittie PainNeumann University
Publications Chair / EditorJennifer KulbeckSaint Mary's College of California
Professional Development ChairKeith RamsdellBowling Green State University
Education ChairLinda HoriskFordham University Graduate School of Education
Research ChairMatthew CiprianoWeill Cornell Graduate School of Medical Sciences
2016 Annual Conference ChairRenanda Wood Dear, LMSWGeorgia State University
Diversity and Inclusion ChairValerie O. RobinsonMiami University
Executive DirectorMonica Evans-Lombe
Chapters ChairSarah PetrakosSimmons College
Technology ChairMarcus HanscomRoger Williams University
NAGAP Salary Survey Report | November 2015 | 7
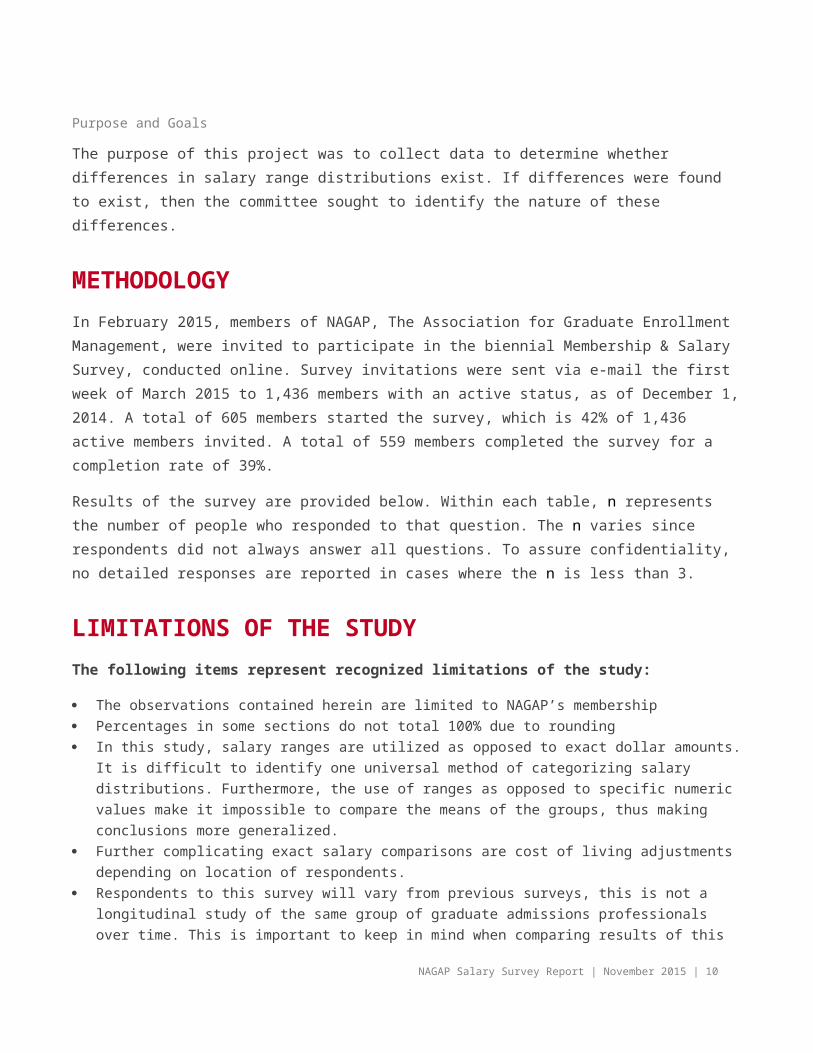
Purpose and Goals
The purpose of this project was to collect data to determine whether differences in salary range distributions exist. If differences were found to exist, then the committee sought to identify the nature of these differences.
METHODOLOGYIn February 2015, members of NAGAP, The Association for Graduate Enrollment Management, were invited to participate in the biennial Membership & Salary Survey, conducted online. Survey invitations were sent via e-mail the first week of March 2015 to 1,436 members with an active status, as of December 1, 2014. A total of 605 members started the survey, which is 42% of 1,436 active members invited. A total of 559 members completed the survey for a completion rate of 39%.
Results of the survey are provided below. Within each table, n represents the number of people who responded to that question. The n varies since respondents did not always answer all questions. To assure confidentiality, no detailed responses are reported in cases where the n is less than 3.
LIMITATIONS OF THE STUDYThe following items represent recognized limitations of the study:
The observations contained herein are limited to NAGAP’s membership Percentages in some sections do not total 100% due to rounding In this study, salary ranges are utilized as opposed to exact dollar amounts. It is difficult to identify one
universal method of categorizing salary distributions. Furthermore, the use of ranges as opposed to specific numeric values make it impossible to compare the means of the groups, thus making conclusions more generalized.
Further complicating exact salary comparisons are cost of living adjustments depending on location of respondents.
Respondents to this survey will vary from previous surveys, this is not a longitudinal study of the same group of graduate admissions professionals over time. This is important to keep in mind when comparing results of this survey to previous surveys and attempting to draw conclusions about trends in the field of Graduate Enrollment Management (GEM).
While institutional size is considered, this survey does not indicate if admissions professionals are located in central offices (e.g. Graduate Schools), colleges, departments, individual graduate programs, or positions that span multiple units.
Data was combined for respondents from the United States and Canada
NAGAP Salary Survey Report | November 2015 | 8

RESPONDENT CHARACTERISTICSInstitution Characteristics
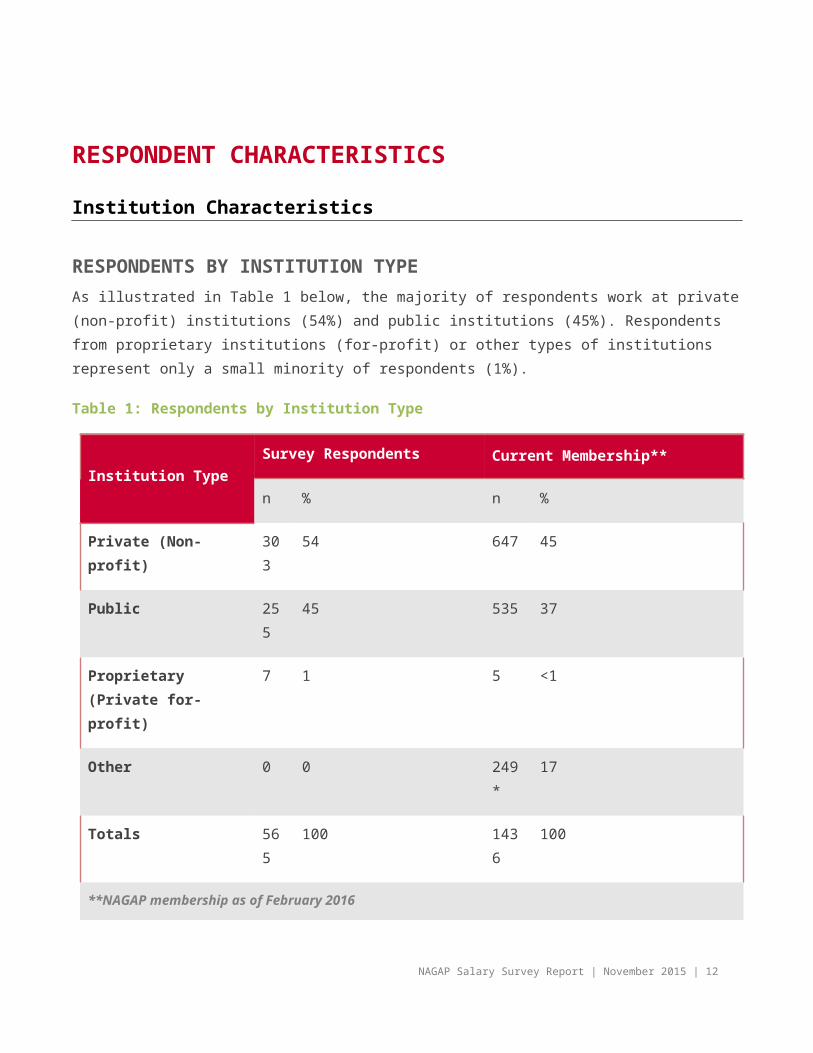
RESPONDENTS BY INSTITUTION TYPEAs illustrated in Table 1 below, the majority of respondents work at private (non-profit) institutions (54%) and public institutions (45%). Respondents from proprietary institutions (for-profit) or other types of institutions represent only a small minority of respondents (1%).
Table 1: Respondents by Institution Type
Institution TypeSurvey Respondents Current Membership**
n % n %
Private (Non-profit) 303 54 647 45
Public 255 45 535 37
Proprietary (Private for-profit)
7 1 5 <1
Other 0 0 249* 17
Totals 565 100 1436 100
**NAGAP membership as of February 2016
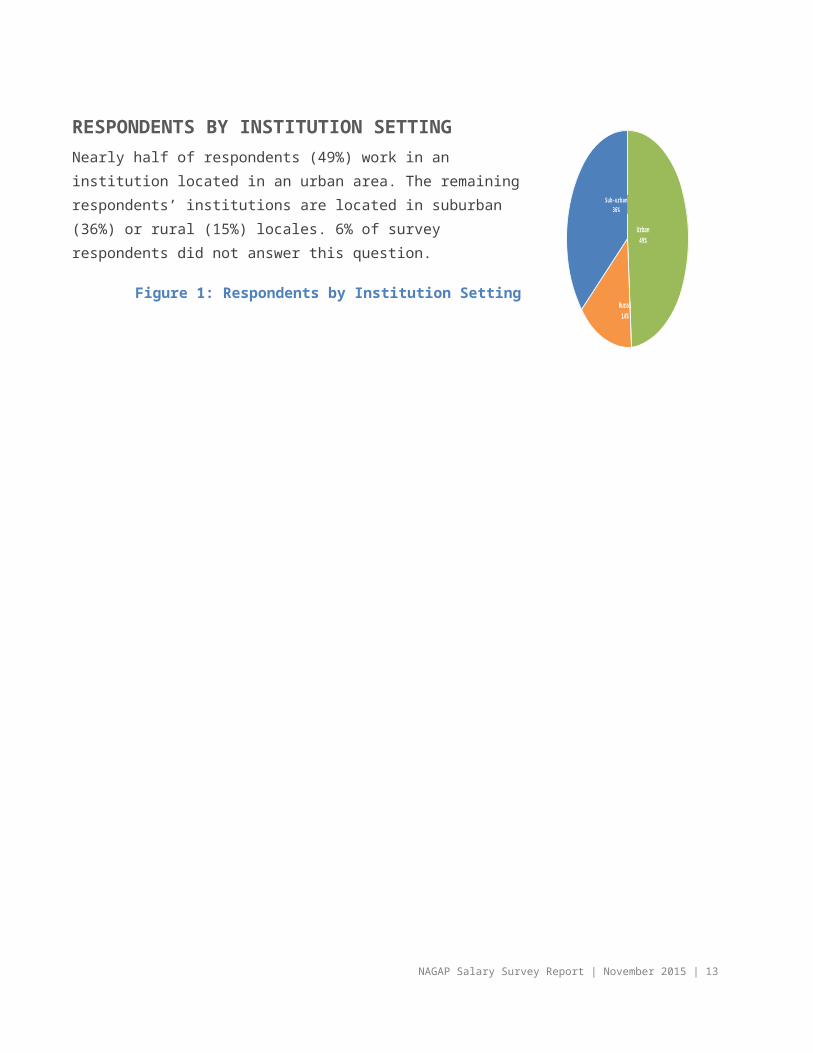
RESPONDENTS BY INSTITUTION SETTINGNearly half of respondents (49%) work in an institution located in an urban area. The remaining respondents’ institutions are located in suburban (36%) or rural (15%) locales. 6% of survey respondents did not answer this question.
Figure 1: Respondents by Institution Setting
NAGAP Salary Survey Report | November 2015 | 9
Urban49%
Rural14%
Sub-urban36%
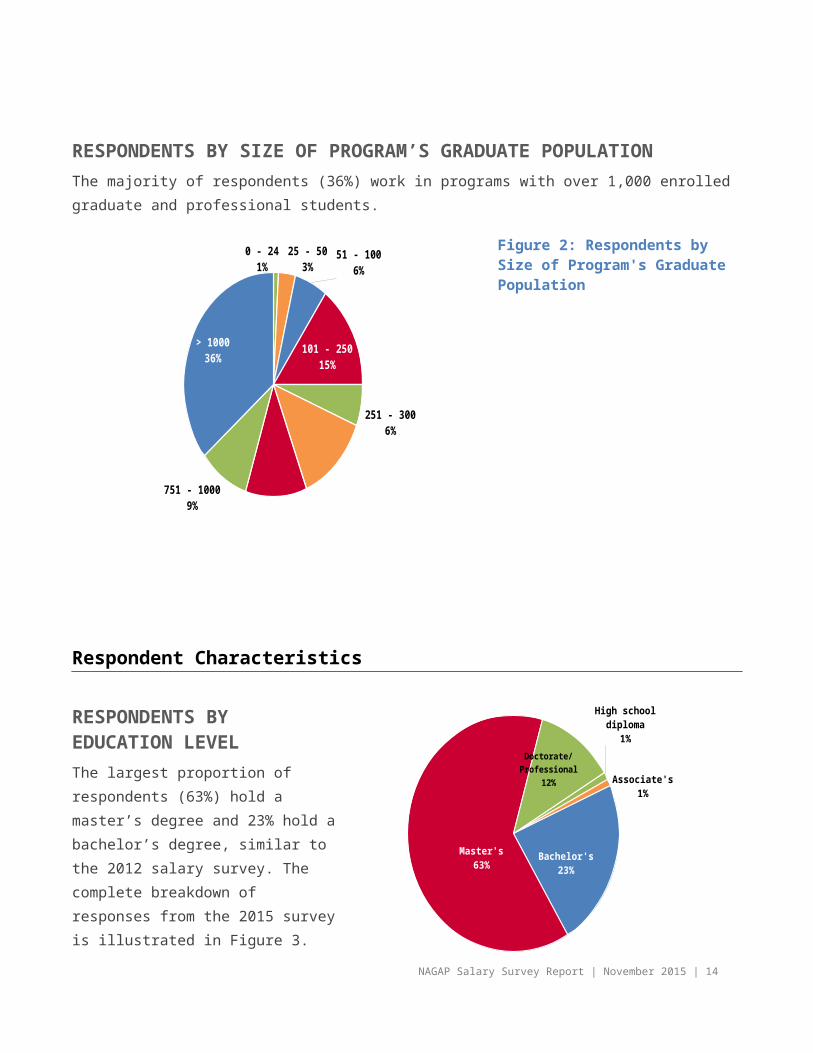
RESPONDENTS BY SIZE OF PROGRAM’S GRADUATE POPULATION The majority of respondents (36%) work in programs with over 1,000 enrolled graduate and professional students.
Figure 2: Respondents by Size of Program's Graduate Population
Respondent Characteristics
RESPONDENTS BY EDUCATION LEVELThe largest proportion of respondents (63%) hold a master’s degree and 23% hold a bachelor’s degree, similar to the 2012 salary survey. The complete breakdown of responses from the 2015 survey is illustrated in Figure 3.
NAGAP Salary Survey Report | November 2015 | 10
0 - 241%
25 - 503% 51 - 100
6%
101 - 25015%
251 - 3006%301 - 500
13%
501 - 75011%751 - 1000
9%
> 100036%
High school diploma
1%
Associate's1%
Bachelor's23%
Master's63%
Doctorate/Pro-fessional
12%

Figure 3: Respondents by Education Level
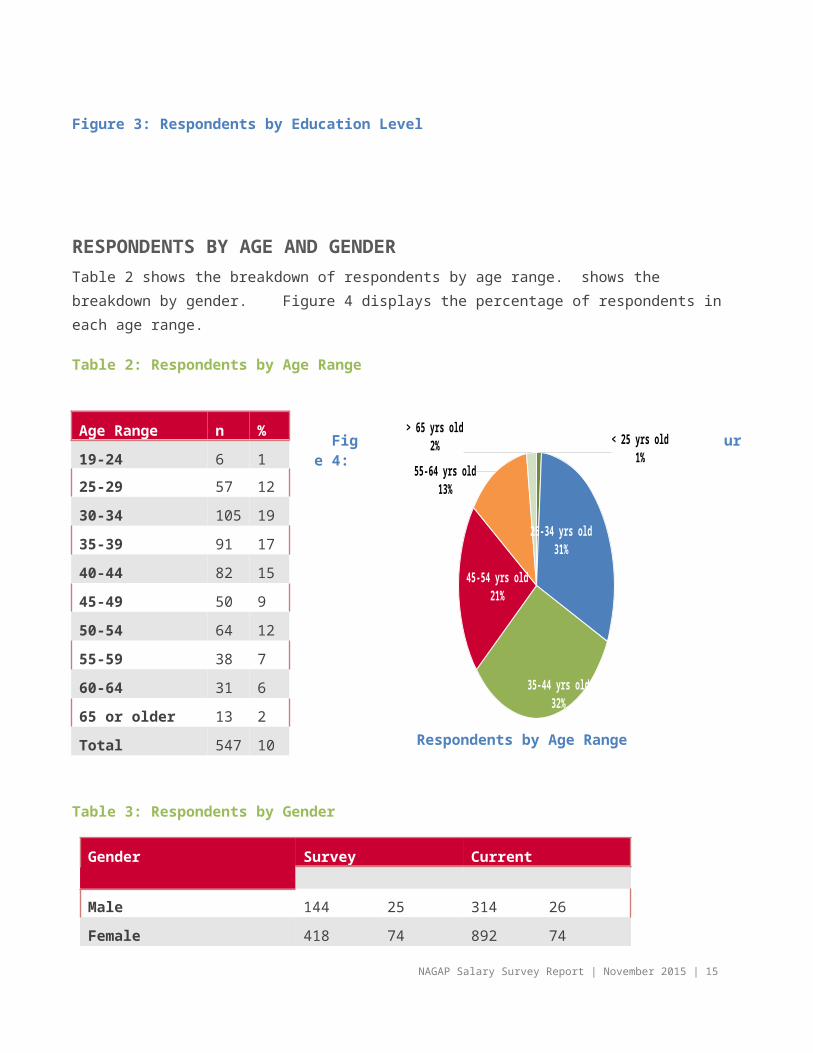
RESPONDENTS BY AGE AND GENDERTable 2 shows the breakdown of respondents by age range. shows the breakdown by gender. Figure4 displays the percentage of respondents in each age range.
Table 2: Respondents by Age Range
Figure 4:
Respondents by Age Range
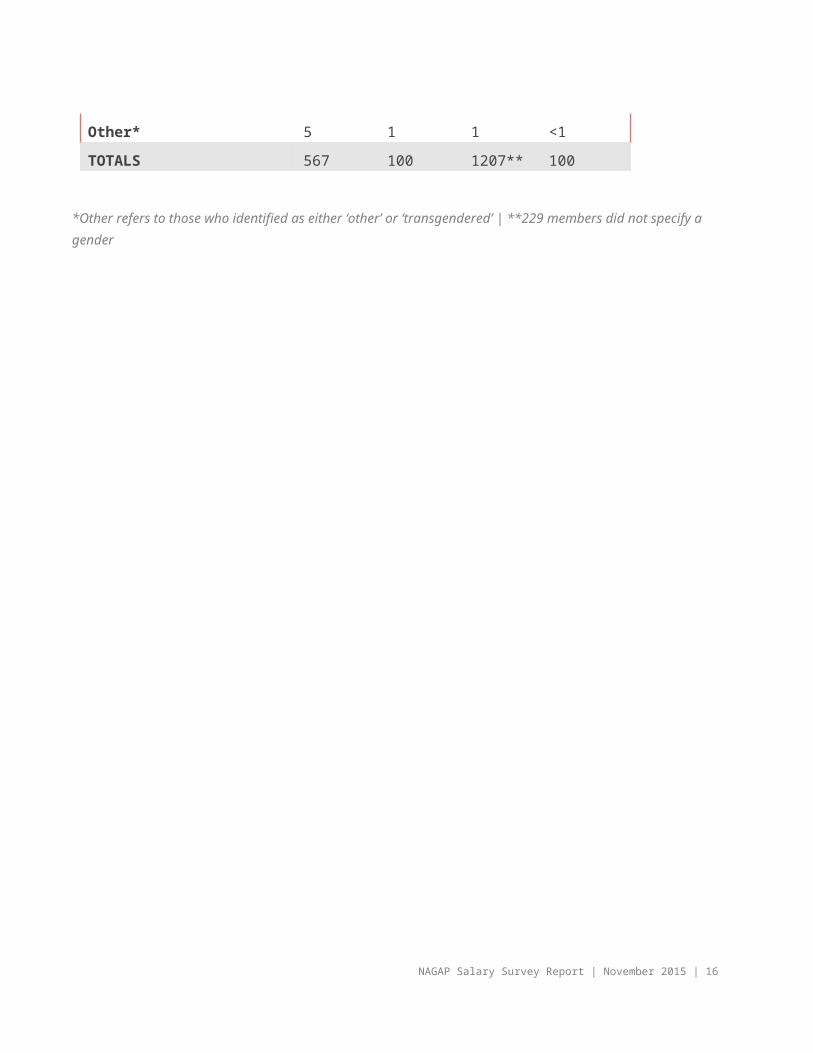
Table 3: Respondents by Gender
Gender Survey Respondents Current Membership*
Male 144 25 314 26
Female 418 74 892 74
Other* 5 1 1 <1
TOTALS 567 100 1207** 100
NAGAP Salary Survey Report | November 2015 | 11
< 25 yrs old1%
25-34 yrs old31%
35-44 yrs old32%
45-54 yrs old21%
55-64 yrs old13%
> 65 yrs old2%
Age Range n %
19-24 6 1
25-29 57 12
30-34 105 19
35-39 91 17
40-44 82 15
45-49 50 9
50-54 64 12
55-59 38 7
60-64 31 6
65 or older 13 2
Total 547 100
*Other refers to those who identified as either ‘other’ or ‘transgendered’ | **229 members did not specify a gender
NAGAP Salary Survey Report | November 2015 | 12
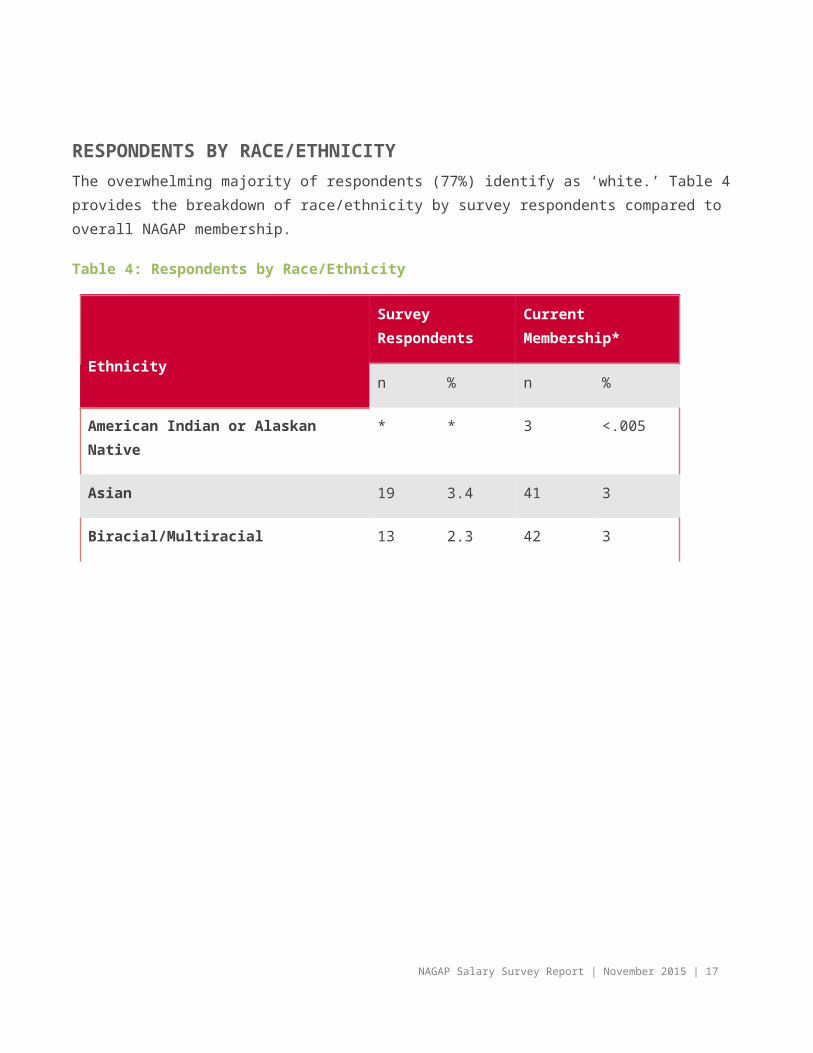
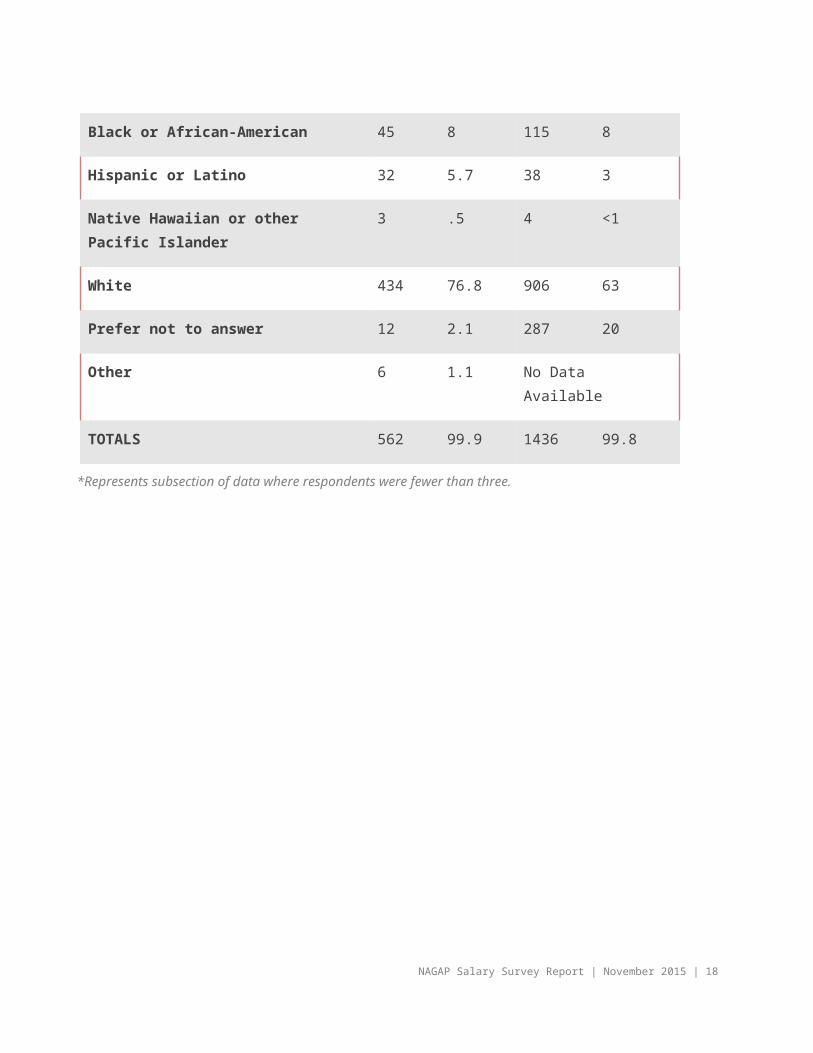
RESPONDENTS BY RACE/ETHNICITYThe overwhelming majority of respondents (77%) identify as ‘white.’ Table 4 provides the breakdown of race/ethnicity by survey respondents compared to overall NAGAP membership.
Table 4: Respondents by Race/Ethnicity
Ethnicity
Survey Respondents Current Membership*
n % n %
American Indian or Alaskan Native * * 3 <.005
Asian 19 3.4 41 3
Biracial/Multiracial 13 2.3 42 3
Black or African-American 45 8 115 8
Hispanic or Latino 32 5.7 38 3
Native Hawaiian or other Pacific Islander
3 .5 4 <1
White 434 76.8 906 63
Prefer not to answer 12 2.1 287 20
Other 6 1.1 No Data Available
TOTALS 562 99.9 1436 99.8
*Represents subsection of data where respondents were fewer than three.
NAGAP Salary Survey Report | November 2015 | 13
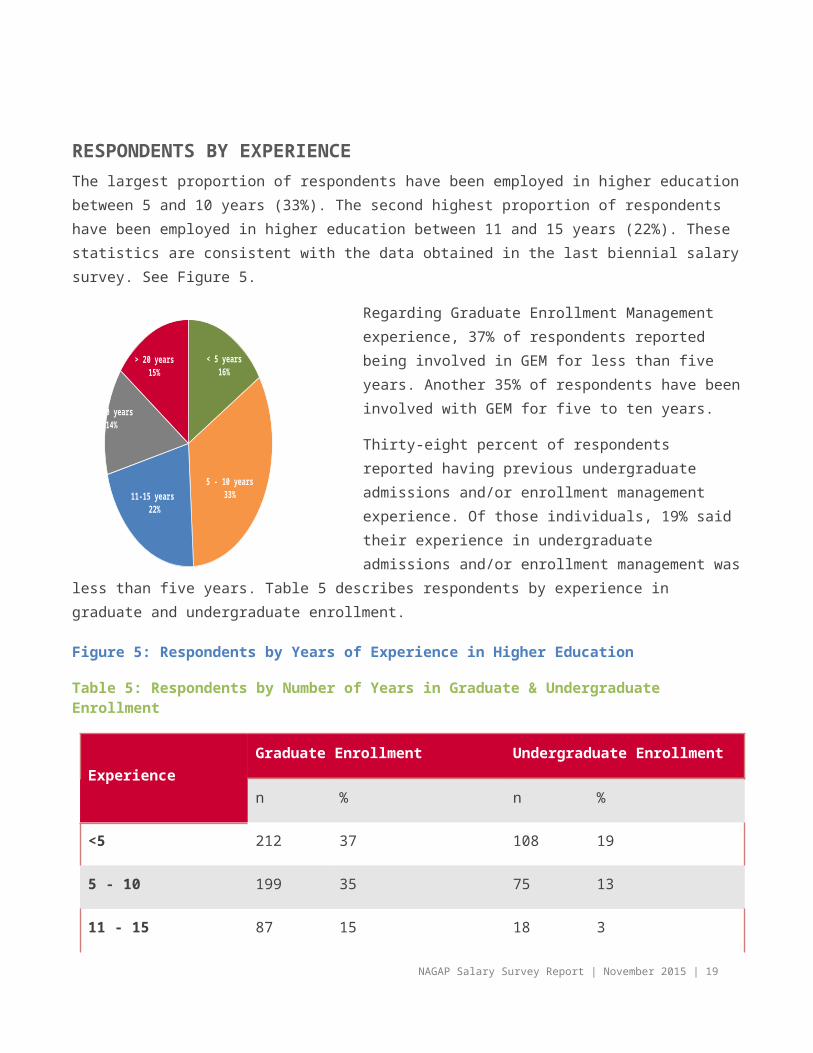
RESPONDENTS BY EXPERIENCEThe largest proportion of respondents have been employed in higher education between 5 and 10 years (33%). The second highest proportion of respondents have been employed in higher education between 11 and 15 years (22%). These statistics are consistent with the data obtained in the last biennial salary survey. See Figure 5.
Regarding Graduate Enrollment Management experience, 37% of respondents reported being involved in GEM for less than five years. Another 35% of respondents have been involved with GEM for five to ten years.
Thirty-eight percent of respondents reported having previous undergraduate admissions and/or enrollment management experience. Of those individuals, 19% said their experience in undergraduate admissions and/or enrollment management was less than five years. Table 5 describes respondents by experience in graduate and undergraduate enrollment.
Figure 5: Respondents by Years of Experience in Higher Education
Table 5: Respondents by Number of Years in Graduate & Undergraduate Enrollment
ExperienceGraduate Enrollment Undergraduate Enrollment
n % n %
<5 212 37 108 19
5 - 10 199 35 75 13
11 - 15 87 15 18 3
16 - 20 43 8 8 2
>20 30 5 6 1
N/A 0 0 348 62
TOTALS 571 100 563 100
NAGAP Salary Survey Report | November 2015 | 14
< 5 years16%
5 - 10 years33%11-15 years
22%
16-20 years14%
> 20 years15%
RESPONDENTS BY POSITION TYPE AND TITLEThe majority of respondents (92%) are full-time university administrators with no faculty appointment (see Table 6).
Table 6: Respondents by Position Type
*Represents subsection of data where respondents were fewer than three.
Respondents had a variety of individualized titles. Of those respondents who provided a title, 35% hold the title of Director. Table 7 includes the full breakdown of reported titles.
Table 7: Respondents by Position Title
NAGAP Salary Survey Report | November 2015 | 15
Position Title n %
Admissions Counselor 32 6
Admissions Officer 15 3
Assistant Coordinator 3 1
Assistant Dean 37 7
Assistant Director 69 14
Assistant Vice President 3 1
Associate Coordinator * *
Associate Dean 11 2
Associate Director 62 12
Associate Vice President 3 1
Coordinator 54 11
Dean 5 1
Director 175 35
Manager 25 5
Vice President 3 1
TOTAL 499 100
Position Type n %
Full-time university administrator, no faculty appointment
502 92
Full-time university administrator with faculty appointment
33 6
Part-time university administration, part-time faculty appointment
3 1
Part-time university administrator, no faculty appointment
3 1
TOTAL 541 100
NAGAP Salary Survey Report | November 2015 | 16
Salary Data and Analysis
Overview
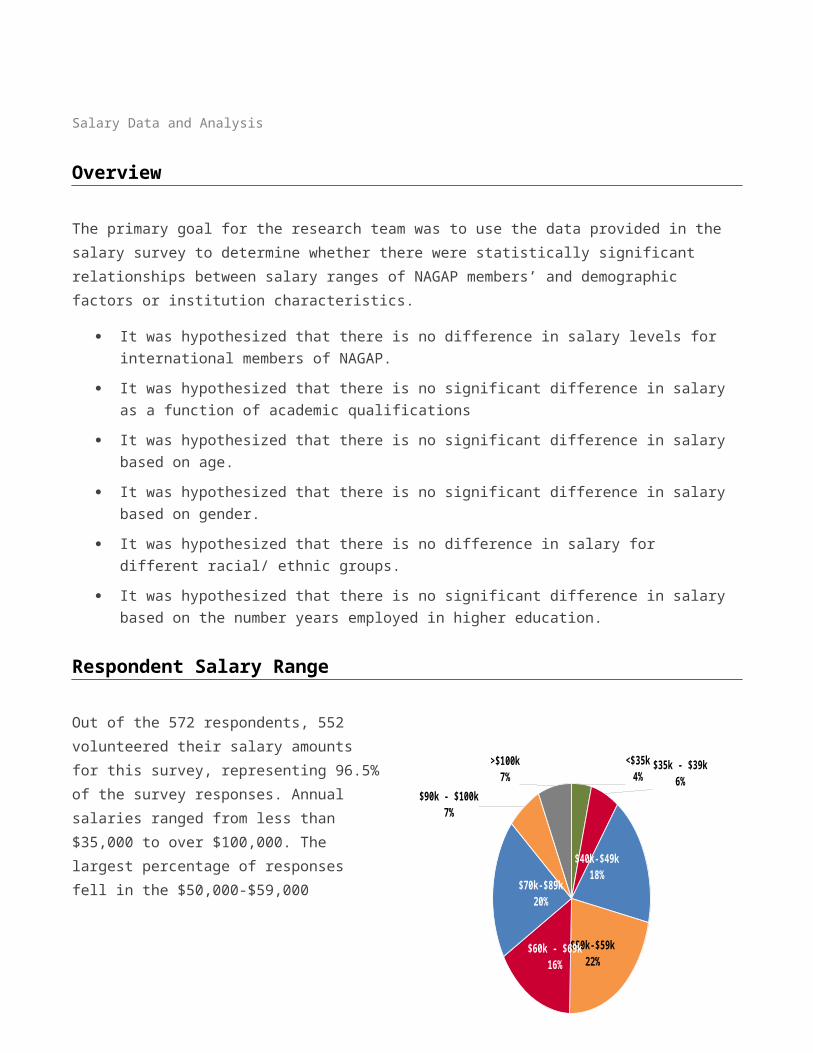
The primary goal for the research team was to use the data provided in the salary survey to determine whether there were statistically significant relationships between salary ranges of NAGAP members’ and demographic factors or institution characteristics.
It was hypothesized that there is no difference in salary levels for international members of NAGAP.
It was hypothesized that there is no significant difference in salary as a function of academic qualifications
It was hypothesized that there is no significant difference in salary based on age.
It was hypothesized that there is no significant difference in salary based on gender.
It was hypothesized that there is no difference in salary for different racial/ ethnic groups.
It was hypothesized that there is no significant difference in salary based on the number years employed in higher education.
Respondent Salary Range
Out of the 572 respondents, 552 volunteered their salary amounts for this survey, representing 96.5% of the survey responses. Annual salaries ranged from less than $35,000 to over $100,000. The largest percentage of responses fell in the $50,000-$59,000 (21.92%) and $70,000-$89,000 (total of 19.75%) salary ranges. Figure 6 shows the distribution by respondents.
Figure 6: Respondents by Salary Range
NAGAP Salary Survey Report | November 2015 | 17
<$35k4% $35k - $39k
6%
$40k-$49k18%
$50k-$59k22%
$60k - $69k16%
$70k-$89k20%
$90k - $100k7%
>$100k7%
International Membership
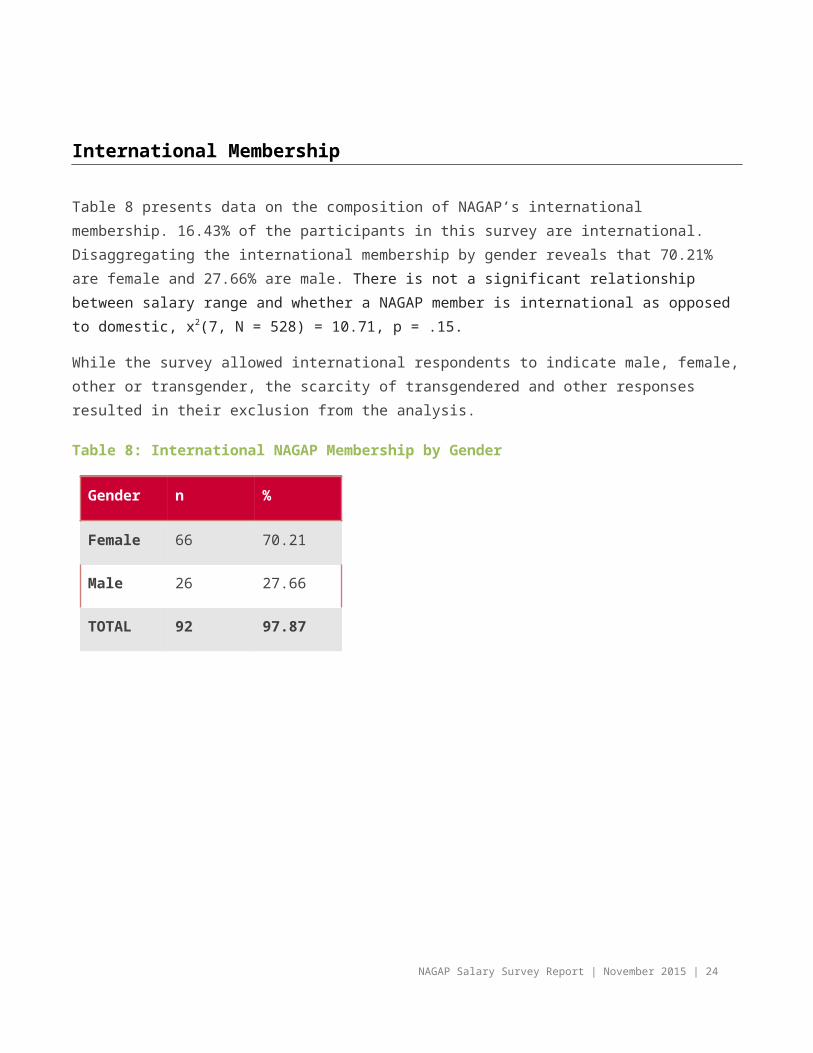
Table 8 presents data on the composition of NAGAP’s international membership. 16.43% of the participants in this survey are international. Disaggregating the international membership by gender reveals that 70.21% are female and 27.66% are male. There is not a significant relationship between salary range and whether a NAGAP member is international as opposed to domestic, x2(7, N = 528) = 10.71, p = .15.
While the survey allowed international respondents to indicate male, female, other or transgender, the scarcity of transgendered and other responses resulted in their exclusion from the analysis.
Table 8: International NAGAP Membership by Gender
Gender n %
Female 66 70.21
Male 26 27.66
TOTAL 92 97.87
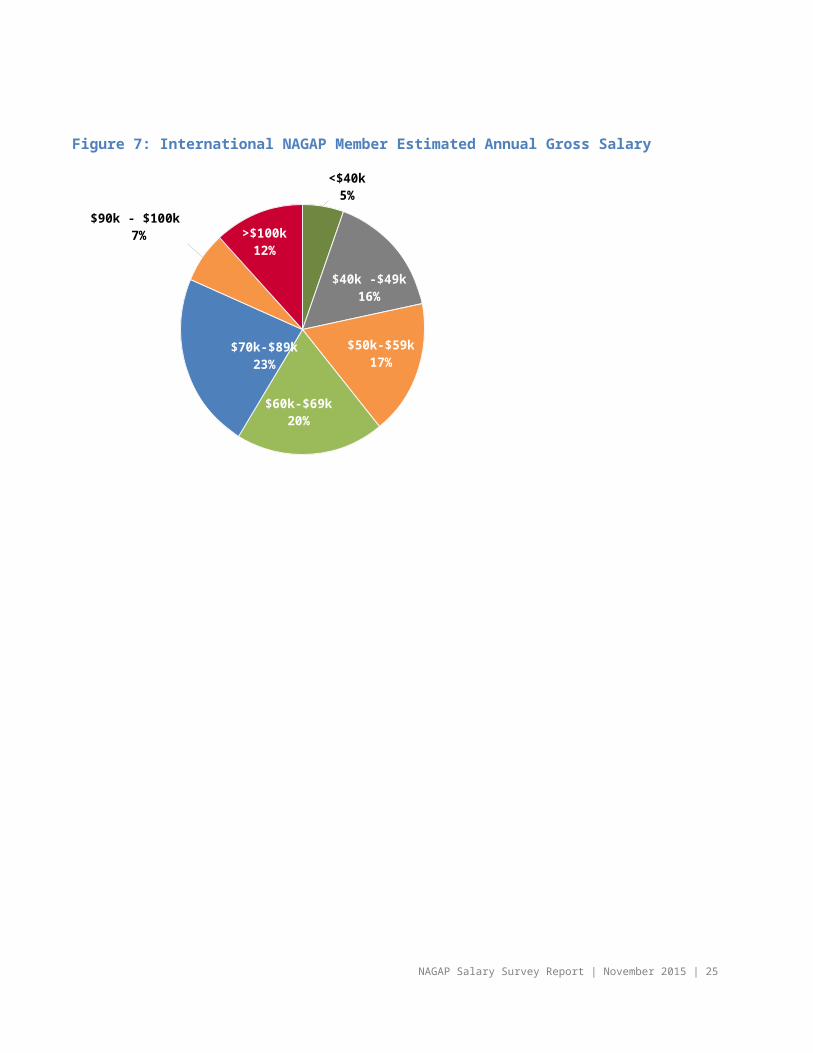
Figure 7: International NAGAP Member Estimated Annual Gross Salary
<$40k5%
$40k -$49k16%
$50k-$59k17%
$60k-$69k20%
$70k-$89k23%
$90k - $100k 7% >$100k
12%
NAGAP Salary Survey Report | November 2015 | 18
Salary by Institution Characteristics
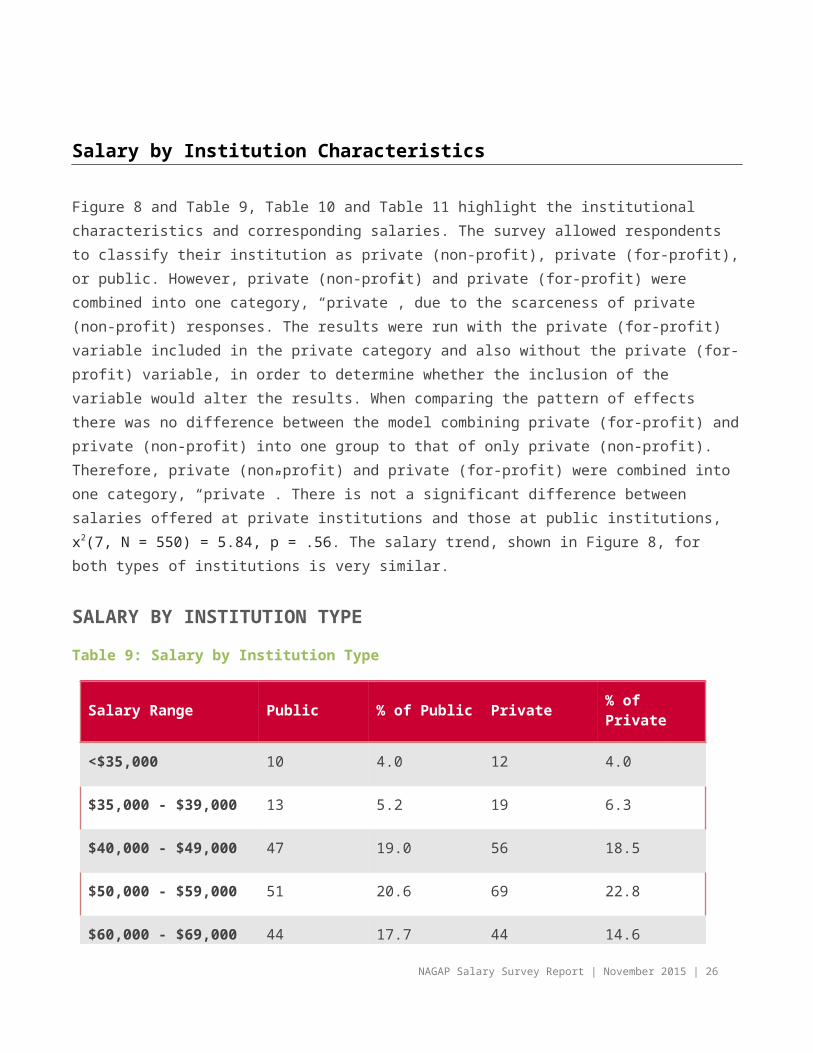
Figure 8 and Table 9, Table 10 and Table 11 highlight the institutional characteristics and corresponding salaries. The survey allowed respondents to classify their institution as private (non-profit), private (for-profit), or public. However, private (non-profit) and private (for-profit) were combined into one category, “private”, due to the scarceness of private (non-profit) responses. The results were run with the private (for-profit) variable included in the private category and also without the private (for-profit) variable, in order to determine whether the inclusion of the variable would alter the results. When comparing the pattern of effects there was no difference between the model combining private (for-profit) and private (non-profit) into one group to that of only private (non-profit). Therefore, private (non-profit) and private (for-profit) were combined into one category, “private”. There is not a significant difference between salaries offered at private institutions and those at public institutions, x2(7, N = 550) = 5.84, p = .56. The salary trend, shown in Figure 8, for both types of institutions is very similar.
SALARY BY INSTITUTION TYPETable 9: Salary by Institution Type
Salary Range Public % of Public Private % of Private
<$35,000 10 4.0 12 4.0
$35,000 - $39,000 13 5.2 19 6.3
$40,000 - $49,000 47 19.0 56 18.5
$50,000 - $59,000 51 20.6 69 22.8
$60,000 - $69,000 44 17.7 44 14.6
$70,000 - $89,000 48 19.4 61 20.2
$90,000 - $100,000 22 8.9 16 5.3
>$100,000 13 5.2 25 8.3
TOTALS 248 100 302 100
NAGAP Salary Survey Report | November 2015 | 19
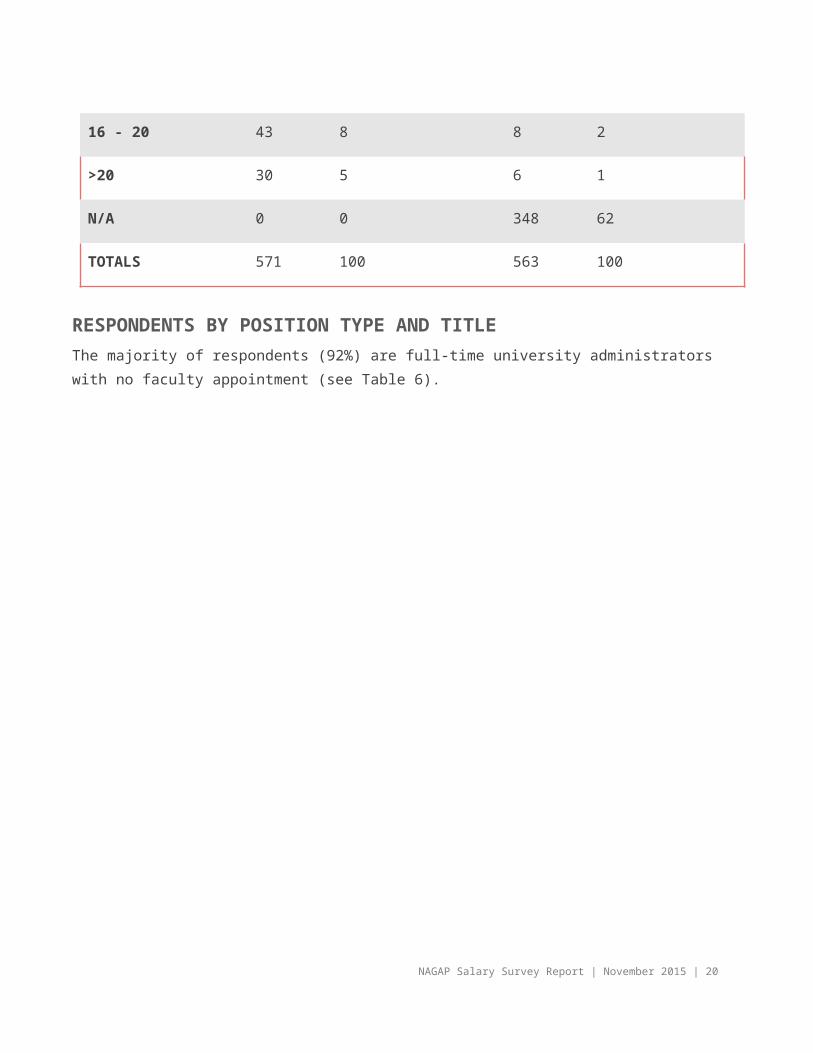
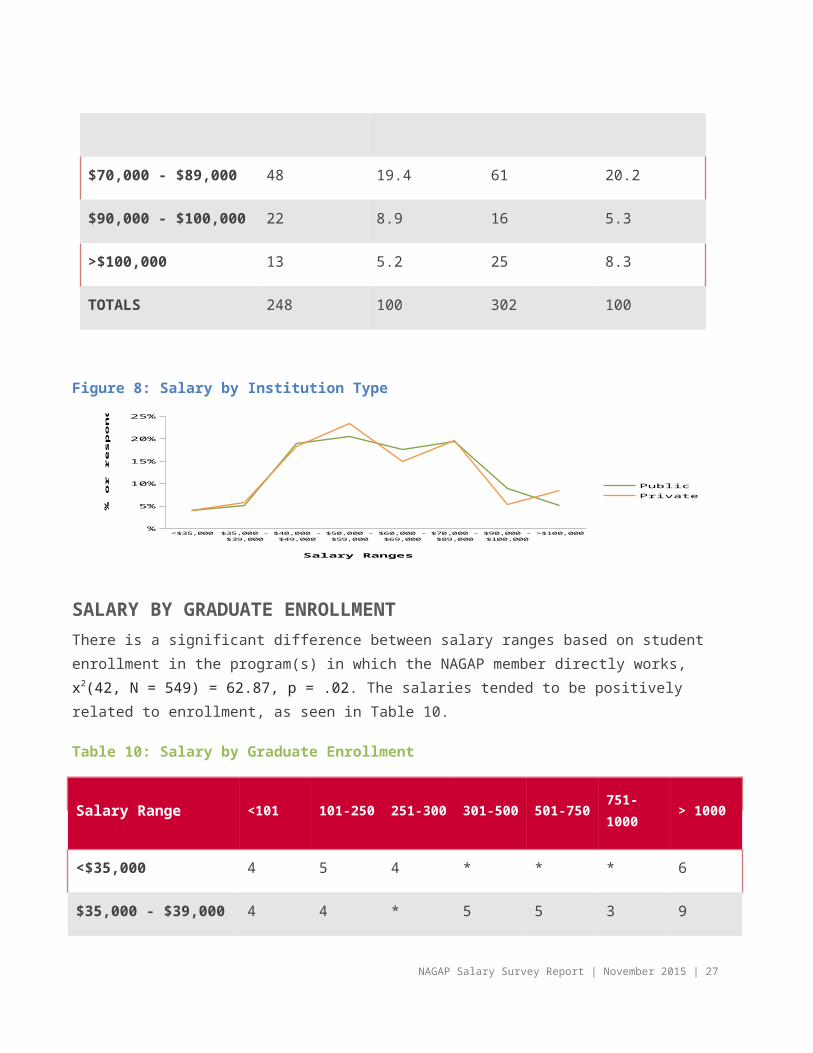
Figure 8: Salary by Institution Type
<$35,000 $35,000 - $39,000
$40,000 - $49,000
$50,000 - $59,000
$60,000 - $69,000
$70,000 - $89,000
$90,000 - $100,000
>$100,000%
5%
10%
15%
20%
25%
PublicPrivate
Salary Ranges
% o
r r
esp
on
den
ts
SALARY BY GRADUATE ENROLLMENTThere is a significant difference between salary ranges based on student enrollment in the program(s) in which the NAGAP member directly works, x2(42, N = 549) = 62.87, p = .02. The salaries tended to be positively related to enrollment, as seen in Table 10.
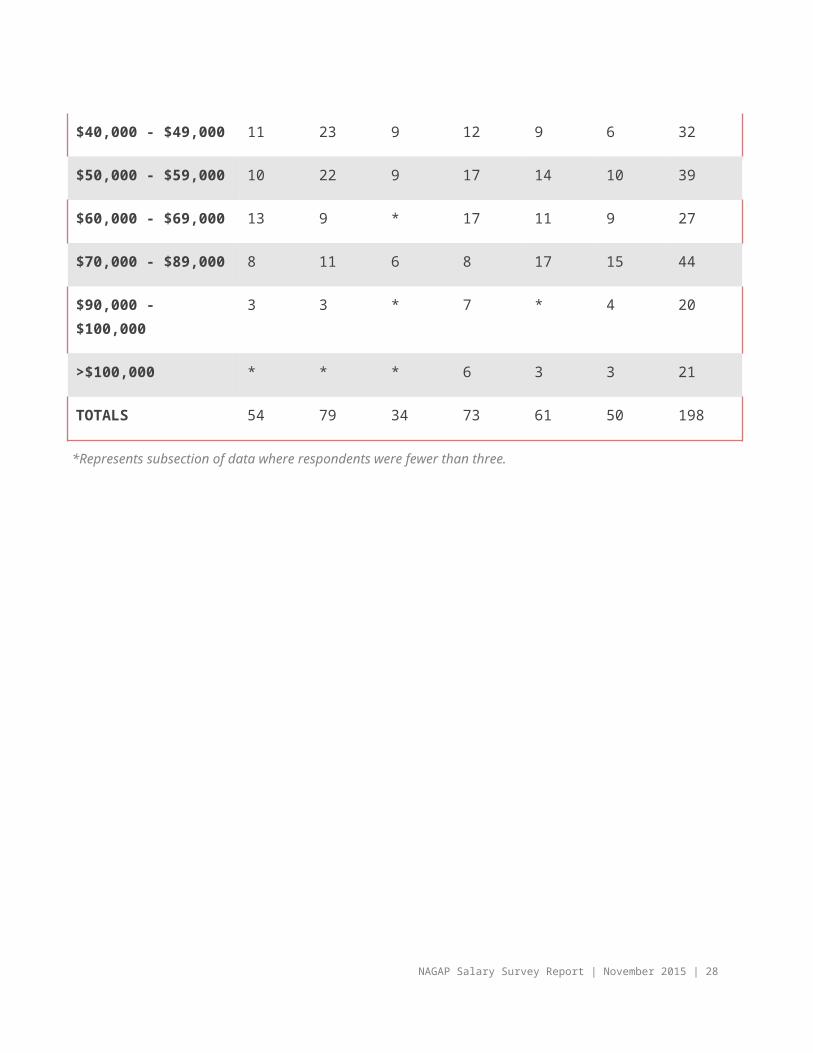
Table 10: Salary by Graduate Enrollment
Salary Range <101 101-250 251-300 301-500 501-750 751-1000 > 1000
<$35,000 4 5 4 * * * 6
$35,000 - $39,000 4 4 * 5 5 3 9
$40,000 - $49,000 11 23 9 12 9 6 32
$50,000 - $59,000 10 22 9 17 14 10 39
$60,000 - $69,000 13 9 * 17 11 9 27
$70,000 - $89,000 8 11 6 8 17 15 44
$90,000 - $100,000 3 3 * 7 * 4 20
>$100,000 * * * 6 3 3 21
TOTALS 54 79 34 73 61 50 198
*Represents subsection of data where respondents were fewer than three.
NAGAP Salary Survey Report | November 2015 | 20

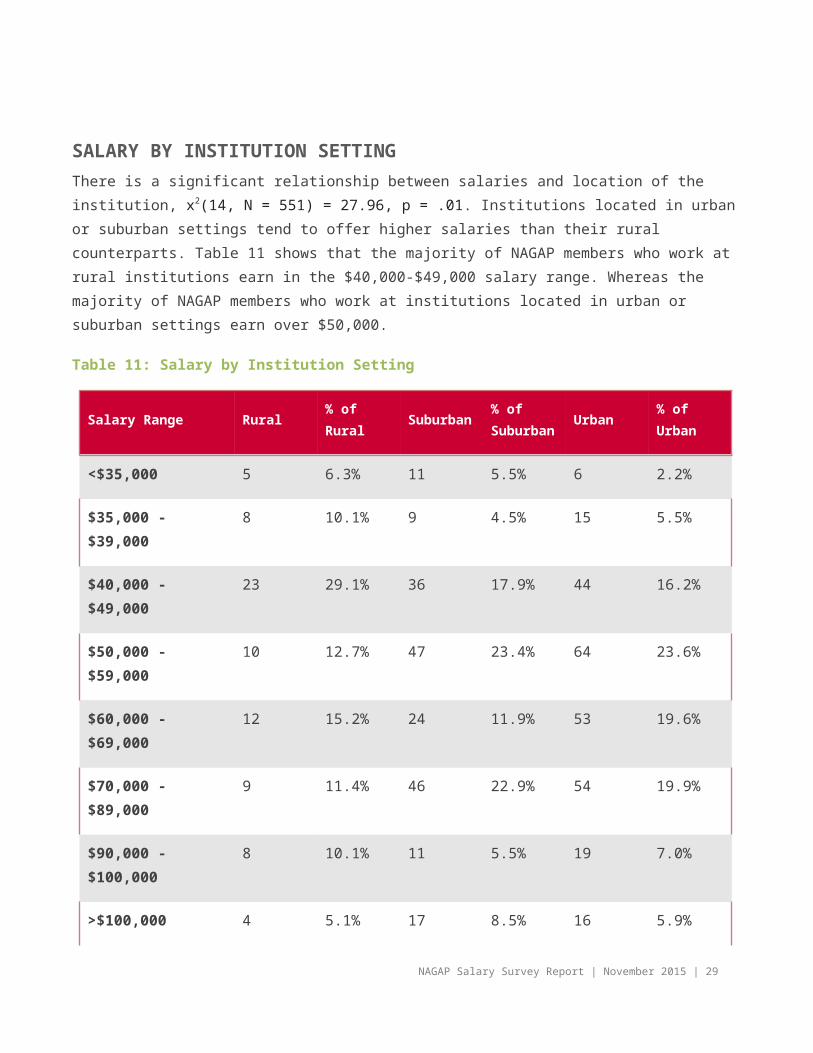
SALARY BY INSTITUTION SETTINGThere is a significant relationship between salaries and location of the institution, x2(14, N = 551) = 27.96, p = .01. Institutions located in urban or suburban settings tend to offer higher salaries than their rural counterparts. Table 11 shows that the majority of NAGAP members who work at rural institutions earn in the $40,000-$49,000 salary range. Whereas the majority of NAGAP members who work at institutions located in urban or suburban settings earn over $50,000.
Table 11: Salary by Institution Setting
Salary Range Rural % of Rural Suburban % of Suburban Urban % of
Urban
<$35,000 5 6.3% 11 5.5% 6 2.2%
$35,000 - $39,000 8 10.1% 9 4.5% 15 5.5%
$40,000 - $49,000 23 29.1% 36 17.9% 44 16.2%
$50,000 - $59,000 10 12.7% 47 23.4% 64 23.6%
$60,000 - $69,000 12 15.2% 24 11.9% 53 19.6%
$70,000 - $89,000 9 11.4% 46 22.9% 54 19.9%
$90,000 - $100,000 8 10.1% 11 5.5% 19 7.0%
>$100,000 4 5.1% 17 8.5% 16 5.9%
TOTALS 79 100 201 100 271 100
Both Urban and Suburban campuses tend to have a more equal salary distribution, ranging from $40k to $89k. However, suburban campuses have a notable exception in the $60k- $69k category. Suburban campuses also report the highest range in those earning more than $100k. Rural campuses reported salaries on the lower end of the spectrum, with the exception of the $90k-$100k category. See Figure 9: Salary by Institution Setting.
NAGAP Salary Survey Report | November 2015 | 21
<$35,000
$35,000 - $39,000
$40,000 - $49,000
$50,000 - $59,000
$60,000 - $69,000
$70,000 - $89,000
$90,000 - $100,000
$100,000+
5.5%
4.5%
17.9%
23.4%
11.9%
22.9%
5.5%
8.5%
Suburban
<$35,000
$35,000 - $39,000
$40,000 - $49,000
$50,000 - $59,000
$60,000 - $69,000
$70,000 - $89,000
$90,000 - $100,000
$100,000+
6.3%
10.1%
29.1%
12.7%
15.2%
11.4%
10.1%
5.1%
Rural
NAGAP Salary Survey Report | November 2015 | 22
<$35,000
$35,000 - $39,000
$40,000 - $49,000
$50,000 - $59,000
$60,000 - $69,000
$70,000 - $89,000
$90,000 - $100,000
$100,000+
2.2%
5.5%
16.2%
23.6%
19.6%
19.9%
7.0%
5.9%
Urban

Figure 9: Salary by Institution Setting
Salary by Respondent Characteristics
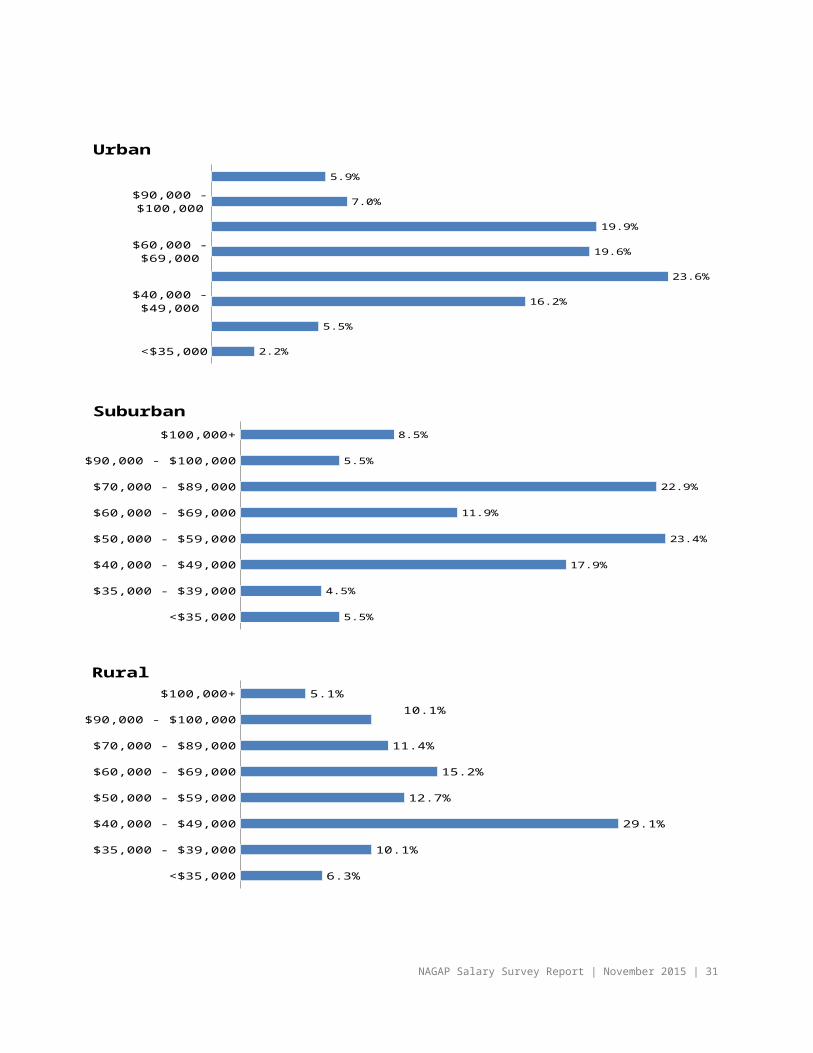
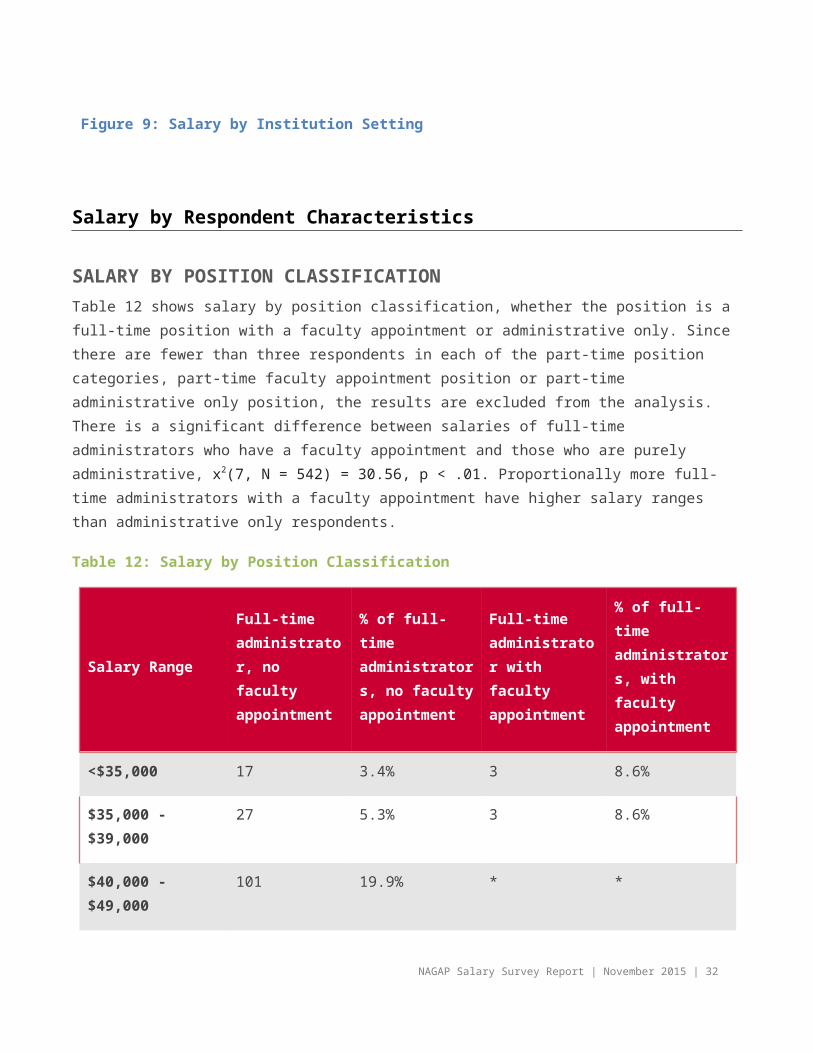
SALARY BY POSITION CLASSIFICATIONTable 12 shows salary by position classification, whether the position is a full-time position with a faculty appointment or administrative only. Since there are fewer than three respondents in each of the part-time position categories, part-time faculty appointment position or part-time administrative only position, the results are excluded from the analysis. There is a significant difference between salaries of full-time administrators who have a faculty appointment and those who are purely administrative, x2(7, N = 542) = 30.56, p < .01. Proportionally more full-time administrators with a faculty appointment have higher salary ranges than administrative only respondents.
Table 12: Salary by Position Classification
Salary Range
Full-time administrator, no faculty appointment
% of full-time administrators, no faculty appointment
Full-time administrator with faculty appointment
% of full-time administrators, with faculty appointment
<$35,000 17 3.4% 3 8.6%
$35,000 - $39,000 27 5.3% 3 8.6%
$40,000 - $49,000 101 19.9% * *
$50,000 - $59,000 112 22.1% 6 17.1%
$60,000 - $69,000 83 16.4% 5 14.3%
$70,000 - $89,000 105 20.7% 4 11.4%
$90,000 - $100,000 34 6.7% 4 11.4%
>$100,000 28 5.5% 9 25.7%
TOTALS 507 100 35 100
NAGAP Salary Survey Report | November 2015 | 23
*Represents subsection of data where respondents were fewer than three.
NAGAP Salary Survey Report | November 2015 | 24
SALARY BY POSITION TITLEThere is a significant relationship between position title and salary range, x2(98, N = 478) = 125.05, p = .03
Table 13: Salary by Position Title
Position Title<$
35,0
00
$35,
000-
$3
9,00
0
$40,
000-
$4
9,00
0
$50,
000-
$5
9,00
0
$60,
000-
$6
9,00
0
$70,
000-
$8
9,00
0
$90,
000-
$1
00,0
00
>$10
0,00
0 Tota
l
Admissions Counselor 0 2 9 5 3 5 2 5 31
Admissions Officer 1 1 1 3 2 4 1 1 14
Assistant Coordinator 0 0 0 2 1 0 0 0 3
Assistant Dean 1 1 10 7 6 7 2 1 35
Assistant Director 3 5 15 14 13 7 7 3 67
Assistant Vice President 0 2 1 0 0 0 0 0 3
Associate Coordinator 0 0 0 0 0 2 0 0 2
Associate Dean 2 1 2 1 1 0 1 1 9
Associate Director 1 6 7 15 11 13 5 4 62
Associate Vice President
1 0 1 0 1 0 0 0 3
Coordinator 5 0 12 12 5 11 5 2 52
Dean 0 2 0 1 0 1 0 1 5
Director 6 7 29 33 29 42 9 11 166
Manager 0 0 2 10 4 3 2 2 23
Vice President 0 0 0 2 0 0 1 0 3
NAGAP Salary Survey Report | November 2015 | 25
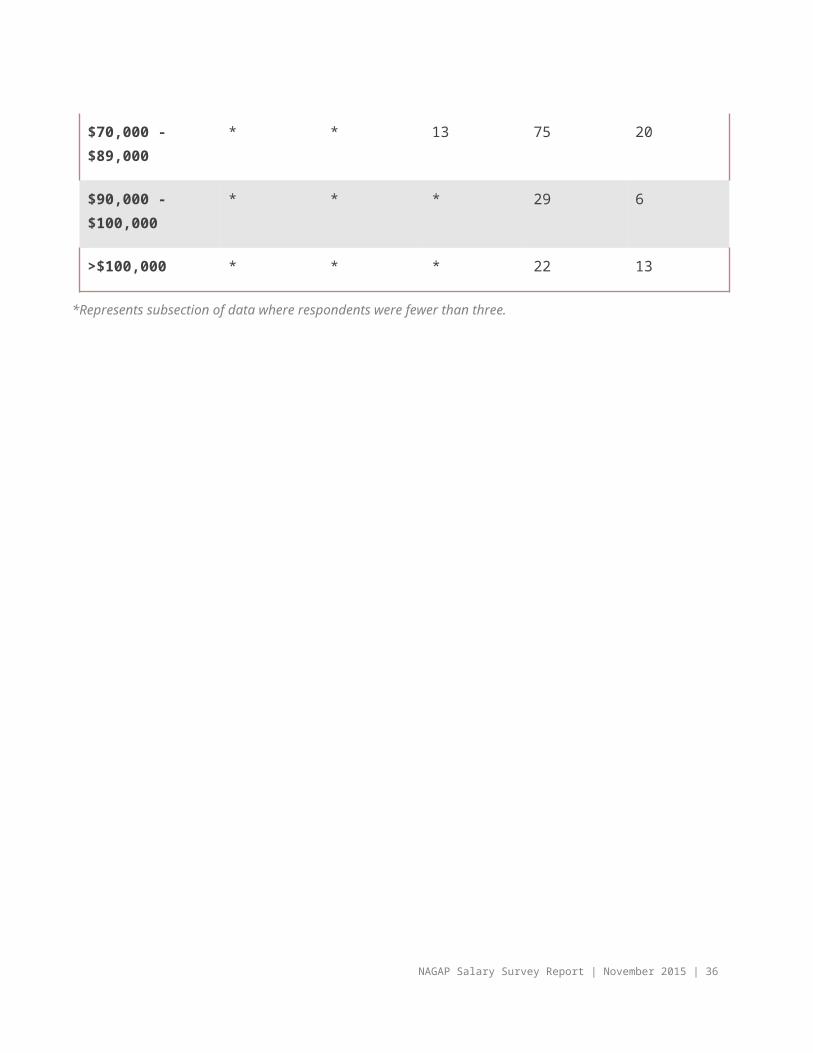
SALARY BY EDUCATION LEVELThere is a significant relationship between salary range and education level of NAGAP members, x2(28, N = 551) = 103.64, p < .01. The data on academic qualifications and salary levels supports the claim that, in general, earning advanced qualifications results in increased salary levels for NAGAP members.
Table 14: Salary by Education Level
Salary Range High School Diploma Associates Bachelor’s Master’s Doctorate/
Professional
<$35,000 * * 8 14 *
$35,000 - $39,000 * * 18 14 *
$40,000 - $49,000 * 4 36 57 *
$50,000 - $59,000 * * 36 76 7
$60,000 - $69,000 * * 11 63 13
$70,000 - $89,000 * * 13 75 20
$90,000 - $100,000
* * * 29 6
>$100,000 * * * 22 13
*Represents subsection of data where respondents were fewer than three.
NAGAP Salary Survey Report | November 2015 | 26
The figure below displays the percentages for each education level within each salary range. The category of high school diploma is omitted as the respondent number is fewer than three.
<$35,000
$35,000
- $39,00
0
$40,000
- $49,00
0
$50,000
- $59,00
0
$60,000
- $69,00
0
$70,000
- $89,00
0
$90,000
- $100,0
00 >$100,000
%
10%
20%
30%
40%
50%
60%
70%
80%
90%
100%
36%56%
37%30%
13% 12%
64%44%
59%64%
72% 69%83%
63%
4%
6%15% 19% 17%
37%
Doctorate/ Pro-fessionalMaster’sBachelor’s
Figure 10: Education Level by Salary Range
NAGAP Salary Survey Report | November 2015 | 27
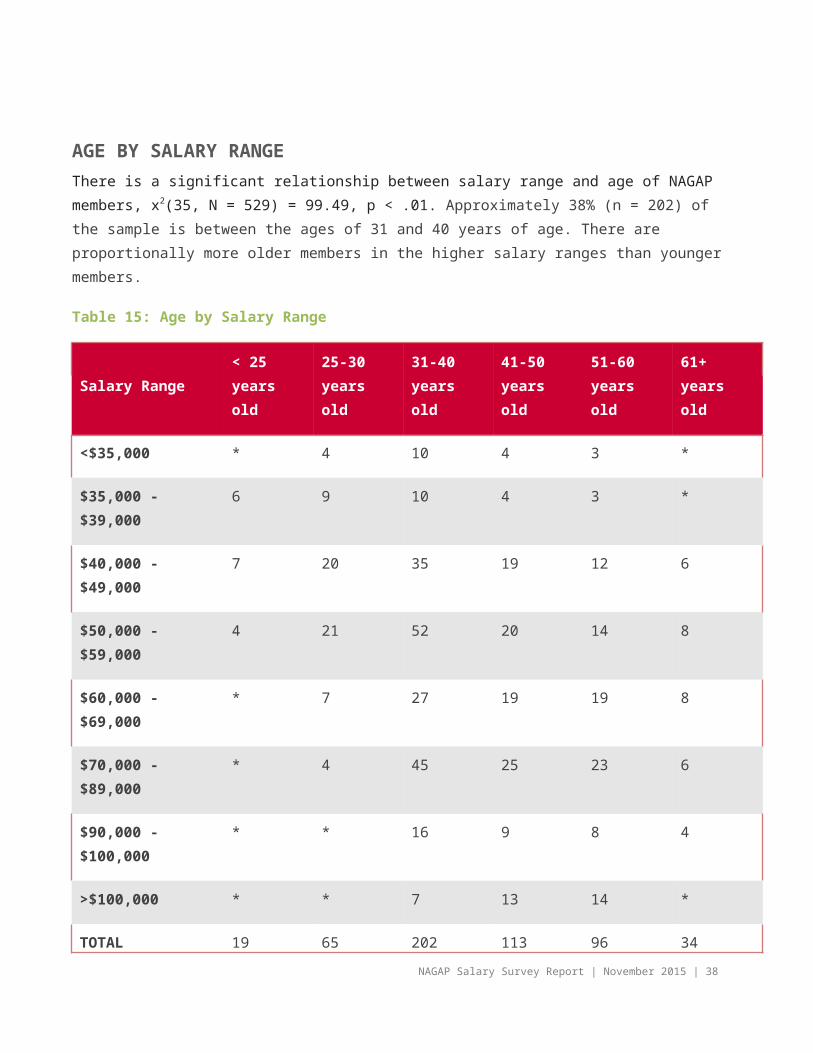
AGE BY SALARY RANGEThere is a significant relationship between salary range and age of NAGAP members, x2(35, N = 529) = 99.49, p < .01. Approximately 38% (n = 202) of the sample is between the ages of 31 and 40 years of age. There are proportionally more older members in the higher salary ranges than younger members.
Table 15: Age by Salary Range
Salary Range < 25 years old
25-30 years old
31-40 years old
41-50 years old
51-60 years old
61+ years old
<$35,000 * 4 10 4 3 *
$35,000 - $39,000 6 9 10 4 3 *
$40,000 - $49,000 7 20 35 19 12 6
$50,000 - $59,000 4 21 52 20 14 8
$60,000 - $69,000 * 7 27 19 19 8
$70,000 - $89,000 * 4 45 25 23 6
$90,000 - $100,000 * * 16 9 8 4
>$100,000 * * 7 13 14 *
TOTAL 19 65 202 113 96 34
*Represents subsection of data where respondents were fewer than three.
NAGAP Salary Survey Report | November 2015 | 28
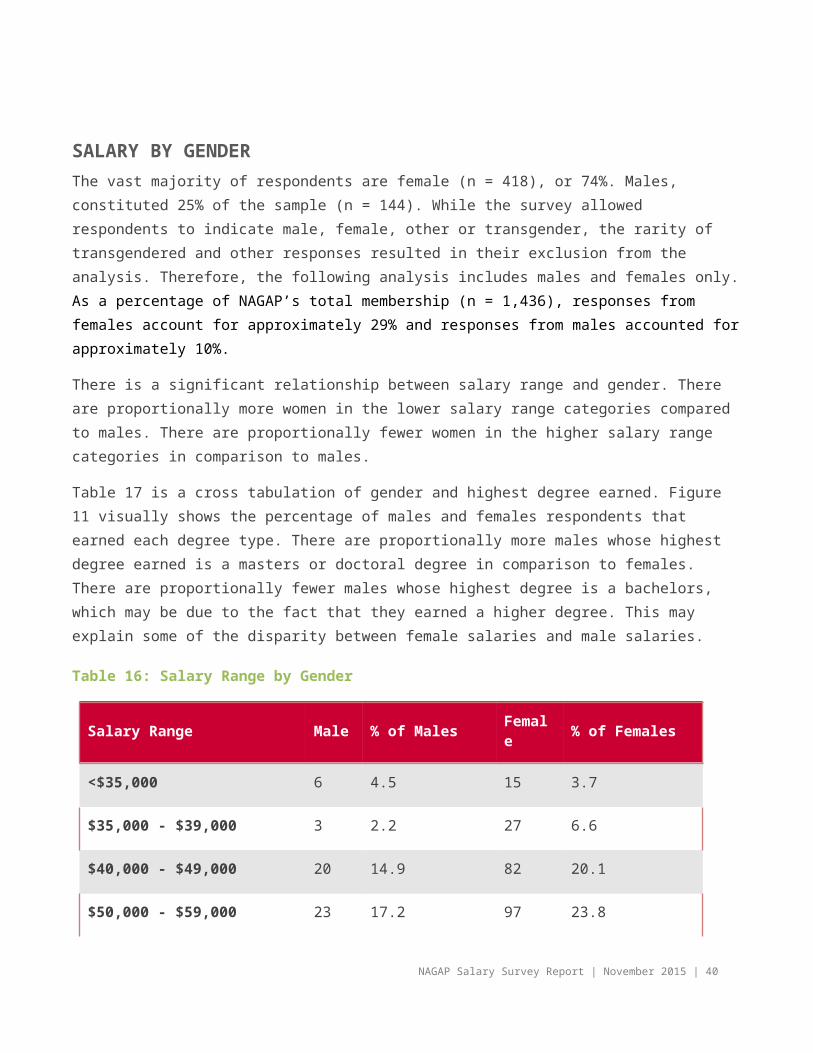
SALARY BY GENDER The vast majority of respondents are female (n = 418), or 74%. Males, constituted 25% of the sample (n = 144). While the survey allowed respondents to indicate male, female, other or transgender, the rarity of transgendered and other responses resulted in their exclusion from the analysis. Therefore, the following analysis includes males and females only. As a percentage of NAGAP’s total membership (n = 1,436), responses from females account for approximately 29% and responses from males accounted for approximately 10%.
There is a significant relationship between salary range and gender. There are proportionally more women in the lower salary range categories compared to males. There are proportionally fewer women in the higher salary range categories in comparison to males.
Table 17 is a cross tabulation of gender and highest degree earned. Figure 11 visually shows the percentage of males and females respondents that earned each degree type. There are proportionally more males whose highest degree earned is a masters or doctoral degree in comparison to females. There are proportionally fewer males whose highest degree is a bachelors, which may be due to the fact that they earned a higher degree. This may explain some of the disparity between female salaries and male salaries.
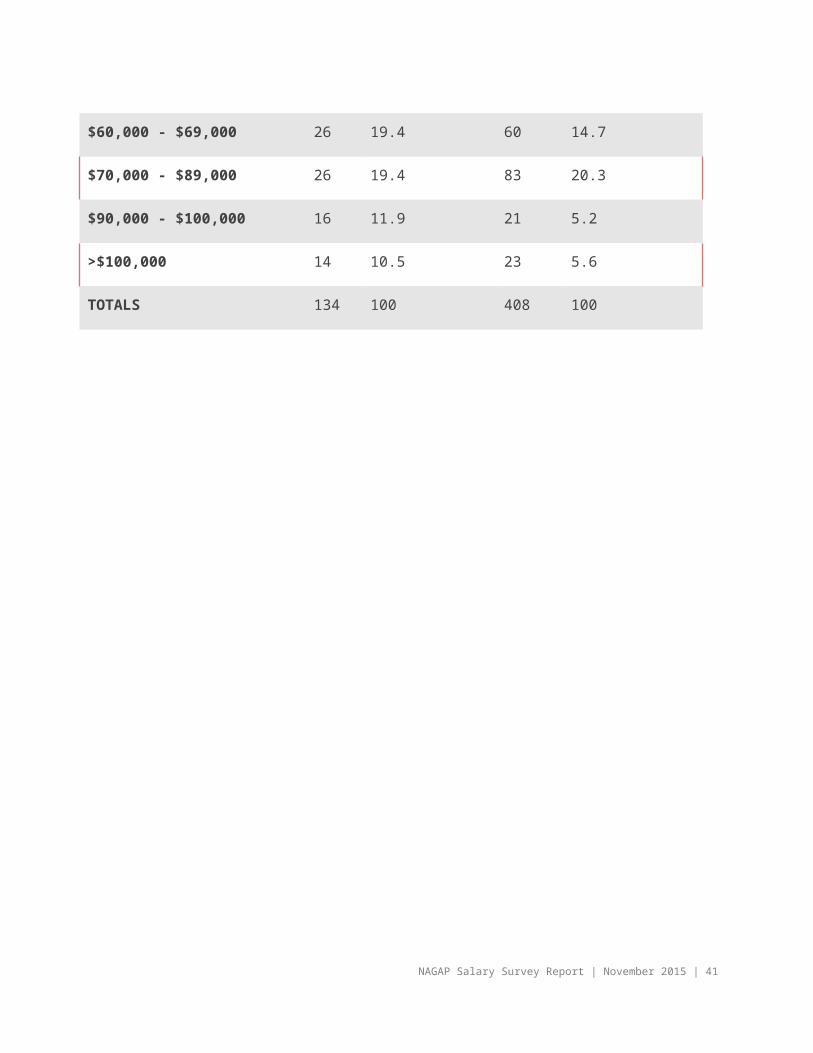
Table 16: Salary Range by Gender
Salary Range Male % of Males Female % of Females
<$35,000 6 4.5 15 3.7
$35,000 - $39,000 3 2.2 27 6.6
$40,000 - $49,000 20 14.9 82 20.1
$50,000 - $59,000 23 17.2 97 23.8
$60,000 - $69,000 26 19.4 60 14.7
$70,000 - $89,000 26 19.4 83 20.3
$90,000 - $100,000 16 11.9 21 5.2
>$100,000 14 10.5 23 5.6
TOTALS 134 100 408 100
NAGAP Salary Survey Report | November 2015 | 29
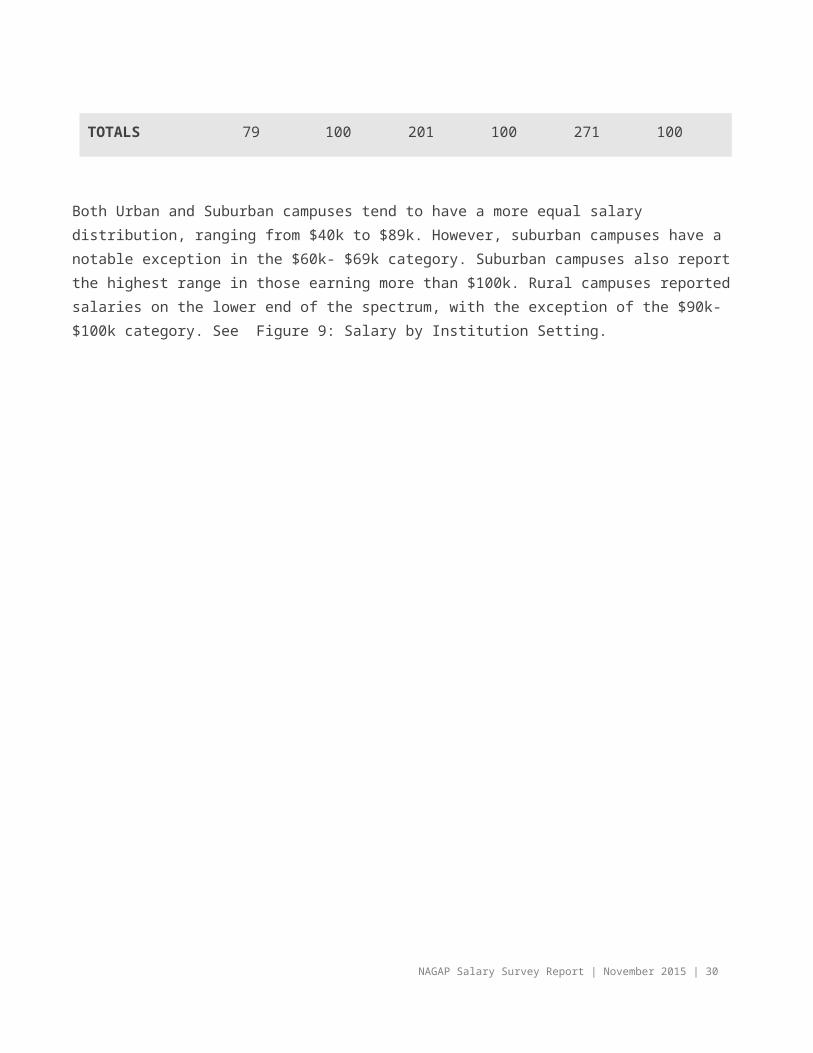
Table 17: Frequency of Degree Conferrals by Gender
GenderHigh School Diploma
Associate’s Bachelor’s Master’s
Doctorate/Professional(PhD, EdD, MBA, JD, MD, etc.)
TOTAL
Female 3 8 104 255 47 417
Male 0 0 23 100 21 144
TOTALS
3 8 127 355 68 561
Figure 11: Highest Academic Degree by Gender
Hig
h Sch
ool Dip
lom
a
Ass
ociat
e’s
Bac
helor’
s
Mas
ter’s
Doct
orate
/1% 2%
25%
61%
11%
0% 0%
16%
69%
15%
Female
Male
NAGAP Salary Survey Report | November 2015 | 30
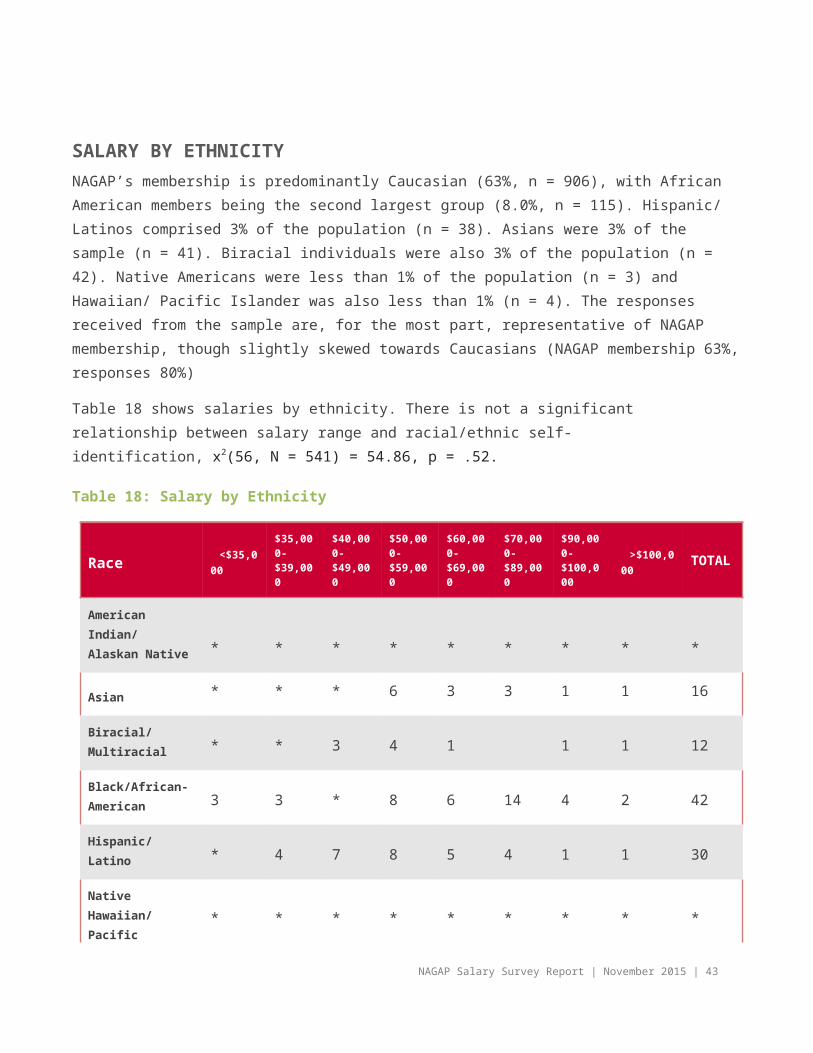
SALARY BY ETHNICITYNAGAP’s membership is predominantly Caucasian (63%, n = 906), with African American members being the second largest group (8.0%, n = 115). Hispanic/ Latinos comprised 3% of the population (n = 38). Asians were 3% of the sample (n = 41). Biracial individuals were also 3% of the population (n = 42). Native Americans were less than 1% of the population (n = 3) and Hawaiian/ Pacific Islander was also less than 1% (n = 4). The responses received from the sample are, for the most part, representative of NAGAP membership, though slightly skewed towards Caucasians (NAGAP membership 63%, responses 80%)
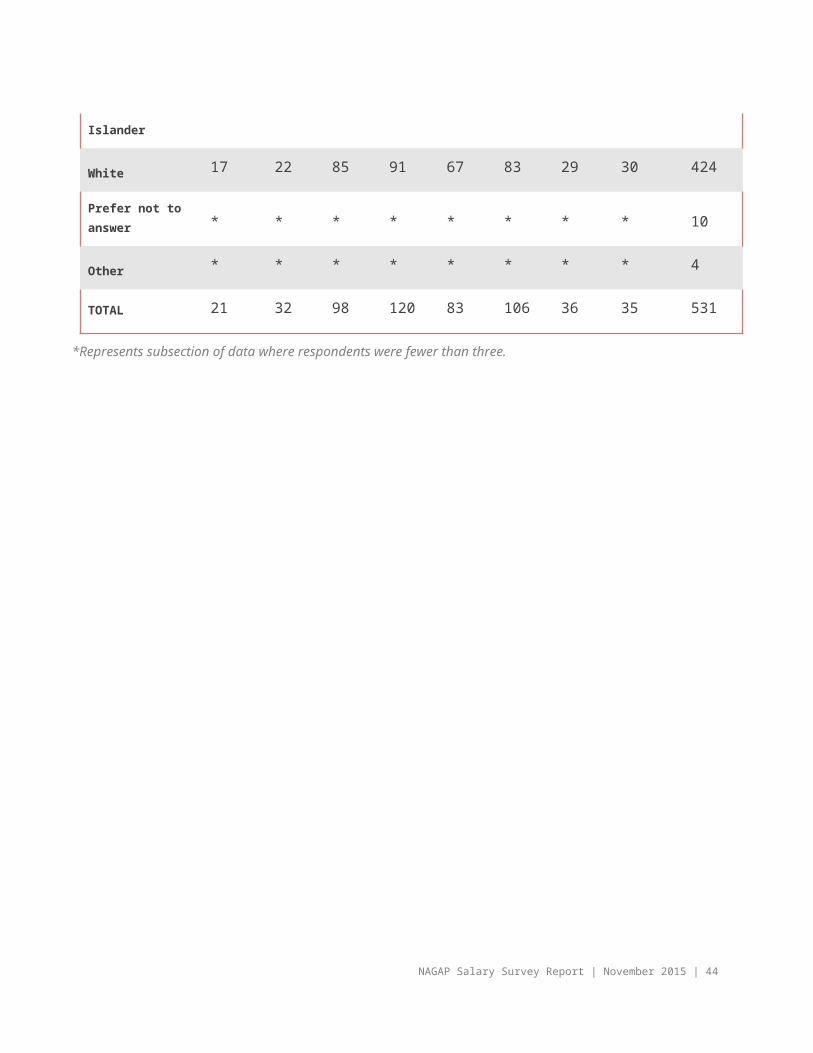
Table 18 shows salaries by ethnicity. There is not a significant relationship between salary range and racial/ethnic self-identification, x2(56, N = 541) = 54.86, p = .52.
Table 18: Salary by Ethnicity
Race <$35,000$35,000-$39,000
$40,000-$49,000
$50,000-$59,000
$60,000-$69,000
$70,000-$89,000
$90,000-$100,000 >$100,000 TOTAL
American Indian/ Alaskan Native * * * * * * * * *
Asian * * * 6 3 3 1 1 16
Biracial/Multiracial * * 3 4 1 1 1 12
Black/African-American 3 3 * 8 6 14 4 2 42
Hispanic/Latino * 4 7 8 5 4 1 1 30
Native Hawaiian/ Pacific Islander * * * * * * * * *
White 17 22 85 91 67 83 29 30 424
Prefer not to answer * * * * * * * * 10
Other * * * * * * * * 4
TOTAL 21 32 98 120 83 106 36 35 531
*Represents subsection of data where respondents were fewer than three.
NAGAP Salary Survey Report | November 2015 | 31
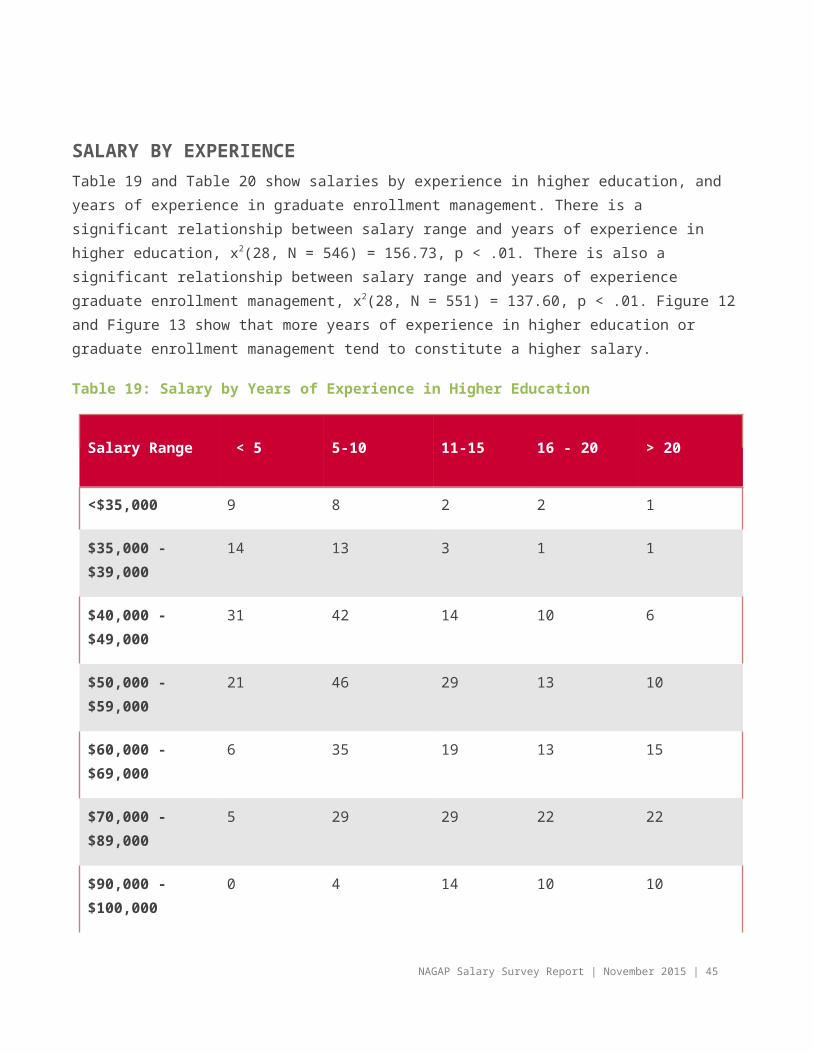
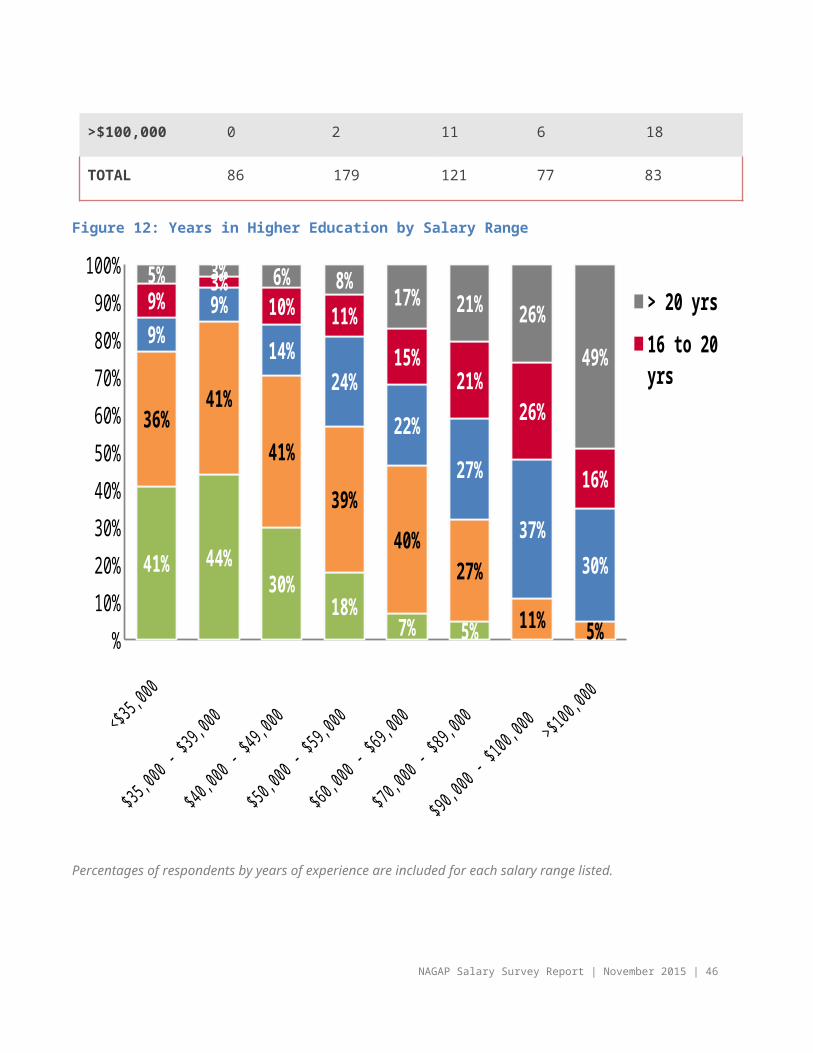
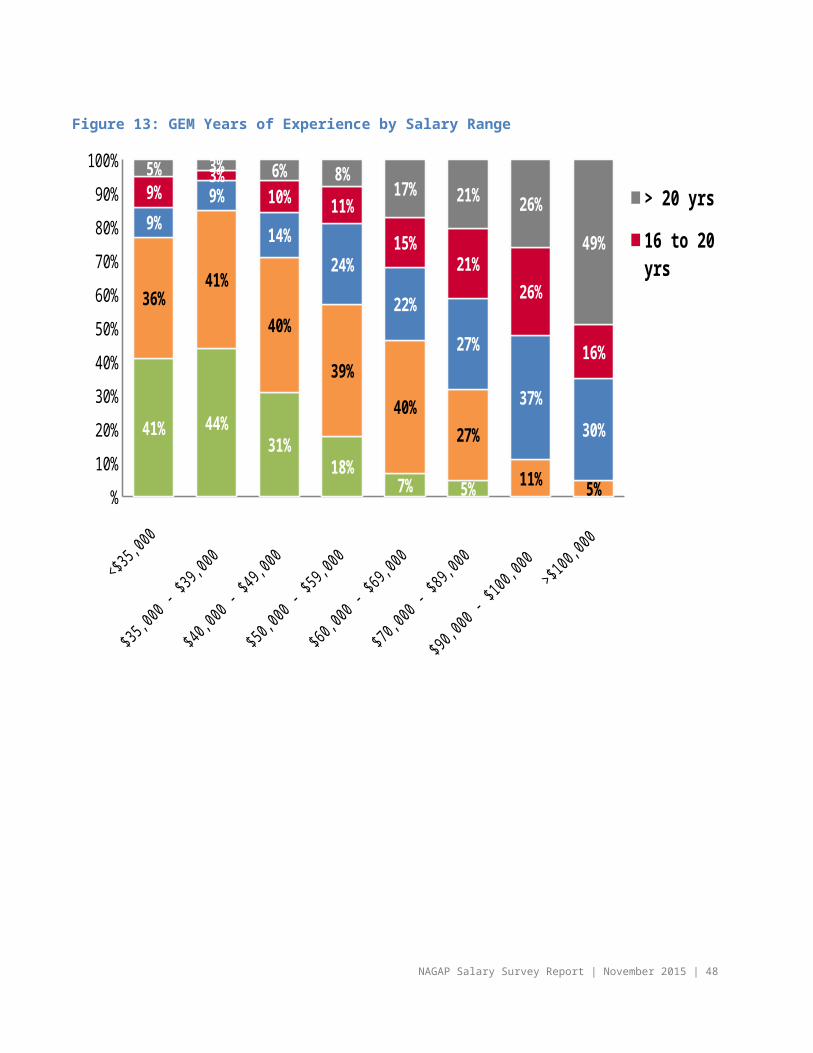
SALARY BY EXPERIENCETable 19 and Table 20 show salaries by experience in higher education, and years of experience in graduate enrollment management. There is a significant relationship between salary range and years of experience in higher education, x2(28, N = 546) = 156.73, p < .01. There is also a significant relationship between salary range and years of experience graduate enrollment management, x2(28, N = 551) = 137.60, p < .01. Figure 12 and Figure 13 show that more years of experience in higher education or graduate enrollment management tend to constitute a higher salary.
Table 19: Salary by Years of Experience in Higher Education
Salary Range < 5 5-10 11-15 16 - 20 > 20
<$35,000 9 8 2 2 1
$35,000 - $39,000 14 13 3 1 1
$40,000 - $49,000 31 42 14 10 6
$50,000 - $59,000 21 46 29 13 10
$60,000 - $69,000 6 35 19 13 15
$70,000 - $89,000 5 29 29 22 22
$90,000 - $100,000
0 4 14 10 10
>$100,000 0 2 11 6 18
TOTAL 86 179 121 77 83
NAGAP Salary Survey Report | November 2015 | 32
Figure 12: Years in Higher Education by Salary Range
<$35,000 $35,000 - $39,000
$40,000 - $49,000
$50,000 - $59,000
$60,000 - $69,000
$70,000 - $89,000
$90,000 - $100,000
>$100,000%
10%
20%
30%
40%
50%
60%
70%
80%
90%
100%
41% 44%30%
18%7% 5%
36%41%
41%
39%
40%
27%
11% 5%
9%9%
14%
24%
22%
27%
37%
30%
9%3%
10% 11%
15%21%
26%
16%
5% 3% 6% 8%17% 21% 26%
49%
> 20 yrs16 to 20 yrs11 to 15 yrs5 to 10 yrs < 5 yrs
Percentages of respondents by years of experience are included for each salary range listed.
NAGAP Salary Survey Report | November 2015 | 33
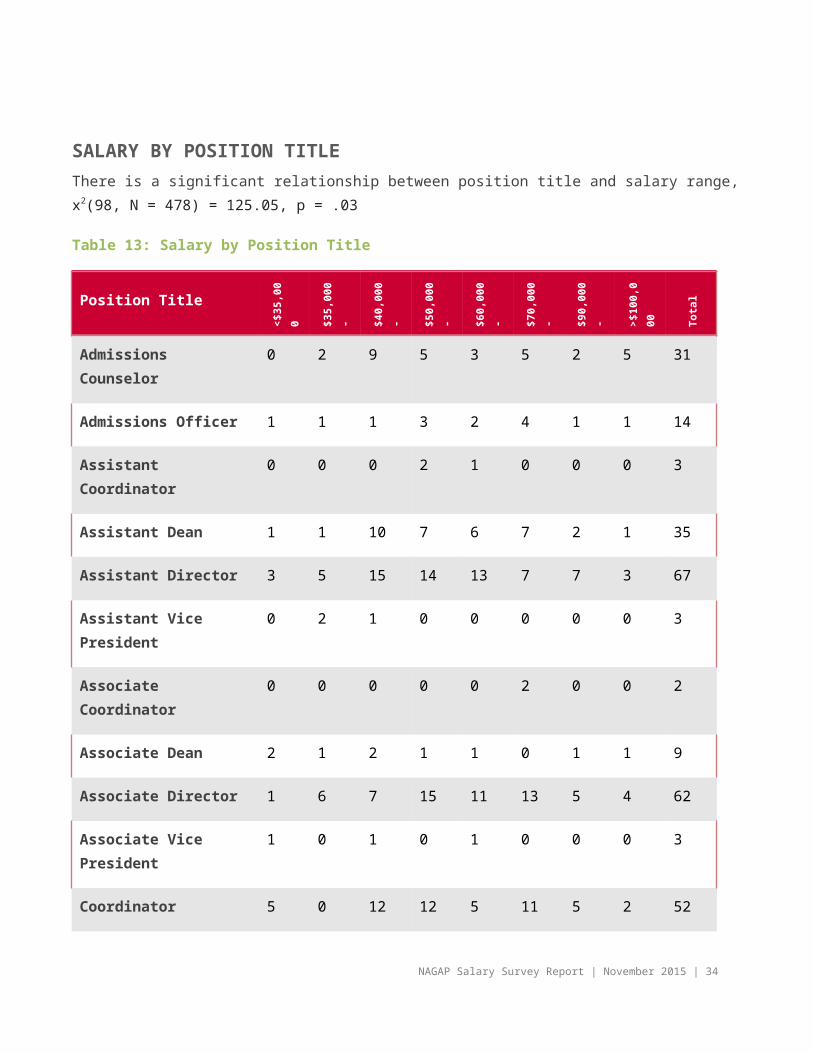
Table 20: Salary by Years of Experience in Graduate Enrollment Management
Salary Range < 5 5-10 11-15 16 - 20 > 20
<$35,000 18 3 1 0 0
$35,000 - $39,000 22 10 0 0 0
$40,000 - $49,000 60 32 7 2 1
$50,000 - $59,000 46 45 18 10 2
$60,000 - $69,000 26 33 19 3 8
$70,000 - $89,000 23 45 20 12 9
$90,000 - $100,000 3 15 11 5 4
>$100,000 5 9 8 10 6
TOTAL 203 192 84 42 30
NAGAP Salary Survey Report | November 2015 | 34
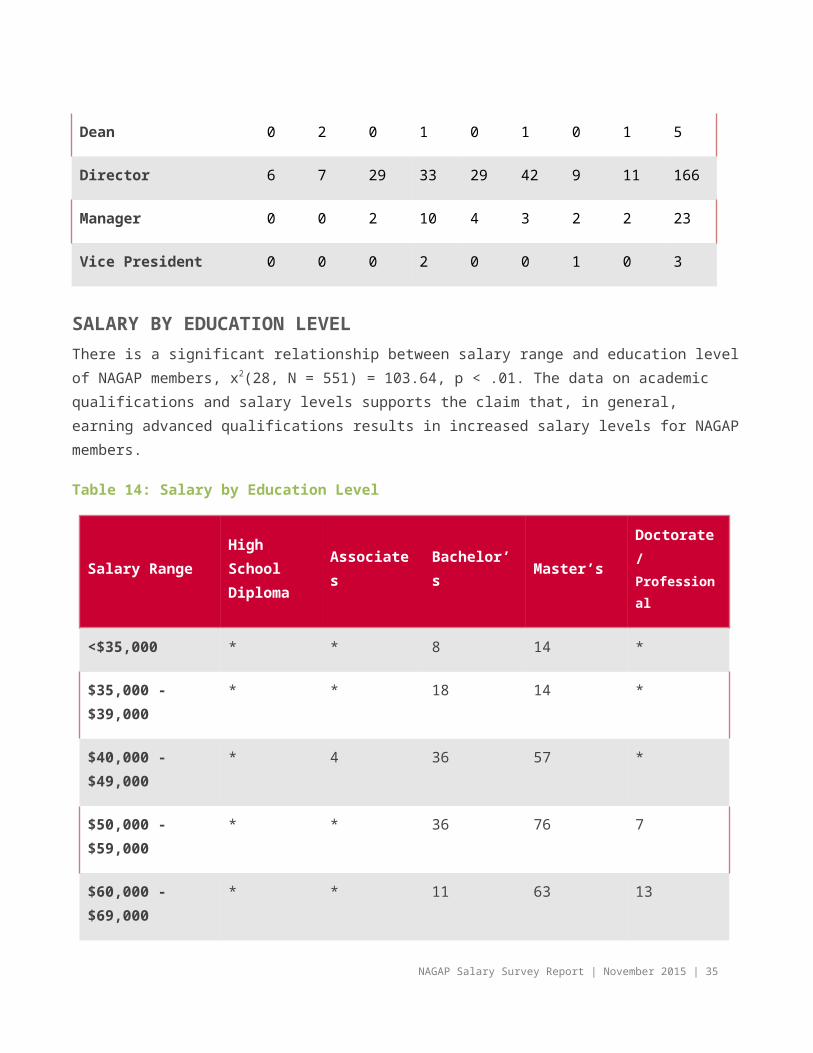
Figure 13: GEM Years of Experience by Salary Range
<$35,000 $35,000 - $39,000
$40,000 - $49,000
$50,000 - $59,000
$60,000 - $69,000
$70,000 - $89,000
$90,000 - $100,000
>$100,000%
10%
20%
30%
40%
50%
60%
70%
80%
90%
100%
41% 44%31%
18%7% 5%
36%41%
40%
39%
40%
27%
11%5%
9%
9%
14%
24%
22%
27%
37%
30%
9%3%
10% 11%
15%21%
26%
16%
5% 3% 6% 8%17% 21% 26%
49%
> 20 yrs16 to 20 yrs11 to 15 yrs5 to 10 yrs < 5 yrs
NAGAP Salary Survey Report | November 2015 | 35
Salary Increases
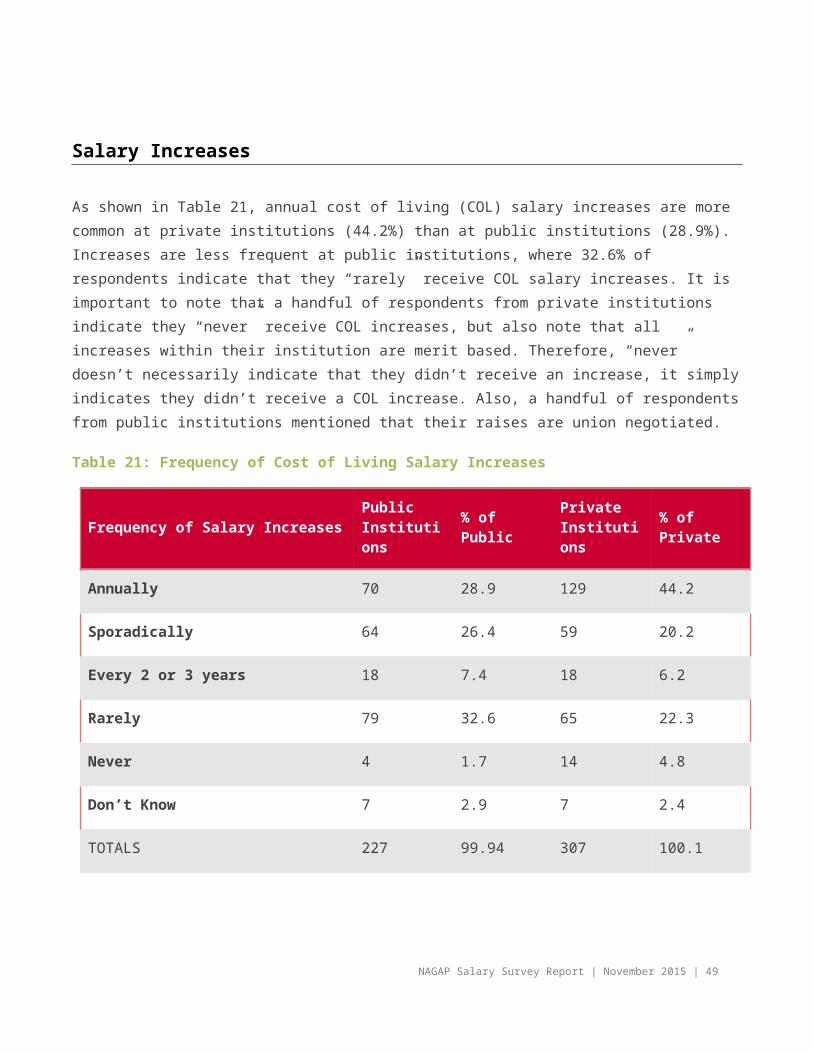
As shown in Table 21, annual cost of living (COL) salary increases are more common at private institutions (44.2%) than at public institutions (28.9%). Increases are less frequent at public institutions, where 32.6% of respondents indicate that they “rarely” receive COL salary increases. It is important to note that a handful of respondents from private institutions indicate they “never” receive COL increases, but also note that all increases within their institution are merit based. Therefore, “never” doesn’t necessarily indicate that they didn’t receive an increase, it simply indicates they didn’t receive a COL increase. Also, a handful of respondents from public institutions mentioned that their raises are union negotiated.
Table 21: Frequency of Cost of Living Salary Increases
Frequency of Salary Increases Public Institutions % of Public Private
Institutions % of Private
Annually 70 28.9 129 44.2
Sporadically 64 26.4 59 20.2
Every 2 or 3 years 18 7.4 18 6.2
Rarely 79 32.6 65 22.3
Never 4 1.7 14 4.8
Don’t Know 7 2.9 7 2.4
TOTALS 227 99.94 307 100.1
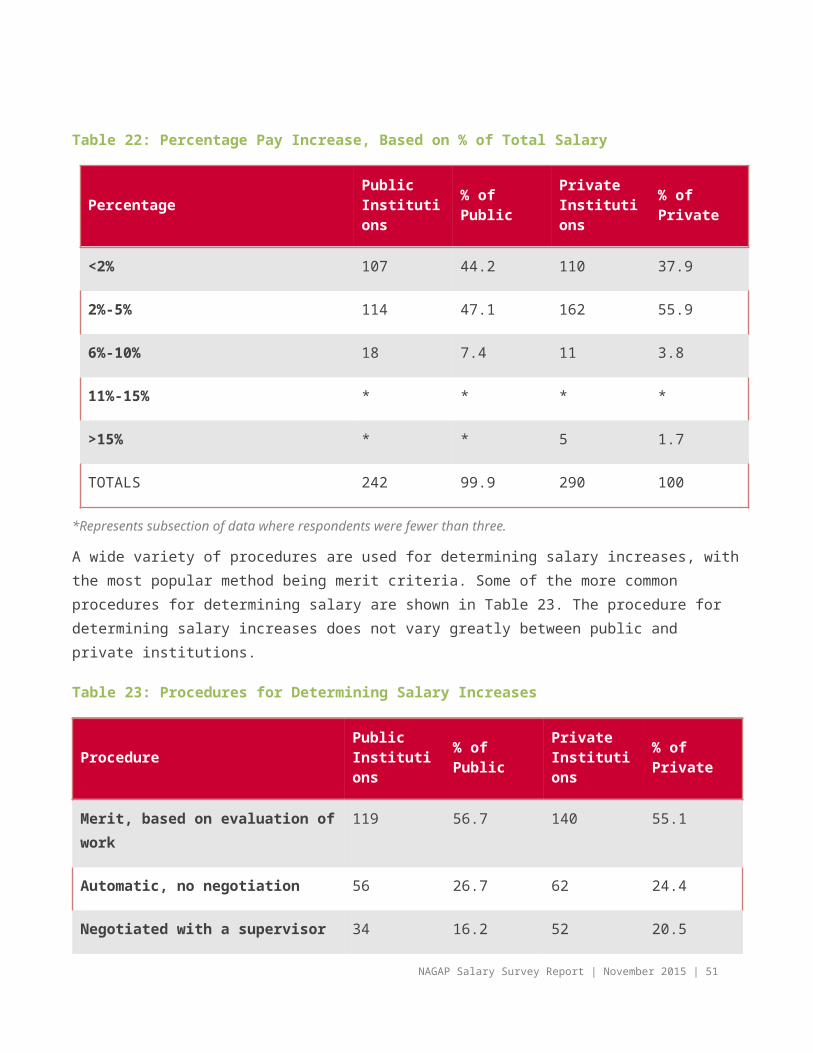
Table 22 shows the percentage of salary increase between public and private institutions. There is not a large differential in the percentage increases granted.
NAGAP Salary Survey Report | November 2015 | 36
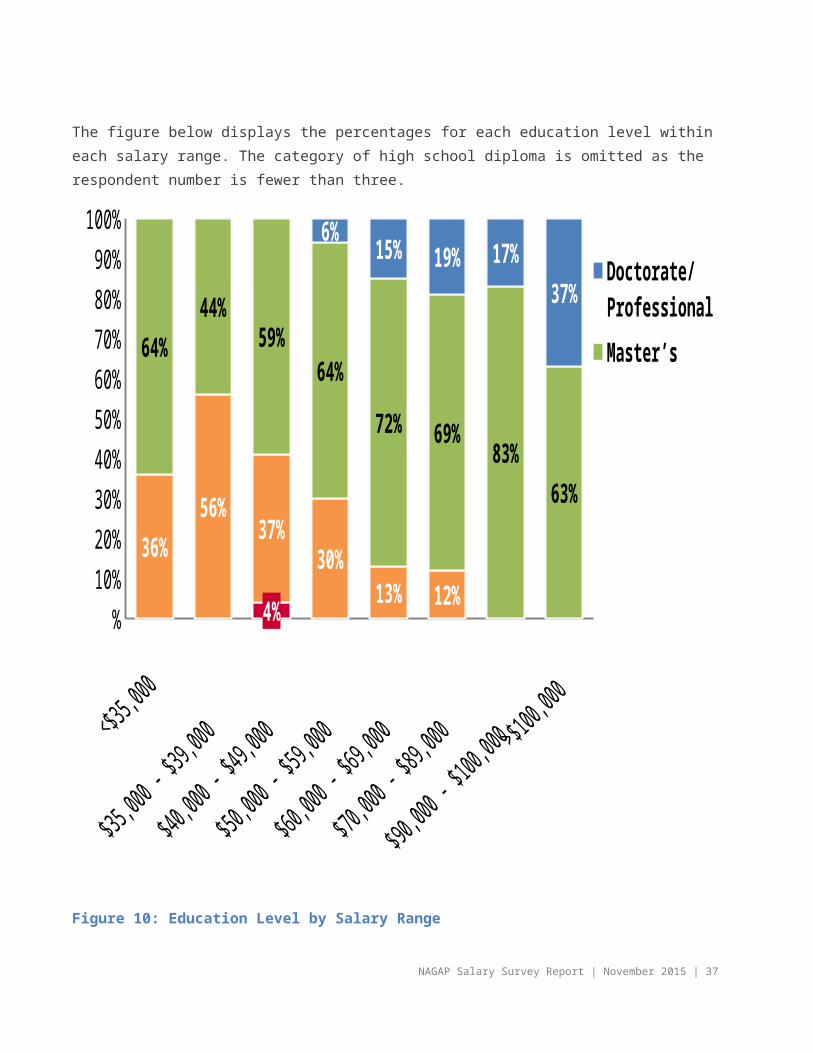
Table 22: Percentage Pay Increase, Based on % of Total Salary
Percentage Public Institutions % of Public Private
Institutions% of Private
<2% 107 44.2 110 37.9
2%-5% 114 47.1 162 55.9
6%-10% 18 7.4 11 3.8
11%-15% * * * *
>15% * * 5 1.7
TOTALS 242 99.9 290 100
*Represents subsection of data where respondents were fewer than three.
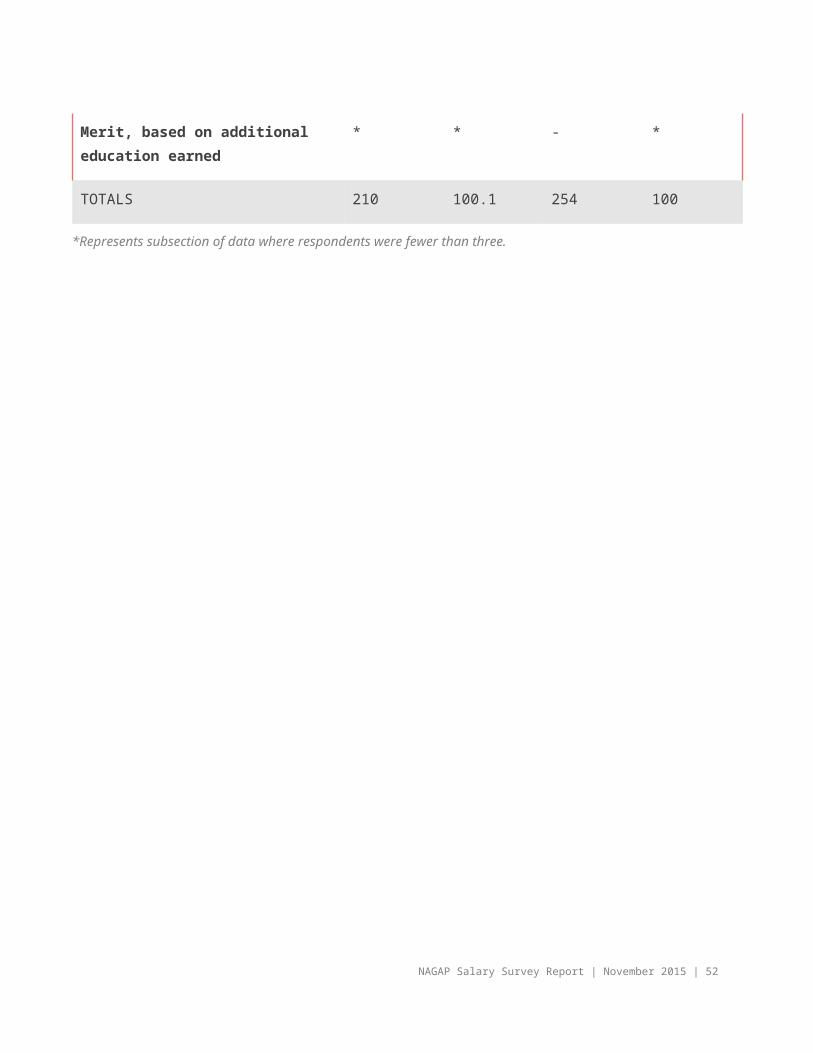
A wide variety of procedures are used for determining salary increases, with the most popular method being merit criteria. Some of the more common procedures for determining salary are shown in Table 23. The procedure for determining salary increases does not vary greatly between public and private institutions.
Table 23: Procedures for Determining Salary Increases
Procedure Public Institutions % of Public Private
Institutions% of Private
Merit, based on evaluation of work 119 56.7 140 55.1
Automatic, no negotiation 56 26.7 62 24.4
Negotiated with a supervisor 34 16.2 52 20.5
Merit, based on additional education earned
* * - *
TOTALS 210 100.1 254 100
*Represents subsection of data where respondents were fewer than three.
NAGAP Salary Survey Report | November 2015 | 37
Salary Freezes
Respondents were asked to comment on whether or not their salaries will be frozen for the upcoming year. The majority of respondents from both private & public institutions indicate that they did not know whether they will experience a salary freeze for the upcoming year. Most respondents who did know, seem to think that they will not be subject to a salary freeze, 27.8% of respondents from public institutions and 29.3% from private institutions. Table 24 gives total percentages by institution type.
Table 24: Salary Freezes by Institution Type for Upcoming Year
Salary Freezes for Upcoming Year
Public Institutions % of Public Private
Institutions % of Private
Yes 38 15.5 40 13.6
No 68 27.8 86 29.3
Unknown 139 56.7 168 57.1
TOTALS 245 100 294 100
At institutions where salary freezes have occurred, both public and private institutions indicate a salary freeze for a period of 2-4 years being the most common. See Table 25.
Table 25: Period of Salary Freeze by Institution Type
Timeframe Public Institutions % of Public Private
Institutions % of Private
1 year 24 30.8 24 33.3
2-4 years 32 41.0 31 43.1
3-5 years 14 17.9 10 13.9
5+ years 8 10.3 7 9.7
TOTALS 78 100 72 100
NAGAP Salary Survey Report | November 2015 | 38

JOB RESPONSIBILITIESChanging Responsibilities
Respondents were asked to indicate whether the responsibilities for their current position had increased, decreased or remained the same. The vast majority (85%) report an increase in responsibilities while only 1% report a decrease.
Figure 14: Responsibilities Since Hiring
85%
14%
1%
Responsibilities increased since hiringResponsibilities stayed same since hiringResponsibilties decreased since hiring
43 respondents left this question blank
The majority of reasons for increases in responsibility included:
changes in staffing/restructuring (e.g. staff cuts, reassignments, etc.)
voluntarily taking on more responsibility
increases in number of students/programs
promotions
taking on new areas of activity
NAGAP Salary Survey Report | November 2015 | 39
Division of Responsibilities
On average, respondents indicate the bulk of their time is spent on recruiting (26%) and admissions (33%). See Table 26: Responsibilities/Percent Time.
Table 26: Responsibilities/Percent Time
Responsibilities Percent Time
Recruiting 26%
Admissions 34%
Enrollment/Yield/Retention 15%
Financial Aid 5%
Academic Advising 6%
Academic Programming 5%
Student Services 11%
Other Responsibilities 17%
Percent time amounts to more than 100% because many respondents indicated multiple/overlapping responsibilities.
The “Other Responsibilities” category also have a significant number of responses (282). Answers include:
Diversity initiatives
Technology
Data
Supervision and other hr duties
Marketing
Faculty/staff training and support
Communication
Targeted outreach (alumni, veterans, etc.)
Event programming (orientation, commencement, etc.)
Budgeting
Policies/governance
Committee work
Conflict resolution
Statistical reporting
Website maintenance
NAGAP Salary Survey Report | November 2015 | 40
NAGAP Salary Survey Report | November 2015 | 41
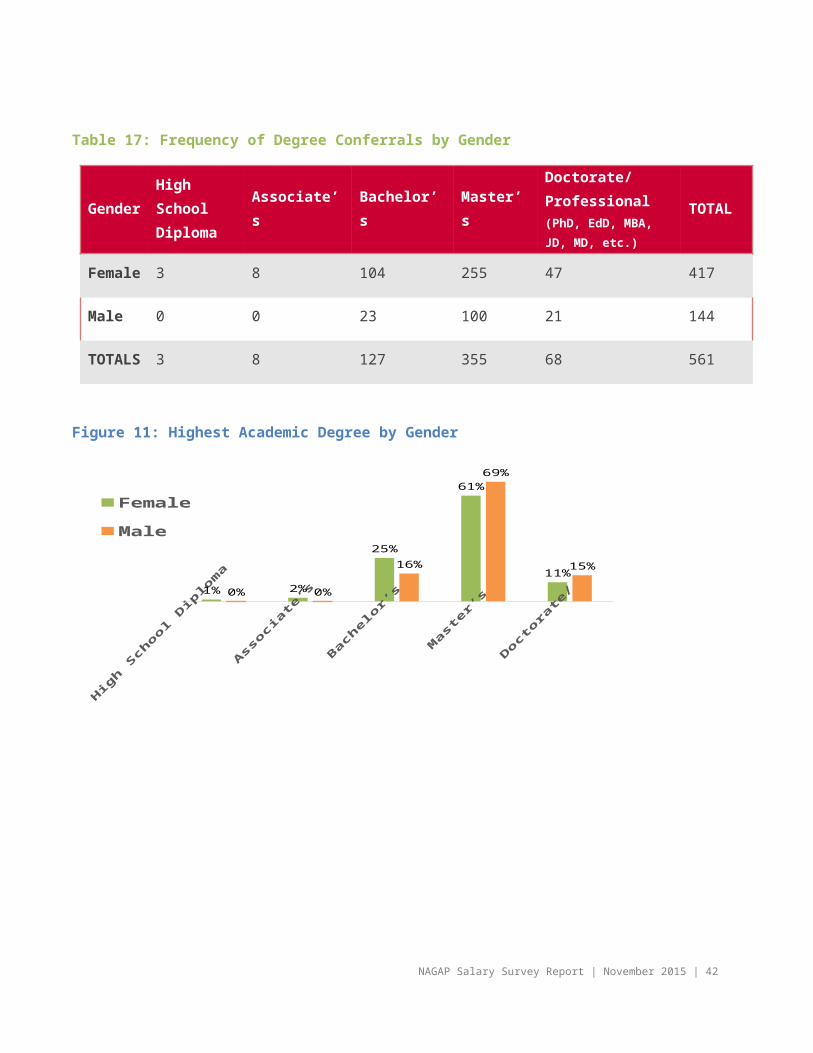
Table 27: GEM Related Duties by Job Title (as percentage of total responsibilities)
Job Title
Res
pons
eC
ount
Rec
ruiti
ng
Adm
issi
ons
Enro
llmen
t (Y
ield
/R
eten
tion)
Fina
ncia
l Aid
Aca
dem
ic A
dvis
ing
Aca
dem
ic
Prog
ram
min
g
Stud
ent
Serv
ices
Oth
er
Vice President 3 22% 25% 15% 13% 8% 5% 15% 40%
Associate VP 3 18% 22% 28% 8% 5% 8% 15% 8%
Assistant VP 3 27% 28% 25% 2% 5% 2% 7% 8%
Dean 5 25% 23% 22% 16% 3% 3% 8% 11%
Associate Dean 11 20% 33% 19% 5% 8% 11% 11% 19%
Assistant Dean 37 18% 25% 20% 7% 7% 7% 19% 19%
Director 175 27% 31% 16% 4% 5% 4% 10% 18%
Associate Director 62 24% 38% 15% 7% 6% 3% 7% 18%
Assistant Director 69 28% 36% 14% 6% 5% 4% 12% 11%
Coordinator 54 30% 35% 12% 5% 9% 7% 15% 20%
Associate Coordinator
2 30% 50% 10% 5% 5%
Assistant Coordinator
3 15% 38% 5% 8% 5% 3% 22% 10%
Admissions Officer 15 21% 48% 15% 4% 13% 0% 11% 5%
Admissions Counselor
32 30% 43% 14% 4% 4% 3% 2% 14%
Manager 25 23% 27% 9% 7% 8% 6% 10% 24%
Other 56 32% 33% 12% 4% 9% 4% 10% 18%
NAGAP Salary Survey Report | November 2015 | 42
Budget and Supervisory Responsibilities
Only 20% of respondents report having full budget authority in their positions, while 76% report either limited, or no budget authority. For those with full budget authority, ranges are listed in Table 28.
Table 28: Budget Authority by Range
Figure 15: Budget Authority
NAGAP Salary Survey Report | November 2015 | 43
Full budget authority20%
Limited budget author-ity
40%
No budget authority36%
No reply4%
Budget Amount
Full Authority
n %
Under $1,000 5 2%
$1,001-$10,000 34 11%
$10,001-$30,000 41 13%
$30,001-$50,000 36 12%
$50,001-$70,000 22 7%
$70,001-$100,000 21 7%
$100,001-$125,000 24 8%
$125,001-$150,000 16 5%
$150,001-$200,000 14 5%
$200,001-$300,000 22 7%
$300,001-$500,000 26 8%
$500,001 and Above 47 15%
264 respondents left this question blank
Supervision of Staff Members
More than 50% of respondents report supervising between 1-5 staff members while only 4% report supervising more than 10 staff members. 21 respondents left this question blank.
Figure 16: Supervision of Staff
NAGAP Salary Survey Report | November 2015 | 44
0 Staff31%
1 to 2 Staff32%
3 to 5 Staff20%
6 to 10 Staff13%
> 10 Staff4%
PROFESSIONAL DEVELOPMENTEvaluations
Nearly 90% of respondents indicate that their performance is evaluated on a regular basis.
WHO CONDUCTS PERFORMANCE EVALUATIONS? Most respondents (77%) report that only their supervisors conduct their evaluations. However, 17% are also involved with their own reviews - either working together with their supervisors or a combination of their supervisors and other staff/co-workers. A small percentage (4%) is evaluated by their supervisors and other staff/co-workers, while one respondent actually conducts his/her own evaluation.
Figure 17: Job Performance is Evaluated at Regular Intervals
Figure
18: Evaluation Responsibilities
NAGAP Salary Survey Report | November 2015 | 45
SELF ONLY
SUPERVISOR, SELF, and OTHERS
SUPERVISOR AND OTHERS
SUPERVISOR AND SELF
SUPERVISOR ONLY
1
18
20
82
376
Yes89%
No11%
Professional Development
Respondents were asked five questions about their professional development. While most report feeling underpaid for their performance level, the majority report overall job satisfaction and high levels of support from supervisors. Finally, most respondents indicate high levels of institutional engagement with professional development and having specific performance indicators for evaluation.
Figure 19: Professional Development, Question 1
Figure 20: Professional Development, Question 2
NAGAP Salary Survey Report | November 2015 | 46For each of these five questions, approximately 40 respondents left the question blank.
Completely Disagree
Somewhat Disagree
Neutral
Somewhat agree
Completely agree
38
54
91
191
158
"My institution takes professional development seriously."
Completely Disagree
Somewhat Disagree
Neutral
Somewhat agree
Completely agree
43
43
51
155
234
"My supervisor works with me to improve my performance and offers constructive suggestions when needed."
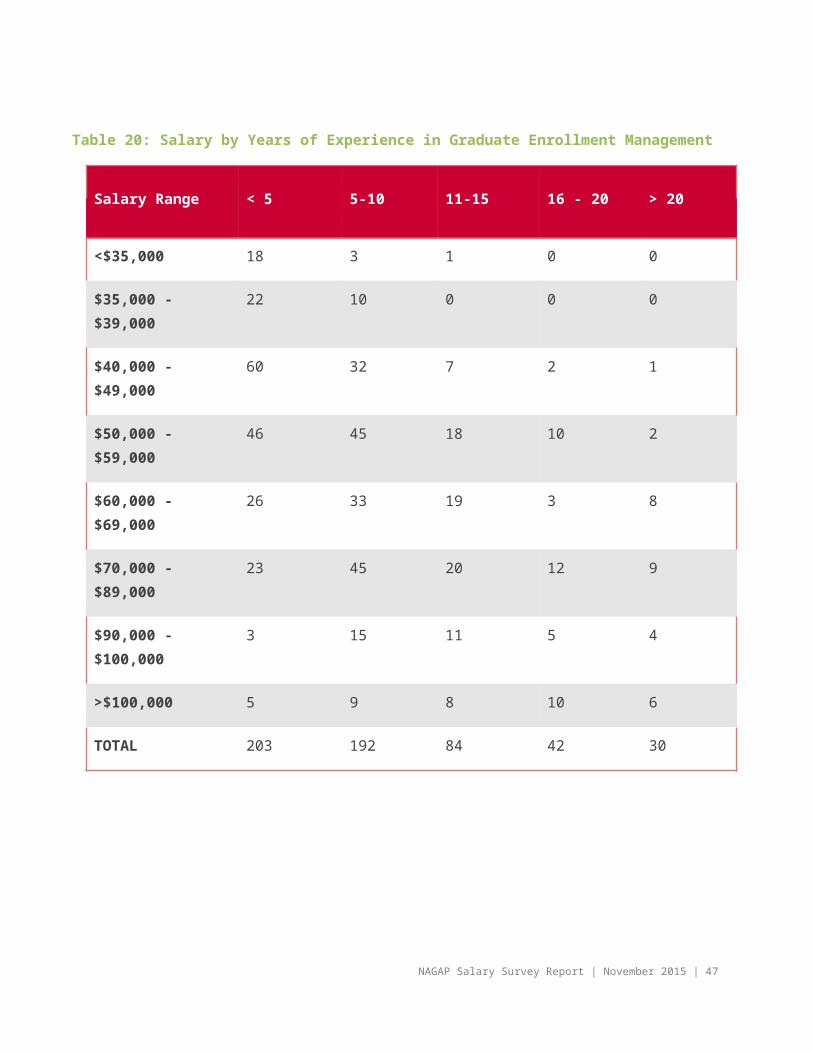
Figure 21: Professional Development, Question 3
Figure 22: Professional Development, Question 4
Figure 23: Professional Development, Question 5
NAGAP Salary Survey Report | November 2015 | 47
Completely Disagree
Somewhat Disagree
Neutral
Somewhat agree
Completely agree
145
127
78
120
58
"My salarly level matches my performance level."
Completely Disagree
Somewhat Disagree
Neutral
Somewhat agree
Completely agree
47
85
88
174
122
"I have specific performance metrics that I am evaluated against."
PROMOTION OPPORTUNITIES Survey respondents were asked to report how often they were upgraded in rank and/or administrative title while serving in graduate enrollment management functions.
While a quarter of respondents have received multiple promotions in their careers, more than 40% have never received a promotion.
51 respondents left this question blank
Figure 24: Promotion Opportunities
NAGAP Salary Survey Report | November 2015 | 48
Completely Disagree
Somewhat Disagree
Neutral
Somewhat agree
Completely agree
8
69
87
254
113
"Overall, I am satisfied with my job."
SUMMARYReview of the Findings
It was hypothesized that there is no difference in salary levels for international members of NAGAP in comparison to domestic NAGAP members. The results indicated that the hypothesis was accepted, there is not a significant relationship between salary range and whether the participant was an international or domestic NAGAP member
It was hypothesized that there is no significant difference in salary as a function of academic qualifications. There is a significant relationship between salary range and education level; therefore the null hypothesis was rejected, indicating there is a significant difference in salary ranges and education level. The data indicated that, in general, earning advanced credentials resulted in increased salary levels for NAGAP members.
It was hypothesized that there is no significant difference in salary based on age. There is a significant relationship between salary range and age of NAGAP members, with proportionally more older members in the higher salary ranges and proportionally more younger members in the lower salary ranges. These results correspond with the findings regarding the more years of experience in higher education or graduate enrollment management tending to constitute a higher salary. Taking these results together allow us to conclude that in general greater age and experience results in higher salaries.
It was hypothesized that there is no significant difference in salary based upon gender. The hypothesis was rejected; there is a significant relationship between salary range and gender. The results indicated that proportionally more women were in the lower salary range categories compared to males. Additionally, there were proportionally fewer women in the higher salary range categories in comparison to males.
It was hypothesized that there is no difference in salary for different racial/ ethnic groups. The hypothesis was accepted; there is not a significant relationship between salary range and racial/ ethnic self-identification.
NAGAP Salary Survey Report | November 2015 | 49
Never43%
Once31%
Twice14%
Three or four times11%
Five or more times1%

It was hypothesized that there is no significant difference in salary based on the number years employed in higher education. As mentioned previously, there is a significant relationship between salary range and years of experience in higher education.
SALARY AND INSTITUTIONAL CHARACTERISTICSThere was not a significant difference between salaries offered at private institutions and those at public institutions. The distribution of participants in each salary range for public and private institutions are nearly identical, indicating that the salary gap between employees at public institutions and their private college counterparts has continued to narrow over the last five years.
Institutions located in urban or suburban settings tend to offer higher salaries (the majority earning over $50,000) than their rural counterparts, where the majority earn in the $40,000-$49,000 salary range.
In general, salaries are positively related to the number of students enrolled in the participants’ program(s). NAGAP members who are responsible for more students tend to earn higher salaries.
SALARY AND DEMOGRAPHICSSurprisingly there is not a significant relationship between salary range and racial/ ethnic self-identification. This differs from last year’s findings, where Biracial, Asian, and Hawaiian/Pacific Islander professionals earned the highest annual salaries (between $57,500 and $60,000 annually), while Black and Hispanic professionals earned approximately the same ($51,900 and $51,300 respectively) and whites earn an average of $54,800 annually.
There is a significant relationship between salary range and gender, with proportionally more women in the lower salary range categories compared to males and proportionally fewer women in the higher salary range categories in comparison to males. Taken alone this could indicate salary disparity based on gender; however, coupled with the education data one could assume that fewer females are in the higher salary ranges as there are proportionally fewer females with masters and doctorate degrees in comparison to males.
SALARY AND LEVEL OF RESPONSIBILITYThe data obtained regarding academic qualifications and salary ranges supports the claim that, in general, earning advanced qualifications results in increased salary levels for NAGAP members. Additionally, the more experience participants had in higher education and specifically in graduate enrollment management tended to constitute higher salaries. This is not a surprising finding, as in general the hope is that the more experienced and educated a NAGAP member becomes, the more valuable that person would be to their institution, which in turn would result a higher salary. This also ties into the findings regarding age, in general there was a positive relationship between age and salary. This most likely is due to increased experience associated with age.
NAGAP Salary Survey Report | November 2015 | 50
There is a significant difference between salaries of full-time administrators who had a faculty appointment and those who were purely administrative. Proportionally more full-time administrators with a faculty appointments had higher salary ranges than administrative only respondents. This aligns with the education findings, as most appointed faculty members have a masters or doctoral degree. Therefore, it is no surprise that administrators who also hold a faculty appointment would tend to fall in the higher salary ranges.
Salary increases at public institutions are less frequent than those at private institutions. Increases are usually 2%-5% and based on merit. With regard to salary freezes, the vast majority of participants from both private and public institutions indicate they do not know whether there would be a salary freeze for the upcoming year. Of those who did know, the majority do not believe there would be a salary freeze, with only 15.5% of public institution employees and 13.5% of private institution employees indicating they expected a salary freeze for next year.
BROADENING RESPONSIBILITIESGraduate enrollment management professionals continue to increase their job responsibilities, with 85% of respondents indicating that the responsibilities for their current position increased since they were hired. Nevertheless, only a quarter of respondents report receiving multiple promotions in their careers and more than 40% state they have never received a promotion. This indicates that in general NAGAP members are being asked to do more with less. Not surprising, most report feeling underpaid for their performance level; however, the majority report overall job satisfaction and high levels of support from supervisors.
On average, irrespective of title, respondents indicate the bulk of their time is spent on recruiting (26%) and admissions (33%). While more 69% of respondents supervise at least one staff member, only 20% of respondents report having full budget authority in their positions and 76% report either limited, or no budget authority.
RECOMMENDATIONS Overall, the results from this survey illustrate that the GEM environment is one that requires professionals to do more with less. Responsibilities are increasing, whilst salaries are not increasing at the same rate. There are some demographic factors impacting salary that cannot necessarily be altered by a GEM professional; however, we have identified the following areas controlled by NAGAP members that may advance their careers and ultimately result in a higher salary:
Pursue a career at an institution with a large graduate student population;
Earn advanced degrees (master’s or doctoral degree);
Seek out positions with supervisory responsibilities;
Gain budgetary experience;
Work at an institution with the financial capacity to offer cost of living and merit increases
NAGAP Salary Survey Report | November 2015 | 51
Obtain a faculty appointment in addition administrative duties.
One factor often overlooked when discussing salaries, and arguably the most critical, is NAGAP members need to ask for a salary increase if they feel they deserve one. Many employees simply do not ask!
NAGAP Salary Survey Report | November 2015 | 52