2014 Full-year Results - legrand.com · Big data Fiber optics Wireless Internet of things Apps...
80
2014 Full-year Results February 12, 2015
Transcript of 2014 Full-year Results - legrand.com · Big data Fiber optics Wireless Internet of things Apps...

2014 Full-year Results February 12, 2015

AGENDA
2
HIGHLIGHTS
2014 RESULTS
GROUP DEVELOPMENT INITIATIVES ACTIVELY PURSUED
LASTING ROBUST FUNDAMENTALS
1
2
3
4
2015 TARGETS 5
APPENDICES 6

3
HIGHLIGHTS
1

4
1. Organic: at constant scope of consolidation and exchange rates
2. At 2013 scope of consolidation
3. Normalized free cash flow is based on a constant 10% ratio of total working capital requirement to sales, at constant scope of consolidation
and exchange rates
2014 results in line with targets; robust free cash flow generation
+0.5% organic(1) growth in sales vs 0% to 3% objective: target met
19.8% adjusted EBIT margin before acquisitions(2) vs 19.8% to 20.2% objective: target met
13.5% normalized(3) free cash flow to sales ratio
€1.10 proposed dividend, up +4.8% and corresponding to a 55% payout
Development initiatives actively pursued to create value over the long term
New industrial back office organization to support growth and enhance industrial performance
Shared technology roadmap to boost innovation
Front office initiatives to enhance growth profile
2014-2018 new CSR roadmap supporting strategy
HIGHLIGHTS
1
HIGHLIGHTS

5
2014 RESULTS
2

6 1. Organic: at constant scope of consolidation and exchange rates
External growth: +2.7%
Organic(1) growth: +0.5%
USA/Canada: +2.2%
New economies: +2.2%
Other mature countries: -1.7%
Exchange rates: -2.4%
Q4 2014 exchange-rate effect: +1.4%
Total growth: +0.9% (+2.9% in Q4 alone)
2014 CHANGE IN NET SALES
2
2014 RESULTS
+3.2%
2014
4,499
2013
4,460
€ millions

7
1. Organic: at constant scope of consolidation and exchange rates
2. All organic growth figures are full-year unless mentioned specifically
3. Organic growth was +1.7% in Q4 2013, compared with -5.1% at the end of the first nine months of 2013
4. Estimate
2014 ORGANIC(1) CHANGE IN NET SALES(2) BY GEOGRAPHICAL REGION (1/2)
2
2014 RESULTS
-3.3% organic(1) change in sales
Resilience of renovation market overall and
continued retreat of new construction market
Good performances in lighting control, Voice-
Data-Image solutions and assisted living
In particular, sales in Q4 alone, down -5.7%,
are in reality close to the yearly trend due to:
an unfavorable intra-annual basis for comparison
effect as already announced, now estimated at
around -7 points(3)
a favorable impact of strong demand from
distributors at the very end of the year of +5 points(4)
that will in turn have the reverse unfavorable effect
in Q1 2015
-4.1% organic(1) change in sales
8-point improvement vs -11.6% in 2013
generated as follows:
around 4 points from a slower decline in sell-out:
-3%(4) in 2014 vs -7%(4) in 2013
around 4 points from a reduction in distributor
destocking effect: 1point(4) in 2014 vs 5 points(4) in 2013
France Italy

8
2014 ORGANIC(1) CHANGE IN NET SALES(2) BY GEOGRAPHICAL REGION (2/2)
2
2014 RESULTS
+3.2% organic(1) growth
Healthy growth in
several mature countries such as
Germany, the Netherlands and
Spain
many new economies including
Hungary, Romania, the Czech
Republic, Slovakia and Turkey
Sales in Russia edged down
slightly over the year
+2.2% organic(1) growth
+7.0% organic(1) growth vs
2012: expansion of group
positions over two years
Good performances in wiring
devices, Voice-Data-Image
solutions and building systems
Residential activity continues to
do well
Positive performance of Legrand
in the commercial market
In 2015, the US should become
the group’s #1 country by
sales(3)
+2.0% organic(1) growth
Healthy growth in new
economies
in Asia, such as in India and
Malaysia
in Africa / Middle East, such as
in Egypt and South Africa
Sales in Latin America overall
edged down slightly
USA/Canada Rest of the World Rest of Europe
1. Organic: at constant scope of consolidation and exchange rates
2. All organic growth figures are full-year unless mentioned specifically
3. On the basis of USA 2014 sales valued with the EUR/USD exchange rate as at February 11, 2015

9
ADJUSTED(1) OPERATING MARGIN
2
1. Operating income adjusted for amortization of revaluation of intangible assets at the time of acquisitions and for expense/income relating to acquisitions
(€32.9 million in 2013 and 2014) and, where applicable, for impairment of goodwill (€0 in 2013 and 2014)
2. At 2013 scope of consolidation
2014 RESULTS
2013 adjusted operating margin
19.8%
Ongoing efforts to improve productivity
Active and differentiated country management
Ongoing cost adaptation where needed
Investment in growth initiatives
Reduction in inventory of manufactured goods
2014 adjusted operating margin before acquisitions(2) 19.8%
Impact of acquisitions
-0.2pt
2014 adjusted operating margin 19.6%
Balanced
management
and control
of margin

10
PERFORMANCE IN LINE WITH 2014 TARGETS
2
2014 RESULTS
Metrics
Organic(1) growth
Adjusted EBIT
margin before
acquisitions(2)
X
November 2014
Targets maintained
Lower end targeted
low end of the
range
low end of the
range
2014
Achievements
+0.5%
19.8%
X
February 2014
Targets announced
between 19.8%
and 20.2% of
sales
0% to +3%
1. Organic: at constant scope of consolidation and exchange rates
2. At 2013 scope of consolidation

11
2014 NET INCOME EXCLUDING MINORITIES
2
2014 RESULTS
Robust operating performance
Financing costs under control
(<2% of sales)
Tax rate ~ 31%
€532m 11.8% of sales

12
2014 FREE CASH FLOW GENERATION
2
2014 RESULTS
Robust cash flow from operations
16.2% of sales (vs 16.1% in 2013)
Good conversion of operating performance
Tight management of working capital
requirement
8.2% of sales (better than the 10% threshold)
In particular, reduction in manufactured goods
inventory
Capex under control
2.8% of sales
Close to 50% of capex dedicated to new
products
Strong normalized(1)
free cash flow:
• 13.5% of sales
• +3.2% vs 2013
• 114% conversion(2) of net
income
1. Normalized free cash flow is based on a constant 10% ratio of total working capital requirement to sales, at constant scope of consolidation and
exchange rates
2. Conversion of net income = normalized free cash flow divided by net income excluding minorities

13
6-year gross debt maturity
Single A credit rating(1) in line with
other leading electrical players
ROBUST BALANCE SHEET
2
2014 RESULTS
1. S&P rating: A-, stable outlook
Resources available
for investment in
growth and
dividend

14
2014 DIVIDEND PROPOSAL
2
2014 RESULTS
1.10 (1)
1.05 2.3%
Dividend per share in € % yield Based on January 30, 2015 closing price
55%
Pay-out(2)
2013 2014
1. Subject to the approval of shareholders at the General Meeting on May 29, 2015 and payable on June 4, 2015
2. Corresponds to proposed dividend per share divided by 2014 earnings per share calculated on the basis of the average number of
ordinary shares excluding shares held in treasury on December 31, 2014
+4.8%

15
“VALUE CREATION” SINCE IPO(1)
2
2014 RESULTS
1. April 2006
2. Including a 2014 dividend of €1.10 per share subject to the approval of shareholders at the General Meeting on May 29, 2015 payable on June 4, 2015
3. Total Shareholder Return, dividend being reinvested in shares
Dividend per share Earnings per share TSR(3)
+10%(2) (2006-2014 CAGR)
+9% (2006-2014 CAGR)
+14% per year (from April 6, 2006 to Jan 30, 2015)

16
GROUP DEVELOPMENT
INITIATIVES
ACTIVELY PURSUED
3

17
3 GROUP
DEVELOPMENT
INITIATIVES
ACTIVELY
PURSUED
2003-2008 2009-2013 From 2014
Reshaping Legrand
Pursue growth profile and performance enhancement during crisis
Next steps

18
Industrial back-office activities under a single management
Boosting innovation through a shared technology roadmap
Enhancing Legrand’s growth profile
New CSR 2014-2018 roadmap
GROUP DEVELOPMENT INITIATIVES ACTIVELY PURSUED
3 GROUP
DEVELOPMENT
INITIATIVES
ACTIVELY
PURSUED

19
Industrial back-office activities under a single
management
Boosting innovation through a shared technology roadmap
Enhancing Legrand’s growth profile
New CSR 2014-2018 roadmap
GROUP DEVELOPMENT INITIATIVES ACTIVELY PURSUED
3 GROUP
DEVELOPMENT
INITIATIVES
ACTIVELY
PURSUED

20
INDUSTRIAL BACK-OFFICE ACTIVITIES
UNDER A SINGLE MANAGEMENT (1/3)
3 GROUP
DEVELOPMENT
INITIATIVES
ACTIVELY
PURSUED
• 6-year gross debt maturity
• [0.8 Net debt / EBITDA ratio]
• Single A credit rating(1) in line with electrical peers [(2)]
Strengthen focus on strategic businesses to drive growth
Implementation of 7 Strategic Business Units in charge of R&D and production
Enhance productivity
Set up of a Group Operations Performance department
Improve supply-chain and purchasing efficiency
Supply chain and purchasing brought under the industrial back-office management
3 priorities

21
INDUSTRIAL BACK-OFFICE ACTIVITIES
UNDER A SINGLE MANAGEMENT (2/3)
3 GROUP
DEVELOPMENT
INITIATIVES
ACTIVELY
PURSUED
• 6-year gross debt maturity
• [0.8 Net debt / EBITDA ratio]
• Single A credit rating(1) in line with electrical peers [(2)]
Wiring devices: sample of product ranges added to platforms in 2014
Other product families
Main achievements in 2014 – Product platform
VDI cabinet
Valena Allure WS 120 E Refresh Synergy Valena life
Trunking Emergency lighting

22
INDUSTRIAL BACK-OFFICE ACTIVITIES
UNDER A SINGLE MANAGEMENT (3/3)
3 GROUP
DEVELOPMENT
INITIATIVES
ACTIVELY
PURSUED
• 6-year gross debt maturity
• [0.8 Net debt / EBITDA ratio]
• Single A credit rating(1) in line with electrical peers [(2)]
Main achievements in 2014 – Deployment of industrial best practices
1. At comparable structure
Group inventory to sales
2006-2008 2010-2013 2014 2016-2020
~15% ~14% 13.7%(1) ~12%(1)
Indirect labor / Direct labor
2009 2013 2014 2016-2020
0.46 0.34 0.33(1) ~0.30(1)

23
Industrial back-office activities under a single management
Boosting innovation through a shared technology
roadmap
Enhancing Legrand’s growth profile
New CSR 2014-2018 roadmap
GROUP DEVELOPMENT INITIATIVES ACTIVELY PURSUED
3 GROUP
DEVELOPMENT
INITIATIVES
ACTIVELY
PURSUED

24
BOOSTING INNOVATION THROUGH
A SHARED TECHNOLOGY ROADMAP (1/3)
3 GROUP
DEVELOPMENT
INITIATIVES
ACTIVELY
PURSUED
2 consequences for Legrand More and enriched infrastructures in building, both existing and new
Infrastructures become smarter and connected
SOCIAL MEGATRENDS
Data communication
Energy saving
Security
Aging
Eco friendly
Other
TECHNOLOGY MEGATRENDS
Big data
Fiber optics
Wireless
Internet of things
Apps
Measurement
Sensors

25
BOOSTING INNOVATION THROUGH
A SHARED TECHNOLOGY ROADMAP (2/3)
3 GROUP
DEVELOPMENT
INITIATIVES
ACTIVELY
PURSUED
Simple
Easy for installer
Ready to service
Friendly for end users
Legrand’s objective Organize infrastructures, products, functions through interoperability
Open
Wired and wireless
solutions
Able to communicate
with different protocols:
KNX, BACNET,
ZIGBEE, SCS, etc.
Competitive
Modular approach
Productivity for
installers, facility
managers, end users
and Legrand

26
3
BOOSTING INNOVATION THROUGH
A SHARED TECHNOLOGY ROADMAP (3/3)
Case study: sample of connected objects recently launched
RGB light control command(1) Scenario control command(1) Smart Eco-meter Drivia home cabinet
1. Successfully presented at the 2015 Las Vegas Consumer Electronics Show
GROUP
DEVELOPMENT
INITIATIVES
ACTIVELY
PURSUED
Many functions can already be performed by Legrand’s connected devices
Color control of light
bulbs
Home systems Energy consumption
management
IP-enabled
intelligent cabinet

27
Industrial back-office activities under a single management
Boosting innovation through a shared technology roadmap
Enhancing Legrand’s growth profile
New CSR 2014-2018 roadmap
GROUP DEVELOPMENT INITIATIVES ACTIVELY PURSUED
3 GROUP
DEVELOPMENT
INITIATIVES
ACTIVELY
PURSUED

28
ENHANCING LEGRAND’S GROWTH PROFILE (1/4)
3 GROUP
DEVELOPMENT
INITIATIVES
ACTIVELY
PURSUED
• 6-year gross debt maturity
• [0.8 Net debt / EBITDA ratio]
• Single A credit rating(1) in line with electrical peers [(2)]
Expanding positions
+7% organic(1) growth in the USA/Canada zone over 2 years
Increasing positions in new activities, for example in Audio-video or IT through the acquisition
of Lastar
Opening of new offices in 2014
Increasing product coverage and growing faster in new business
segments
81 product families in 2014 (vs 78 in 2013)
29% of group sales recorded in new business segments in 2014 (vs 26% in 2013)
Leveraging web and end-user intimacy
18% of digital in marketing expenses in 2014
74% of sales covered with CRM
1. Organic: at constant scope of consolidation and exchange rates
2014 main achievements

29
ENHANCING LEGRAND’S GROWTH PROFILE (2/4)
3 GROUP
DEVELOPMENT
INITIATIVES
ACTIVELY
PURSUED
Focus on North America
Performance over 10 years
2014 sales 2014 Adj. EBIT
margin
$1.1bn 16.7% x1.7 vs 2004 X1.9 vs 2004
Leadership positions
#1 Cable management
#1 Audio-video (A/V) enclosures
#1 Energy-efficient lighting control
#1 Pre-terminated solutions for VDI and A/V
networks
#1 Structured cabling for residential
buildings
USA #1 country(1)
in terms of sales in 2015
1. Based on USA 2014 sales valued with the EUR/USD exchange rate as at February 11, 2015

30
ENHANCING LEGRAND’S GROWTH PROFILE (3/4)
3 GROUP
DEVELOPMENT
INITIATIVES
ACTIVELY
PURSUED
• 6-year gross debt maturity
• [0.8 Net debt / EBITDA ratio]
• Single A credit rating(1) in line with electrical peers [(2)]
US frontrunner in pre-terminated
solutions for Voice-Data-Image
and Audio/Video networks
Spain’s leader in assisted living
and a major player in this market
Europe-wide
Singaporean frontrunner in racks,
Voice-Data-Image cabinets and
related products for data centers
Acquisitions: 3 deals closed in 2014

31
ENHANCING LEGRAND’S GROWTH PROFILE (4/4)
3 GROUP
DEVELOPMENT
INITIATIVES
ACTIVELY
PURSUED
Leveraging Megapower’s leading position
in Malaysia to support wiring devices and
energy distribution deployment
Mutualization of purchasing and technology
development among the 3 assisted-living
businesses recently acquired
Leveraging Daneva’s leading position in the
Brazilian retail market to support the
deployment of eco-modular circuit breakers
Leveraging Adlec’s position in India to
tackle infrastructure projects
Leveraging datacom in North America by
pooling businesses together
Acquisitions: sample of recent value creative achievements

32
Industrial back-office activities under a single management
Boosting innovation through a shared technology roadmap
Enhancing Legrand’s growth profile
New CSR 2014-2018 roadmap
GROUP DEVELOPMENT INITIATIVES ACTIVELY PURSUED
3 GROUP
DEVELOPMENT
INITIATIVES
ACTIVELY
PURSUED

33
NEW 2014-2018 CSR ROADMAP (1/2)
3 GROUP
DEVELOPMENT
INITIATIVES
ACTIVELY
PURSUED
4 Axes – 21 priorities over
5 years
More staff involved
Stronger commitment of
managers

34
NEW 2014-2018 CSR ROADMAP (2/2)
3 GROUP
DEVELOPMENT
INITIATIVES
ACTIVELY
PURSUED
123% average achievement
rate vs end of 2014
objectives
0% 50% 100% 150% 200%
USERS
SOCIETY
EMPLOYEES
ENVIRONMENT
2014 objectives achievement rate

35
LASTING
ROBUST FUNDAMENTALS
4

36
BALANCED GEOGRAPHICAL EXPOSURE
4
LASTING
ROBUST
FUNDAMENTALS
% of group sales in From
2009
To
2014
New economies 28% 38%(1) In line with weight of new
economies in world GDP
USA/Canada 14% 19% +2pts from 2013
Other mature countries
58%
43%
-15pts over 5 years
1. Close to 40% excluding FX impact

37
-1%
1%
3%
5%
7%
-20 0 20 40 60 80 100 120 140 160 180
DIVERSIFIED AND FRAGMENTED GEOGRAPHICAL PRESENCE IN NEW
ECONOMIES
4
LASTING
ROBUST
FUNDAMENTALS
Africa/Middle-East
Sales in more than 120 new economies
Asia Europe Latin America
% of group sales
1%
3%
5%

38
BALANCED END MARKET EXPOSURE
4
LASTING
ROBUST
FUNDAMENTALS
Breakdown of sales by end markets
(1) Non residential
Commercial
Administration
Education
Healthcare
Hospitality
Office
Other
(2) Residential
Single-family home
Multi-family home (3) Industry
Automobile
Food processing
Other(1)
1. Of which Oil and Gas < 1%
Residential(2) 44%
Non residential(1) 49%
Industrial(3) 7%
Renovation 50%
New build 50%

39
STRONG LEADERSHIPS
4
LASTING
ROBUST
FUNDAMENTALS
% of sales with
products #1 or #2 on their markets
# of countries with
at least a #1 or a #2 position
62%
68%
2008 2014
35
45
2008 2014

40
2015 TARGETS
5

41
2015 TARGETS
5
2015 TARGETS
Macroeconomic projections currently call for:
a continued supportive environment in the United States;
attractive prospects in new economies, which nonetheless present short-term uncertainties, particularly
in Russia;
and conditions on our markets in mature Europe which should remain difficult overall in 2015.
Against this backdrop and in an industry with no order book, Legrand, whose sales face
a demanding basis for comparison in the first quarter of 2015, is targeting 2015 organic
growth in sales of between -3% and +2%(1).
The group has also set a 2015 target for adjusted operating margin before
acquisitions(2) at between 18.8% and 20.1% of sales, which is consistent with its target
for organic growth and the ongoing effects of its productivity efforts.
Legrand will also pursue its strategy of value-creating acquisitions.
1. The low-end of the target includes a marked drop in sales in Russia. Excluding Russia, the 2015 target of organic growth in sales for the group is between -2% and +2%
2. At 2014 scope of consolidation

42
1. Organic: at constant scope of consolidation and exchange rates
2. At 2013 scope of consolidation
3. Normalized free cash flow is based on a constant 10% ratio of total working capital requirement to sales, at constant scope of consolidation
and exchange rates
2014 results in line with targets; robust free cash flow generation
+0.5% organic(1) growth in sales vs 0% to 3% objective: target met
19.8% adjusted EBIT margin before acquisitions(2) vs 19.8% to 20.2% objective: target met
13.5% normalized(3) free cash flow to sales ratio
€1.10 proposed dividend, up +4.8% and corresponding to a 55% payout
Development initiatives actively pursued to create value over the long term
New industrial back office organization to support growth and enhance industrial performance
Shared technology roadmap to boost innovation
Front office initiatives to enhance growth profile
2014-2018 new CSR roadmap supporting strategy
2015 targets
KEY TAKE AWAYS
5
2015 TARGETS

43
APPENDICES
6

44
FRANCE – ANALYSIS OF Q4 2014 SALES TRENDS AND OF CARRY OVER
EFFECT IN Q1 2015
6
APPENDICES
Organic growth Q4 2014 Q1 2015
Reported
of which :
-5.7%
Basis for
comparison ~ -7 pts(1)
Over sell-in in Q4 2014(2) +5 pts ~-5 pts
Organic growth adjusted for
basis for comparison and
over sell-in
-3.7%
1. Q4 2013 at +1.7% vs 9M 2013 at -5.1%
2. Driven by higher demand from distributors at the very end of the year. Estimate

45
No impact on operating profit on a full year-basis
Impact on year-on-year analysis of quarterly operating profit of France only and thus
same impact at group level
Main unfavorable impact in Q1 2015 fading progressively over the course of 2015:
Quarterly impact on operating profit in €M (estimated figures)
Q1 2015 Q2 2015 Q3 2015 Q4 2015
-6.8 +2.3 +2.3 +2.2
IFRIC 21(1) APPLIED IN 2015
6
APPENDICES
Year-to-date impact on operating profit in €M (estimated figures)
Q1 2015 H1 2015 9M 2015 FY 2015
-6.8 -4.5 -2.2 0
1. Please refer to note 2.1.4 of 2014 consolidated financial statements

46
ACQUISITIONS LASTAR INC.
6
APPENDICES
US frontrunner in pre-terminated solutions for
Voice-Data-Image and Audio/Video networks
Around $130m annual sales, of which 95% in the US
Strong brand awareness and access to specialized
distribution in the US (VDI, IT, web)
Around 1,000 employees in total
Ideal fit with Legrand’s US offering in
structured VDI cabling with its
Ortronics brand
Strengthens Legrand’s positions in
VDI and A/V markets in the US and
in growing verticals such as data
centers

47
ACQUISITIONS NEAT(1)
6
APPENDICES
Spain’s leader in assisted living and a major player in
this market Europe-wide
Annual revenues of over €15 million
90 employees
Ideal complement to Legrand’s
existing offer in assisted living Makes Legrand Europe’s #2 in this
field
1. Joint Venture

48
ACQUISITIONS SJ MANUFACTURING
6
APPENDICES
Singaporean frontrunner in racks, Voice-Data-Image
cabinets and related products for data centers
Annual revenues of nearly €10 million
130 employees
Ideal complement in South-East Asia
to Legrand’s existing offer for data
centers
Strengthens Legrand’s positions in
digital infrastructures

49
PERFORMANCES DRIVEN BY ROBUST PROCESSES LINKING
COUNTRIES AND GROUP
Ongoing responsiveness and adaptation
6
APPENDICES
KPIs Processes People & Compensation
Market shares
Annual budget Strategic review
FPC based on multi scenarios
Long-term incentive plan Aligned with strategic objectives
Economic Income(1)/NEPAT(2)
targets through a Financial
Performance Contract (FPC) Sales growth
Profitability
Capital employed
Quarterly performance review Budget scenario update based on macro trends
(up or down)
FPC monitoring vs latest validated scenario
Monthly reporting FPC monitoring vs latest validated scenario
Short-term bonus plan
Aligned with FPC
1. Economic Income = adjusted operating profit less cost of capital employed
2. Net Economic Profit After Tax = Economic Income after tax

50
FINANCIAL PERFORMANCE MANAGEMENT
ACHIEVEMENTS
6
APPENDICES
As % of sales (rounded figures) 1992-2002
average
2003-2008
average
2009-2013
average 2014
Adjusted operating margin 14% 16% 19% 19.6%
Capex 8% 4% 3% 2.8%(1)
Working capital requirement 21% 13% ≤10% 8.2%
Free cash flow 6% 11% 13%(2) 13.5%(2)
1. Expected to fluctuate between 3% to 3.5%
2. On a normalized basis with working capital requirement representing 10% of the last 12 months’ sales, and whose change is at constant scope of
consolidation and exchange rates

51
4,460.4 4,499.1
-31.0 -19.7 27.2 18.6
29.9 -108.8 122.5
CHANGE IN NET SALES
6
1. Organic: at constant scope of consolidation and exchange rates
2. Due to the consolidation of Seico, S2S, Adlec, Tynetec, Lastar, Neat and SJ Manufacturing
APPENDICES
Breakdown of change in 2014 net sales by destination (€m)
France Italy Rest of
Europe
Rest of
the World
USA-
Canada
-2.4%
FX
+2.7%(2)
Scope of
consolidation
+0.5%
Organic(1) growth
+0.9%
Total

52
2014 – NET SALES BY DESTINATION(1)
6
APPENDICES
1. Market where sales are recorded
In € millions 2013 2014 Total
Change
Scope of
Consolidation
Like-for-Like
Growth Currency Effect
France 935.2 911.3 -2.6% 0.8% -3.3% 0.0%
Italy 482.2 462.5 -4.1% 0.0% -4.1% 0.0%
Rest of Europe 818.3 825.4 0.9% 3.1% 3.2% -5.2%
USA/Canada 758.6 853.1 12.5% 9.9% 2.2% 0.1%
Rest of the World 1,466.1 1,446.8 -1.3% 1.0% 2.0% -4.3%
Total 4,460.4 4,499.1 0.9% 2.7% 0.5% -2.4%

53
2014 FIRST QUARTER – NET SALES BY DESTINATION(1)
6
APPENDICES
1. Market where sales are recorded
In € millions Q1 2013 Q1 2014 Total
Change
Scope of
Consolidation
Like-for-Like
Growth Currency Effect
France 241.7 242.4 0.3% 2.3% -1.9% 0.0%
Italy 142.0 132.6 -6.6% 0.0% -6.6% 0.0%
Rest of Europe 191.7 203.3 6.1% 2.4% 11.1% -6.8%
USA/Canada 181.6 178.7 -1.6% 0.2% 1.9% -3.7%
Rest of the World 335.9 327.3 -2.6% 5.8% 3.0% -10.6%
Total 1,092.9 1,084.3 -0.8% 2.7% 2.0% -5.3%

54
2014 SECOND QUARTER – NET SALES BY DESTINATION(1)
6
1. Market where sales are recorded
APPENDICES
In € millions Q2 2013 Q2 2014 Total
Change
Scope of
Consolidation
Like-for-Like
Growth Currency Effect
France 240.1 239.2 -0.4% 1.8% -2.1% 0.0%
Italy 128.4 122.6 -4.5% -0.1% -4.5% 0.0%
Rest of Europe 202.5 198.2 -2.1% 2.2% 1.3% -5.4%
USA/Canada 203.9 219.7 7.7% 12.9% 0.2% -4.7%
Rest of the World 386.2 360.6 -6.6% -1.9% 4.2% -8.7%
Total 1,161.1 1,140.3 -1.8% 2.4% 0.7% -4.7%

55
2014 THIRD QUARTER – NET SALES BY DESTINATION(1)
6
1. Market where sales are recorded
APPENDICES
In € millions Q3 2013 Q3 2014 Total
Change
Scope of
Consolidation
Like-for-Like
Growth Currency Effect
France 204.1 201.1 -1.5% 2.1% -3.5% 0.0%
Italy 104.1 101.0 -3.0% 0.0% -3.0% 0.0%
Rest of Europe 202.5 209.1 3.3% 6.5% -0.2% -2.8%
USA/Canada 198.2 228.6 15.3% 13.4% 2.0% -0.2%
Rest of the World 355.7 359.5 1.1% 0.8% 0.7% -0.4%
Total 1,064.6 1,099.3 3.3% 4.4% -0.3% -0.7%

56
2014 FOURTH QUARTER – NET SALES BY DESTINATION(1)
6
1. Market where sales are recorded
APPENDICES
In € millions Q4 2013 Q4 2014 Total
Change
Scope of
Consolidation
Like-for-Like
Growth Currency Effect
France 249.4 228.6 -8.3% -2.8% -5.7% 0.0%
Italy 107.8 106.3 -1.4% 0.0% -1.4% 0.0%
Rest of Europe 221.5 214.8 -3.0% 1.4% 1.4% -5.7%
USA/Canada 174.9 226.1 29.3% 12.7% 5.2% 9.0%
Rest of the World 388.2 399.4 2.9% 0.1% 0.2% 2.6%
Total 1,141.8 1,175.2 2.9% 1.6% -0.1% 1.4%

57
2014 – NET SALES BY ORIGIN(1)
6
1. Zone of origin of the product sold
APPENDICES
In € millions 2013 2014 Total
Change
Scope of
Consolidation
Like-for-Like
Growth Currency Effect
France 1,053.9 1,033.0 -2.0% 0.7% -2.7% 0.0%
Italy 522.5 499.6 -4.4% 0.0% -4.4% 0.0%
Rest of Europe 800.1 809.5 1.2% 2.8% 4.1% -5.4%
USA/Canada 773.3 874.5 13.1% 10.1% 2.6% 0.1%
Rest of the World 1,310.6 1,282.5 -2.1% 1.1% 1.6% -4.7%
Total 4,460.4 4,499.1 0.9% 2.7% 0.5% -2.4%

58
2014 FIRST QUARTER – NET SALES BY ORIGIN(1)
6
1. Zone of origin of the product sold
APPENDICES
In € millions Q1 2013 Q1 2014 Total
Change
Scope of
Consolidation
Like-for-Like
Growth Currency Effect
France 268.7 270.7 0.7% 2.3% -1.5% 0.0%
Italy 151.7 143.4 -5.5% 0.0% -5.5% 0.0%
Rest of Europe 187.5 199.1 6.2% 2.7% 11.4% -7.2%
USA/Canada 185.0 181.9 -1.7% 0.0% 2.0% -3.7%
Rest of the World 300.0 289.2 -3.6% 6.3% 2.7% -11.7%
Total 1,092.9 1,084.3 -0.8% 2.7% 2.0% -5.3%

59
2014 SECOND QUARTER – NET SALES BY ORIGIN(1)
6
1. Zone of origin of the product sold
APPENDICES
In € millions Q2 2013 Q2 2014 Total
Change
Scope of
Consolidation
Like-for-Like
Growth Currency Effect
France 271.2 268.7 -0.9% 1.7% -2.6% 0.0%
Italy 137.4 133.1 -3.1% 0.0% -3.1% 0.0%
Rest of Europe 197.3 193.9 -1.7% 1.7% 2.4% -5.6%
USA/Canada 207.5 225.7 8.8% 13.1% 0.9% -4.7%
Rest of the World 347.7 318.9 -8.3% -2.3% 3.7% -9.5%
Total 1,161.1 1,140.3 -1.8% 2.4% 0.7% -4.7%
60
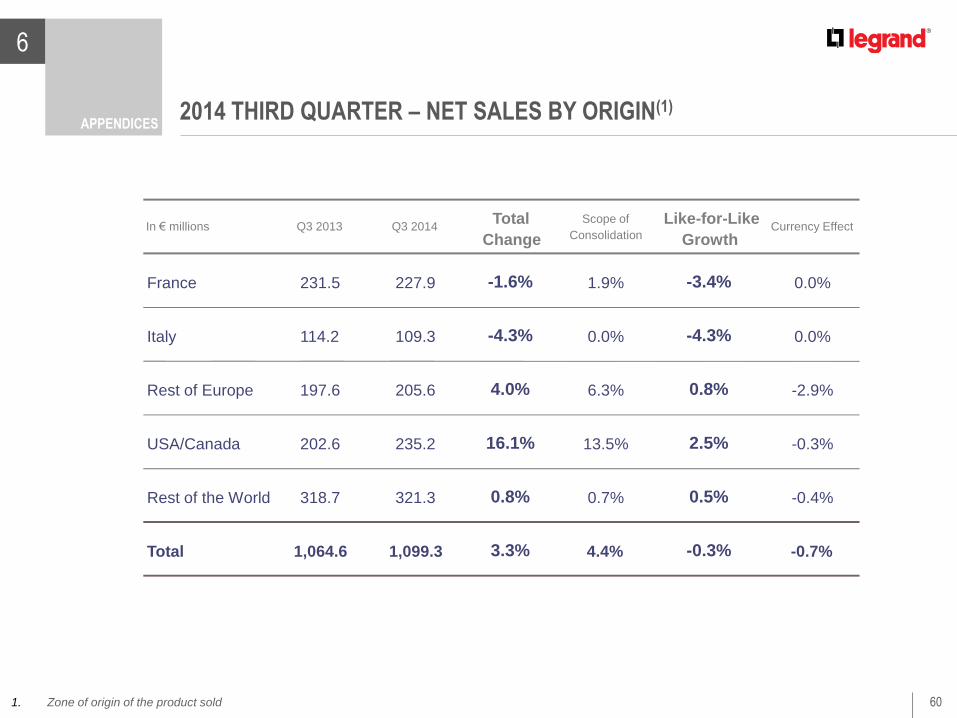
2014 THIRD QUARTER – NET SALES BY ORIGIN(1)
6
1. Zone of origin of the product sold
APPENDICES
In € millions Q3 2013 Q3 2014 Total
Change
Scope of
Consolidation
Like-for-Like
Growth Currency Effect
France 231.5 227.9 -1.6% 1.9% -3.4% 0.0%
Italy 114.2 109.3 -4.3% 0.0% -4.3% 0.0%
Rest of Europe 197.6 205.6 4.0% 6.3% 0.8% -2.9%
USA/Canada 202.6 235.2 16.1% 13.5% 2.5% -0.3%
Rest of the World 318.7 321.3 0.8% 0.7% 0.5% -0.4%
Total 1,064.6 1,099.3 3.3% 4.4% -0.3% -0.7%

61
2014 FOURTH QUARTER – NET SALES BY ORIGIN(1)
6
1. Zone of origin of the product sold
APPENDICES
In € millions Q4 2013 Q4 2014 Total
Change
Scope of
Consolidation
Like-for-Like
Growth Currency Effect
France 282.5 265.7 -5.9% -2.5% -3.5% 0.0%
Italy 119.2 113.8 -4.5% 0.1% -4.6% 0.0%
Rest of Europe 217.7 210.9 -3.1% 0.7% 2.3% -5.9%
USA/Canada 178.2 231.7 30.0% 13.3% 5.2% 9.1%
Rest of the World 344.2 353.1 2.6% 0.2% -0.5% 2.9%
Total 1,141.8 1,175.2 2.9% 1.6% -0.1% 1.4%

62
2014 – P&L
6
1. Operating income adjusted for amortization of revaluation of intangible assets at the time of acquisitions and for
expense/income, relating to acquisitions (€32.9 million in 2013 and 2014) and, where applicable, for impairment of
goodwill (€0 in 2013 and 2014)
2. 19.8% excluding acquisitions (at 2013 scope of consolidation)
APPENDICES
(2)
(1)
In € millions 2013 2014 % change
Net sales 4,460.4 4,499.1 +0.9%
Gross profit 2,303.8 2,301.9 -0.1%
as % of sales 51.7% 51.2%
Adjusted operating profit 882.3 880.4 -0.2%
as % of sales 19.8% 19.6% Amortization and expense/income related to acquisitions (32.9) (32.9)
Operating profit 849.4 847.5 -0.2%
as % of sales 19.0% 18.8%
Financial income (costs) (80.8) (77.3)
Exchange gains (losses) (1.8) 1.5
Income-tax expense (233.5) (238.4)
Profit 533.3 533.3
Profit excluding minority interests 530.5 531.7 +0.2%

63
2014 FIRST QUARTER – P&L
6
1. Operating income adjusted for amortization of revaluation of intangible assets at the time of acquisitions and for
expense/income, relating to acquisitions (€7.5 million in Q1 2013 and €8.0 million in Q1 2014) and, where applicable, for
impairment of goodwill (€0 in Q1 2013 and Q1 2014)
2. 20.4% excluding acquisitions (at 2013 scope of consolidation)
APPENDICES
In € millions Q1 2013 Q1 2014 % change
Net sales 1,092.9 1,084.3 -0.8%
Gross profit 567.4 566.7 -0.1%
as % of sales 51.9% 52.3%
Adjusted 216.1 218.9 +1.3%
as % of sales 19.8% 20.2% Amortization and expense/income related to acquisitions (7.5) (8.0)
Operating profit 208.6 210.9 +1.1%
as % of sales 19.1% 19.5%
Financial income (costs) (19.8) (18.7)
Exchange gains (losses) (3.9) (0.5)
Income-tax expense (60.1) (61.5)
Profit 124.8 130.2 +4.3%
Profit excluding minority interests 124.5 129.5 +4.0%
(1)
(2)
operating profit

64
2014 SECOND QUARTER – P&L
6
1. Operating income adjusted for amortization of revaluation of intangible assets at the time of acquisitions and for
expense/income, relating to acquisitions (€7.9 million in Q2 2013 and €8.9 million in Q2 2014) and, where applicable, for
impairment of goodwill (€0 in Q2 2013 and Q2 2014)
2. 20.9% excluding acquisitions (at 2013 scope of consolidation)
APPENDICES
In € millions Q2 2013 Q2 2014 % change
Net sales 1,161.1 1,140.3 -1.8%
Gross profit 608.1 587.4 -3.4%
as % of sales 52.4% 51.5%
Adjusted operating profit 241.4 234.4 -2.9%
as % of sales 20.8% 20.6% Amortization and expense/income related to acquisitions (7.9) (8.9)
Operating profit 233.5 225.5 -3.4%
as % of sales 20.1% 19.8%
Financial income (costs) (19.8) (19.4)
Exchange gains (losses) (2.2) 0.4
Income-tax expense (65.1) (64.1)
Profit 146.4 142.4 -2.7%
Profit excluding minority interests 145.3 142.0 -2.3%
(1)
(2)

65
2014 THIRD QUARTER – P&L
6
1. Operating income adjusted for amortization of revaluation of intangible assets at the time of acquisitions and for
expense/income, relating to acquisitions (€7.6 million in Q3 2013 and €8.3 million in Q3 2014) and, where applicable, for
impairment of goodwill (€0 in Q3 2013 and Q3 2014)
2. 19.4% excluding acquisitions (at 2013 scope of consolidation)
APPENDICES
(1)
(2)
In € millions Q3 2013 Q3 2014 % change
Net sales 1,064.6 1,099.3 +3.3%
Gross profit 546.7 558.5 +2.2%
as % of sales 51.4% 50.8%
Adjusted operating profit 212.5 209.9 -1.2%
as % of sales 20.0% 19.1% Amortization and expense/income related to acquisitions (7.6) (8.3)
Operating profit 204.9 201.6 -1.6%
as % of sales 19.2% 18.3%
Financial income (costs) (19.7) (19.6)
Exchange gains (losses) 4.0 1.5
Income-tax expense (56.3) (56.7)
Profit 132.9 126.8 -4.6%
Profit excluding minority interests 132.3 126.8 -4.2%

66
2014 FOURTH QUARTER – P&L
6
1. Operating income adjusted for amortization of revaluation of intangible assets at the time of acquisitions and for
expense/income, relating to acquisitions (€9.9 million in Q4 2013 and €7.7million in Q4 2014) and, where applicable, for
impairment of goodwill (€0 in Q4 2013 and Q4 2014)
2. 18.6% excluding acquisitions (at 2013 scope of consolidation)
APPENDICES
(1)
(2)
In € millions Q4 2013 Q4 2014 % change
Net sales 1,141.8 1,175.2 +2.9%
Gross profit 581.6 589.3 +1.3%
as % of sales 50.9% 50.1%
Adjusted operating profit 212.3 217.2 +2.3%
as % of sales 18.6% 18.5% Amortization and expense/income related to acquisitions (9.9) (7.7)
Operating profit 202.4 209.5 +3.5%
as % of sales 17.7% 17.8%
Financial income (costs) (21.5) (19.6)
Exchange gains (losses) 0.3 0.1
Income-tax expense (52.0) (56.1)
Profit 129.2 133.9 +3.6%
Profit excluding minority interests 128.4 133.4 +3.9%

67
2014
(in € millions)France Italy
Rest of
Europe
USA/
Canada
Rest of
the WorldTotal
Net sales 1,033.0 499.6 809.5 874.5 1,282.5 4,499.1
Cost of sales (385.7) (182.8) (458.7) (434.9) (735.1) (2,197.2)
Administrative and selling expenses, R&D costs (398.3) (160.3) (205.9) (298.8) (344.3) (1,407.6)
Reversal of acquisition-related amortization, expense and income
accounted for in administrative and selling expenses, R&D costs(3.7) 0.0 (2.8) (12.1) (14.3) (32.9)
Adjusted operating profit before other
operating income (expense)252.7 156.5 147.7 152.9 217.4 927.2
as % of sales 24.5% 31.3% 18.2% 17.5% 17.0% 20.6%
Other operating income (expense) (3.4) (0.4) (12.6) (6.6) (23.8) (46.8)
Reversal of acquisition-related amortization, expense and income
accounted for in other operating income (expense)0.0 0.0 0.0 0.0 0.0 0.0
Adjusted operating profit 249.3 156.1 135.1 146.3 193.6 880.4
as % of sales 24.1% 31.2% 16.7% 16.7% 15.1% 19.6%
2014 – ADJUSTED OPERATING PROFIT BEFORE AND AFTER OTHER OPERATING INCOME (EXPENSE) BY GEOGRAPHICAL REGION
6
1. Restructuring (€21.7m) and other miscellaneous items (€25.1m)
APPENDICES
(1)

68
2013
(in € millions)France Italy
Rest of
Europe
USA/
Canada
Rest of
the WorldTotal
Net sales 1,053.9 522.5 800.1 773.3 1,310.6 4,460.4
Cost of sales (391.2) (184.0) (465.7) (378.8) (736.9) (2,156.6)
Administrative and selling expenses, R&D costs (403.2) (163.8) (200.2) (269.2) (345.8) (1,382.2)
Reversal of acquisition-related amortization, expense and income
accounted for in administrative and selling expenses, R&D costs(6.0) 0.0 (2.6) (10.7) (13.6) (32.9)
Adjusted operating profit before other
operating income (expense)265.5 174.7 136.8 136.0 241.5 954.5
as % of sales 25.2% 33.4% 17.1% 17.6% 18.4% 21.4%
Other operating income (expense) (14.3) (5.6) (4.4) (13.6) (34.3) (72.2)
Reversal of acquisition-related amortization, expense and income
accounted for in other operating income (expense)0.0 0.0 0.0 0.0 0.0 0.0
Adjusted operating profit 251.2 169.1 132.4 122.4 207.2 882.3
as % of sales 23.8% 32.4% 16.5% 15.8% 15.8% 19.8%
2013 – ADJUSTED OPERATING PROFIT BEFORE AND AFTER OTHER OPERATING INCOME (EXPENSE) BY GEOGRAPHICAL REGION
6
1. Restructuring (€29.3m) and other miscellaneous items (€42.9m)
APPENDICES
(1)

69
Q1 2014
(in € millions)France Italy
Rest of
Europe
USA/
Canada
Rest of
the WorldTotal
Net sales 270.7 143.4 199.1 181.9 289.2 1,084.3
Cost of sales (96.8) (50.4) (111.9) (92.1) (166.4) (517.6)
Administrative and selling expenses, R&D costs (106.8) (42.1) (48.9) (64.5) (80.6) (342.9)
Reversal of acquisition-related amortization, expense and income
accounted for in administrative and selling expenses, R&D costs(1.7) 0.0 (0.6) (2.6) (3.1) (8.0)
Adjusted operating profit before other
operating income (expense)68.8 50.9 38.9 27.9 45.3 231.8
as % of sales 25.4% 35.5% 19.5% 15.3% 15.7% 21.4%
Other operating income (expense) (5.0) 0.5 (2.3) (0.9) (5.2) (12.9)
Reversal of acquisition-related amortization, expense and income
accounted for in other operating income (expense)0.0 0.0 0.0 0.0 0.0 0.0
Adjusted operating profit 63.8 51.4 36.6 27.0 40.1 218.9
as % of sales 23.6% 35.8% 18.4% 14.8% 13.9% 20.2%
2014 FIRST QUARTER – ADJUSTED OPERATING PROFIT BEFORE AND AFTER OTHER OPERATING INCOME (EXPENSE) BY GEOGRAPHICAL REGION
6
1. Restructuring (€4.0m) and other miscellaneous items (€8.9m)
APPENDICES
(1)

70
2013 FIRST QUARTER – ADJUSTED OPERATING PROFIT BEFORE AND AFTER OTHER OPERATING INCOME (EXPENSE) BY GEOGRAPHICAL REGION
6
1. Restructuring (€3.9m) and other miscellaneous items (€6.4m)
APPENDICES
Q1 2013
(in € millions)France Italy
Rest of
Europe
USA/
Canada
Rest of
the WorldTotal
Net sales 268.7 151.7 187.5 185.0 300.0 1,092.9
Cost of sales (97.8) (54.3) (108.9) (93.3) (171.2) (525.5)
Administrative and selling expenses, R&D costs (104.4) (44.6) (50.7) (65.6) (83.2) (348.5)
Reversal of acquisition-related amortization, expense and income
accounted for in administrative and selling expenses, R&D costs(0.9) 0.0 (0.9) (2.4) (3.3) (7.5)
Adjusted operating profit before other
operating income (expense)67.4 52.8 28.8 28.5 48.9 226.4
as % of sales 25.1% 34.8% 15.4% 15.4% 16.3% 20.7%
Other operating income (expense) (4.5) 0.2 (1.6) (0.4) (4.0) (10.3)
Reversal of acquisition-related amortization, expense and income
accounted for in other operating income (expense)0.0 0.0 0.0 0.0 0.0 0.0
Adjusted operating profit 62.9 53.0 27.2 28.1 44.9 216.1
as % of sales 23.4% 34.9% 14.5% 15.2% 15.0% 19.8%
(1)

71
Q2 2014
(in € millions)France Italy
Rest of
Europe
USA/
Canada
Rest of
the WorldTotal
Net sales 268.7 133.1 193.9 225.7 318.9 1,140.3
Cost of sales (97.3) (49.5) (111.3) (110.7) (184.1) (552.9)
Administrative and selling expenses, R&D costs (101.0) (41.0) (50.8) (75.5) (86.6) (354.9)
Reversal of acquisition-related amortization, expense and income
accounted for in administrative and selling expenses, R&D costs(1.5) 0.0 (0.7) (2.8) (3.9) (8.9)
Adjusted operating profit before other
operating income (expense)71.9 42.6 32.5 42.3 52.1 241.4
as % of sales 26.8% 32.0% 16.8% 18.7% 16.3% 21.2%
Other operating income (expense) 3.0 (0.8) (2.6) (3.1) (3.5) (7.0)
Reversal of acquisition-related amortization, expense and income
accounted for in other operating income (expense)0.0 0.0 0.0 0.0 0.0 0.0
Adjusted operating profit 74.9 41.8 29.9 39.2 48.6 234.4
as % of sales 27.9% 31.4% 15.4% 17.4% 15.2% 20.6%
2014 SECOND QUARTER – ADJUSTED OPERATING PROFIT BEFORE AND AFTER OTHER OPERATING INCOME (EXPENSE) BY GEOGRAPHICAL REGION
6
1. Restructuring (€6.9m) and other miscellaneous items (€0.1m)
APPENDICES
(1)

72
Q2 2013
(in € millions)France Italy
Rest of
Europe
USA/
Canada
Rest of
the WorldTotal
Net sales 271.2 137.4 197.3 207.5 347.7 1,161.1
Cost of sales (97.4) (46.2) (114.0) (101.7) (193.7) (553.0)
Administrative and selling expenses, R&D costs (101.1) (42.0) (49.8) (69.1) (91.0) (353.0)
Reversal of acquisition-related amortization, expense and income
accounted for in administrative and selling expenses, R&D costs(1.4) 0.0 (0.5) (2.6) (3.4) (7.9)
Adjusted operating profit before other
operating income (expense)74.1 49.2 34.0 39.3 66.4 263.0
as % of sales 27.3% 35.8% 17.2% 18.9% 19.1% 22.7%
Other operating income (expense) (3.8) (3.0) (1.7) (6.3) (6.8) (21.6)
Reversal of acquisition-related amortization, expense and income
accounted for in other operating income (expense)0.0 0.0 0.0 0.0 0.0 0.0
Adjusted operating profit 70.3 46.2 32.3 33.0 59.6 241.4
as % of sales 25.9% 33.6% 16.4% 15.9% 17.1% 20.8%
2013 SECOND QUARTER – ADJUSTED OPERATING PROFIT BEFORE AND AFTER OTHER OPERATING INCOME (EXPENSE) BY GEOGRAPHICAL REGION
6
1. Restructuring (€5.0m) and other miscellaneous items (€16.6m)
APPENDICES
(1)

73
Q3 2014
(in € millions)France Italy
Rest of
Europe
USA/
Canada
Rest of
the WorldTotal
Net sales 227.9 109.3 205.6 235.2 321.3 1,099.3
Cost of sales (85.3) (41.2) (115.3) (117.4) (181.6) (540.8)
Administrative and selling expenses, R&D costs (88.4) (37.3) (54.0) (77.8) (88.2) (345.7)
Reversal of acquisition-related amortization, expense and income
accounted for in administrative and selling expenses, R&D costs(1.4) 0.0 (0.7) (2.5) (3.7) (8.3)
Adjusted operating profit before other
operating income (expense)55.6 30.8 37.0 42.5 55.2 221.1
as % of sales 24.4% 28.2% 18.0% 18.1% 17.2% 20.1%
Other operating income (expense) (2.5) 0.8 (1.0) (2.3) (6.2) (11.2)
Reversal of acquisition-related amortization, expense and income
accounted for in other operating income (expense)0.0 0.0 0.0 0.0 0.0 0.0
Adjusted operating profit 53.1 31.6 36.0 40.2 49.0 209.9
as % of sales 23.3% 28.9% 17.5% 17.1% 15.3% 19.1%
2014 THIRD QUARTER – ADJUSTED OPERATING PROFIT BEFORE AND AFTER OTHER OPERATING INCOME (EXPENSE) BY GEOGRAPHICAL REGION
6
1. Restructuring (€5.2m) and other miscellaneous items (€6.0m)
APPENDICES
(1)

74
Q3 2013
(in € millions)France Italy
Rest of
Europe
USA/
Canada
Rest of
the WorldTotal
Net sales 231.5 114.2 197.6 202.6 318.7 1,064.6
Cost of sales (85.4) (40.0) (115.5) (100.2) (176.8) (517.9)
Administrative and selling expenses, R&D costs (90.4) (37.4) (48.6) (68.8) (83.5) (328.7)
Reversal of acquisition-related amortization, expense and income
accounted for in administrative and selling expenses, R&D costs(1.1) 0.0 (0.7) (2.6) (3.2) (7.6)
Adjusted operating profit before other
operating income (expense)56.8 36.8 34.2 36.2 61.6 225.6
as % of sales 24.5% 32.2% 17.3% 17.9% 19.3% 21.2%
Other operating income (expense) 4.8 (0.1) (1.7) (3.0) (13.1) (13.1)
Reversal of acquisition-related amortization, expense and income
accounted for in other operating income (expense)0.0 0.0 0.0 0.0 0.0 0.0
Adjusted operating profit 61.6 36.7 32.5 33.2 48.5 212.5
as % of sales 26.6% 32.1% 16.4% 16.4% 15.2% 20.0%
2013 THIRD QUARTER – ADJUSTED OPERATING PROFIT BEFORE AND AFTER OTHER OPERATING INCOME (EXPENSE) BY GEOGRAPHICAL REGION
6
1. Restructuring (€8.3m) and other miscellaneous items (€4.8m)
APPENDICES
(1)

75
Q4 2014
(in € millions)France Italy
Rest of
Europe
USA/
Canada
Rest of
the WorldTotal
Net sales 265.7 113.8 210.9 231.7 353.1 1,175.2
Cost of sales (106.3) (41.7) (120.2) (114.7) (203.0) (585.9)
Administrative and selling expenses, R&D costs (102.1) (39.9) (52.2) (81.0) (88.9) (364.1)
Reversal of acquisition-related amortization, expense and income
accounted for in administrative and selling expenses, R&D costs0.9 0.0 (0.8) (4.2) (3.6) (7.7)
Adjusted operating profit before other
operating income (expense)56.4 32.2 39.3 40.2 64.8 232.9
as % of sales 21.2% 28.3% 18.6% 17.4% 18.4% 19.8%
Other operating income (expense) 1.1 (0.9) (6.7) (0.3) (8.9) (15.7)
Reversal of acquisition-related amortization, expense and income
accounted for in other operating income (expense)0.0 0.0 0.0 0.0 0.0 0.0
Adjusted operating profit 57.5 31.3 32.6 39.9 55.9 217.2
as % of sales 21.6% 27.5% 15.5% 17.2% 15.8% 18.5%
2014 FOURTH QUARTER – ADJUSTED OPERATING PROFIT BEFORE AND AFTER OTHER OPERATING INCOME (EXPENSE) BY GEOGRAPHICAL REGION
6
1. Restructuring (€5.6m) and other miscellaneous items (€10.1m)
APPENDICES
(1)

76
Q4 2013
(in € millions)France Italy
Rest of
Europe
USA/
Canada
Rest of
the WorldTotal
Net sales 282.5 119.2 217.7 178.2 344.2 1,141.8
Cost of sales (110.6) (43.5) (127.3) (83.6) (195.2) (560.2)
Administrative and selling expenses, R&D costs (107.3) (39.8) (51.1) (65.7) (88.1) (352.0)
Reversal of acquisition-related amortization, expense and income
accounted for in administrative and selling expenses, R&D costs(2.6) 0.0 (0.5) (3.1) (3.7) (9.9)
Adjusted operating profit before other
operating income (expense)67.2 35.9 39.8 32.0 64.6 239.5
as % of sales 23.8% 30.1% 18.3% 18.0% 18.8% 21.0%
Other operating income (expense) (10.8) (2.7) 0.6 (3.9) (10.4) (27.2)
Reversal of acquisition-related amortization, expense and income
accounted for in other operating income (expense)0.0 0.0 0.0 0.0 0.0 0.0
Adjusted operating profit 56.4 33.2 40.4 28.1 54.2 212.3
as % of sales 20.0% 27.9% 18.6% 15.8% 15.7% 18.6%
2013 FOURTH QUARTER – ADJUSTED OPERATING PROFIT BEFORE AND AFTER OTHER OPERATING INCOME (EXPENSE) BY GEOGRAPHICAL REGION
6
1. Restructuring (€12.1m) and other miscellaneous items (€15.1m)
APPENDICES
(1)

77
2014 – RECONCILIATION OF CASH FLOW FROM OPERATIONS WITH
PROFIT
6
APPENDICES
In € millions 2013 2014
Profit 533.3 533.3
Depreciation & amortization 170.3 167.6
Change in other non-current assets and liabilities and deferred tax 21.2 15.4
Exchange (gains)/losses net (4.9) 11.9
(Gains)/losses on sales of assets, net (0.5) 0.0
Other Adjustments 0.4 0.5
Cash flow from operations 719.8 728.7

78
2014 – RECONCILIATION OF FREE CASH FLOW AND NORMALIZED FREE
CASH FLOW WITH CASH FLOW FROM OPERATIONS
6
1. Cash flow from operations is defined as the sum of net cash from operating activities and change in working capital requirement.
2. Based on a constant 10% ratio of total working capital requirement to sales, at constant scope of consolidation and exchange rates
APPENDICES
In € millions 2013 2014 % change
Cash flow from operations (1) 719.8 728.7 1.2%
as % of sales 16.1% 16.2%
Change in working capital requirement (27.9) (2.3)
Net cash provided by operating activities 691.9 726.4 5.0%
as % of sales 15.5% 16.1%
Capital expenditures (including capitalized R&D) (133.0) (125.3)
Net proceeds of sales of fixed assets 4.3 6.3
Free cash flow 563.2 607.4 7.8%
as % of sales 12.6% 13.5%
Change in working capital requirement (27.9) (2.3)
Change in normalized working capital requirement (2.3) (2.2)
Normalized (2)
free cash flow 588.8 607.5
as % of sales 13.2% 13.5%

79
SCOPE OF CONSOLIDATION
6
APPENDICES
2014 Q1 H1 9M FY
Daneva 3 months 6 months 9 months 12 months
Seico 3 months 6 months 9 months 12 months
S2S 3 months 6 months 9 months 12 months
Adlec 3 months 6 months 9 months 12 months
Tynetec 3 months 6 months 9 months 12 months
Lastar Balance sheet only 3 months 6 months 9 months
Neat Balance sheet only Balance sheet only 7 months 10 months
SJ Manufacturing Balance sheet only Balance sheet only 7 months
2013 Q1 H1 9M FY
Daneva Balance sheet only 6 months 9 months 12 months
Seico Balance sheet only 5 months 8 months 11 months
S2S Balance sheet only Balance sheet only 8 months
Adlec Balance sheet only 5 months
Tynetec Balance sheet only 5 months

80
DISCLAIMER
The information contained in this presentation has not been independently verified and no representation or warranty expressed or implied is made as to, and no reliance should be placed on, the fairness, accuracy, completeness or correctness of the information or opinions contained herein.
This presentation contains information about Legrand’s markets and its competitive position therein. Legrand is not aware of any authoritative industry or market reports that cover or address its market. Legrand assembles information on its markets through its subsidiaries, which in turn compile information on its local markets annually from formal and informal contacts with industry professionals, electrical-product distributors, building statistics, and macroeconomic data. Legrand estimates its position in its markets based on market data referred to above and on its actual sales in the relevant market for the same period.
This document may contain estimates and/or forward-looking statements. Such statements do not constitute forecasts regarding Legrand’s results or any other performance indicator, but rather trends or targets, as the case may be. These statements are by their nature subject to risks and uncertainties, many of which are outside Legrand’s control, including, but not limited to the risks described in Legrand’s reference document available on its Internet website (www.legrand.com). These statements do not reflect future performance of Legrand, which may materially differ. Legrand does not undertake to provide updates of these statements to reflect events that occur or circumstances that arise after the date of this document.
This document does not constitute an offer to sell, or a solicitation of an offer to buy Legrand shares in any jurisdiction.