2014-2015 Oil Crash
44
End in Sight The Twin Oil Crashes of 2014-2015 Nawar Alsaadi December 2015
-
Upload
nawar-alsaadi -
Category
Business
-
view
554 -
download
0
Transcript of 2014-2015 Oil Crash

End in Sight The Twin Oil Crashes of 2014-2015
Nawar Alsaadi
December 2015
What caused the 2014 oil crash?
High oil prices 2010-2014Record CAPEX (2010-2014)
Shale oil gusherSlowing global oil demand growth
Increasing Supply-Demand imbalanceOPEC change of strategy in late 2014

High prices
• Conventional oil resources scarcity, mid-east instability, a weak dollar along with an urbanizing emerging world created a sustained period of almost uninterrupted rise in oil prices and especially so from 2010 to 2014:
From 2010 to 2014 Brent averaged $102 per barrel

CAPEX• Sustained high prices combined
with advancement in technology lead to record capex spending on global conventional and unconventional oil resources:
• North America lead the growth in O&G capex spending between 2010 and 2014:
N.A. World Total14.4% 10.2% 11.4%
Average O&G capex growth 2010 -2014:
Shale Oil Gusher
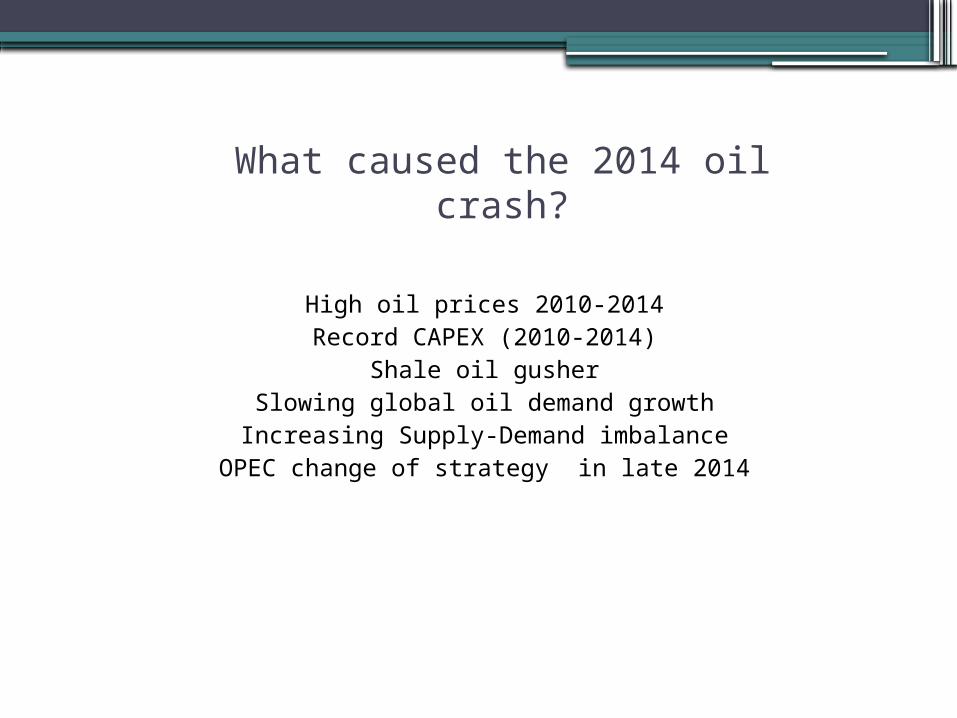
• More then any other unconventional resource, the development of shale oil resources in the United States leads to a surge in US oil and NGLs production, which in turn caused a sizable jump in global oil supply:
US Supply
2010 2011 2012 2013 201484
86
88
90
92
94
96
6.3m increase
From 2010 to 2014 US supply grew by an annual rate of 11.3% vs. 0.34% annual growth rate for the rest of the world (ROW) supply (ex-OPEC).
Global Oil Supply
IEA, Semper Augustus

Slowdown in oil demand
• Sustained high prices along with a slowdown in Chinese growth lead to a slowdown in global oil demand growth especially in 2014:
2010 2011 2012 2013 20140
0.5
1
1.5
2
2.5
3
Average demand growth from 2010 to 2014 stands at 1.38m
IEA, Semper Augustus

Supply-Demand Imbalance• The previous factors conspired to cause a significant supply and demand
imbalance by 2014:
2010 2011 2012 2013 20140
0.5
1
1.5
2
2.5
3
Demand Growth Supply Growth
US was the largest source of supply growth in 2013 and 2014:
2010 2011 2012 2013 20140%
10%20%30%40%50%60%70%80%90%
100%
OPEC supply US supply ROW supply
IEA, Semper Augustus
IEA, Semper Augustus

OPEC changes policy
• Fearing a loss of market share due to the rise of competing oil supply sources (shale oil, Brazil deepwater, oil sands..etc) OPEC refrains from cutting its production to balance the market, thus worsening the emerging oil “glut”.
• The substantial spike in non-OPEC oil investments compared to OPEC oil investments was a key driver behind the increase in non-OPEC production.

Reversal in the US dollar
• The period of high oil prices correspond with a period of continued USD weakness :
• According to the World Bank the historical correlation between oil prices and the US dollar ranges from 100% to 30%, thus it is safe to say that a sharp increase in the US dollar should have a meaningful effect on oil prices.
• Meanwhile the sharp decline in oil prices in 2014 was associated with a big increase in the US dollar:
Empirical estimates of the size of the U.S. dollar effect cover a wide range: the high estimates suggest that a 10 percent appreciation is associated with a decline of about 10 percent in the oil price, whereas the low estimates suggest 3 percent or less.
January 2015, World Bank

Crash! • Excess supply, slow demand, rising dollar, OPEC change of policy lead to a sharp
readjustment in the oil price:
The sharp price decline was sending a strong signal for the petroleum industry to slowdown production, but due to factors (to be discussed in the next slides) the price warning was ignored
and a second crash ensued in 2015.

What caused the second oil crash?
OPEC production surgesLong lead time conventional supply projects come online
Excessive inventories persist

What caused the second oil crash?
• It is generally believed that excess supply (especially the US shale oil supply surge) was the cause of the current oil crisis. This is true for what drove the 2014 oil crash, however what sustained the 2014 oil crash into 2015 is a second supply surge by OPEC.
• Not content with sustaining a high level of production in November 2014, OPEC flooded the market with additional oil production in the spring of 2015.
• OPEC supply surge was lead by Saudi Arabia and Iraq. Iraq’s supply increase was largely due to maturing IOC long lead time supply projects, however the Saudi increase seems to have been designed to send a message.
2010 2011 2012 2013 2014 20153233343536373839
OPEC Supply (including NGLs)1.7m BOE
increase
IEA, Semper Augustus

Long Lead Time Projects come online
• Record oil industry capex levels (slide 4) from 2010 to 2014 lead to a notable increase in the Rest of the World (ROW) (ex-OPEC, ex US) supply in 2014 and 2015, thus exacerbating the global supply problem:
Key areas benefiting from long lead production increase: Canada, Brazil and the North Sea.
2010 2011 2012 2013 2014 201543
43.5
44
44.5
45
45.5
46 0.5m production decline
1.3m cumulative production increase
IEA, Semper Augustus

Inventories Skyrocket
• The net result of the sustained supply-demand imbalance since 2014 has created a historic increase in global petroleum inventories:
Elevated inventory levels have weighed heavily on prices, and will likely continue to pressure prices in the foreseeable future.
IWhat will solve this crisis?
Higher oil demandLower oil supply
Lower inventories

Demand
• Demand has responded to lower oil prices. 2015 oil demand growth has been the strongest in 5 years:
Markets experiencing strong demand growth in
2015 are: China, India and the United States.
1.8m increase
2010 2011 2012 2013 2014 201584
86
88
90
92
94
96
88.489
90.791.9
92.7
94.6
Global oil demand is running at least one year ahead of what the IEA projected in its Medium Term Oil Market Outlook released in February 2015.
IEA, Semper Augustus

Will demand grow further?
• Oil demand elasticity is small, however due to the large size of the market, slight elasticity is sufficient to have a meaningful impact on the supply-demand balance.
• An IMF study covering oil demand elasticity between 1990 and 2009 concluded that a 1% change in oil prices leads to 0.019% change in demand over the short term, and a 0.072% over the long term. The predicted combined short term increase in oil demand for OECD and non-OECD as per the IMF study corresponds with the extent of the demand acceleration witnessed in 2015.
• In the context of stable global GDP growth in 2016. The effect of the sharp and sustained decline in oil prices since 2014 should lead to an acceleration in oil demand growth in 2016.

Low oil prices at work• The sizable price decline in the years following
the 1986 oil crash had a major impact on global oil demand growth compared to the pre-1986 crash years:
• In the three years post the 1986 oil crash, oil prices averaged 46% lower then prevailing prices in the three years preceding the price collapse. Global GDP grew at consistent levels, before and after the crash, yet oil demand grew at 6.9 folds (2.2 folds excluding the 1983 decline) the rate it did prior to the price collapse.
• This accelerated demand growth took place despite a sizable increase in car fleet efficiency worldwide and especially in the US, the largest oil consumer by far in 1980s.
• A similar trend can already be observed in the oil demand data for 2015 as a result of the ongoing oil price crash:
• In light of the continued weakness in oil prices, consistent global GDP growth, and based on the IMF observations on oil demand elasticity, it is highly likely that oil demand growth in 2016 will prove consistent with 2015 above trend growth levels.
• Yet, despite evidence to the contrary, the IEA is forecasting oil demand growth to slowdown to 1.2% in 2016.
Data sources: World Bank, US Department of Transportation, Index Mundi, Statista, IEA.
About 2 folds the pre-crash average

Supply
• Global oil supply is still growing strongly due to the 2015 OPEC surge and continued supply growth from long lead oil supply projects.
• Global supply growth in 2015 has reached a whopping 3m barrels, thus bringing cumulative 2014-2015 supply growth to a massive 5.4m barrels.
• Despite the apparent strength in supply, the fundamentals underpinning the recent strong supply performance are unraveling.
2010 2011 2012 2013 2014 20150
0.5
1
1.5
2
2.5
3
3.5
1.9
1.29999999999998
2.2
0.400000000000006
2.39999999999998
3
Global Annual Supply Growth
IEA, Semper Augustus

Can supply growth be sustained?
• Non-OPEC supply growth has decelerated materially.
• OPEC strong supply growth in 2015 is unlikely to be repeated in 2016, despite the removal of Iranian sanctions.
• Substantial CAPEX cuts are leading to an acceleration in the global net decline rate from 2.5% to 3.1% (CoreLabs).
• 2016 new capacity additions appear increasingly insufficient to replace net declines and meet demand growth.
• Prices are too low to incentivize new supply to come online.
Historic Non-OPEC supply growth (including the
2016 IEA estimates):
2010 2011 2012 2013 2014 2015 2016
-1
-0.5
0
0.5
1
1.5
2
2.5
3
1.1
0.199999999999997
0.5
1.3
2.4
1.29999999999999
-0.60000000000
0001
Chart Title3m barrels swing
New supply projects approvals down to multi year lows.
*WSJ - WoodMac
IEA, Semper Augustus

Prices are substantially below the breakeven cost for new supply
Declining by 3.1% a year or 2.6m barrels
per years as of October 2015
(CoreLabs)
18m to 27mbarrels must be produced from
these fields over the next 6 years
assuming a 2% to 4%
net decline rate
Non-producing fields must replaceNet declines from producing fields., As well as meet demand growth
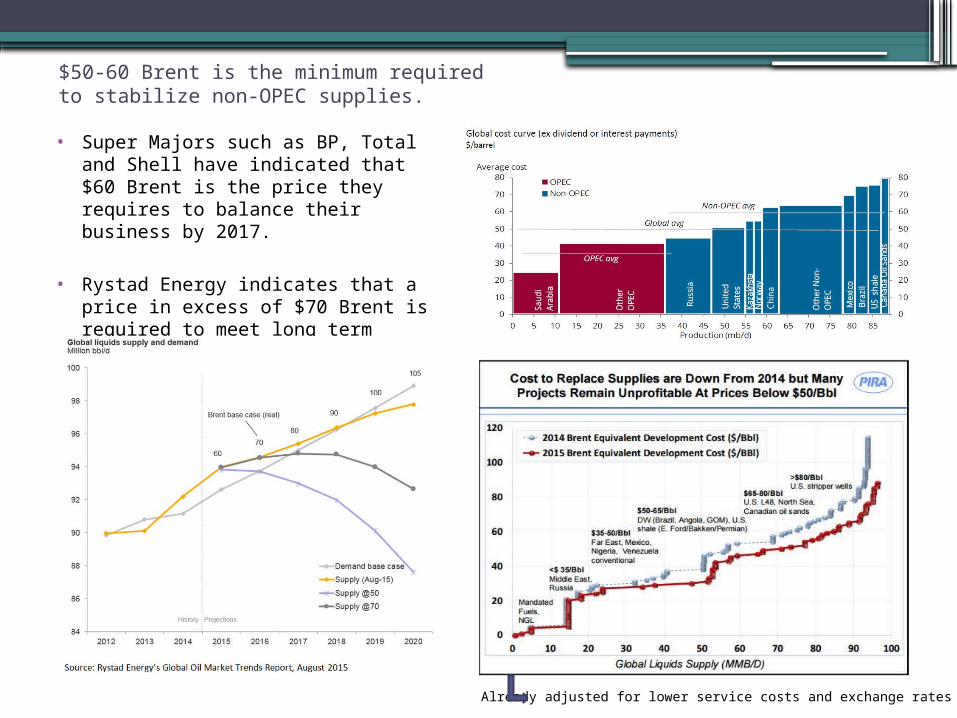
$50-60 Brent is the minimum required to stabilize non-OPEC supplies.• Super Majors such as BP, Total and
Shell have indicated that $60 Brent is the price they requires to balance their business by 2017.
• Rystad Energy indicates that a price in excess of $70 Brent is required to meet long term demand:
Already adjusted for lower service costs and exchange rates

Below $50 Brent virtually all unconventional oil is uneconomic
An eventual rebound in activity could lead to higher service costs, and thus an increasein the prices required to develop these unconventional resources.
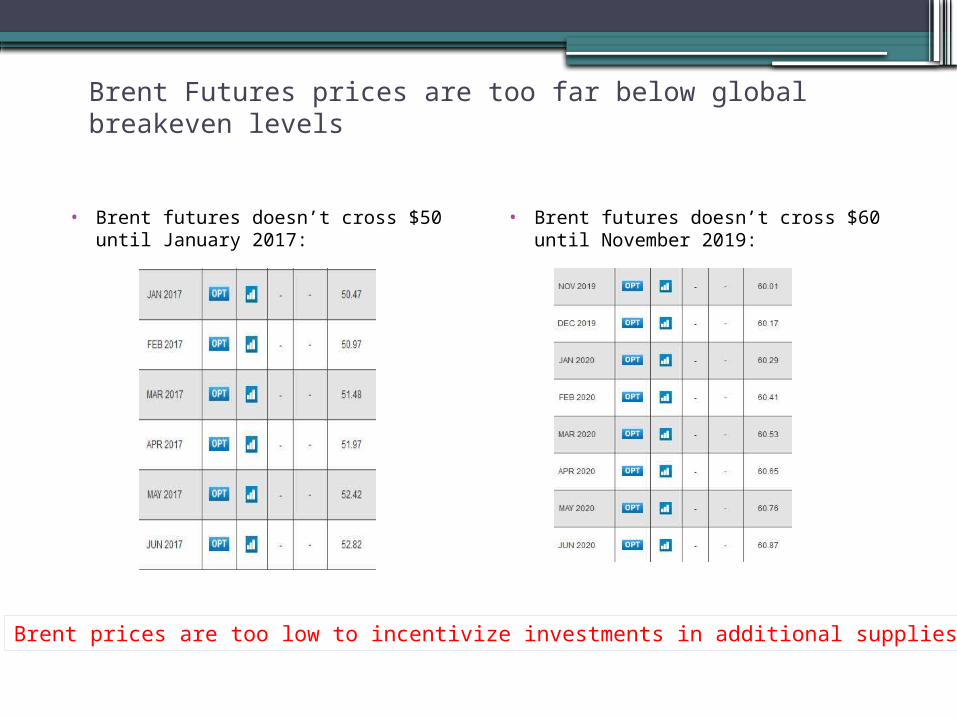
Brent Futures prices are too far below global breakeven levels
• Brent futures doesn’t cross $50 until January 2017:
• Brent futures doesn’t cross $60 until November 2019:
Brent prices are too low to incentivize investments in additional supplies
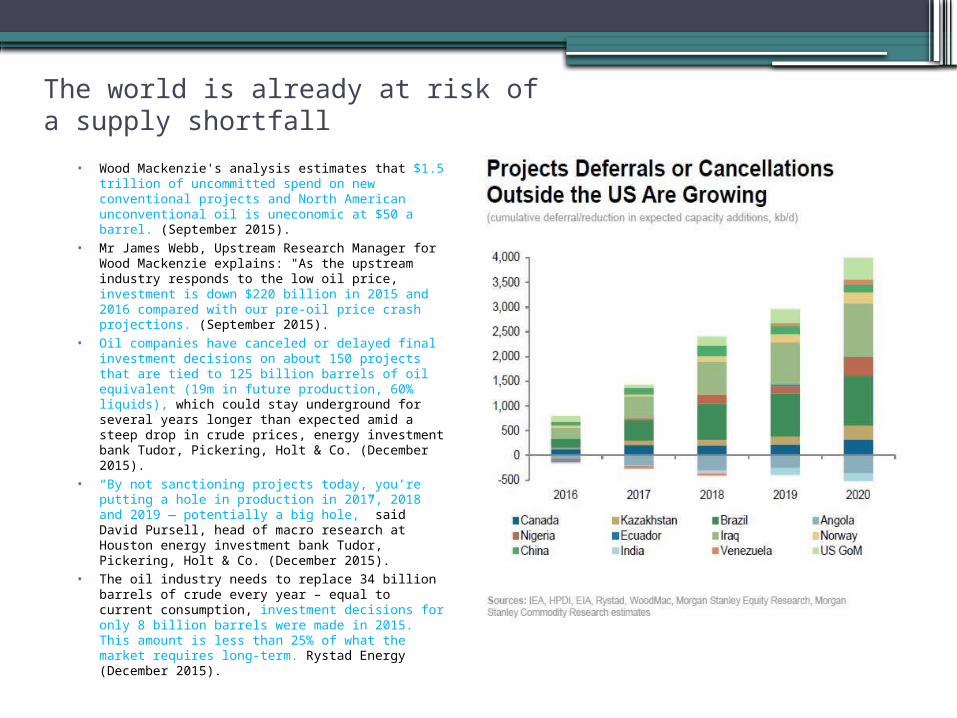
The world is already at risk of a supply shortfall
• Wood Mackenzie's analysis estimates that $1.5 trillion of uncommitted spend on new conventional projects and North American unconventional oil is uneconomic at $50 a barrel. (September 2015).
• Mr James Webb, Upstream Research Manager for Wood Mackenzie explains: "As the upstream industry responds to the low oil price, investment is down $220 billion in 2015 and 2016 compared with our pre-oil price crash projections. (September 2015).
• Oil companies have canceled or delayed final investment decisions on about 150 projects that are tied to 125 billion barrels of oil equivalent (19m in future production, 60% liquids), which could stay underground for several years longer than expected amid a steep drop in crude prices, energy investment bank Tudor, Pickering, Holt & Co. (December 2015).
• “By not sanctioning projects today, you’re putting a hole in production in 2017, 2018 and 2019 — potentially a big hole,” said David Pursell, head of macro research at Houston energy investment bank Tudor, Pickering, Holt & Co. (December 2015).
• The oil industry needs to replace 34 billion barrels of crude every year – equal to current consumption, investment decisions for only 8 billion barrels were made in 2015. This amount is less than 25% of what the market requires long-term. Rystad Energy (December 2015).

Declines never sleep• Global natural decline rates in mature
fields (70% of production) stand at 9% (WEO 2013), equating to 5.3m in annual decline on 85m barrels of crude production.
• Mitigated decline rates (70% of production) stand at 6.2% to 6.4% (WEO 2013), equating to 3.75m at mid-point on 85m barrels of crude production.
• Current Net decline (100% of production) rates stand at 3.1% (CoreLabs – October 2015), equating to 2.6m on 85m barrels of crude production. This is compared to a historical net declines of 1.5% to 2% (DNB Markets– August 2015).
• Lowered capex spending is driving an acceleration in the net global decline rate.
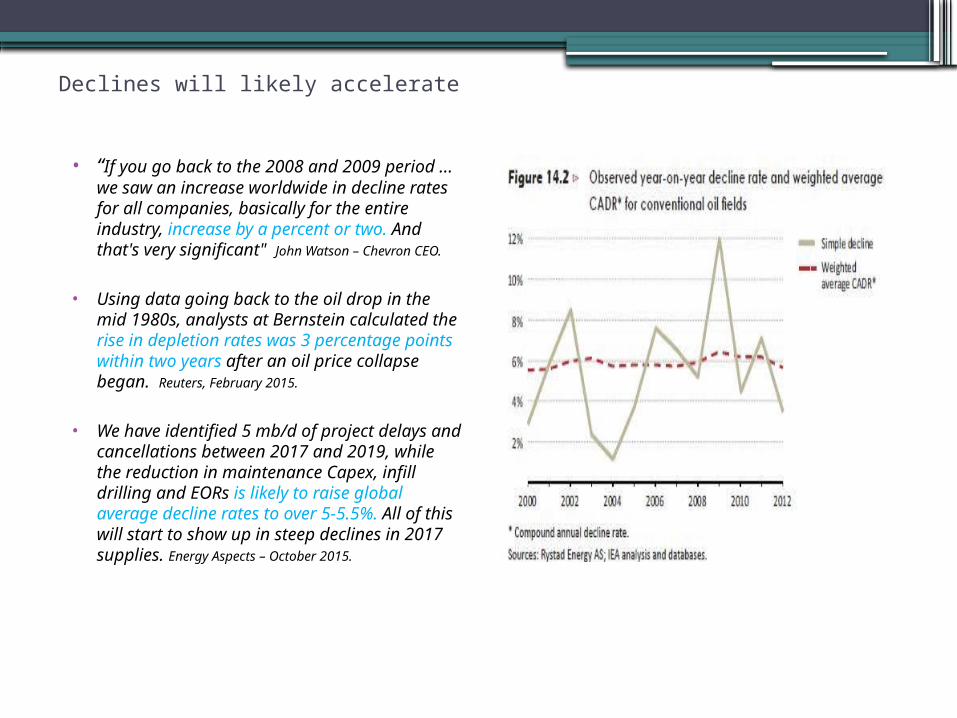
Declines will likely accelerate
• “If you go back to the 2008 and 2009 period ... we saw an increase worldwide in decline rates for all companies, basically for the entire industry, increase by a percent or two. And that's very significant" John Watson – Chevron CEO.
• Using data going back to the oil drop in the mid 1980s, analysts at Bernstein calculated the rise in depletion rates was 3 percentage points within two years after an oil price collapse began. Reuters, February 2015.
• We have identified 5 mb/d of project delays and cancellations between 2017 and 2019, while the reduction in maintenance Capex, infill drilling and EORs is likely to raise global average decline rates to over 5-5.5%. All of this will start to show up in steep declines in 2017 supplies. Energy Aspects – October 2015.
• Mitigated decline rates increased meaningfully in 2009:

Offshore managed mature declines to accelerate as infill drilling collapses
• Total offshore production stood at 22m in 2015. (Rystad Energy)
• Mature offshore production stood at 15m in 2015. (Rystad Energy)
• Collapse in infill drilling is expected to remove 1.5m in mature offshore production in 2016 (up from 750K in prior years) as managed declines accelerates to 10%. (Rystad Energy)
• New offshore projects sanctions scratches to a halt as industry gets squeezed by low prices.
Reduced infill drilling and slow new
Project sanctions will further accelerate decline rates.

Accelerating decline rates have a strong impact on supply
Needed oil supplies at 2% decline rate and 1m per year demand growth:
Needed oil supplies at 4% decline rate and 1m per year demand growth:
An increase in the net decline rate from 2% to 4% means an additional 9m barrels of new capacity is required to satisfy demand over
the next 6 year.
US offshore strength is masking the weakness in onshore production.
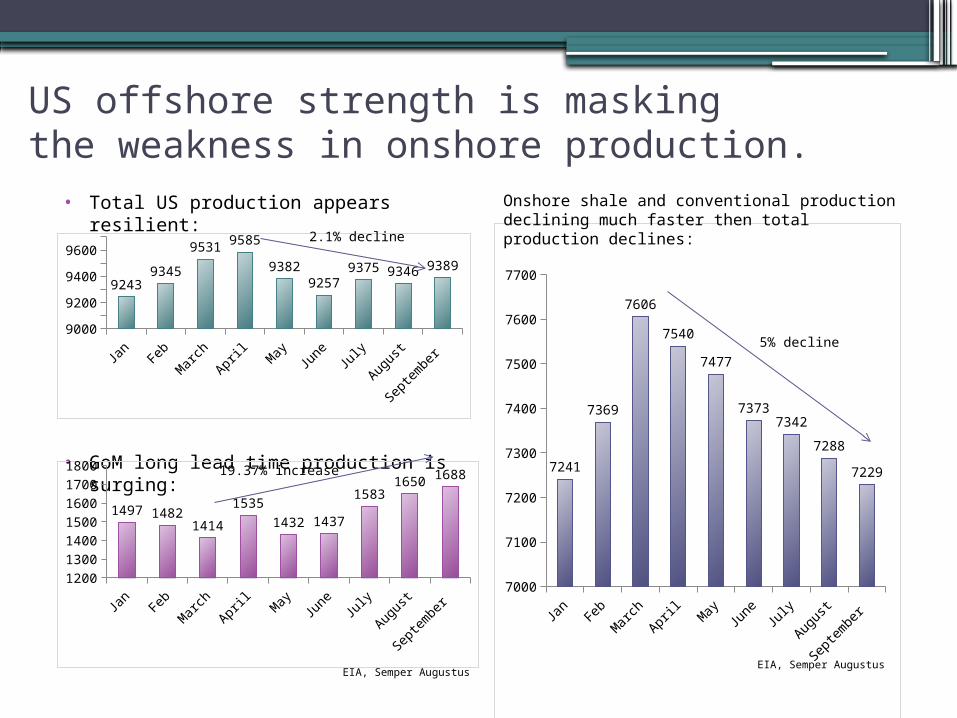
• Total US production appears resilient:
• GoM long lead time production is surging:
Jan Feb
March
April
MayJun
eJul
y
Augu
st
Septe
mber
9000
9200
9400
9600
92439345
9531 9585
93829257
9375 9346 9389
2.1% decline
Jan Feb
March
April
MayJun
eJul
y
Augu
st
Septe
mber
1250
1350
1450
1550
1650
1750
1497 14821414
1535
1432 1437
15831650 168819.37% increase
Jan Feb
March
April
MayJun
eJul
y
Augu
st
Septe
mber
7000
7100
7200
7300
7400
7500
7600
7700
7241
7369
7606
7540
7477
73737342
7288
7229
5% decline
Onshore shale and conventional production declining much faster then total production declines:
EIA, Semper AugustusEIA, Semper Augustus

US shale productivity hits a wall
• After rising sharply from early 2015 until the summer months, US shale rig productivity plateaued since October 2015:
• Expiring hedges, shrinking cash flow, rising debt service burden and a collapsing rig count indicate that US production declines will continue beyond 2016 and well into 2017:
EIA, Semper Augustus
Septe
mber
Novem
ber
Janua
ry
March May Jul
y
Septe
mber
Novem
ber
-
100
200
300
400
500
600
700
800
900
Eagle FordBakken Permian
How large is the 2016 imbalance?
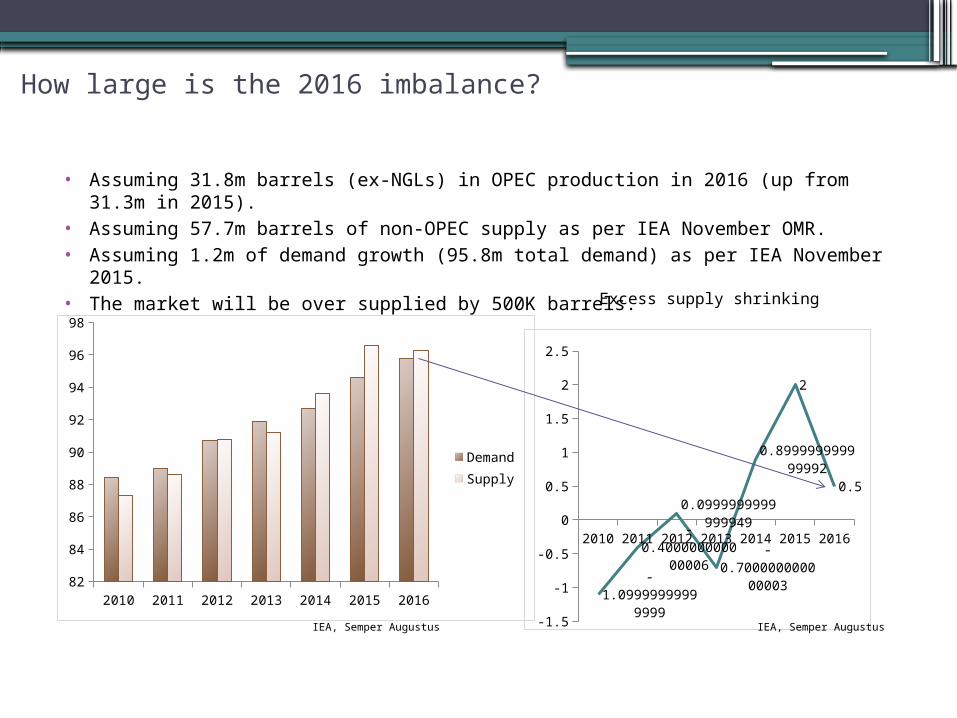
• Assuming 31.8m barrels (ex-NGLs) in OPEC production in 2016 (up from 31.3m in 2015).
• Assuming 57.7m barrels of non-OPEC supply as per IEA November OMR.• Assuming 1.2m of demand growth (95.8m total demand) as per IEA November 2015.• The market will be over supplied by 500K barrels.
2010 2011 2012 2013 2014 2015 201682
84
86
88
90
92
94
96
98
Demand Supply
2010 2011 2012 2013 2014 2015 2016
-1.5
-1
-0.5
0
0.5
1
1.5
2
2.5
-1.09999999999
999
-0.40000000000
0006
0.0999999999999949
-0.70000000000
0003
0.899999999999992
2
0.5
Excess supply shrinking
IEA, Semper Augustus IEA, Semper Augustus

Can 500K imbalance sink the market?• A 500K average imbalance on standalone basis is small, however when
combined with an already elevated inventories, it is problematic:
An additional 500K in excess production could add an additional 182m barrels to storage or basically double the current 200m barrels excess.

Several factors could eliminate the 500K IEA assumed imbalance for 2016
• According to the IMF data (slide 17), demand growth accelerates long term in response to low prices. Yet, the IEA is forecasting a deceleration in demand growth in 2016 despite higher IMF global 2016 GDP estimates compared to 2015 (3.5% to 3.1%) and persistent low prices which argue for a boost in demand. Demand growth on par with 2015 would add 800K of additional demand to the IEA 2016 demand estimate.
• Decline rates are likely to accelerate as both investments in existing production and new production are curtailed. An additional 1% acceleration in net declines leads to 800K-900K decline in global oil supplies.
The IEA has historically underestimateddemand by an average of 700K per year:

Will OPEC ever act?OPEC policy is lead by Saudi Arabia and Saudi oilpolicy is driven by three key factors:
• Maximize oil revenues.• Maximize long term oil demand.• Contain emerging supply competition.
Saudi Arabia constantly seeks to balance these three policy drivers. A close examination ofthese objectives reveal that Saudi interests will beoptimized at $60 to $70 Brent ($55 -$65 WTI). Atsuch a price range high cost oil supply growthwill be contained. Global oil demand will remainrobust. Oil revenues will be maximized. Long termvolatility will be reduced as sufficient industryinvestments lead to stable oil supply. Recentcomments by Saudi officials have signalled $60 to$80 Brent (FT November 2015) as their desired pricerange. Saudi royals and officials have also
recentlystressed the need sustained investments in the industry to ensure future stability.
Current oil prices and the associated severe industry
capex cuts run contrary to the three key Saudi oil policy
objectives. A change of Saudi oil policy over the next 6
months is highly likely should oil prices fail to rally to
$50 Brent in 1H-2016. A modest 1m cut by the GCC
countries (Saudi Arabia, UAE, Kuwait and Qatar) could
radically change the outlook for the oil market in 2016
and align prices with Saudi objectives.
OPEC historical production has rhymed with their quota.

How much supply can Iran bring to the market in 2016?
• Despite Iranian claims that they can ramp up production by 1m barrels in short order. Those claims have been disputed by a number of experts.
• An extensive analysis of Iranian fields and decline rates by Sanford Bernstein concluded the following in November 2015:
Our analysis of production recovery after significant negative events including wars/sanctions enhanced by our technical knowledge of Iranian fields and historical development problems show us that an immediate Iranian recovery to the tune of 500,000 bpd as soon as sanctions are lifted in early 2016 is untenable.
• A more bullish report by Reuters Oil Research (December 2015) concludes that Iranian production will average 3.38m in 2016 vs. 2.8m in 2015, thus equating to 580K barrels increase.
Most observers suggest that 3–3.5 million b/d is a more realistic target over a period of a year after the removal of sanctions, if not longer.
Chatham House March 2015
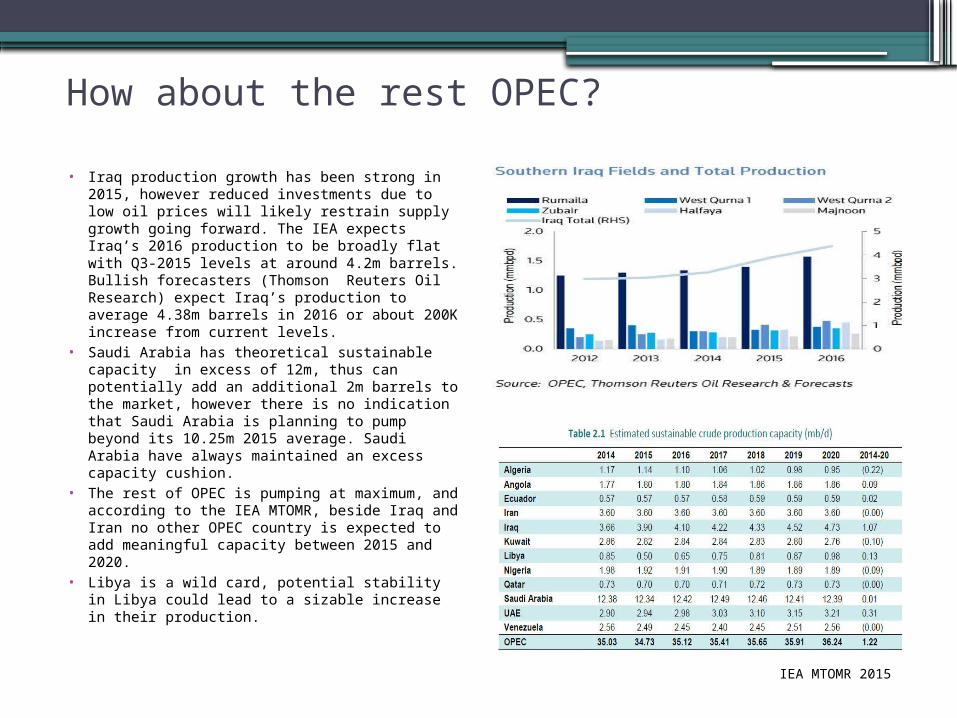
How about the rest OPEC?• Iraq production growth has been strong in
2015, however reduced investments due to low oil prices will likely restrain supply growth going forward. The IEA expects Iraq’s 2016 production to be broadly flat with Q3-2015 levels at around 4.2m barrels. Bullish forecasters (Thomson Reuters Oil Research) expect Iraq’s production to average 4.38m barrels in 2016 or about 200K increase from current levels.
• Saudi Arabia has theoretical sustainable capacity in excess of 12m, thus can potentially add an additional 2m barrels to the market, however there is no indication that Saudi Arabia is planning to pump beyond its 10.25m 2015 average. Saudi Arabia have always maintained an excess capacity cushion.
• The rest of OPEC is pumping at maximum, and according to the IEA MTOMR, beside Iraq and Iran no other OPEC country is expected to add meaningful capacity between 2015 and 2020.
• Libya is a wild card, potential stability in Libya could lead to a sizable increase in their production.
IEA MTOMR 2015

Call on OPEC & Market Balance • According to the November IEA OMR, the
call on OPEC for 2016 has been raised to 31.3m barrels from 29.7m in 2015. (Current OPEC production is 31.7m).
• The call on OPEC is expected to rise to 31.9m by Q3/2016 and to 32.1m by Q4/2016.
• Oil prices have a high correlation with “call on OPEC” changes.
• The rising call on OPEC signal that the market will balance by 2H-2016.
Source: CIBC

What’s the proper long term price for oil?
• According to Sanford Bernstein oil prices always trend back toward the marginal cost of production:
• Depending on the source, the current marginal cost of oil production ranges from $70 to $85 Brent.
• A Monte Carlo simulation by ConocoPhillips (November 2015) conclude that long term oil prices should average in the $70 to $75 range.
Several credible oil price forecasting models indicate that current oil prices are substantially divergent from their projected long term
average.

Goldman says lower for longer, are they right?
• In January 2015 Goldman Sachs made the bearish prediction that oil prices will stay low for longer. As we exit 2015, we see that Goldman Sachs was right, but where they right or just lucky?
• In their January 11th 2015 bearish call Goldman Sachs made the following supply and demand assumptions for 2015?
Non OPEC supply: 57.7mOPEC crude supply: 30.15m
OPEC NGLs: 6.6m Total Supply: 94.45m
Demand: 93.8mSupply/demand imbalance: 650K
How did 2015 actual demand and supplynumbers turned out compared to whatGoldman Sachs expected?
IEA Non OPEC Supply: 58.3mGoldman miss: 600K
IEA OPEC crude supply: 31.3mGoldman miss: 1.15m
IEA Demand: 94.6mGoldman miss: 800K
GS bearish 2015 projection was saved by
an unexpected 1.15m OPEC productionincrease.
Goldman Sachs expects 2016 Supply/demand imbalance to average around 400K*Will they get lucky again?
* Lower for Even Longer September 2015
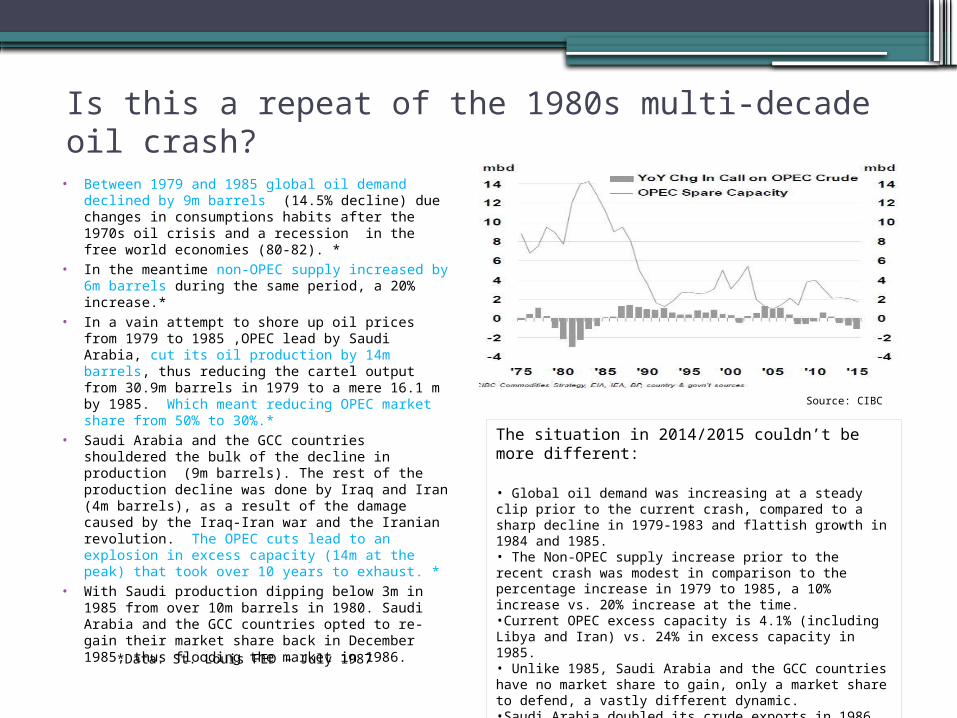
Is this a repeat of the 1980s multi-decade oil crash?• Between 1979 and 1985 global oil demand
declined by 9m barrels (14.5% decline) due changes in consumptions habits after the 1970s oil crisis and a recession in the free world economies (80-82). *
• In the meantime non-OPEC supply increased by 6m barrels during the same period, a 20% increase.*
• In a vain attempt to shore up oil prices from 1979 to 1985 ,OPEC lead by Saudi Arabia, cut its oil production by 14m barrels, thus reducing the cartel output from 30.9m barrels in 1979 to a mere 16.1 m by 1985. Which meant reducing OPEC market share from 50% to 30%.*
• Saudi Arabia and the GCC countries shouldered the bulk of the decline in production (9m barrels). The rest of the production decline was done by Iraq and Iran (4m barrels), as a result of the damage caused by the Iraq-Iran war and the Iranian revolution. The OPEC cuts lead to an explosion in excess capacity (14m at the peak) that took over 10 years to exhaust. *
• With Saudi production dipping below 3m in 1985 from over 10m barrels in 1980. Saudi Arabia and the GCC countries opted to re-gain their market share back in December 1985, thus flooding the market in 1986.
The situation in 2014/2015 couldn’t be more different:
• Global oil demand was increasing at a steady clip prior to the current crash, compared to a sharp decline in 1979-1983 and flattish growth in 1984 and 1985. • The Non-OPEC supply increase prior to the recent crash was modest in comparison to the percentage increase in 1979 to 1985, a 10% increase vs. 20% increase at the time. •Current OPEC excess capacity is 4.1% (including Libya and Iran) vs. 24% in excess capacity in 1985.• Unlike 1985, Saudi Arabia and the GCC countries have no market share to gain, only a market share to defend, a vastly different dynamic. •Saudi Arabia doubled its crude exports in 1986 to gain market share and counter the price crash. This compares to a mere 5% increase in production in 2015.
*Data: St. Louis FED – July 1987
Source: CIBC

Long cycle vs. short cycle • Despite the emergence of shale oil production,
the oil industry is still dominated by long cycle supply projects with 95% of total oil supply (92% non-OPEC) emanating from long lead time projects.
• The 1980s price collapse had a notable impact on non-OPEC oil investments and a notable impact on non-OPEC supply growth within 2 years of the Non-OPEC Capex cuts.
• The sharp decline in non-OPEC Capex between 1982 and 1986 translates into a sharp slowdown in non-OPEC growth by 1984 followed by a flattening phase lasting until 1988, which in turn was followed by a 3.5% production decline by 1991 (post 1991 non-OPEC declines are driven by the USSR collapse). Non-OPEC production only reached its 1988 production peak again in the year 2000.
• Applying the above to today indicates that a meaningful impact on global conventional supply from the 2015 Capex cuts (and the expected 2016 Capex cuts) will increasingly show by 2017.
• The adjustment in US onshore/shale production in 2015 (and its expected continued decline in 2016) is likely the prelude to the real supply response in 2017 to 2020.
CAPEX cutsProduction declines
Source: peakbarrel.com
Flattening phase
As OPEC production increases and non-OPEC production declines OPEC captures 9m of the 9.5m barrels in global oil demand between 1985 and 1991.
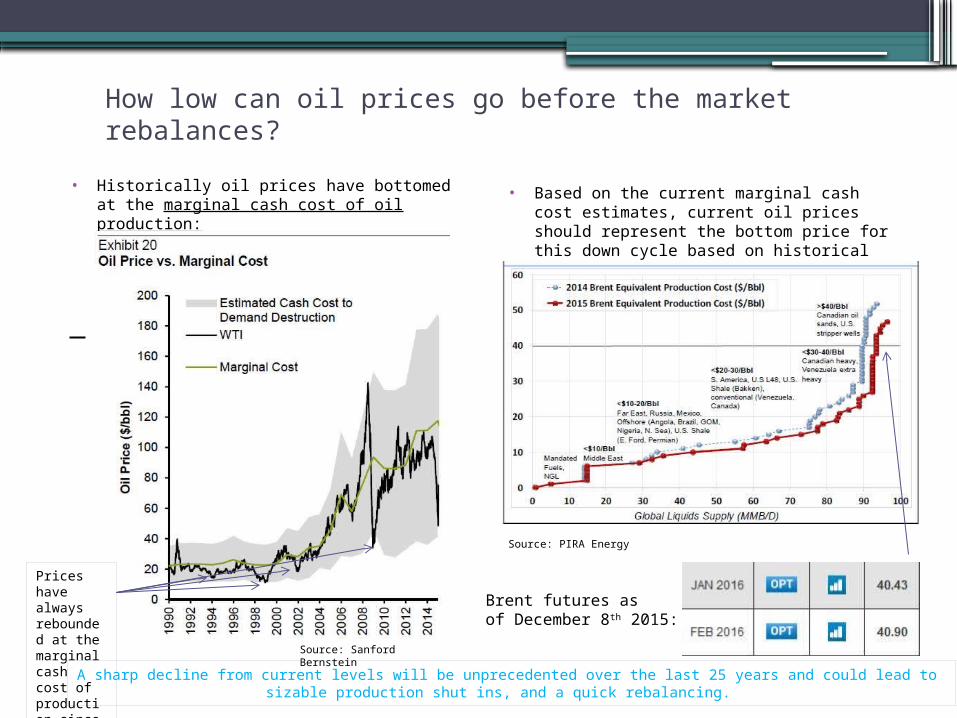
How low can oil prices go before the market rebalances?
• Historically oil prices have bottomed at the marginal cash cost of oil production:
Source: Sanford Bernstein
• Based on the current marginal cash cost estimates, current oil prices should represent the bottom price for this down cycle based on historical precedent:
Brent futures as of December 8th 2015:
Source: PIRA Energy
Prices have always rebounded at the marginal cash cost of production since 1990.
A sharp decline from current levels will be unprecedented over the last 25 years and could lead to sizable production shut ins, and a quick rebalancing.

Conclusion • The conditions leading to the 2014 oil collapse
such as record capex, strong non-OPEC supply growth and weak demand have been reversed.
• OPEC’s 2015 supply surge is unlikely to be repeated.
• Global decline rates will likely accelerate in 2016 and beyond.
• Global inventories remain elevated, and will take at least a year of sizable supply deficits to reduce.
• Oil prices are too low to incentivize new supply, the prospects of an oil shortage in 2017 to 2019 are increasing.
• Most supply and demand models indicate a balancing market by 2H-2016. Capex cuts will increasingly impact global supply as we approach 2017.
• There is an increasing chance that OPEC/Saudi Arabia will act to reduce supply in the next six months if prices fail to rally above $50 Brent.
• A multitude of supply and demand models indicate that long term oil prices should exceed $70 Brent.
• OPEC excess capacity is limited, comparisons to the 1980s are misguided.
• Current prices are trading at the cash marginal cost, which has historically represented the bottom for the oil price.
• A renewed sharp appreciation in the US dollar from current levels appear highly unlikely.
“I buy when other people are selling”J. Paul Getty