2012 Annual Report - DSV/media/US/Files/pdf/about us/investor/2012-Annual... · 4 DSV 2012 annual...
102
2012 Annual Report Global Transport and Logistics
Transcript of 2012 Annual Report - DSV/media/US/Files/pdf/about us/investor/2012-Annual... · 4 DSV 2012 annual...

2012 Annual Report
Global Transport and Logistics

Global Transport and LogisticsDSV is a global supplier of transport and logistics services. The Group has operations in more than 70 countries and approx. 22,000 employees worldwide.
DSV Air & Sea specialises in the handling of air and sea freight to destinations all over the world. The Division plans and executes shipments in a quick, efficient, safe and environmentally friendly manner and combines the means of transportation when most appropriate. The Division has approx. 6,000 employees.
DSV Road offers transportation of full, part and groupage loads all over Europe in a quick, efficient, flexible and envi-ronmentally friendly manner and provides good connections to the rest of the world. The Division has approx.10,000 employees.
DSV Solutions specialises in logistics services across the entire supply chain from design through freight manage-ment, customs clearance, warehousing and distribution to information management and e-business support.DSV Solutions has approx. 5,000 employees.
MANAGEMENT’S COMMENTARY
Global Transport and Logistics 2
Growth in a difficult market 4
Financial highlights 6
Strategy and financial targets 7
Financial review 10
DSV Air & Sea 16
DSV Road 20
DSV Solutions 24
Risk management 28
Corporate governance 31
Shareholder information 34
Corporate social responsibility 37
CONSOLidATEd fiNANCiAL STATEMENTS
Income statement 40
Statement of comprehensive income 40
Balance Sheet 41
Cash flow statement 42
Statement of changes in equity 43
Notes 45
MANAGEMENT’S COMMENTARY – continued
The Executive Board and the Board of Directors 76
STATEMENTS
Statement by the Executive Board and the Board of Directors 78
Independent auditors’ report 79
GROup STRuCTuRE 80
ANNuAL REpORT Of pARENT
CD containing 2012 Annual Report of Parent and CSR Report of DSV 83
Contents
EBiTA - BY REGiON
■ Nordiccountries–27%
■ SouthernEurope–10%
■ OtherEurope–34%
■ Americas–14%
■ Asia–15%
REVENuE - BY REGiON
■ Nordiccountries–28%
■ SouthernEurope–17%
■ OtherEurope–39%
■ Americas–7%
■ Asia–9%
2 DSV 2012 annual report – ContentS

AiR & SEA ROAd SOLuTiONS
42%
54%
30%
47%
36%
45%
11%
10%
25%
Revenue*dKKM
44,912EBiTA*dKKM
2,540Employees**NuMBER Of
21,932* ExternalrevenueandEBITAaftereliminationofinternaltransactions
** IncludingGroupfunctions
STÆRK POSITION I MARKEDET
CountriesinwhichDSVhasitsowncompanies
DSV has 18,000 em-ployees and more than 300 branch offices and terminals across Europe
After the acquisition of Swift Freight DSV’s network in Africa now includes 15 countries
DSV has 81 branch offices and 2,300 em-ployees in 16 countries in the Asia/Pacific area
DSV has 31 branch offices in North
America – Portland, Oregon are the latest
additions
In 2012 Argentina Chile and Peru became fully-fledged members
of the DSV family
In 2012 DSV Air & Sea Logistica Ltda. was established in Brazil
3DSV 2012 annual report – ContentS

Growth in a difficult marketin 2012 dSV has defied a market showing lower than expected freight volumes. For DSV the formula for success is classic: Providing good services for the customers through hard work while maintaining a high focus on productivity and internal cost management.
Jens Bjørn AndersenCEO
DSV A/S
In a year marked by macro-economic uncertainty, a highly volatile transport market and general economic slowdown in many of the countries in which DSV operates, I am very pleased to state that, once again, DSV has achieved pro-gress and delivered a profit before tax that outperformed last year’s figures. Furthermore, our network has grown stronger in 2012 through strategic acquisitions in key growth markets, fortifying the Group’s position in the highly competitive transport industry. We have generated a rea-sonable return for our shareholders in 2012 and realised our target of allocating a considerable amount back to the shareholders through share buy-backs and dividends.
declining market growth 2012 started off with cautious optimism and market expectations of stable growth in freight volumes. But ex-pectations went unfulfilled, and towards the end of 2012 we had to realise that overall freight volumes had declined compared to 2011. However, the market development differed across the regions. Asian and Northern European markets saw positive growth rates, whereas Europe – the most important market of DSV – was characterised by negative development with declining freight volumes, in some areas dropping by more than 10%. In particular im-port levels to Southern Europe showed a negative growth trend in 2012, but as DSV has been able to gain market share in Southern Europe the negative development did not affect DSV as much as we might have feared. Southern Europe accounts for 10% of the consolidated EBITA of DSV and the 2012 results for this region were only down by DKK 7 million compared to 2011. Our employees in South-ern Europe can rightly be proud of that.
Acquisitions on the agendaUntil 2012, Africa and Latin America were almost non-existent in the global DSV network. This prompted us to take steps during 2012 to strengthen DSV in these growth markets. First, we established DSV Brazil and we expect to develop the Brazilian company and open several new offices in Brazil in the next coming years. Secondly, we ac-quired the remaining shares in our joint venture companies in Argentina, Chile and Peru, making these three countries
fully-fledged members of the DSV network. Finally, DSV really sat foot on a new continent in 2012: Africa. We have no doubt that there is a major development potential for DSV in the African market. That is why we acquired part of Swift Freight which has operations in Dubai, India and China as well as offices in 12 African countries.
We hope that 2013 will bring additional acquisitions to supplement our organic growth plans.
Operational Excellence2012 was a year characterised by cost saving initia-tives. We spent part of the year implementing the savings measures of “Operational Excellence”; a project launched to reduce the overhead costs of the Group. The project
4 DSV 2012 annual report – management ’S Commentary – grow th in a DiffiCult market

implied a number of staff cuts. Having to let competent employees go on that basis is a tough, but necessary deci-sion. The project also made it possible for us to consolidate our network and to close a number of locations in Europe in that connection. The project was completed at the end of the year and we expect to see the full impact of the sav-ings in 2013. Process optimisation and tight cost manage-ment have always been of high priority at DSV. This work will continue in 2013, both locally in the individual countries and at Group level through the establishment of central functions in our new Shared Service Centre in Poland and other initiatives.
divisionsThe three Divisions of DSV reported satisfactory results for the year. In particular the Air & Sea Division and the Road Division deserve recognition for the positive development in a highly competitive transport market. Both Divisions have strengthened their market position in 2012 and are both still among the most profitable businesses in the in-dustry. The results reported by the Solutions Division for 2012 were adversely affected by surplus capacity in the market and costs related to the implementation of new large customers. Management changes were made during the year and, with great commitment, the new Solutions management has collaborated with the individual Solutions countries on detailed action plans to improve performance going forward.
DSV has a clear goal of growing faster than the market. This goal was achieved in 2012 to a great extent, with only DSV’s sea freight volumes showing slightly weaker growth than the market. This was due to our large exposure to the Asia-Europe trade lane, which saw growth rates consider-ably below the sea freight market in general.
product developmentThe transport and logistics market is constantly moving, which poses great demands on a company like DSV to continuously refine and improve products and services. We see our customers adopting an increasingly professional approach to supply chain management, and it is of great importance to DSV to have the competencies required to
...fortifying the Group’s position in the highly competitive transport industry
offer a powerful concept to existing as well as new cus-tomers.
Several interesting projects have been launched and we expect to accelerate the roll-out of two new products in 2013: “DSV Daily Pallet” – a time-sensitive concept linking more than 200 European locations with daily departures, and “DSV X-press” – worldwide express delivery of docu-ments and small shipments. Both products have consider-able potential and will be rolled out across the Group in the course of 2013.
Corporate Social Responsibility at dSVDSV being a major global corporation, CSR has become an increasingly important part of our daily operations. CSR previously played a more peripheral role, but is now a highly important focus area and an integral part of the business processes at DSV. We demand a lot from ourselves and our suppliers and we are also met with increasing demands from customers and business partners. It is a pleasure to note that DSV has made progress in most areas in 2012 towards achieving our ambitious CSR targets, as described in the separate CSR Report of DSV.
Employees – our greatest assetWe often say that our industry is a “people’s business” and nothing could be more true! Although IT, fully automated systems and business processes play an increasingly impor-tant role, our greatest asset will always be our employees. We have loyal and skillful staff all of whom are bearers of our unique DSV culture, and it is fantastic to see that DSV is an attractive workplace to both young and more experi-enced freight forwarders. In the DSV culture, a decentral-ised organisational structure goes hand in hand with central guidelines and the individual entities of the Group have a large degree of autonomy to influence their performance. That is a major asset of DSV which we must always safe-guard.
This is also a good opportunity for me to thank all our approx. 22,000 employees, who by their hard work have contributed to DSV reporting good financial results for 2012 – Thank you!
Outlook for 2013Since 2008 we have grown accustomed to the fact that uncertainty and volatility are part of the market conditions for DSV, and 2013 will be no different. The global markets are still characterised by economic uncertainty, and al-though the European debt crisis is hopefully drawing to an end we do not anticipate any notable improvement in the international transport markets any time soon. We expect very limited growth in the markets of DSV in the coming year. And yet, DSV has reason to be cautiously optimistic. We have a strong product in the market and with own op-erations in 74 countries we are well positioned to gain mar-ket share in both existing markets and growth markets.
5DSV 2012 annual report – management ’S Commentary – grow th in a DiffiCult market

fiNANCiAL hiGhLiGhTS* 2008 2009 2010 2011 2012
Income statement (DKKm) Revenue 37,435 36,085 42,562 43,710 44,912Gross profit 8,175 8,898 9,320 9,819 10,054Operating profit before amortisation, depreciation and special items (EBITDA) 2,338 2,239 2,721 2,975 3,074Operating profit before special items (EBITA) 1,936 1,703 2,202 2,426 2,540Special items 78 (688) (5) - (275)Operating profit (EBIT) 2,014 1,015 2,197 2,426 2,265Net financial expenses 404 555 537 431 246Profit before tax 1,610 460 1,660 1,995 2,019Profit for the year 1,233 191 1,194 1,449 1,430Adjusted earnings 1,131 799 1,290 1,546 1,745
Balance sheet (DKKm) Non-current assets 13,942 14,180 14,143 13,786 13,546Current assets 9,783 8,000 8,942 8,948 9,248DSV A/S shareholders’ share of equity 3,808 5,501 6,549 5,279 5,348Non-controlling interests 49 29 36 30 37Non-current liabilities 8,702 8,532 7,398 7,984 8,097Current liabilities 11,166 8,118 9,102 9,441 9,312Balance sheet total 23,725 22,180 23,085 22,734 22,794Net working capital 1,074 135 70 1 307Net interest-bearing debt 9,541 6,890 5,872 6,585 6,561Invested capital including goodwill and customer relationships 13,323 13,100 13,046 12,030 11,953Gross investment in property, plant and equipment 731 488 334 576 453
Cash flows (DKKm) Operating activities 895 1,702 1,663 1,863 1,651Investing activities (3,119) (486) (151) (34) (249)Free cash flow (2,224) 1,216 1,512 1,829 1,402 Adjusted free cash flow 624 1,257 1,566 1,894 1,509Financing activities (excluding dividends distributed) 2,159 (1,373) (1,346) (1,712) (912)Dividends distributed (50) - (52) (105) (190)Cash flow for the year (115) (157) 114 12 300 Foreign currency translation adjustments 248 8 (118) (8) (115)Cash and cash equivalents at year-end 516 367 363 367 552
Financial ratios (%) Gross margin 21.8 24.7 21.9 22.5 22.4EBITDA margin 6.2 6.2 6.4 6.8 6.8EBITA margin 5.2 4.7 5.2 5.6 5.7EBIT margin 5.4 2.8 5.2 5.6 5.0EBITA as a percentage of gross profit (conversion ratio) 23.7 19.1 23.6 24.7 25.3Effective tax rate 23.4 58.5 28.1 27.4 29.2ROIC before tax including goodwill and customer relationships 17.2 12.9 16.8 19.7 21.2ROIC before tax excluding goodwill and customer relationships 42.6 35.8 53.2 62.5 71.1Return on equity (ROE) 33.8 4.0 19.7 24.3 26.9Solvency ratio 16.0 24.8 28.4 23.2 23.5Financial gearing ratio 3.6 3.1 2.2 2.2 2.1
Share ratios Earnings per share of DKK 1 (EPS) 6.66 0.93 5.68 7.34 7.81Diluted adjusted earnings per share of DKK 1 6.12 3.93 6.16 7.82 9.48Number of shares at year-end (‘000) 182,872 208,699 206,507 185,644 178,063Diluted average number of shares (‘000) 184,955 203,248 209,395 197,613 183,971Share price at year-end (DKK) 56.50 94.00 123.30 103.00 145.70Dividend per share 0.00 0.25 0.50 1.00 1.25
Staff Number of employees at year-end 25,056 21,280 21,300 21,678 21,932 *) For a definition of the financial highlights, please refer to page 75.
6 DSV 2012 annual report – management ’S Commentary – finanCial highlightS

Strategy and financial targets
The transport and logistics market As a global freight forwarding company, DSV offers trans-port and logistics solutions to its customers, but the actual transport operations are performed by external hauliers, shipping companies and airlines. DSV does not own the transport equipment.
In addition to physical transportation services custom-ers also demand various related services, such as handling of freight documents, customs clearance, cargo insurance, warehousing and distribution.
COMpETiTORSThe transport and logistics market is fragmented and even the largest global players have modest market shares. The world’s ten largest players are estimated to have an aggre-gate market share of approx. 33%. The global market share of DSV is estimated at approx. 2%.
Measured by revenue (2011), DSV ranks as number six among the world’s largest freight forwarders.
Operating in a market which is expected to see continued growth, DSV wants to strengthen its position among the world’s leading transport and logistics companies.
annual growth in freight volumes has been two-three times higher than global economic growth, partly driven by out-sourcing of production activities to the Far East.
The production outsourcing trend is estimated to have peaked, particularly in Europe and North America, and the gap between freight volume growth figures and economic growth figures is expected to narrow. However, increasing prosperity in, e.g., Asia and South America and, in the longer term also in Africa, also creates a basis for continued freight volume growth.
iNCREASiNG OuTSOuRCiNG Of TRANSpORT ANd LOGiSTiCS SERViCESThere is a growing desire among enterprises to reduce their overall logistics costs and a decreasing number consider transport and logistics operations as part of their core competencies. This forms the basis of more outsourcing, thereby boosting growth for transport and logistics provid-ers relative to the underlying freight volume growth.
ThE LARGE BECOME LARGERFor a number of years, the largest transport and logistics providers have reported higher growth than the small play-ers due to economies of scale and strong global networks. This trend is expected to continue and lead to further con-solidation in the industry.
The five core elements of the dSV StrategyThe strategy of DSV is based on the market as outlined above and is structured around five pivotal elements:
MARKET ShARES
■ DHL–9.4%
■ Kuehne&Nagel–5.5%
■ DBSchenker–5.0%
■ CEVALogistics–2.4%
■ C.H.Robinson–2.2%
■ dSV – 2.0%■ Panalpina–1.8%
■ SNCFGeodis–1.8%
■ Expeditors–1.5%
■ UPSSupplychain–1.5%
■ Other–66.9%
Source:JournalofCommerce,basedon2011revenue
MARKET GROwTh
fREiGhT VOLuME dEVELOpMENTFreight volumes are cyclical and sensitive to the global eco-nomic development. Over the last 20 years, the average
CuSTOMER fOCuS
BuSiNESS pROCESSES
ASSET LiGhT ORGANiSATiON
STRATEGYGROwTh
7DSV 2012 annual report – management ’S Commentary – Str ategy anD finanCial targetS

to the local customers and able to quickly make decisions when needed.
The strong group and shared-service functions of DSV (e.g., procurement, finance, compliance, sales and market-ing, and IT) support the decentralised corporate structure. The shared-service functions of the Group are continously optimised with the aim to further centralise and standardise the Group’s business processes in the coming years.
ASSET LiGhTTo facilitate ongoing adjustment of capacity, and thereby overheads, relative to the market development DSV ap-plies a flexible business model, which means that the Group does not invest in fixed assets in the form of trucks, ships and aeroplanes. Moreover, it is a clear goal for DSV to own no terminals or other logistics facilities of its own, and op-erational leases are therefore used to the widest extent possible.
BuSiNESS pROCESSESEffective and efficient business processes are essential to satisfactory earnings in a competitive market characterised by low margins. The continued development and optimi-sation of processes are therefore a vital element of the corporate strategy to ensure that IT platforms support the day-to-day operations in the best possible way.
IT systems are also a pivotal element of the services of-fered by DSV to its customers, and it is therefore crucial that the systems are reliable and meet customer require-ments.
Long-term financial targetsManagement has a clear goal of maximising the return on invested capital (ROIC). This objective is to be achieved through increased earnings and a reduction of invested capital. This focus is reflected in the Group’s financial and capital structure targets and priorities for the use of free cash flow.
fREiGhT VOLuME GROwTh
The demand for transport and logistics solutions are ex-pected to continue to exceed the general economic growth rate in the coming years. DSV aims to gain market share in all markets of the Group.The Air & Sea Division is measured against the global mar-kets, whereas Road and Solutions are measured against the European market.
EARNiNGS MARGiNS ANd ROiC
DSV air & Sea road SolutionsEBITA margin 7% 7-8% 5% 7%Conversion ratio 30% 35% 25% 25%ROIC before tax 25% 25% 25% 20%
The financial targets are unchanged relative to the 2011 Annual Report, and the Group expects to achieve the tar-gets within 3-4 years. The targets are based on expecta-
CuSTOMER fOCuSFor DSV, the provision of quality services at competitive prices is key to creating supply chain value for its custom-ers. Therefore the Group has constant focus on optimising its services to always offer market-leading services of a consistent quality.
The customer segment of small and medium-sized en-terprises is a strong vertical of DSV, and the Group aims to expand its market share in this segment. This objective is supported by targeted local sales efforts in the individual countries and a continued focus on product and service development.
Additionally, the Group aims to increase its market share among large, multinational customers. This objective is ad-dressed by the establishment of Global Accounts, a special department for large customers, the role of which is to support the sales efforts and services targeted at this seg-ment in cooperation with the rest of the organisation. Over the last couple of years the focus on the large global enter-prises has yielded positive results and this segment is still being developed.
Particularly the large, multinational customers demand transport and logistics solutions tailored to their individual business areas. Management has therefore decided to focus the sales efforts on a number of areas in which the Group has a particularly strong product and deep insight into customer needs. The relevant areas include the auto-motive, medical and aviation industries and more special-ised fields such as the wind energy industry and logistics services for the national defence forces of a number of countries.
GROwThAs a world leader in its field, DSV must gain market shares over time. DSV aims to achieve organic growth above the market growth rate in the markets in which the Group op-erates through targeted sales efforts and strong products.
In addition to organic growth, DSV aims to create growth through business acquisitions which can add further econo-mies of scale and strengthen its global network. The Group has a positive track record when it comes to the efficient and succesful integration of acquirees. Management in-tends to utilise this capacity in case of any attractive acqui-sition opportunities in future.
The primary acquisition targets are air and sea freight providers which can strengthen the overall market posi-tion of the Air & Sea Division and increase the exposure in markets outside of Europe. For the Road and Solutions Divi-sions, bolt-on acquisitions may become relevant.
ORGANiSATiONDSV’s corporate structure builds on the three Divisions and is characterised by a flat, decentralised organisational structure. The individual national managements are respon-sible for their respective operating activities and adminis-tration according to the guidelines communicated by Divi-sion and Group Managements.
The decentralised structure makes it possible to act in consideration of local market conditions, culture and lan-guage. In addition, the national managements are close
8 DSV 2012 annual report – management ’S Commentary – Str ategy anD finanCial targetS
tions of stable economic development in Europe and glob-ally during the period.
As previously stated, the Group intends to achieve growth through acquisitions and organic growth, both of which are to support the realisation of the financial targets. Acquisitions and other investments are therefore always compared to the targets, and investments are made in the activity areas with the highest expected return.
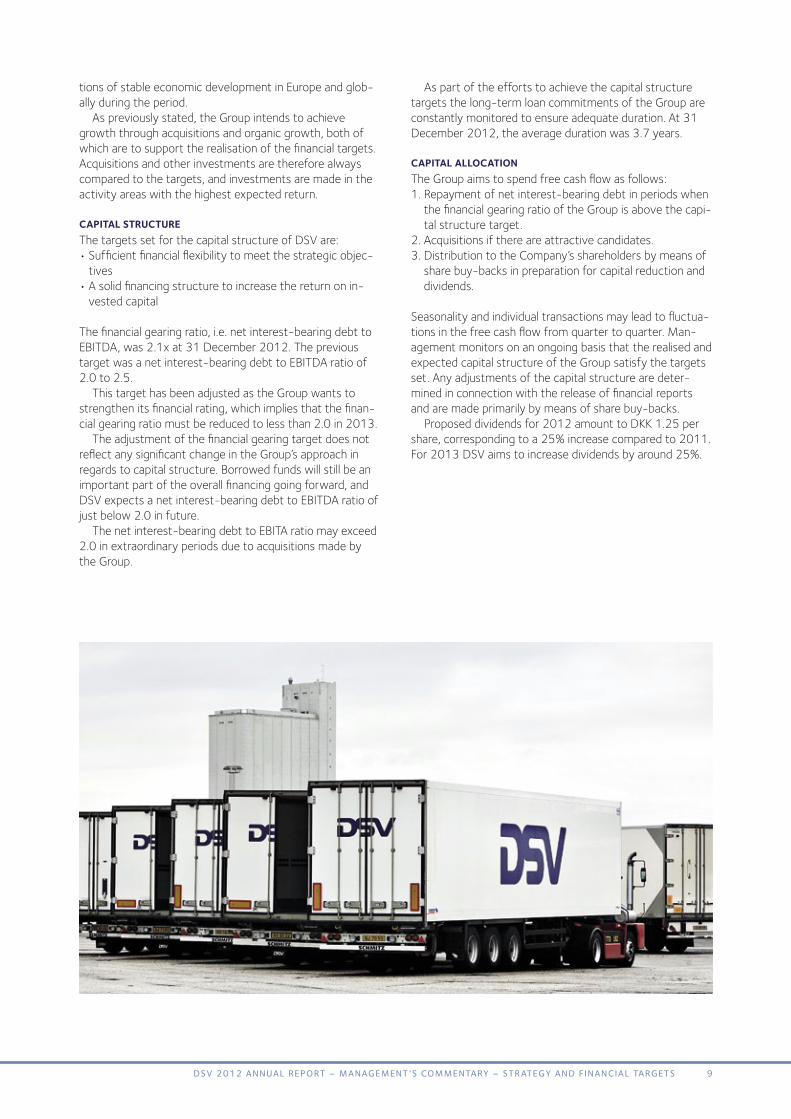
CApiTAL STRuCTuRE The targets set for the capital structure of DSV are:• Sufficient financial flexibility to meet the strategic objec-
tives• A solid financing structure to increase the return on in-
vested capital
The financial gearing ratio, i.e. net interest-bearing debt to EBITDA, was 2.1x at 31 December 2012. The previous target was a net interest-bearing debt to EBITDA ratio of 2.0 to 2.5.
This target has been adjusted as the Group wants to strengthen its financial rating, which implies that the finan-cial gearing ratio must be reduced to less than 2.0 in 2013.
The adjustment of the financial gearing target does not reflect any significant change in the Group’s approach in regards to capital structure. Borrowed funds will still be an important part of the overall financing going forward, and DSV expects a net interest-bearing debt to EBITDA ratio of just below 2.0 in future.
The net interest-bearing debt to EBITA ratio may exceed 2.0 in extraordinary periods due to acquisitions made by the Group.
As part of the efforts to achieve the capital structure targets the long-term loan commitments of the Group are constantly monitored to ensure adequate duration. At 31 December 2012, the average duration was 3.7 years.
CApiTAL ALLOCATiONThe Group aims to spend free cash flow as follows:1. Repayment of net interest-bearing debt in periods when
the financial gearing ratio of the Group is above the capi-tal structure target.
2. Acquisitions if there are attractive candidates.3. Distribution to the Company’s shareholders by means of
share buy-backs in preparation for capital reduction and dividends.
Seasonality and individual transactions may lead to fluctua-tions in the free cash flow from quarter to quarter. Man-agement monitors on an ongoing basis that the realised and expected capital structure of the Group satisfy the targets set. Any adjustments of the capital structure are deter-mined in connection with the release of financial reports and are made primarily by means of share buy-backs.
Proposed dividends for 2012 amount to DKK 1.25 per share, corresponding to a 25% increase compared to 2011. For 2013 DSV aims to increase dividends by around 25%.
9DSV 2012 annual report – management ’S Commentary – Str ategy anD finanCial targetS
GROSS pROfiT
■ Grossprofit Conversionratio
DKKm %
20092008 2010 2011 20120
2,000
4,000
6,000
8,000
10,000
0
10
20
30
40
50
EBiTA
■ EBITA EBITAmargin
DKKm %
20092008 2010 2011 20120
500
1,000
1,500
2,000
2,500
0
2
4
6
8
10
REVENuE
DKKm
20092008 2010 2011 20120
10,000
20,000
30,000
40,000
50,000
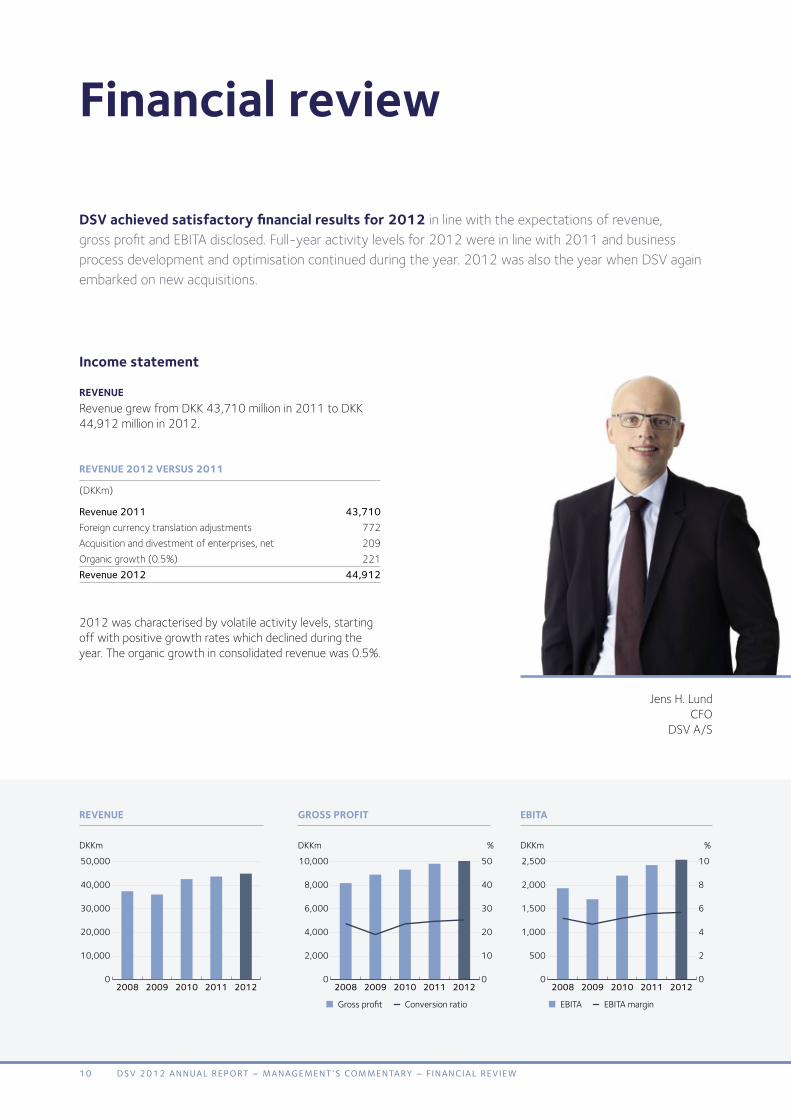
dSV achieved satisfactory financial results for 2012 in line with the expectations of revenue, gross profit and EBITA disclosed. Full-year activity levels for 2012 were in line with 2011 and business process development and optimisation continued during the year. 2012 was also the year when DSV again embarked on new acquisitions.
Jens H. LundCFO
DSV A/S
financial review
income statement
REVENuERevenue grew from DKK 43,710 million in 2011 to DKK 44,912 million in 2012.
REVENuE 2012 VERSuS 2011
(DKKm)
revenue 2011 43,710Foreign currency translation adjustments 772Acquisition and divestment of enterprises, net 209Organic growth (0.5%) 221revenue 2012 44,912
2012 was characterised by volatile activity levels, starting off with positive growth rates which declined during the year. The organic growth in consolidated revenue was 0.5%.
10 DSV 2012 annual report – management ’S Commentary – finanCial reView

NuMBER Of EMpLOYEES
Number
20092008 2010 2011 20120
6,000
12,000
18,000
24,000
30,000
ROiC ANd iNVESTEd CApiTAL iNCLudiNG GOOdwiLL ANd CuSTOMER RELATiONShipS
■ Investedcapital ROICincl.goodwillincl.goodwilland andcustomercustomerrelationships relationships
DKKm %
20092008 2010 2011 20120
3,000
6,000
9,000
12,000
15,000
0
10
20
30
40
50
GROSS pROfiTThe consolidated gross profit came to DKK 10,054 million for 2012 against DKK 9,819 million for 2011. The Group thereby more than maintained profit in a difficult market. Organic growth for 2012 was 0.3% and the gross margin was 22.4% against 22.5% for 2011.
GROSS pROfiT 2012 VERSuS 2011
(DKKm)
gross profit 2011 9,819Foreign currency translation adjustments 195Acquisition and divestments of enterprises, net 6Organick growth (0.3%) 34gross profit 2012 10,054
Gross profit was affected by positive exchange rate adjust-ments. This primarily affected the Air & Sea Division.
The Air & Sea Division reported organic growth in gross profit of 1.2%, mainly as a result of an improved average profit per unit.
The Road Division reported gross profit in line with 2011 (organic growth of 0.6%) in a very competitive market. A change in product mix had a negative impact on the gross profit.
The gross profit of the Solutions Division declined (nega-tive organic growth of 3.7%), mainly due to fierce price competition and costs related to the implementation of new customer contracts.
OThER ExTERNAL ExpENSESOther external expenses amounted to DKK 2,116 million in 2012 against DKK 2,092 million in 2011, corresponding to an increase of 1.1%. Adjusted for exchange rate move-ments and acquisitions made in Q4 2012 other external expenses decreased by 1.4% compared to 2011.
STAff COSTSStaff costs amounted to DKK 4,864 million in 2012 against DKK 4,752 million in 2011, corresponding to an increase of 2.4%. Adjusted for exchange rate movements and acquisi-tions made in Q4 2012, staff costs decreased by 1.6% on 2011 partly as a result of project “Operational Excellence”, which was launched in 2012. This project resulted in in-creased productivity enabling the Group to maintain the
Diluted adjusted earnings per share increased by approx. 21% on 2011
11DSV 2012 annual report – management ’S Commentary – finanCial reView

number of staff on level with that at end of 2011 despite the acquisitions made.
Staff costs were affected by non-cash costs for share-based payments of DKK 40 million in 2012 against DKK 34 million in 2011.
AMORTiSATiON ANd dEpRECiATiONFor 2012, amortisation and depreciation amounted to DKK 534 million against DKK 549 million for 2011. This item in-cludes amortisation of software in the amount of DKK 131 million for 2012 against DKK 112 million for 2011. As a general rule, new software investments will be made when amortised. This item also includes amortisation of customer relationships in the amount of DKK 109 million for 2012 against DKK 107 million for 2011. Amortisation of custom-er relationships is a non-cash cost and no re-investments are made.
OpERATiNG pROfiT BEfORE SpECiAL iTEMS (EBiTA)Consolidated EBITA was DKK 2,540 million for 2012 against DKK 2,426 million for 2011. The organic growth was 1.7%.
EBITA was positively affected by the increased gross profit without a corresponding increase in overheads. The conversion ratio thereby increased to 25.3% for 2012 against 24.7% for 2011, mainly as a result of the stream-lining of workflows and business processes. The EBITA mar-gin was 5.7% for 2012 against 5.6% for 2011.
EBiTA 2012 VERSuS 2011
(DKKm) EBITA 2011 2,426Foregn currency translation adjustments 78Acquisition and divestment of enterprises, net (7)Organic growth (1.7%) 43eBita 2012 2,540
Adjusted for non-cash items relating to amortisation of customer relationships and costs of share-based payments, the adjusted consolidated EBITA came to DKK 2,689 million for 2012 against DKK 2,567 million for 2011.
The Air & Sea Division reported EBITA of DKK 1,412 mil-lion against DKK 1,355 million for 2011. EBITA increased mainly as a result of positive foreign currency translation adjustments. The organic growth was -0.5%.
The Road Division reported EBITA of DKK 933 million against DKK 834 million for 2011. The organic growth was 11.1%. The higher EBITA was mainly a result of increased productivity as consignment volumes remained almost un-changed.
The Solutions Division reported EBITA of DKK 250 million against DKK 278 million for 2011. The organic growth was -10.7%. Costs related to the implementation of large cus-tomers impacted negatively on EBITA results.
fiNANCiALS
For 2012, net financials constituted an expense of DKK 246 million against DKK 431 million for 2011.
Financials developed as expected with interest rates be-low 2011, however the item was also affected by a large one-off exchange gain in connection with internal restruc-turing initiatives. In 2011, financials were affected by a one-off interest expense related to a tax case ruling.
SpECiAL iTEMS, NETSpecial items netted DKK 275 million for 2012 and relate mainly to the allocation of a non-recurring expense in con-nection with the ongoing restructuring plan “Operational Excellence” as described in the 2011 Annual Report and costs related to the integration of acquirees. Costs related to “Operational Excellence” amounted to DKK 258 million.
pROfiT BEfORE TAxProfit before tax came to DKK 2,019 million for 2012 against DKK 1,995 million for 2011. The increase is mainly due to improved operating profit before special items and a reduction in financials, which were to a great extent coun-terbalanced by special items.
TAx ON pROfiT fOR ThE YEARThe effective tax rate was 29.2% for 2012, which is in line with disclosed expectations and an increase compared to 2011, when the effective tax rate was 27.4%. The 2012 tax rate was affected by isolated internal restructuring initiatives and non-deductible expenses related to the re-structuring plan.
pROfiT fOR ThE YEARProfit for the year came to DKK 1,430 million for 2012 against DKK 1,449 million for 2011. Profit declined mainly due to special items and increased tax costs, which were counterbalanced to a certain extent by the improved oper-ating profit and the reduction in financials.
Adjusted profit for the year came to DKK 1,745 million for 2012 against DKK 1,546 million for 2011.
12 DSV 2012 annual report – management ’S Commentary – finanCial reView
diLuTEd AdjuSTEd EARNiNGS pER ShARE
Diluted adjusted earnings per share came to DKK 9.5 for 2012 against DKK 7.8 for 2011, corresponding to an in-crease of approx. 21%. The increase was due to the higher adjusted profit and the lower number of outstanding shares as a result of the share buy-backs made.
Balance sheetThe balance sheet total at 31 December 2012 was DKK 22,794 million against DKK 22,734 million at year-end 2011.
NON-CuRRENT ASSETSNon-current assets stood at DKK 13,546 million at 31 December 2012 against DKK 13,786 million at year-end 2011.
NET wORKiNG CApiTAL The Group’s funds tied up in net working capital came to DKK 307 million at 31 December 2012 against DKK 1 mil-lion at 31 December 2011. Net working capital was affect-ed by the recent acquisitions and increasing pressure from customers as well as suppliers regarding payment terms.
Net working capital as a percentage of revenue was ap-prox. 0.7% against 0.0% for 2011.
EquiTYThe equity interest of DSV shareholders came to DKK 5,348 million at 31 December 2012, corresponding to a solvency ratio of 23.5%. At 31 December 2011, equity was DKK 5,279 million, corresponding to a solvency ratio of 23.2%. Equity was mainly affected by the profit for the year, share buy-backs, distribution of dividends and actu-arial gains/losses on pension plans.
dEVELOpMENT iN EquiTY
(DKKm) 2011 2012equity at 1 January 6,549 5,279Net profit for the period 1,440 1,427Dividends distributed (105) (190)Purchase of treasury shares (2,505) (1,303) Sale of treasury shares 87 219Actuarial gains/losses on pension plans (171) (115)Tax on changes in equity (30) 54Other adjustments, net 14 (23)equity at 31 December 5,279 5,348
NET iNTEREST-BEARiNG dEBTNet interest-bearing debt amounted to DKK 6,561 million at 31 December 2012 against DKK 6,585 million at 31 December 2011.
At year-end 2012, the financial gearing ratio of the Group was 2.1 and in line with the ratio at year-end 2011.
Loans and credit facilities amounted to DKK 6,773 million of the total net interest-bearing debt, DKK 5,911 million of which was long-term debt. Long-term loans amounted to DKK 5,838 million, the next refinancing being due in 2014.
At year end 2012, DSV issued an eight-year corporate bond of DKK 750 million. Undrawn loan and credit facilities amounted to DKK 1,475 million at 31 December 2012. At 31 December 2012, the total duration of the Group’s long-term loan commitments was 3.7 years.
In 2012, the average interest rate payable for the long-term loans of the Group was 2.8% as against 4.2% in 2011.
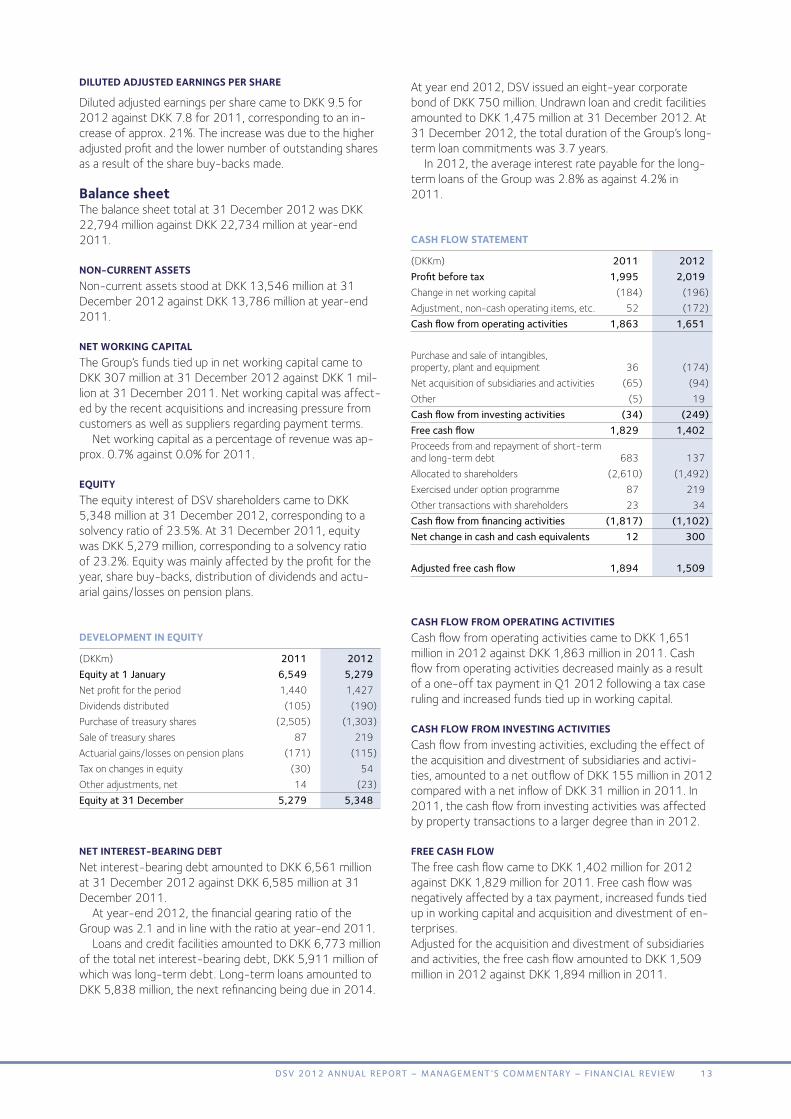
CASh fLOw STATEMENT
(DKKm) 2011 2012profit before tax 1,995 2,019Change in net working capital (184) (196)Adjustment, non-cash operating items, etc. 52 (172)Cash flow from operating activities 1,863 1,651
Purchase and sale of intangibles, property, plant and equipment 36 (174)Net acquisition of subsidiaries and activities (65) (94)Other (5) 19Cash flow from investing activities (34) (249)free cash flow 1,829 1,402Proceeds from and repayment of short-term and long-term debt 683 137Allocated to shareholders (2,610) (1,492)Exercised under option programme 87 219Other transactions with shareholders 23 34Cash flow from financing activities (1,817) (1,102)net change in cash and cash equivalents 12 300 adjusted free cash flow 1,894 1,509
CASh fLOw fROM OpERATiNG ACTiViTiESCash flow from operating activities came to DKK 1,651 million in 2012 against DKK 1,863 million in 2011. Cash flow from operating activities decreased mainly as a result of a one-off tax payment in Q1 2012 following a tax case ruling and increased funds tied up in working capital.
CASh fLOw fROM iNVESTiNG ACTiViTiESCash flow from investing activities, excluding the effect of the acquisition and divestment of subsidiaries and activi-ties, amounted to a net outflow of DKK 155 million in 2012 compared with a net inflow of DKK 31 million in 2011. In 2011, the cash flow from investing activities was affected by property transactions to a larger degree than in 2012.
fREE CASh fLOwThe free cash flow came to DKK 1,402 million for 2012 against DKK 1,829 million for 2011. Free cash flow was negatively affected by a tax payment, increased funds tied up in working capital and acquisition and divestment of en-terprises. Adjusted for the acquisition and divestment of subsidiaries and activities, the free cash flow amounted to DKK 1,509 million in 2012 against DKK 1,894 million in 2011.
13DSV 2012 annual report – management ’S Commentary – finanCial reView
CASh fLOw fROM fiNANCiNG ACTiViTiES
Cash flow from financing activities constituted a net out-flow of DKK 1,102 million in 2012 against a net outflow of DKK 1,817 million in 2011. The share buy-backs total-ling DKK 1,302 million and distribution of dividends of DKK 190 million had a significant impact on the cash flow from financing activities for 2012.
NET ChANGE iN CASh ANd CASh EquiVALENTSThe net change in cash and cash equivalents was a net in-flow of DKK 300 million, and foreign exchange translation adjustments constituted a loss of DKK 115 million; accord-ingly, the Group’s cash and cash equivalents amounted to DKK 552 million at year-end 2012 against DKK 367 million in 2011.
iNVESTEd CApiTAL iNCLudiNG GOOdwiLL ANd CuSTOMER RELATiONShipS
The invested capital including goodwill and customer rela-tionships amounted to DKK 11,953 million at 31 December 2012 against DKK 12,030 million at 31 December 2011.
RETuRN ON iNVESTEd CApiTAL (ROiC BEfORE TAx iNCLudiNG GOOdwiLL ANd CuSTOMER RELATiONShipS)
In 2012, return on invested capital was 21.2% against 19.7% in 2011. The increase is due to the higher EBITA and the decrease in average invested capital.
EVENTS AfTER ThE REpORTiNG dATE No material events have occurred after the end of the fi-nancial year.
OuTLOOK fOR 2013The outlook for 2013 is affected by the general uncertain-ty about macroeconomic developments. However, a stable development is expected in the markets in which the Group operates.
The separate divisional reviews provide additional infor-mation on expected market developments.
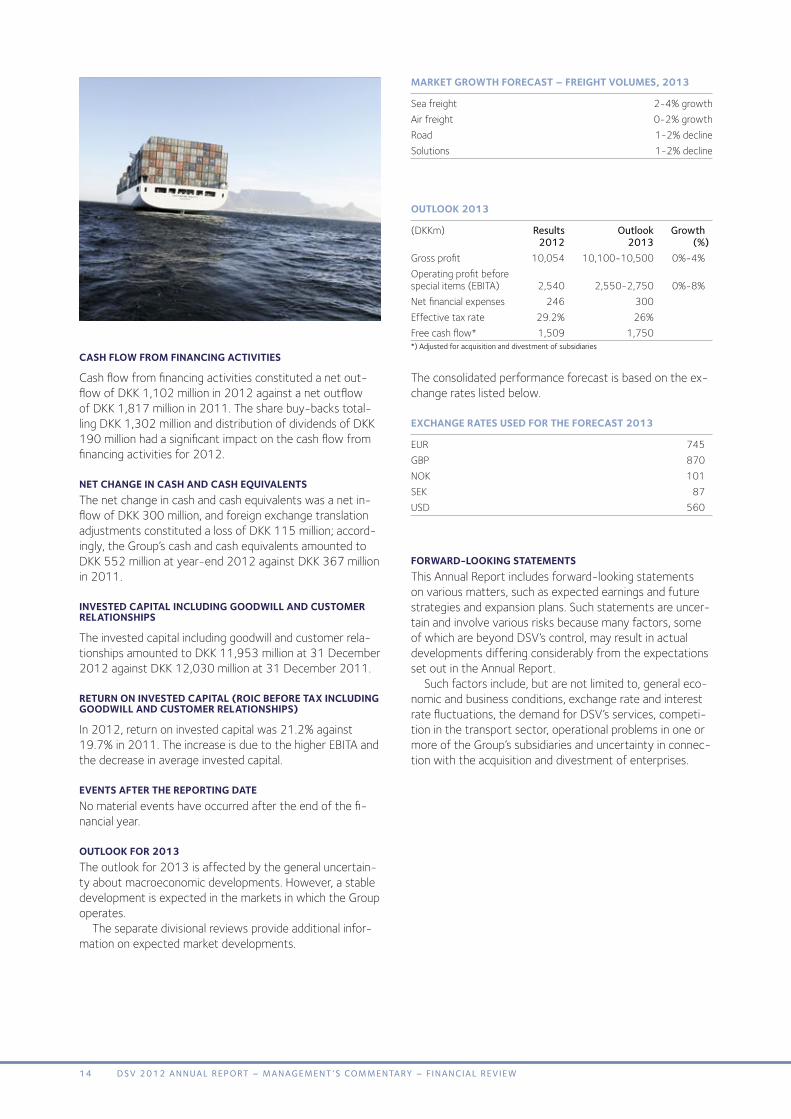
MARKET GROwTh fORECAST – fREiGhT VOLuMES, 2013
Sea freight 2-4% growthAir freight 0-2% growthRoad 1-2% declineSolutions 1-2% decline
OuTLOOK 2013
(DKKm) results outlook growth 2012 2013 (%)Gross profit 10,054 10,100-10,500 0%-4%Operating profit before special items (EBITA) 2,540 2,550-2,750 0%-8%Net financial expenses 246 300 Effective tax rate 29.2% 26% Free cash flow* 1,509 1,750 *)Adjustedforacquisitionanddivestmentofsubsidiaries
The consolidated performance forecast is based on the ex-change rates listed below.
ExChANGE RATES uSEd fOR ThE fORECAST 2013
EUR 745GBP 870NOK 101SEK 87USD 560
fORwARd-LOOKiNG STATEMENTSThis Annual Report includes forward-looking statements on various matters, such as expected earnings and future strategies and expansion plans. Such statements are uncer-tain and involve various risks because many factors, some of which are beyond DSV’s control, may result in actual developments differing considerably from the expectations set out in the Annual Report.
Such factors include, but are not limited to, general eco-nomic and business conditions, exchange rate and interest rate fluctuations, the demand for DSV’s services, competi-tion in the transport sector, operational problems in one or more of the Group’s subsidiaries and uncertainty in connec-tion with the acquisition and divestment of enterprises.
14 DSV 2012 annual report – management ’S Commentary – finanCial reView

fiNANCiAL hiGhLiGhTS - quARTERLY OVERViEw* 2011 2012 Q1 Q2 Q3 Q4 Q1 Q2 Q3 Q4
Income statement (DKKm) Revenue 10,793 11,089 10,905 10,923 10,819 11,372 11,313 11,408Gross profit 2,372 2,500 2,450 2,497 2,435 2,578 2,529 2,512EBITA 534 649 654 589 555 687 691 607Special items - - - - (251) - (3) (21)Operating profit (EBIT) 534 649 654 589 304 687 688 586Net financial expenses 107 107 93 124 81 75 80 10Profit before tax 427 542 561 465 223 612 608 576Profit for the year 313 390 407 339 162 430 436 402Gross margin 22.0% 22.5% 22.5% 22.9% 22.5% 22.7% 22.4% 22.0%EBITA margin 4.9% 5.9% 6.0% 5.4% 5.1% 6.0% 6.1% 5.3%Conversion ratio 22.5% 26.0% 26.7% 23.6% 22.8% 26.6% 27.3% 24.2%
Balance sheet (DKKm) Net working capital 141 241 101 1 (110) 96 210 307 Net interest-bearing debt 6,050 6,018 6,445 6,585 6,584 6,713 6,478 6,561
Cash flows (DKKm) Operating activities 540 163 638 522 393 336 407 515Investing activities (24) 400 (186) (224) (99) (102) 159 (207)Free cash flow 516 563 452 298 294 234 566 308
Segment information Air & Sea Revenue 4,665 4,743 4,742 4,776 4,414 5,048 5,236 5,157Gross profit 965 1,020 1,027 1,078 998 1,088 1,106 1,077EBITA 291 345 356 363 298 376 397 341Gross margin 20.7% 21.5% 21.7% 22.6% 22.6% 21.6% 21.1% 20.9%EBITA margin 6.2% 7.3% 7.5% 7.6% 6.8% 7.4% 7.6% 6.6%Conversion ratio 30.2% 33.8% 34.7% 33.7% 29.9% 34.6% 35.9% 31.7% Road Revenue 5,594 5,815 5,646 5,586 5,785 5,756 5,494 5,619Gross profit 1,047 1,120 1,058 1,055 1,099 1,133 1,054 1,060EBITA 179 245 226 184 220 264 234 215Gross margin 18.7% 19.3% 18.7% 18.9% 19.0% 19.7% 19.2% 18.9%EBITA margin 3.2% 4.2% 4.0% 3.3% 3.8% 4.6% 4.3% 3.8%Conversion ratio 17.1% 21.9% 21.4% 17.4% 20.0% 23.3% 22.2% 20.3% Solutions Revenue 1,248 1,259 1,231 1,271 1,285 1,275 1,286 1,335Gross profit 369 372 370 372 351 361 369 357EBITA 69 65 71 73 55 59 69 67Gross margin 29.6% 29.5% 30.1% 29.3% 27.3% 28.3% 28.7% 26.7%EBITA margin 5.5% 5.2% 5.8% 5.7% 4.3% 4.6% 5.4% 5.0%Conversion ratio 18.7% 17.5% 19.2% 19.6% 15.7% 16.3% 18.7% 18.8%
*) For a definition of the financial highlights, please refer to page 75.
15DSV 2012 annual report – management ’S Commentary – finanCial reView

Jørgen MøllerManaging Director Air & Sea Division
The Air & Sea division organises transports of cargo by air and sea. The Division offers conventional freight services through its global network supplemented by a Project Department. The Division has approx. 6,000 employees.
dSV Air & Sea
GROSS pROfiT
■ Grossprofit Conversionratio
DKKm %
20092008 2010 2011 20120
1,000
2,000
3,000
4,000
5,000
0
10
20
30
40
50
EBiTA
■ EBITA EBITAmargin
DKKm %
20092008 2010 2011 20120
300
600
900
1,200
1,500
0
2
4
6
8
10
REVENuE
DKKm
20092008 2010 2011 20120
5,000
10,000
15,000
20,000
25,000
Market developmentThe overall development in global freight volumes in 2012 has been characterised by weaker than expected volumes, both for sea and air freight.
Global sea freight volumes started 2012 on a positive note with growth rates for the market around 5%, but dur-ing the year the market lost momentum.
Growth in global air freight has been in negative terri-tory in 2012, and only at the end of the year the trend has improved slightly.
The sea freight volumes measured in containers (TEUs) realised by the Division was on level with 2011, while the market in general is estimated to have increased by 0-2%.
GROwTh iN fREiGhT VOLuMES
Q4 Q4 2012 2012 2012 2012 DSV market DSV market
Sea freight - TEUs 0% -1-2% 0% 0-2%Air freight - tonnes -2% -1-3% -1% 1-3%Marketgrowthratesarebasedonownestimates.
16 DSV 2012 annual report – management ’S Commentary – DSV air & Sea

DSV has relatively high exposure to Asia-Europe, which ac-counts for approx. 40% of DSV’s total sea freight volume. Due to declining import in Europe the market conditions on this trade lane were challenging in 2012.
Air freight volumes (tonnes) recorded by the Division in 2012 declined by 1% compared to 2011, while the market in general is estimated to have contracted 1-3%. In a chal-lenging market the Division has been successful in gaining market share, mainly due to strong development in DSV’s exports activities out of Europe and USA.
In spite of relatively weak volumes and influx of new transport capacity, the sea freight rates increased dramati-cally in the beginning of 2012. During second half of 2012 the rates have declined, and at the end of the year new rate increases have been announced and fully or partly im-plemented by the shipping companies.
The air freight market was less turbulent, however still impacted by rate fluctuation.
Strategic and operational highlightsWith the overall target of gaining market share the Division has continued the development of products and services within both sea and air freight.
In response to increasing customer demands for industry-specific logistics services, the Division has launched initiatives to optimise product development and sales efforts within selected focus segments and industry verticals, e.g. automo-tive, aerospace, renewable energy and military of defence.
The Division’s global network has been strengthened in 2012. With the acquisition of Dubai based Swift Freight, DSV Air & Sea is now present in 15 African countries and has a good platform for taking part in future growth on the continent.
Furthermore, the Division has established a subsidiary in Brazil and obtained full ownership of the DSV-GL joint venture in Chile, Argentina and Peru. These initiatives bring DSV closer to the target of having a full Air & Sea network in Latin America.
The stronger presence in emerging markets will also en-able DSV to take part in the expected growth in project logistics, e.g., for the energy sector, industrial projects and infrastructure. DSV Air & Sea is constantly alert to attrac-tive bolt-on acquisition opportunities to supplement the existing network and support growth plans.
The Division expects to finalise the roll-out of its global Transport Management System in 2013. The implementation was initiated in 2011 and has proceeded as planned. The new system has already had positive impact on the productivity in the countries where the system has been implemented.
NuMBER Of EMpLOYEES
Number
20092008 2010 2011 20120
2,000
4,000
6,000
8,000
10,000
ROiC ANd iNVESTEd CApiTAL iNCLudiNG GOOdwiLL ANd CuSTOMER RELATiONShipS
■ Investedcapital ROICincl.goodwillincl.goodwilland andcustomercustomerrelationships relationships
DKKm %
20092008 2010 2011 20120
1,500
3,000
4,500
6,000
7,500
0
10
20
30
40
50
GEOGRAphiC ExpOSuREDivision revenue can be broken down by the following geo-graphical areas:
■ Nordiccountries–14%
■ SouthernEurope–21%
■ OtherEurope–28%
■ Americas–16%
■ Asia–21%
The Division’s global network has been strengthened in 2012
17DSV 2012 annual report – management ’S Commentary – DSV air & Sea

financial results for 2012
CONdENSEd iNCOME STATEMENT
(DKKm) 2011 2012
Revenue 18,926 19,855Direct costs 14,836 15,586Gross profit 4,090 4,269 Other external expenses 863 909Staff costs 1,740 1,814EBITDA 1,487 1,546 Amortisation and depreciation 79 81Amortisation of customer relationships 53 53EBITA 1,355 1,412 Gross margin (%) 21.6 21.5Conversion ratio (%) 33.1 33.1EBITA margin (%) 7.2 7.1 Number of employees at year-end 6,092 6,331 Total invested capital (DKKm) 6,372 6,303Net working capital (DKKm) 818 943ROIC (%) 20.9 22.3
For 2012, DSV Air & Sea recorded revenue of DKK 19,855 million against DKK 18,926 million for 2011. The organic growth was 1.0%.
Gross profit came to DKK 4,269 million for 2012 against DKK 4,090 million for 2011. The organic growth was 1.2% and was mainly attributable to increased average profit per unit (TEUs/tonnes) compared to 2011. The increased profit per unit mainly characterised the first half of 2012.
The gross margin was 21.5% for 2012 against 21.6% for 2011.
GROwTh
Foreign currency translation Acquisitions, Organic Organic Q4 adjustments net growth growth Q4 2011 (DKKm) (DKKm) (DKKm) (%) 2012
Revenue 4,776 132 114 135 2.7% 5,157Gross profit 1,078 25 10 (36) (3.2%) 1,077EBITA 363 12 (1) (33) (8.8%) 341 2011 2012
Revenue 18,926 562 176 191 1.0% 19,855Gross profit 4,090 125 4 50 1.2% 4,269EBITA 1,355 66 (2) (7) (0.5%) 1,412
EBITA was DKK 1,412 million for 2012 against DKK 1,355 million for 2011. The organic growth dropped by 0.5% for 2012.
The conversion ratio was 33.1% for 2012, approximat-ing the level for 2011. The EBITA margin was 7.1% for 2012 against 7.2% for 2011. Conversion ratio and EBITA margin were negatively affected by acquisitions in Q4 2012.
The operating profit for 2012 was impacted by a strong development in North America and a marginal decline in Eu-rope. The results in Europe should be seen in the context of tough market conditions with weak import in most markets and strong competition. The results in North America and Asia are positively impacted by foreign currency translation.
financial targetsThe following long-term financial targets have been set for the Division:
target realised 2012
EBITA margin 7-8% 7.1%Conversion ratio 35% 33.1%ROIC - before tax 25% 22.3%
AiR & SEA SpLiT
Sea freight air freight
(DKKm) ytD 2011 ytD 2012 ytD 2011 ytD 2012
Revenue 10,590 11,621 8,336 8,234Direct costs 8,302 9,213 6,534 6,373gross profit 2,288 2,408 1,802 1,861
Gross margin (%) 21.6 20.7 21.6 22.6Volume (TEUs/Tonnes) 727,861 725,806 262,362 259,057
18 DSV 2012 annual report – management ’S Commentary – DSV air & Sea

Summary - q4 2012Air freight volumes dropped by 2% and sea freight volumes were on level with Q4 2011. The volume development for both air and sea freight is esti-mated to be in line with the market growth rate.
Gross profit amounted to DKK 1,077 million for Q4 2012 (2011: DKK 1,078 million). The organic growth declined by 3.2%. The Division maintained gross profit per sea freight unit on level with Q3 2012, however air freight volumes declined slightly as a result of increasing price competition.
EBITA was DKK 341 million for Q4 2012 (2011: DKK 363 million). The organic growth declined by 8.8%.
Outlook for 2013DSV expects that the global sea freight market will grow by approx. 2-4% in 2013, measured by volume, while the air freight market measured by volume is expected to increase 0-2%. Similar to 2012, the growth in Asia-Europe volumes is expected to remain below the global market develop-ment.
Management expects to achieve the goal of gaining market shares in the markets in which the Division oper-ates.
In accordance with the financial targets set for the Di-vision DSV Air & Sea is expected to increase earnings in 2013.
AiR & SEA SEGMENT iNfORMATiON
Revenue Gross profit EBITA EBITA margin Conversion ratio
(DKKm) 2011 2012 2011 2012 2011 2012 2011 2012 2011 2012
Europe 13,841 13,913 2,585 2,578 686 682 5.0 4.9 26.5 26.5Asia 4,142 4,666 845 930 384 393 9.3 8.4 45.4 42.3Americas 3,330 3,563 653 754 339 391 10.2 11.0 51.9 51.9Eliminations, etc. (2,387) (2,287) 7 7 (54) (54) - - - -total 18,926 19,855 4,090 4,269 1,355 1,412 7.2 7.1 33.1 33.1
19DSV 2012 annual report – management ’S Commentary – DSV air & Sea
Søren SchmidtManaging Director
Road Division
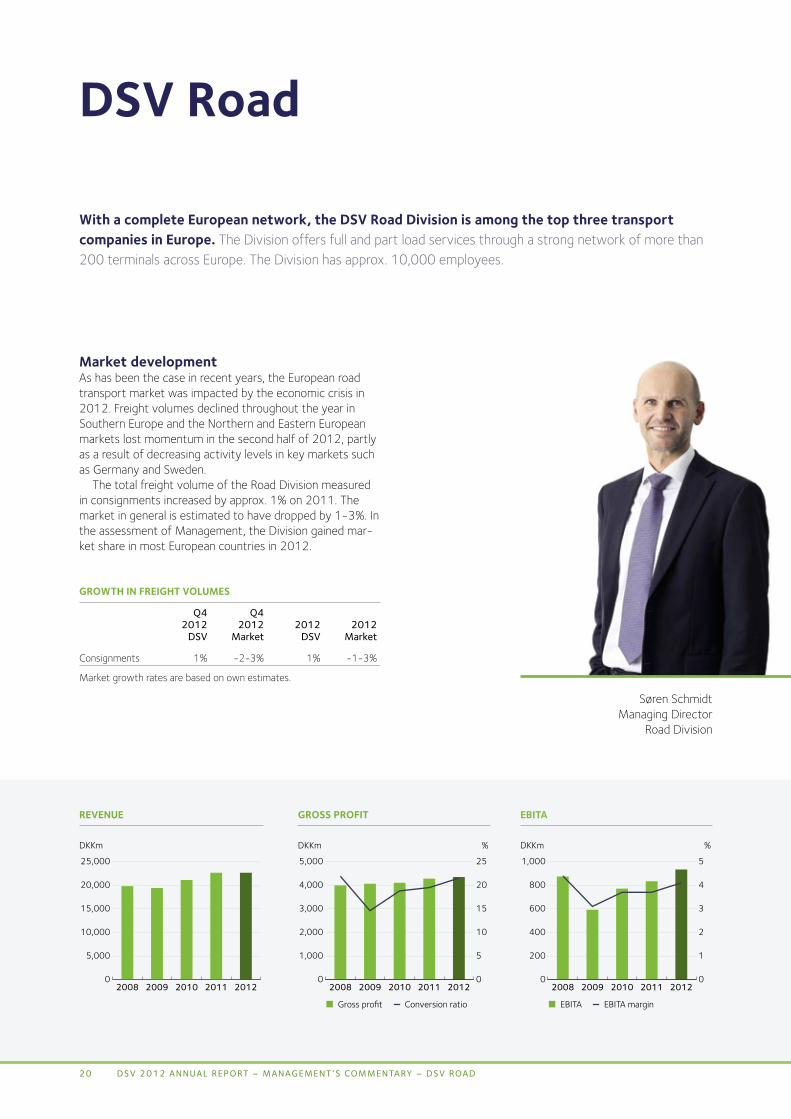
with a complete European network, the dSV Road division is among the top three transport companies in Europe. The Division offers full and part load services through a strong network of more than 200 terminals across Europe. The Division has approx. 10,000 employees.
dSV Road
GROSS pROfiT
■ Grossprofit Conversionratio
DKKm %
20092008 2010 2011 20120
1,000
2,000
3,000
4,000
5,000
0
5
10
15
20
25
EBiTA
■ EBITA EBITAmargin
DKKm %
20092008 2010 2011 20120
200
400
600
800
1,000
0
1
2
3
4
5
REVENuE
DKKm
20092008 2010 2011 20120
5,000
10,000
15,000
20,000
25,000
Market developmentAs has been the case in recent years, the European road transport market was impacted by the economic crisis in 2012. Freight volumes declined throughout the year in Southern Europe and the Northern and Eastern European markets lost momentum in the second half of 2012, partly as a result of decreasing activity levels in key markets such as Germany and Sweden.
The total freight volume of the Road Division measured in consignments increased by approx. 1% on 2011. The market in general is estimated to have dropped by 1-3%. In the assessment of Management, the Division gained mar-ket share in most European countries in 2012.
GROwTh iN fREiGhT VOLuMES
Q4 Q4 2012 2012 2012 2012 DSV market DSV market
Consignments 1% -2-3% 1% -1-3%
Market growth rates are based on own estimates.
20 DSV 2012 annual report – management ’S Commentary – DSV roaD

Overall, in terms of capacity there was a good balance be-tween supply and demand in the European road transport market in 2012. Due to the weak market development there was generally sufficient capacity among hauliers, and rates remained relatively stable during the year.
In terms of customers the market was characterised by fierce price competition, particularly in the second half of 2012.
Strategic and operational highlightsIn 2012, the Division focused on gaining market share both within international forwarding as well as national distribu-tion. This focus is reflected in the Division’s ongoing efforts to develop its transport service offerings: full loads, part loads and groupage loads.
2012 saw the launch of the new Road concept “DSV Daily Pallet”, offering customers daily departures from all DSV terminals to destinations throughout Europe. The Divi-sion also continued the work of developing services within specific segments, e.g., the automotive and retail industries.
In the assessment of Management, the Division gained market share in most European countries in 2012
NuMBER Of EMpLOYEES
Number
20092008 2010 2011 20120
2,500
5,000
7,500
10,000
12,500
ROiC ANd iNVESTEd CApiTAL iNCLudiNG GOOdwiLL ANd CuSTOMER RELATiONShipS
■ Investedcapital ROICincl.goodwillincl.goodwilland andcustomercustomerrelationships relationships
DKKm %
20092008 2010 2011 20120
1,500
3,000
4,500
6,000
7,500
0
5
10
15
20
25
DSV Road is constantly alert to attractive bolt-on ac-quisition opportunities to supplement the existing network and support growth plans. The acquisition of the freight forwarding activities of AWT Cechofracht in 2012 streng-thened the position of DSV Road in the Czech market and is a good example of a bolt-on acquisition.
■ Nordiccountries–42%
■ SouthernEurope–12%
■ OtherEurope–46%
GEOGRAphiC ExpOSuREDivision revenue can be broken down by the following geo-graphical areas:
21DSV 2012 annual report – management ’S Commentary – DSV roaD

financial results
CONdENSEd iNCOME STATEMENT
(DKKm) 2011 2012
Revenue 22,641 22,654Direct costs 18,361 18,308Gross profit 4,280 4,346 Other external expenses 1,034 1,020Staff costs 2,258 2,258EBITDA 988 1,068 Amortisation and depreciation 137 117Amortisation of customer relationships 17 18EBITA 834 933 Gross margin (%) 18.9 19.2Conversion ratio (%) 19.5 21.5EBITA margin (%) 3.7 4.1 Number of employees at year-end 9,806 9,730 Total invested capital (DKKm) 3,734 3,786Net working capital (DKKm) (376) (396)ROIC (%) 21.5 24.8
DSV Road delivered revenue of DKK 22,654 million for 2012 against DKK 22,641 million for 2011. For the period under review, the organic growth declined by 1.0%.
Gross profit came to DKK 4,346 million for 2012 against DKK 4,280 million for 2011. The organic growth was 0.6%.
While the number of consignments increased slightly in 2012, both revenue and gross profit were affected by severe price competition in the second half of 2012 in par-ticular. In addition, the product mix changed in 2012 and the Division has gained market share in national transport and distribution, which is characterised by lower average revenue and gross profit per consignment compared to in-ternational consignments.
The gross margin was 19.2% for 2012 against 18.9% for 2011.
Through effective cost management and improved productivity the Division delivered a considerable increase in operating profit for 2012
EBITA was DKK 933 million for 2012 against DKK 834 million for 2011. For the period under review, the organic growth was 11.1%.
The EBITA margin was 4.1% for 2012 against 3.7% for 2011. The conversion ratio was 21.5% for 2012 against 19.5% for 2011.
Through effective cost management and improved pro-ductivity the Division delivered a considerable increase in operating profit for 2012, partly as a result of the ongoing adjustment of overheads (“Operational Excellence”) dur-ing the year. Division results also improved in some of the countries which have reported disappointing earnings in previous years.
financial targetsThe following long-term financial targets have been set for the Division:
Target Realised 2012
EBITA margin 5% 4.1%Conversion ratio 25% 21.5%ROIC - before tax 25% 24.8%
MARKET dEVELOpMENT
Foreign currency Q4 translation Acquisitions, Organic Organic Q4 2011 adjustments net growth growth 2012 (DKKm) (DKKm) (DKKm) (DKKm) (%) (DKKm)
Revenue 5,586 106 33 (106) (1.9%) 5,619Gross profit 1,055 18 2 (15) (1.4%) 1,060EBITA 184 6 (5) 30 16.2% 215 2011 2012
Revenue 22,641 214 33 (234) (1.0%) 22,654Gross profit 4,280 37 2 27 0.6% 4,346EBITA 834 11 (5) 93 11.1% 933
22 DSV 2012 annual report – management ’S Commentary – DSV roaD

Outlook for 2013DSV expects that the European road transport market will decrease slightly by 1-2% compared to 2012. Although there may be regional differences, overall stagnation or re-cession is expected across most of Europe.
Operating in a stagnating environment, the Division aims to use its strong position and market leading service offer-ings to gain additional market share.
The Division will maintain the focus on productivity op-timisation and adjustment of overheads in the individual countries.
On this basis, the Division is expected to achieve earn-ings growth in 2013.
Summary – q4 2012The number of consignments increased by approx. 1% in Q4 2012, while the market in general is esti-mated to have decreased 2-3%.
Gross profit amounted to DKK 1,060 million for Q4 2012 (2011: DKK 1,055 million). The organic growth declined by 1.4%, mainly as a result of fierce price competition in the market and a change in product mix, with a larger proportion of national distribution.
EBITA amounted to DKK 215 million for Q4 2012 (2011: DKK 184 million). The organic growth was 16.2%. The improved EBITA mainly reflects the ad-justment of overheads and increased efficiency.
23DSV 2012 annual report – management ’S Commentary – DSV roaD

dSV Solutions specialises in logistics services across the entire supply chain, including freight management, customs clearance, warehousing and distribution, information management and e-business support. The Division has approx. 5,000 employees.
dSV Solutions
Brian EjsingManaging Director Solutions Division
GROSS pROfiT
■ Grossprofit Conversionratio
DKKm %
20092008 2010 2011 20120
300
600
900
1,200
1,500
0
5
10
15
20
25
EBiTA
■ EBITA EBITAmargin
DKKm %
20092008 2010 2011 20120
60
120
180
240
300
0.0
1.5
3.0
4.5
6.0
7.5
REVENuE
20092008 2010 2011 20120
1,500
3,000
4,500
6,000
7,500
DKKm
Market developmentIn 2012, the European logistics services market was im-pacted by the economic crisis, which spread from Southern Europe to Northern Europe in the course of the year result-ing in stagnating, and in some industries even declining, activity levels in the second half of 2012.
Division volumes measured in order lines (transactions) increased by approx. 1% in 2012 compared to 2011, while the market in general is estimated to be on level with 2011. Volume growth for Q4 2012 was in line with Q3 and full-year 2012.
GROwTh iN LOGiSTiCS VOLuMES
Q4 Q4 2012 2012 2012 2012 DSV market DSV market
Order lines 1% -1-0% 1% 0%
Market growth rates are based on own estimates.
24 DSV 2012 annual report – management ’S Commentary – DSV SolutionS

Surplus capacity affected the logistics services market in several geographical areas. This caused fierce price compe-tition in connection with the renegotiation of contracts and participation in tenders.
Strategic and operational highlightsThe objective of gaining market share is to be achieved mainly through organic growth, with particular focus on the areas where the Division has well established business operations, e.g. the Benelux, Germany and the Nordic coun-tries. DSV has also established Solutions facilities on a small scale in China and other parts of Asia in connection with the other activities of the Group outside Europe, and Divi-sion management sees good growth potential in the Asian market.
DSV Solutions continues the development of industry-specific logistics solutions for the automotive, high-tech, healthcare and retail industries, etc. In response to the growing e-commerce the Group has developed a concept which is tailored to businesses in this segment.
As a key element of the Group’s strategy, DSV Solutions collaborates with the other two Divisions in offering inte-grated solutions that give the customers complete over-view of the supply chain while at the same time considering their capital investments and transport and logistics costs.
NuMBER Of EMpLOYEES
Number
20092008 2010 2011 20120
1,500
3,000
4,500
6,000
7,500
ROiC ANd iNVESTEd CApiTAL iNCLudiNG GOOdwiLL ANd CuSTOMER RELATiONShipS
■ Investedcapital ROICincl.goodwillincl.goodwilland andcustomercustomerrelationships relationships
DKKm %
20092008 2010 2011 20120
600
1,200
1,800
2,400
3,000
0
4
8
12
16
20
The Division offers customers a wide range of value-added services, including packaging and labelling of goods, assembly and kitting, product testing, etc., which are in growing demand and which the Division regards as an area with good growth potential.
A new Managing Director was appointed for the Division in the second quarter of the year. The new management is expected to continue and strengthen the development of the Division.
DSV Solutions continues the development of industry-specific logistics solutions…
GEOGRAphiC ExpOSuREDivision revenue can be broken down by the following geo-graphical areas:
■ Nordiccountries–20%
■ SouthernEurope–23%
■ OtherEurope–57%
25DSV 2012 annual report – management ’S Commentary – DSV SolutionS
financial results
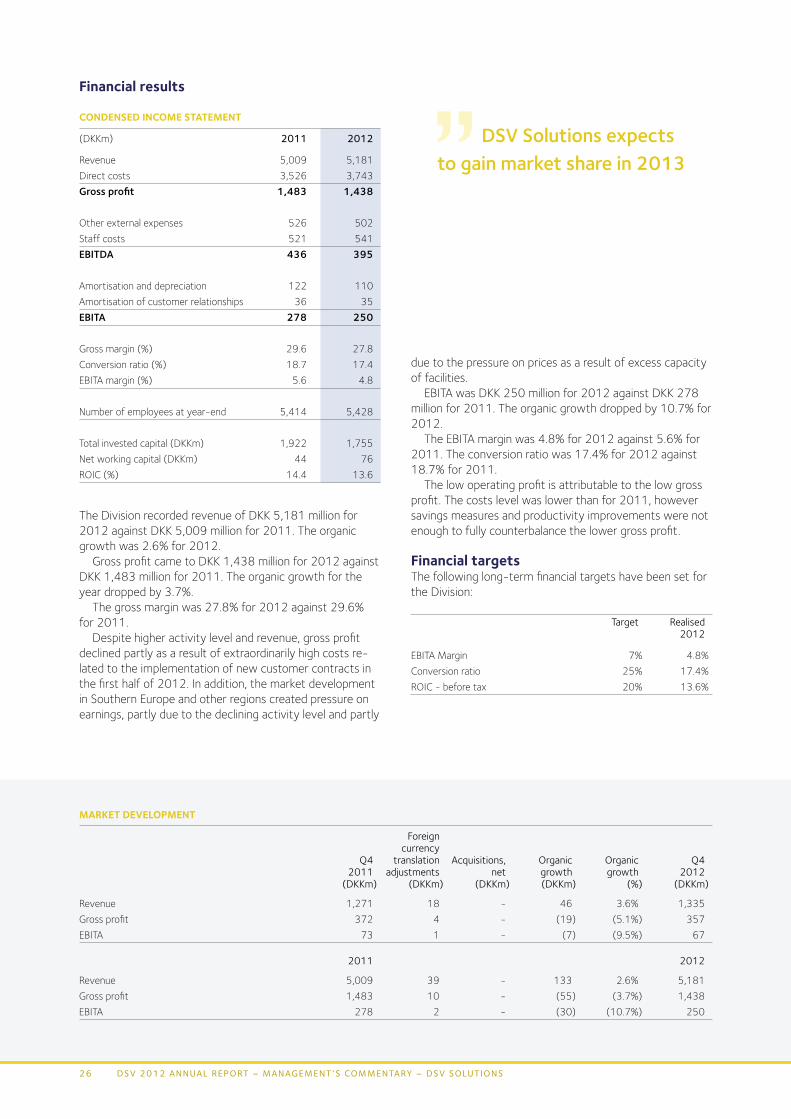
CONdENSEd iNCOME STATEMENT
(DKKm) 2011 2012
Revenue 5,009 5,181Direct costs 3,526 3,743Gross profit 1,483 1,438 Other external expenses 526 502Staff costs 521 541EBITDA 436 395 Amortisation and depreciation 122 110Amortisation of customer relationships 36 35EBITA 278 250 Gross margin (%) 29.6 27.8Conversion ratio (%) 18.7 17.4EBITA margin (%) 5.6 4.8 Number of employees at year-end 5,414 5,428 Total invested capital (DKKm) 1,922 1,755Net working capital (DKKm) 44 76ROIC (%) 14.4 13.6
The Division recorded revenue of DKK 5,181 million for 2012 against DKK 5,009 million for 2011. The organic growth was 2.6% for 2012.
Gross profit came to DKK 1,438 million for 2012 against DKK 1,483 million for 2011. The organic growth for the year dropped by 3.7%.
The gross margin was 27.8% for 2012 against 29.6% for 2011.
Despite higher activity level and revenue, gross profit declined partly as a result of extraordinarily high costs re-lated to the implementation of new customer contracts in the first half of 2012. In addition, the market development in Southern Europe and other regions created pressure on earnings, partly due to the declining activity level and partly
DSV Solutions expects to gain market share in 2013
due to the pressure on prices as a result of excess capacity of facilities.
EBITA was DKK 250 million for 2012 against DKK 278 million for 2011. The organic growth dropped by 10.7% for 2012.
The EBITA margin was 4.8% for 2012 against 5.6% for 2011. The conversion ratio was 17.4% for 2012 against 18.7% for 2011.
The low operating profit is attributable to the low gross profit. The costs level was lower than for 2011, however savings measures and productivity improvements were not enough to fully counterbalance the lower gross profit.
financial targetsThe following long-term financial targets have been set for the Division:
Target Realised 2012
EBITA Margin 7% 4.8%Conversion ratio 25% 17.4%ROIC - before tax 20% 13.6%
MARKET dEVELOpMENT
Foreign currency Q4 translation Acquisitions, Organic Organic Q4 2011 adjustments net growth growth 2012 (DKKm) (DKKm) (DKKm) (DKKm) (%) (DKKm)
Revenue 1,271 18 - 46 3.6% 1,335Gross profit 372 4 - (19) (5.1%) 357EBITA 73 1 - (7) (9.5%) 67 2011 2012
Revenue 5,009 39 - 133 2.6% 5,181Gross profit 1,483 10 - (55) (3.7%) 1,438EBITA 278 2 - (30) (10.7%) 250
26 DSV 2012 annual report – management ’S Commentary – DSV SolutionS

Outlook for 2013The activity level of the European logistics services market is expected to decline slightly by 1-2% in 2013.
DSV Solutions expects to gain market share in 2013 and to improve capacity utilisation and thereby achieve earnings growth.
Summary – Q4 2012The number of order lines increased by approx. 1% in Q4 2012, while the market in general is esti-mated to have declined slightly.
Gross profit amounted to DKK 357 million for Q4 2012 (2011: DKK 372 million). The organic growth declined by 5.1%. The decline mainly re-flects the fierce price competition in the logistics market.
EBITA amounted to DKK 67 million for Q4 2012 (2011: DKK 73 million). The organic growth de-clined by 9.5%. The decline was mainly a result of the low gross profit, which was only partly coun-terbalanced by the adjustment of overheads.
27DSV 2012 annual report – management ’S commentary – DSV SolutionS

Risk management
Risk management at dSVDSV considers effective risk management an integral ele-ment in the daily work of the Executive Board and the day-to-day operations. The efforts to identify and analyse key risks enable the DSV Management to respond timely to issues that may have a material impact on Group earnings and achievement of financial targets.
The Board of Directors has the ultimate responsibility for the Group’s risk management process and establishes the overall framework in this respect, whereas the duty of monitoring compliance with Group risk management poli-cies has been delegated to DSV’s Audit Committee to a predominant extent. The Executive Board is responsible for identifying and addressing key risks on a day-to-day basis and to develop the risk management procedures of the Group.
Risk management processRisk management is an ongoing process in DSV involving the identification of risks and assessment of the potential
The day-to-day operations of the dSV Group entail various risks. It is crucial for the Group that these risks are identified and addressed in accordance with the risk management objectives established by Management.
impact on Group earnings. The Group aims to mitigate risks identified and accepted following a commercial assessment through internal business procedures or insurance. In the mitigation of risks a thorough allocation is made of the or-ganisational responsibilities for implementation and ongoing follow-up. Procedures, guidelines and various key control systems have been developed to monitor and mitigate the risks identified by the Group, ensuring optimal management of all key risks.
In 2012, DSV analysed the Group’s key risks through a risk mapping process with participation of relevant employ-ees from all business areas. The process included an assess-ment of the risk of occurrence of the risks identified and any potential consequences thereof. The purpose of the process was to map any unidentified risks and to confirm or disconfirm the risks already established. This initiative un-covered no risks which had not already been identified and addressed.
Risk reportingAny risks identified are reported to central Group functions on an ongoing basis and this information is then submit-ted to the Executive Board. The Executive Board notifies the Board of Directors on a weekly basis of any matters of relevance to the risk management process and of any risk mitigation measures taken. The continuous dialogue with the Board of Directors and the Audit Committee and regu-lar reports from the Executive Board on the development in the key risk factors provide an adequate risk management framework.
In addition to the regular reports DSV’s Audit Committee also receives status reports on the key risks at all Commit-tee meetings.
Based on the most recent review of the risk scenario of DSV, Management estimates that the risks identified and the mitigation thereof are unchanged relative to last year in all essentials. The key risks and measures established are listed on pp. 29-30.
28 DSV 2012 annual report – management ’S Commentary – riSk management
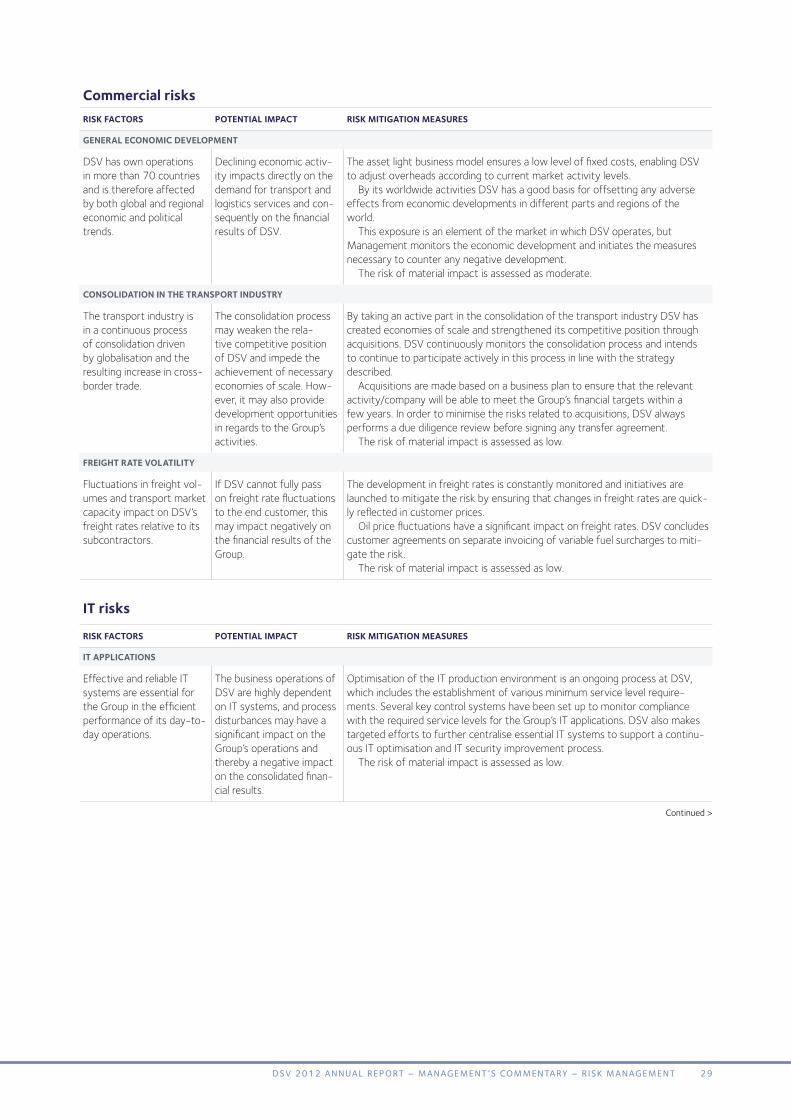
Commercial risksRiSK fACTORS pOTENTiAL iMpACT RiSK MiTiGATiON MEASuRES
GENERAL ECONOMiC dEVELOpMENT
DSV has own operations in more than 70 countries and is therefore affected by both global and regional economic and political trends.
Declining economic activ-ity impacts directly on the demand for transport and logistics services and con-sequently on the financial results of DSV.
The asset light business model ensures a low level of fixed costs, enabling DSV to adjust overheads according to current market activity levels. By its worldwide activities DSV has a good basis for offsetting any adverse effects from economic developments in different parts and regions of the world. This exposure is an element of the market in which DSV operates, but Management monitors the economic development and initiates the measures necessary to counter any negative development. The risk of material impact is assessed as moderate.
CONSOLidATiON iN ThE TRANSpORT iNduSTRY
The transport industry is in a continuous process of consolidation driven by globalisation and the resulting increase in cross-border trade.
The consolidation process may weaken the rela-tive competitive position of DSV and impede the achievement of necessary economies of scale. How-ever, it may also provide development opportunities in regards to the Group’s activities.
By taking an active part in the consolidation of the transport industry DSV has created economies of scale and strengthened its competitive position through acquisitions. DSV continuously monitors the consolidation process and intends to continue to participate actively in this process in line with the strategy described. Acquisitions are made based on a business plan to ensure that the relevant activity/company will be able to meet the Group’s financial targets within a few years. In order to minimise the risks related to acquisitions, DSV always performs a due diligence review before signing any transfer agreement. The risk of material impact is assessed as low.
fREiGhT RATE VOLATiLiTY
Fluctuations in freight vol-umes and transport market capacity impact on DSV’s freight rates relative to its subcontractors.
If DSV cannot fully pass on freight rate fluctuations to the end customer, this may impact negatively on the financial results of the Group.
The development in freight rates is constantly monitored and initiatives are launched to mitigate the risk by ensuring that changes in freight rates are quick-ly reflected in customer prices. Oil price fluctuations have a significant impact on freight rates. DSV concludes customer agreements on separate invoicing of variable fuel surcharges to miti-gate the risk. The risk of material impact is assessed as low.
iT risks
RiSK fACTORS pOTENTiAL iMpACT RiSK MiTiGATiON MEASuRES
iT AppLiCATiONS
Effective and reliable IT systems are essential for the Group in the efficient performance of its day-to-day operations.
The business operations of DSV are highly dependent on IT systems, and process disturbances may have a significant impact on the Group’s operations and thereby a negative impact on the consolidated finan-cial results.
Optimisation of the IT production environment is an ongoing process at DSV, which includes the establishment of various minimum service level require-ments. Several key control systems have been set up to monitor compliance with the required service levels for the Group’s IT applications. DSV also makes targeted efforts to further centralise essential IT systems to support a continu-ous IT optimisation and IT security improvement process. The risk of material impact is assessed as low.
Continued>
29DSV 2012 annual report – management ’S Commentary – riSk management
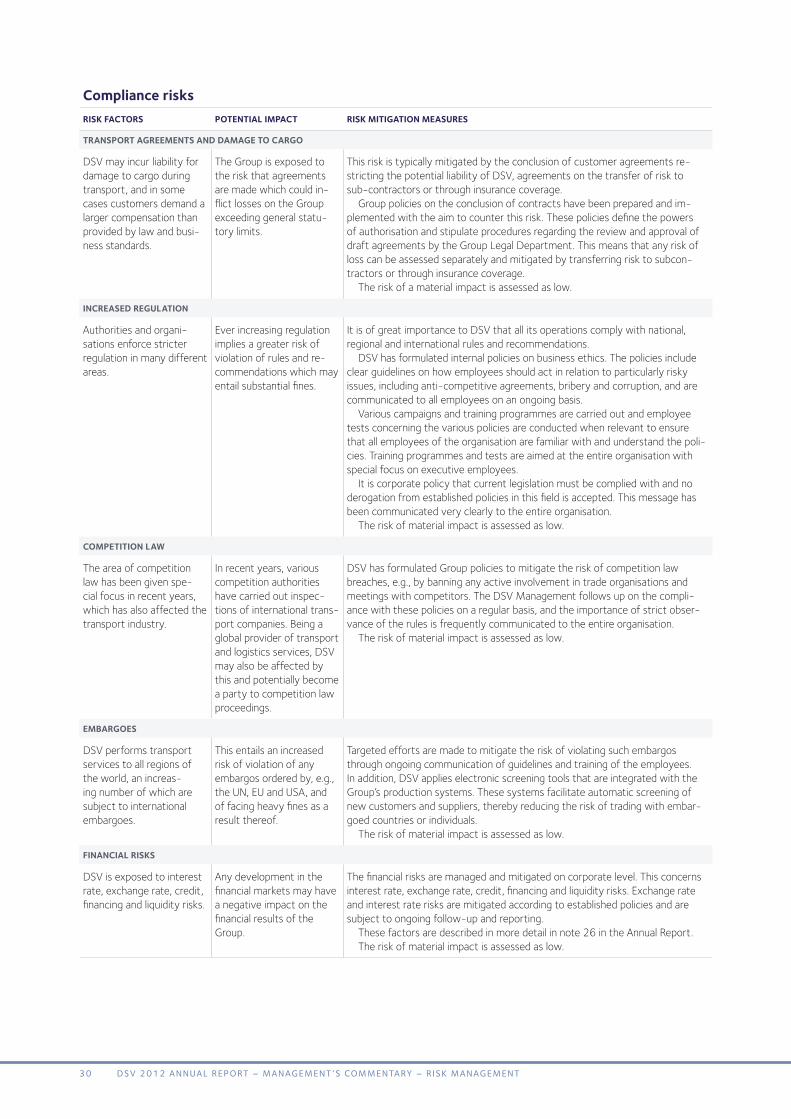
Compliance risksRiSK fACTORS pOTENTiAL iMpACT RiSK MiTiGATiON MEASuRES
TRANSpORT AGREEMENTS ANd dAMAGE TO CARGO
DSV may incur liability for damage to cargo during transport, and in some cases customers demand a larger compensation than provided by law and busi-ness standards.
The Group is exposed to the risk that agreements are made which could in-flict losses on the Group exceeding general statu-tory limits.
This risk is typically mitigated by the conclusion of customer agreements re-stricting the potential liability of DSV, agreements on the transfer of risk to sub-contractors or through insurance coverage. Group policies on the conclusion of contracts have been prepared and im-plemented with the aim to counter this risk. These policies define the powers of authorisation and stipulate procedures regarding the review and approval of draft agreements by the Group Legal Department. This means that any risk of loss can be assessed separately and mitigated by transferring risk to subcon-tractors or through insurance coverage. The risk of a material impact is assessed as low.
iNCREASEd REGuLATiON
Authorities and organi-sations enforce stricter regulation in many different areas.
Ever increasing regulation implies a greater risk of violation of rules and re-commendations which may entail substantial fines.
It is of great importance to DSV that all its operations comply with national, regional and international rules and recommendations. DSV has formulated internal policies on business ethics. The policies include clear guidelines on how employees should act in relation to particularly risky issues, including anti-competitive agreements, bribery and corruption, and are communicated to all employees on an ongoing basis. Various campaigns and training programmes are carried out and employee tests concerning the various policies are conducted when relevant to ensure that all employees of the organisation are familiar with and understand the poli-cies. Training programmes and tests are aimed at the entire organisation with special focus on executive employees. It is corporate policy that current legislation must be complied with and no derogation from established policies in this field is accepted. This message has been communicated very clearly to the entire organisation. The risk of material impact is assessed as low.
COMpETiTiON LAw
The area of competition law has been given spe-cial focus in recent years, which has also affected the transport industry.
In recent years, various competition authorities have carried out inspec-tions of international trans-port companies. Being a global provider of transport and logistics services, DSV may also be affected by this and potentially become a party to competition law proceedings.
DSV has formulated Group policies to mitigate the risk of competition law breaches, e.g., by banning any active involvement in trade organisations and meetings with competitors. The DSV Management follows up on the compli-ance with these policies on a regular basis, and the importance of strict obser-vance of the rules is frequently communicated to the entire organisation. The risk of material impact is assessed as low.
EMBARGOES
DSV performs transport services to all regions of the world, an increas-ing number of which are subject to international embargoes.
This entails an increased risk of violation of any embargos ordered by, e.g., the UN, EU and USA, and of facing heavy fines as a result thereof.
Targeted efforts are made to mitigate the risk of violating such embargos through ongoing communication of guidelines and training of the employees. In addition, DSV applies electronic screening tools that are integrated with the Group’s production systems. These systems facilitate automatic screening of new customers and suppliers, thereby reducing the risk of trading with embar-goed countries or individuals. The risk of material impact is assessed as low.
fiNANCiAL RiSKS
DSV is exposed to interest rate, exchange rate, credit, financing and liquidity risks.
Any development in the financial markets may have a negative impact on the financial results of the Group.
The financial risks are managed and mitigated on corporate level. This concerns interest rate, exchange rate, credit, financing and liquidity risks. Exchange rate and interest rate risks are mitigated according to established policies and are subject to ongoing follow-up and reporting. These factors are described in more detail in note 26 in the Annual Report. The risk of material impact is assessed as low.
30 DSV 2012 annual report – management ’S Commentary – riSk management
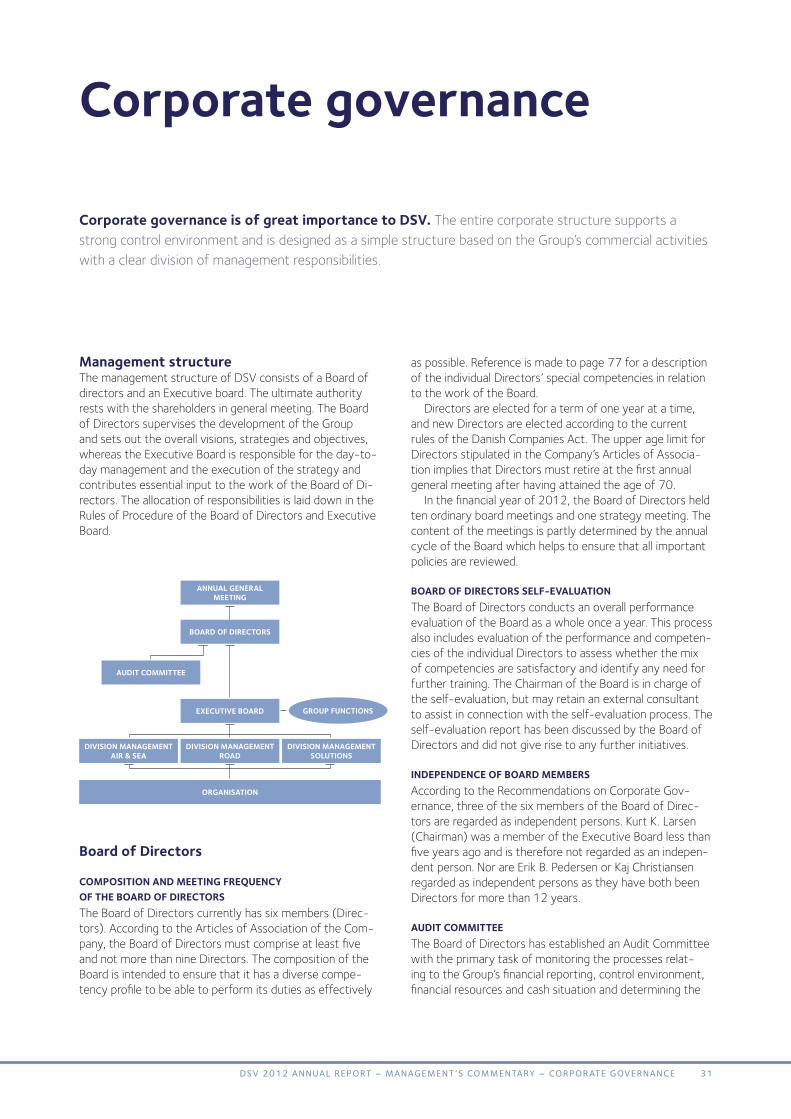
Management structure The management structure of DSV consists of a Board of directors and an Executive board. The ultimate authority rests with the shareholders in general meeting. The Board of Directors supervises the development of the Group and sets out the overall visions, strategies and objectives, whereas the Executive Board is responsible for the day-to-day management and the execution of the strategy and contributes essential input to the work of the Board of Di-rectors. The allocation of responsibilities is laid down in the Rules of Procedure of the Board of Directors and Executive Board.
as possible. Reference is made to page 77 for a description of the individual Directors’ special competencies in relation to the work of the Board.
Directors are elected for a term of one year at a time, and new Directors are elected according to the current rules of the Danish Companies Act. The upper age limit for Directors stipulated in the Company’s Articles of Associa-tion implies that Directors must retire at the first annual general meeting after having attained the age of 70.
In the financial year of 2012, the Board of Directors held ten ordinary board meetings and one strategy meeting. The content of the meetings is partly determined by the annual cycle of the Board which helps to ensure that all important policies are reviewed.
BOARd Of diRECTORS SELf-EVALuATiONThe Board of Directors conducts an overall performance evaluation of the Board as a whole once a year. This process also includes evaluation of the performance and competen-cies of the individual Directors to assess whether the mix of competencies are satisfactory and identify any need for further training. The Chairman of the Board is in charge of the self-evaluation, but may retain an external consultant to assist in connection with the self-evaluation process. The self-evaluation report has been discussed by the Board of Directors and did not give rise to any further initiatives.
iNdEpENdENCE Of BOARd MEMBERSAccording to the Recommendations on Corporate Gov-ernance, three of the six members of the Board of Direc-tors are regarded as independent persons. Kurt K. Larsen (Chairman) was a member of the Executive Board less than five years ago and is therefore not regarded as an indepen-dent person. Nor are Erik B. Pedersen or Kaj Christiansen regarded as independent persons as they have both been Directors for more than 12 years.
AudiT COMMiTTEEThe Board of Directors has established an Audit Committee with the primary task of monitoring the processes relat-ing to the Group’s financial reporting, control environment, financial resources and cash situation and determining the
Corporate governance is of great importance to dSV. The entire corporate structure supports a strong control environment and is designed as a simple structure based on the Group’s commercial activities with a clear division of management responsibilities.
Corporate governance
Board of directors
COMpOSiTiON ANd MEETiNG fREquENCY Of ThE BOARd Of diRECTORSThe Board of Directors currently has six members (Direc-tors). According to the Articles of Association of the Com-pany, the Board of Directors must comprise at least five and not more than nine Directors. The composition of the Board is intended to ensure that it has a diverse compe-tency profile to be able to perform its duties as effectively
GROup fuNCTiONS
ANNuAL GENERAL MEETiNG
BOARd Of diRECTORS
AudiT COMMiTTEE
ExECuTiVE BOARd
ORGANiSATiON
diViSiON MANAGEMENT AiR & SEA
diViSiON MANAGEMENT ROAd
diViSiON MANAGEMENT SOLuTiONS
31DSV 2012 annual report – management ’S Commentary – Corpor ate goVernanCe

framework for the external audit. The Rules of Procedure of the Audit Committee are available at www.dsv.com. The Committee held three meetings in 2012.
REMuNERATiON Of MEMBERS Of ThE BOARd Of diRECTORS ANd ThE ExECuTiVE BOARdDSV has adopted a Remuneration Policy which lays down the guidelines for determining and approving the remu-neration of the members of the Board of Directors and Executive Board. The Remuneration Policy is designed to always reflect the goal of being able to attract and retain a competent Management. The Remuneration Policy is dis-cussed and approved at the annual general meeting of the Company and is available at www.dsv.com.
Recommendations on Corporate Governance The Recommendations issued by the Committee on Cor-porate Governance in August 2011 are actively used by the Board of Directors in its work, and the Board regularly assesses its procedures according to the Recommendations. DSV has opted to derogate from three of the 79 Recom-mendations: (1) the Recommendation on nomination com-mittee, (2) the Recommendation on remuneration commit-tee, and (3) parts of the Recommendation on diversity at management levels.
NOMiNATiON COMMiTTEE ANd REMuNERATiON COMMiTTEEThe Board of Directors regularly considers the need for nomination and remuneration committees, but has not found it necessary to establish such committees for the time being. In the assessment of the Board, the tasks which are to be undertaken by a nomination committee and a re-muneration committee according to the Recommendations are performed efficiently by the Chairman of the Board. The Chairman subsequently reports to the other Directors.
diVERSiTY AT MANAGEMENT LEVELSThe Board of Directors discusses the Group’s activities on a regular basis, one aim being to ensure that the Group has optimal management teams at all management levels. In connection with these discussions, the Board also considers the element of diversity, but the Board sees no clear con-nection between fixed levels of diversity and the best pos-sible governance of the Group. For that reason, the Board of Directors has not found it expedient to set specific tar-gets for diverse management teams so far. However, due to the entry into force of new national rules, the Board will establish specific diversity objectives during the first quar-ter of 2013 to assure that DSV complies with the rules.
For a detailed description of DSV’s position on the Recommendations, reference is made to www.dsv.com. The Recommendations are available in their entirety at www.corporategovernance.dk.
internal control and risk management in connection with financial reportingThe Board of Directors has the overall responsibility for risk management and internal control in connection with the presentation of the financial statements. The internal
control and risk management systems of DSV related to the financial reporting process are designed to minimise the risk that internal and external financial statements include misstatements or irregularities. DSV’s internal control and risk management system is not designed according to one specific method package; rather, it is inspired by a series of methods which have been used in establishing the Group’s risk management methodology.
The key elements of the Group’s risk management and internal control systems in connection with the presenta-tion of financial statements are summarised below.
CONTROL ENViRONMENTThe control environment in DSV is based on clear guide-lines, a simple organisational structure, clear division of re-sponsibilities and constant efforts to strengthen the control environment with due consideration of materiality and risk. This culture is driven from senior management level. The Board of Directors and the Executive Board believe that a strong control environment supported by the tone at the top is crucial to good risk management and effective inter-nal control.
The entire corporate structure is designed as a simple structure based on the Group’s commercial activities with a clear division of management responsibilities. The Group Executive Board is represented in the Boards of directors of all material subsidiaries, which apply standard provisions regulating the power to bind the company. This supports a strong control environment throughout the organisation.
The Board of Directors and Executive Board establish and approve at least once a year all general policies, procedures and control systems in essential fields, including Code of Conduct, Corporate Social Responsibility Policy and the Rules of Procedure of the Board of Directors and Execu-tive Board. In addition, policies have been adopted and manuals created within essential fields of financial report-ing: accounting and reporting manual, finance, credit and authorisation policies, efficient separation of functions and IT strategy.
The Group’s central control and compliance functions are responsible for following up on existing policies and manu-
32 DSV 2012 annual report – management ’S Commentary – Corpor ate goVernanCe

als. The Audit Committee is also considered to support a strong control environment.
As part of its annual responsibilities, the Audit Commit-tee assesses the need for an internal audit function and in that connection formulates recommendations for the Board of Directors regarding the establishment of such function. The Audit Committee deems that the existing control and risk management systems are adequate and DSV has opted not to establish an internal audit function for the time be-ing.
RiSK ASSESSMENTThe Board of Directors and Executive Board regularly as-sess key risks and internal control systems in connection with the presentation of consolidated financial statements. This implies, inter alia, that the risk factors and financial and management control systems relating to financial report-ing are assessed by the Board of Directors at least once a year. This process includes an assessment of whether the organisational structure and allocation of human resources remain optimal.
The most material and risky items are identified and as-sessed annually and the risks identified are matched with internal procedures and controls. The items deemed to be the most material and risky are unchanged relative to last year and are described in more detail in note 1 of the Con-solidated Financial Statements. Other material risk factors of relevance to the financial reporting include authorisations, conclusion of contracts, IT organisation and IT security as well as risks relating to the separation of functions, etc.
CONTROL ACTiViTiESThe control activities are designed to address the risks identified by Management. The purpose of the control ac-tivities is to verify that the policies, manuals and procedures laid down are followed and that any material misstatement is prevented, discovered and remedied. In that connection it is vital that the reasons for any misstatements are identified and eliminated. Minimum requirements of control systems that apply to all Group companies have been laid down on the basis of the risks identified. The control activities include procedures for authorisation, approval, reconcilia-tion, results and liquidity analyses and efficient separation of functions. The control systems cover both manual and automated controls.
DSV also applies various key IT control systems. These key control systems are primarily targeted at corporate IT functions to help safeguard IT operations and thereby support the quality and reliability of the Group’s financial reporting.
Group Management and the managements of the na-tional subsidiaries have high focus on financial ratios and follow-up in this respect. Monthly internal financial reports are subject to permanent internal control procedures, in-cluding central closing of reporting systems and central re-view and analysis of reports received from the subsidiaries. The review of reports received is based on an assessment of materiality and risk factors relating to the individual sub-sidiary.
Detailed procedures and control systems have been established at Group level to ensure timely notification of NASDAQ OMX Copenhagen in accordance with applicable rules.
iNfORMATiON ANd REpORTiNGDSV has established standardised information and report-ing systems to ensure that the financial reporting gives a true and fair view and is in compliance with legislation and that other internal control procedures of the Group are ob-served.
Internal reporting instructions and control procedures are continuously revised and evaluated to constantly ensure that financial reports are reliable and transparent.
Management’s position on risk management and chang-es in reporting requirements, etc., is regularly communi-cated through various channels, e.g., through newsletters, by holding financial conferences for financial managers of all subsidiaries and through dialogue with the individual na-tional managements.
Management emphasises an adequate level of internal communication within the framework of the current stock exchange legislation to ensure in the best possible manner that all employees are aware of their responsibilities within the organisation and accordingly are able to effectively and reliably perform their duties.
MONiTORiNGThe internal control and risk management in connection with the presentation of financial statements are monitored at various levels, including by means of monthly reports to the DSV Management on comprehensive consolidated ac-counting data, the Group’s markets and segments, and by regular control visits to Group entities, and the Audit Com-mittee’s work. Furthermore, Management receives cash reports from the subsidiaries on a weekly basis.
The Rules of Procedure of the Audit Committee contain a description of the Committee’s role and responsibilities rel-ative to its duty to monitor the financial reporting process. The financial monitoring process is based on regular reports from the Group Finance Department, annual updates as regards the status of the key financial reporting control systems and review of critical accounting estimates and policies. Finally, external audit reports are also reviewed.
The Board of Directors oversees the Executive Board to ensure that it responds effectively in case of weaknesses or deficiencies detected by internal control systems or external audits and that any agreed initiatives to improve risk management and internal control are implemented as planned.
DSV established a global whistleblower scheme in 2012. The scheme enables the employees to anonymously report any material offences or suspicion thereof and thereby contributes to strengthening the monitoring of compliance with Group policies. Information regarding the intended use of DSV’s Whistleblower Programme has been communi-cated to all subsidiaries. The same information is available to all employees via the corporate intranet, which is updated on an ongoing basis.
33DSV 2012 annual report – management ’S Commentary – Corpor ate goVernanCe

Shareholder information
The dSV share in 2012With an average daily trading volume of 604,814 shares, corresponding to DKK 75 million each day, the DSV share was also among the 10 most traded shares on NASDAQ OMX Copenhagen in 2012.
At year-end 2012, the closing price of the DSV share on NASDAQ OMX Copenhagen was DKK 145.7, whereas the 2011 year-end closing price was DKK 103.0. Accordingly, the DSV share was up by DKK 42.7 in 2012, corresponding to 41.5%. During the same period, the OMXC20 Index of NASDAQ OMX Copenhagen rose by 27.2%.
At year-end 2012, the market capitalisation of DSV was DKK 27.4 billion, inclusive of the value of treasury shares.
BASiC dATA
Share capital at 31 December 2012 DKK 188,000,000Number of shares at 31 December 2012 188,000,000Denomination and voting rights per share 1Share classes 1Restrictions on transferability and voting rights NoneListed NASDAQ OMX CopenhagenTrading symbol DSVISIN code DK0060079531
in 2012, the dSV share was again among the most traded shares on NASdAq OMx Copenhagen. The DSV share rose by 41.5% during the year, and at year-end 2012 the total market capitalisation was DKK 27.4 billion.
dividendsThe Board of Directors proposes ordinary dividends of DKK 1.25 per share for 2012. Dividends of DKK 1.00 per share were distributed for 2011.
Share buy-backIn the financial year of 2012, DSV acquired 10,421,661 own shares at a total purchase price of DKK 1.3 billion. Added to the dividends distributed, DSV has distributed almost DKK 1.5 billion to the shareholders of the Company, which is in line with the expectations previously announced. The average price of the repurchased shares was DKK 125.0, and the total number of shares repurchased cor-responds to 5.5% of the Company’s share capital at the beginning of the financial year.
The purpose of the share buy-back scheme was to hedge incentive programmes and adjust the capital struc-ture in accordance with the financial targets. The shares were bought back under the powers granted at the Annual General Meeting of DSV on 21 March 2012 using the safe harbour method.
At 31 December 2012, the Company held 9,937,421 shares as treasury shares, corresponding to 5.3% of the share capital. As at 20 February 2013, the Company’s portfolio of treasury shares amounts to 9,779,421 shares.
ShARE pRiCE ANd TRAdiNG VOLuME, 2012
■ Dailytradingvolume-DSV(numberofshares) DSVshareprice OMXC20(rebased)
Jan Feb Mar Apr May Jun Jul Aug NovSep Oct Dec
Share priceDaily trading volume (number of shares, ‘000)
0
500
1,000
1,500
2,000
2,500
50
70
90
110
130
150
34 DSV 2012 annual report – management ’S Commentary – ShareholDer information

Capital reduction Following the acquisition of treasury shares in 2011, the Company has reduced its share capital. The share capital of DSV A/S was reduced by a nominal value of DKK 2 million on 18 April 2012. The capital reduction was carried out in accordance with the resolution passed at the Annual Gen-eral Meeting on 21 March 2012 through the cancellation of two million treasury shares.
At the next General Meeting, the Board of Directors expects to propose a further reduction of the Company’s share capital of a nominal amount of DKK 8 million.
incentive programmesAt its Board meeting on 21 March 2013, the DSV Board of Directors expects to authorise the Executive Board to allocate up to two million share options to senior staff members in accordance with the guidelines for incentive pay. The allocation will be made at the average quoted price on the five consecutive trading days preceding 31 March 2013.
Authority The Board of Directors is authorised by the General Meet-ing to increase the Company’s share capital. The total num-ber of shares that may be acquired under the authority is 37.6 million. The authority is valid until 21 March 2017.
The Board of Directors has also been authorised by the General Meeting to issue convertible debt instruments and warrants and to make the related capital increase. This au-thority is valid until 26 March 2015 and covers shares of a total nominal value of up to DKK 25 million. Shareholders have no pre-emptive rights if the Board of Directors exer-cises the said authorities.
The General Meeting also authorised the Board of Direc-tors on 21 March 2012 to buy back a maximum of 18.8 million shares in the Company. At 20 February 2013, the remaining number of shares that may be acquired under the authority may not exceed 8,862,579. The authority is valid until 21 March 2017. The purchase price of treasury shares acquired under the authority may not deviate by more than 5% from the most recently quoted market price of the shares at the date of acquisition. The Board of Direc-tors expects to propose at the next General Meeting that
the Board be granted authority to acquire up to 18 million treasury shares.
The authorities have been incorporated into the Compa-ny’s Articles of Association. The Articles of Association are amended according to the rules of the Danish Companies Act. The latest amendment of the Articles of Association was made in connection with the capital reduction on 18 April 2012.
Company announcements published in 2012DSV published a total of 58 company announcements in 2012 (Nos. 426-483). The most important announce-ments in 2012 are listed below:
23 January No. 428 Conclusion of share buy-back programme in DSV A/S
21 February No. 434 2011 Annual Report21 February No. 435 Launch of new share buy-back programme
according to the safe harbour method21 March No. 442 Minutes of DSV’s Annual General Meeting28 March No. 443 European Commission’s final decision fol-
lowing a Statement of Objections31 March No. 445 Antitrust proceedings in Italy23 April No. 448 Conclusion of share buy-back programme
and reduction of share capital in DSV A/S27 April No. 449 Interim Financial Report First Quarter 201227 April No. 450 Launch of new share buy-back programme
according to the safe harbour method30 July No. 461 Conclusion of share buy-back programme
in DSV A/S31 July No. 462 Interim Financial Report H1 201231 July No. 463 Launch of new share buy-back programme
according to the safe harbour method16 October No. 474 Conclusion of share buy-back programme
in DSV A/S25 October No. 475 Interim Financial Report Third Quarter 201225 October No. 476 Launch of new share buy-back programme
according to the safe harbour method 7 November No. 478 Financial Calendar 20133 December No. 481 Share buy-back and major shareholder
announcement - DSV A/S21 December No. 483 Conclusion of share buy-back programme
in DSV A/S
Other company announcements concerned share buy-backs in all essentials. For a complete list of 2012 company announcements, please refer to www.dsv.com.
Shareholder composition At 31 December 2012, registered shares in DSV A/S to-talled 165.1 million, corresponding to 88% of the share capital. The largest 25 of these shareholders owned 42% of the entire share capital. Of the registered shareholders 20% are private investors and 80% institutional investors.
ShAREhOLdERS - GEOGRAphiCAL diSTRiBuTiON
Category proportion of share capital
Denmark 30Foreign countries 53Treasury shares 5Not registered 12total 100
35DSV 2012 annual report – management ’S Commentary – ShareholDer information
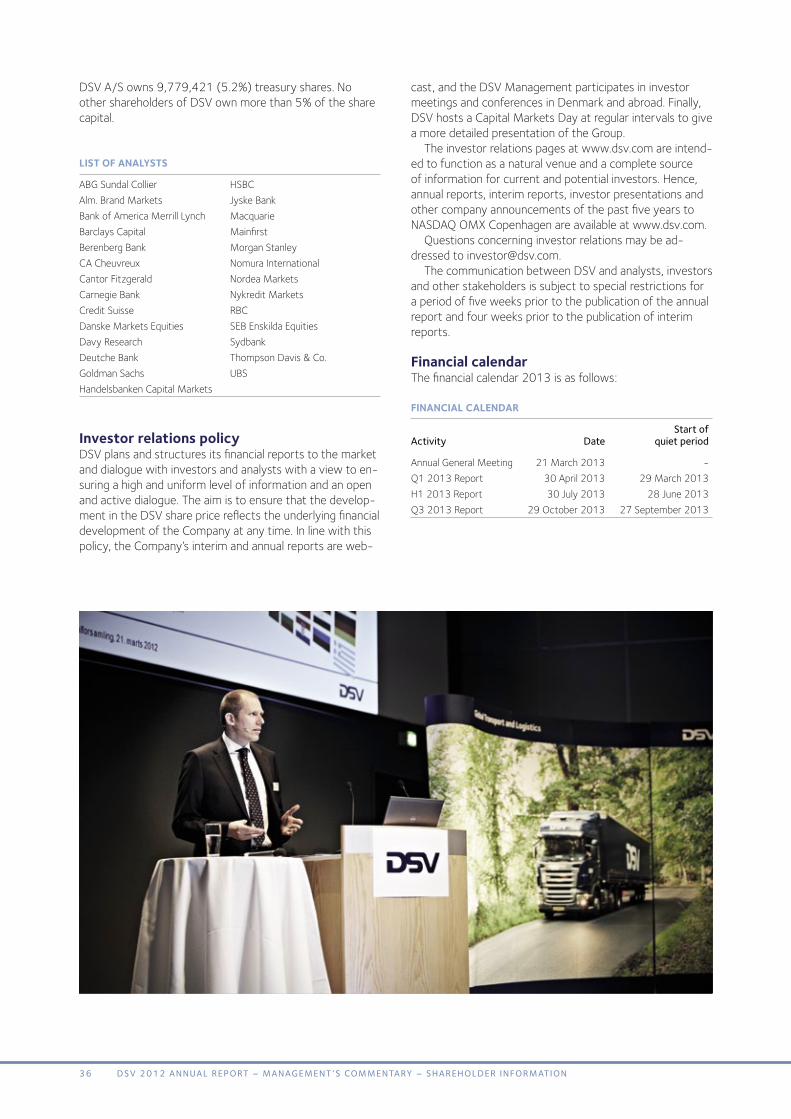
DSV A/S owns 9,779,421 (5.2%) treasury shares. No other shareholders of DSV own more than 5% of the share capital.
LiST Of ANALYSTS
ABG Sundal Collier HSBCAlm. Brand Markets Jyske BankBank of America Merrill Lynch MacquarieBarclays Capital MainfirstBerenberg Bank Morgan StanleyCA Cheuvreux Nomura InternationalCantor Fitzgerald Nordea MarketsCarnegie Bank Nykredit MarketsCredit Suisse RBCDanske Markets Equities SEB Enskilda EquitiesDavy Research SydbankDeutche Bank Thompson Davis & Co. Goldman Sachs UBSHandelsbanken Capital Markets
investor relations policyDSV plans and structures its financial reports to the market and dialogue with investors and analysts with a view to en-suring a high and uniform level of information and an open and active dialogue. The aim is to ensure that the develop-ment in the DSV share price reflects the underlying financial development of the Company at any time. In line with this policy, the Company’s interim and annual reports are web-
cast, and the DSV Management participates in investor meetings and conferences in Denmark and abroad. Finally, DSV hosts a Capital Markets Day at regular intervals to give a more detailed presentation of the Group.
The investor relations pages at www.dsv.com are intend-ed to function as a natural venue and a complete source of information for current and potential investors. Hence, annual reports, interim reports, investor presentations and other company announcements of the past five years to NASDAQ OMX Copenhagen are available at www.dsv.com.
Questions concerning investor relations may be ad-dressed to [email protected].
The communication between DSV and analysts, investors and other stakeholders is subject to special restrictions for a period of five weeks prior to the publication of the annual report and four weeks prior to the publication of interim reports.
financial calendarThe financial calendar 2013 is as follows:
fiNANCiAL CALENdAR
Start of activity Date quiet period
Annual General Meeting 21 March 2013 -Q1 2013 Report 30 April 2013 29 March 2013 H1 2013 Report 30 July 2013 28 June 2013Q3 2013 Report 29 October 2013 27 September 2013
36 DSV 2012 annual report – management ’S Commentary – ShareholDer information

Corporate social responsibility
DSV is a participant of the United Nations Global Compact and submitted its progress report (Communication on Pro-gress) to the Global Compact on 20 February 2013, ex-cerpts of which are given below. The report describes key issue areas and the actions and progress made by DSV in implementing the CSR initiatives in 2012.
The progress report replaces the statutory report on corporate social responsibility in accordance with the ex-emption provision in section 99a of the Danish Financial Statements Act and is available in its entirety on DSV’s website at www.dsv.com.
Key focus areas embedded across the GroupDSV focuses on three specific CSR issue areas:
• Environment and climate• Business ethics and anti-corruption• Employees and working environment
These areas have been selected as they have the highest relevance to the core business of DSV and therefore are areas where DSV is in a favourable position to exert influ-ence. The focus areas are also considered to be of major importance to the Group’s stakeholders, employees and shareholders.
The issue areas are described in the DSV CSR strategy and each area is supported by a number of targets to drive progress in the field of CSR. The targets have been adopted by the Board of Directors, and CSR is a permanent item in the annual cycle of the Board which includes the annual task of reviewing the Group’s internal Code of Conduct and its Supplier Code of Conduct. The decisions made by the Board of Directors are subsequently implemented by the Executive Board. As an embedded element of Group Management’s responsibilities CSR is a high-focus area of the Group, and DSV thereby sends a clear signal to the en-tire organisation about the importance of CSR to all Group companies.
DSV still has high focus and continues to make progress on Corporate Social Responsibility (CSR). Targeted efforts are made within a few, relevant core areas with the aim to achieve concrete and measurable results.
CSR objectives – follow-up and updating of targetsIn 2011, Management set a number of targets based on the adopted strategy and policies. One or more activities were established for each target to ensure that efforts are made to achieve the CSR targets.
Management evaluated the targets during the year and concluded that most of them have been achieved and that DSV is on the right track to achieve the long-term objec-tives. To further accelerate the CSR performance of the Group, several new targets have been adopted. Various new and updated activities were also established for each target.
Environment and climateEffective transportation is a crucial prerequisite for an ef-ficient and high-growth society. Historically, DSV has grown through organic growth and acquisitions and intends to continue to develop its business.
DSV provides transport and logistics services. This means that increased operations will also entail an increase in the energy consumption of our suppliers which perform the physical transportation of cargo. As transportation is based to a large extent on fossil fuels, a growing energy consumption leads to increased burning of fossil fuels and thereby increased emissions of CO2 and other substances.
This means that DSV must continue to work with the suppliers to improve fuel efficiency and that DSV must continue its efforts to optimise capacity utilisation per unit. An optimum utilisation of the space available on the indi-vidual means of transportation will benefit the environment and can be achieved, e.g., by ensuring a good and effecive planning of the cargo volumes available in the business net-work.
With the aim to promote a positive development DSV has set a number of internal targets for the internal pro-cesses of DSV and targets aimed at the suppliers providing transport services for the Group. As a general objective, DSV must reduce the carbon emissions of suppliers and own operations. Therefore, DSV has set a concrete tar-get of a 15% improvement of the energy efficiency of all transport activities by 2015 compared to 2010 figures.
37DSV 2012 annual report – management ’S commentary – corpor ate Social reSponSibilit y
pROGRESS ThROuGh COLLABORATiON ANd MEASuREMENTDSV partners with several customers to reduce the emis-sions from transport operations. DSV makes a specific cal-culation of transport emissions based on key figures from its suppliers and actual cargo volumes carried for the cus-tomers. This calculation forms the basis of an assessment of the emission reduction potential of the Group’s transport operations. Improvements can be obtained through better planning of shipments or use of intermodal transportation.
Business ethics and anti-corruptionOperating across many different cultures all over the world, DSV finds it essential that all employees share the same business ethical values; that all commercial agreements must be concluded by equal partners on a fair and trans-parent basis. In order to ensure that this is the case in busi-ness transactions involving DSV a number of guidelines are stipulated in the DSV Code of Conduct, which constitutes the very basis of the Group’s CSR initiatives in relation to business ethics and anti-corruption. The guidelines have been formulated so as to serve as a source of information as well as a guide on ethical conduct for the employees in their interaction with customers, competitors and suppliers.
COdE Of CONduCT fOR SuppLiERSIn 2012, DSV formulated the Supplier Code of Conduct - a common set of business ethics rules and requirements for the suppliers of the Group. The requirements made on the suppliers of the Group are not very different from the in-ternal DSV Code of Conduct as the suppliers must adhere to the same high standards as DSV.
The guidelines describe what DSV considers appropriate business conduct from its suppliers and thereby also the conduct that is expected from the suppliers when perform-ing services on behalf of or supplying products to DSV.
ACTiVE fiGhT AGAiNST fACiLiTATiON pAYMENTSBy its worldwide operations, DSV is faced with a highly complex problem related to the concept of corruption that is difficult to combat: the so-called facilitation payments. DSV supports the abolition of facilitation payments, but understands that it is a practice which is widely used in cer-tain countries and regions and which the employees of DSV experience in their daily work.
In 2012, DSV analysed the scope of the problem among the companies that face this challenge in their day-to-day operations. It can be concluded that it requires extraordi-nary efforts to resist or minimise demands for facilitation payments.
The DSV Management has therefore decided to examine the possibilities of eliminating facilitation payments. Con-sequently a pilot project will be launched which is to work towards an elimination of facilitation payments through targeted efforts in some of the affected countries, dialogue through relevant networks and other initiatives.
Employees and working environmentEmployees and working environment is an obvious focus area in relation to the CSR strategy and initiatives of DSV. Employees are the backbone of DSV, whether they plan the shipments, load and unload cargo at the terminals, find the best possible transport solution for the customers or work to develop the business in general. DSV aims to minimise the number of occupational injuries and accidents, and ide-ally eliminate this issue altogether, by focusing on minimis-ing the risks and raising employees’ awareness of safety. Management has therefore set various targets with the view to maintaining and nurturing a positive working envi-ronment at all DSV locations.
fEwER OCCupATiONAL ACCidENTS AT dSVManagement has set an ambitious target stating that the number of occupational accidents must be reduced by 25% compared to 2010 figures. Several companies have sub-sequently been involved in a joint initiative to share know-ledge and best practice on the prevention of work-related accidents. Furthermore, companies across the Group have been engaged in various local initiatives, from risk mapping and management to registration of “near accidents” and causal analyses of accidents.
It is satisfactory to note that the initiatives have led to a major overall decline in the number of occupational ac-cidents as well as in the rate of occupational accidents among the employees of DSV. Occupational accidents declined considerably among hourly workers in particu-lar, down almost 10% compared to the year before and a reduction of almost 18% compared to 2010, when the target was adopted. All Divisions have worked with various initiatives and contributed to reducing the number of occu-pational accidents among hourly workers. Overall, the num-ber of reported accupational accidents dropped by almost 100 accidents compared with the year before.
Traditionally, the salaried staff of DSV are less likely to suffer a work-related accident as they are mainly engaged in office work. The rate of occupational accidents dropped considerably by almost 29% compared to last year. Despite the notable reduction of almost 19% in the total number of accidents compared to 2010 as a result of the efforts to prevent accupational accidents, we have to realise that the target of a 25% reduction relative to the 2010 level has not been achieved.
Any type of occupational accident, regardless of the consequences it may have for the employee, is a major concern and cannot be accepted. DSV therefore continues its efforts to further reduce the number of work-related accidents with the aim to continuously improve perfor-mance in this area. The initiatives mentioned above is an ongoing process and further efforts will be made in a num-ber of DSV companies where the effect of the initiatives have not yet materialised. By these measures DSV expects to achieve the target in 2013.
38 DSV 2012 annual report – management ’S Commentary – Corpor ate SoCial reSponSiBilit y

Consolidated financialstatements 2012Income statement ................................................................................................................................ 40Statement of comprehensive income ........................................................................................... 40Balance sheets, assets ........................................................................................................................ 41Balance sheets, equity and liabilities .............................................................................................. 41Cash flow statement ........................................................................................................................... 42Statement of changes in equity ...................................................................................................... 43Notes ......................................................................................................................................................... 45
39DSV 2012 ANNUAL REPORT – cONSOLiDATED fiNANciAL STATEmENTS

InCome statement (DKKm) Note 2011 2012
Revenue 43,710 44,912Direct costs 33,891 34,858Gross profit 9,819 10,054
Other external expenses 3 2,092 2,116Staff costs 4, 5 4,752 4,864Operating profit before amortisation, depreciation and special items (EBITDA) 2,975 3,074 Amortisation and depreciation of intangibles, property, plant and equipment 6 549 534Operating profit before special items (EBITA) 2,426 2,540
Special items 7 - (275) Operating profit (EBIT) 2,426 2,265
Share of associates’ profit, net of tax 14 7 7 Financial income 8 119 141Financial expenses 9 557 394Profit before tax 1,995 2,019
Tax on profit for the year 10 546 589Profit for the year 1,449 1,430
Profit for the year is attributable to:Shareholders of DSV A/S 1,440 1,427Non-controlling interests 9 3
Earnings per share: 11Earnings per share of DKK 1 7.34 7.81Diluted earnings per share of DKK 1 7.29 7.76
statement of ComprehensIve InCome(DKKm) Note 2011 2012
Profit for the year 1,449 1,430
Foreign currency translation adjustments, foreign enterprises (8) (42)Fair value adjustment for the year relating to hedging instruments (61) (85)Fair value adjustment relating to hedging instruments transferred to financials 62 61 Actuarial gains/(losses) 19 (171) (115)Other adjustments (1) - Tax on other comprehensive income 10 (16) 38 Other comprehensive income, net of tax (195) (143)
Total comprehensive income 1,254 1,287
Statement of comprehensive income is allocated to:Shareholders of DSV A/S 1,245 1,284Non-controlling interests 9 3Total 1,254 1,287
40 DSV 2012 ANNUAL REPORT – cONSOLiDATED fiNANciAL STATEmENTS

BalanCe sheet, assets(DKKm) Note 2011 2012
Intangibles 12 8,683 8,723Property, plant and equipment 13 4,503 4,261Investments in associates 14 26 17Other securities and receivables 15 144 136 Deferred tax asset 16 430 409 Total non-current assets 13,786 13,546
Trade and other receivables 17 8,565 8,658 Cash and cash equivalents 367 552 Assets held for sale 16 38 Total current assets 8,948 9,248
Total assets 22,734 22,794
BalanCe sheet, equIty and lIaBIlItIes(DKKm) Note 2011 2012
Share capital 18 190 188 Reserves 5,089 5,160DSV A/S shareholders’ share of equity 5,279 5,348Non-controlling interests 30 37Total equity 5,309 5,385 Deferred tax 16 527 411 Pensions and similar obligations 19 975 1,078 Provisions 20 391 418 Financial liabilities 21 6,091 6,190 Total non-current liabilities 7,984 8,097 Provisions 20 215 275 Financial liabilities 21 861 923 Trade and other payables 22 7,938 7,917 Corporation tax 427 197 Total current liabilities 9,441 9,312 Total liabilities 17,425 17,409 Total equity and liabilities 22,734 22,794
41DSV 2012 ANNUAL REPORT – cONSOLiDATED fiNANciAL STATEmENTS

Cash flow statement (DKKm) Note 2011 2012
Profit before tax 1,995 2,019 Adjustment, non-cash operating items etc.: Amortisation and depreciation 555 534 Share-based payments 34 40 Special items - 4 Change in provisions (128) 22 Share of profit of associates (7) (7)Financial income 8 (119) (141)Financial expenses 9 557 394 Cash flow from operating activities before change in net working capital and tax 2,887 2,865 Change in net working capital (184) (196)Financial income, paid 120 141 Financial expenses, paid (535) (377)Corporation tax, paid (425) (782)Cash flow from operating activities 1,863 1,651 Acquisition of intangibles (96) (132)Acquisition of property, plant and equipment (548) (446)Sale of property, plant and equipment 680 404 Acquisition of subsidiaries and activities 25 (65) (106)Divestment of subsidiaries and activities 25 - 12 Change in other financial assets (5) 19 Cash flow from investing activities (34) (249) Free cash flow 1,829 1,402 Other non-current liabilities incurred 2,022 750 Repayment of loans and credits (880) (547)Other financial liabilities incurred (459) (66)Shareholders: Dividends distributed (105) (190)Purchase and sale of treasury shares (2,505) (1,302)Sale of treasury shares, exercise of share options 87 219Other transactions with shareholders 23 34 Cash flow from financing activities (1,817) (1,102) Cash flow for the year 12 300 Cash and cash equivalents 1 January* 363 367 Cash flow for the year 12 300 Foreign currency translation adjustments (8) (115) Cash and cash equivalents 31 December 367 552 The cash flow statement cannot be directly derived from the balance sheet and income statement. Statement of adjusted free cash flow Free cash flow 1,829 1,402 Net acquisition of subsidiaries and activities 65 94 Normalisation of working capital in subsidiaries and activities acquired - 13Adjusted free cash flow 1,894 1,509 *) Cash and cash equivalents comprised DKK 369 million (2011: DKK 234 million) relating to subsidiaries’ cash and cash equivalents in countries with
foreign exchange control or other restrictions which imply that the cash is not immediately available for general use for the Group.
42 DSV 2012 ANNUAL REPORT – cONSOLiDATED fiNANciAL STATEmENTS

statement of Changes In equIty - 2011 DSV A/S shareholders’ Non- Share Hedging Translation Retained Proposed share of controlling Total (DKKm) capital reserve reserve earnings dividends equity interests equity
Equity at 1 January 2011 209 (110) 66 6,279 105 6,549 36 6,585 Profit for the year - - - 1,250 190 1,440 9 1,449 Foreign currency translation adjustments, foreign enterprises - - (8) - - (8) - (8)Fair value adjustments for the year relating to hedging instruments - (61) - - - (61) - (61)Fair value adjustments relating to hedging instruments transferred to financial expenses - 62 - - - 62 - 62 Actuarial gains/(losses) - - - (171) - (171) - (171)Other adjustments - - - (1) - (1) - (1)Tax on other comprehensive income - 3 - (19) - (16) - (16)Other comprehensive income, net of tax - 4 (8) (191) - (195) - (195) Total comprehensive income for the period - 4 (8) 1,059 190 1,245 9 1,254 Transactions with owners: Share-based payments - - - 34 - 34 - 34 Dividends distributed - - - - (105) (105) (5) (110)Purchase and sale of treasury shares, net - - - (2,418) - (2,418) - (2,418)Capital reduction (19) - - 19 - - - - Acquisition/sale of non- controlling interests - - - (16) - (16) (10) (26)Dividends on treasury shares - - - 4 - 4 - 4 Tax on transactions with owners - - - (14) - (14) - (14)Total transactions with owners (19) - - (2,391) (105) (2,515) (15) (2,530) Equity at 31 December 2011 190 (106) 58 4,947 190 5,279 30 5,309
43DSV 2012 ANNUAL REPORT – cONSOLiDATED fiNANciAL STATEmENTS

statement of Changes In equIty - 2012 DSV A/S shareholders’ Non- Share Hedging Translation Retained Proposed share of controlling Total (DKKm) capital reserve reserve earnings dividends equity interests equity
Equity at 1 January 2012 190 (106) 58 4,947 190 5,279 30 5,309 Profit for the year - - - 1,192 235 1,427 3 1,430 Foreign currency translation adjustments, foreign enterprises - - (42) - - (42) - (42)Fair value adjustment for the year relating to hedging instruments - (85) - - - (85) - (85)Fair value adjustment relating to hedging instruments transferred to financial expenses - 61 - - - 61 - 61 Actuarial gains/(losses) - - - (115) - (115) - (115)Tax on other comprehensive income - 23 - 15 - 38 - 38 Other comprehensive income, net of tax - (1) (42) (100) - (143) - (143) Total comprehensive income for the period - (1) (42) 1,092 235 1,284 3 1,287 Transactions with owners: Share-based payments - - - 40 - 40 - 40 Dividends distributed - - - - (190) (190) - (190)Purchase and sale of treasury shares, net - - - (1,084) - (1,084) - (1,084)Capital reduction (2) - - 2 - - - - Dividends on treasury shares - - - 3 - 3 - 3 Other adjustments - - - - - - 4 4 Tax on transactions with owners - - - 16 - 16 - 16 Total transactions with owners (2) - - (1,023) (190) (1,215) 4 (1,211) Equity at 31 December 2012 188 (107) 16 5,016 235 5,348 37 5,385
Retained earnings reserve at 31 December 2012 comprised a premium of DKK 1,354 million arising on the issue of shares (2011: DKK 1,354 mil-lion) less the negative balance between the purchase and sale of treasury shares of DKK 6,501 million (2011: a negative DKK 5,417 million).
Sale of treasury shares relates to the exercise of share options in connection with incentive schemes.
44 DSV 2012 ANNUAL REPORT – cONSOLiDATED fiNANciAL STATEmENTS
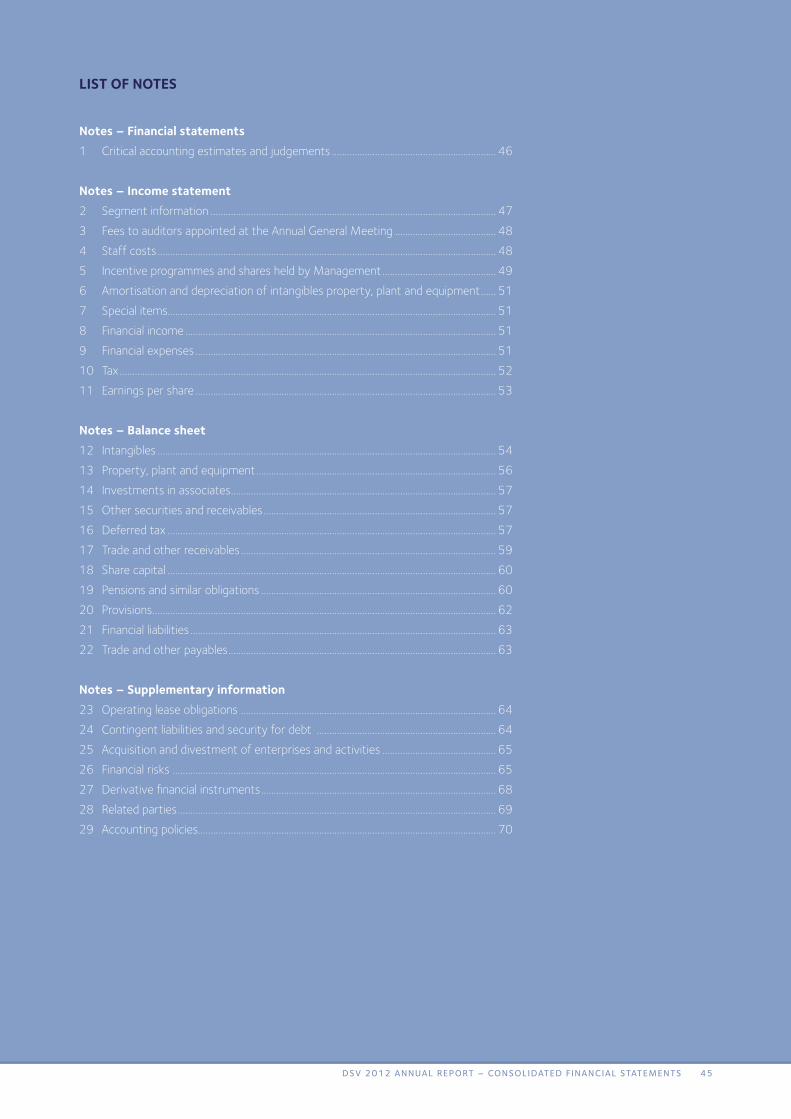
lIst of notes
notes – financial statements1 Critical accounting estimates and judgements ................................................................. 46 notes – Income statement2 Segment information ................................................................................................................. 473 Fees to auditors appointed at the Annual General Meeting ........................................ 484 Staff costs ...................................................................................................................................... 485 Incentive programmes and shares held by Management ............................................. 496 Amortisation and depreciation of intangibles property, plant and equipment ...... 517 Special items .................................................................................................................................. 518 Financial income ........................................................................................................................... 519 Financial expenses ....................................................................................................................... 5110 Tax ..................................................................................................................................................... 5211 Earnings per share ....................................................................................................................... 53 notes – Balance sheet12 Intangibles ...................................................................................................................................... 5413 Property, plant and equipment ............................................................................................... 5614 Investments in associates ......................................................................................................... 5715 Other securities and receivables ............................................................................................ 5716 Deferred tax .................................................................................................................................. 5717 Trade and other receivables ..................................................................................................... 5918 Share capital .................................................................................................................................. 6019 Pensions and similar obligations ............................................................................................. 6020 Provisions ........................................................................................................................................ 6221 Financial liabilities ......................................................................................................................... 6322 Trade and other payables .......................................................................................................... 63 notes – supplementary information23 Operating lease obligations ..................................................................................................... 6424 Contingent liabilities and security for debt ....................................................................... 6425 Acquisition and divestment of enterprises and activities ............................................. 6526 Financial risks ................................................................................................................................ 6527 Derivative financial instruments ............................................................................................. 6828 Related parties .............................................................................................................................. 6929 Accounting policies...................................................................................................................... 70
45DSV 2012 ANNUAL REPORT – cONSOLiDATED fiNANciAL STATEmENTS

note 1 – CrItICal aCCountIng estImates and judgements
In the preparation of the Consolidated Financial Statements of DSV A/S, Management makes various accounting estimates and judge-ments that affect the reported amounts of assets, liabilities, income, expenses, cash flow and related information at the reporting date. The estimates are based on historical experience and other factors deemed reasonable in the circumstances. By their nature, such estimates are subject to some uncertainty and the actual results may deviate from these estimates. The estimates are continually evaluated and the ef-fect of any changes are recognised in the relevant period.
The accounting estimates and judgements deemed by Management to be material for the preparation of the consolidated financial statements are as follows:
goodwIll ImpaIrment testIngThe annual goodwill impairment test implies an assessment as to whether the units of the Group to which the reported goodwill relates will be able to generate sufficient positive cash flow in future to support the carrying amount of the goodwill. A number of critical estimates are made in connection with the impairment test, including of the expected free cash flow a number of years ahead and in relation to determination of the discount rate. Please refer to note 12 for a detailed description of the goodwill impairment test.
revenueAt the close of accounting periods accounting estimates and judge-ments are made regarding forwarding in progress, including accrual of income and pertaining direct costs. These estimates are based on experience and continuous follow-up on provisions for forwarding in progress relative to subsequent invoicing. Changes in forwarding in progress are recognised in revenue and direct costs.
provIsIons and ContIngenCIesManagement continually assesses provisions, contingent assets and liabilities and the likely outcome of pending and potential legal pro-ceedings. The outcome of such proceedings depends on future events, which are obviously uncertain. Management includes judgements by external legal experts and existing case law in assessing the probable outcome of material legal proceedings, tax issues, etc. Please refer to notes 20 and 24 for detailed information on provisions and contingen-cies.
pensIonsFor the determination of the Group’s pension obligations related to de-fined benefit plans, Management is required to make several estimates and assessments, e.g., of the expected development in wage/salary level, interest yield, inflation, discount rate and average life expec-tancy. In determining the obligation, the Group makes use of external and independent actuaries. The financial crisis has implied a greater degree of uncertainty in the determination of the discount rate. Please refer to note 19 for a detailed description and specification of pension amounts.
deferred tax assetsThe Group recognises deferred tax assets, including the tax base of tax loss carryforwards, if it is estimated that there will be sufficient future taxable income against which the temporary differences and unutilised tax losses can be utilised. This assessment is based on budgets and
business plans for the following years, including planned business initia-tives. Please refer to note 16 for a further description of deferred tax assets.
CrItICal judgements In applyIng aCCountIng polICIesAs an element of the Group’s accounting policies, Management makes judgements that may have a material impact on the amounts recog-nised in the Consolidated Financial Statements. The critical judgements made for 2012 are summarised below.
leasesThe Group has concluded arm’s length leases for buildings and other equipment. Based on an assessment of the individual lease, an assess-ment is made as to whether these leases are to be considered finance or operating leases in the financial statements.
speCIal ItemsSpecial items are used in connection with the presentation of the profit or loss for the year to distinguish certain items from the other items of the income statement. In connection with the use of special items it is crucial that they are significant items not directly attributable to the ordinary operating activities of the Group. Special items consist of restructuring costs relating to fundamental structural, procedural and managerial reorganisations as well as any related gains or losses on disposals. Moreover, other significant non-recurring items are classified under this item.
Management exercises careful judgement to ensure a correct distinc-tion between ordinary Group operating activities and activities involv-ing income and expenses to be presented under special items. Please refer to note 7 for a further specification and description of special items.
fInanCIal InstrumentsWhen entering into contracts for financial instruments, an assessment is made of whether the instrument qualifies for hedge accounting, including whether the instrument hedges recognised assets and liabili-ties, expected future cash flows or net investments in foreign entities. The effectiveness of recognised financial instruments is assessed on a monthly basis, and any ineffectiveness is recognised in the income statement.
materIalIty In fInanCIal reportIng For the preparation of the Annual Report, Management considers the optimum way of presenting the financial statements. It is important that the content is material to the user. This objective is pursued by making relevant rather than generic descriptions in the Management’s Commentary and only including descriptions of risks, the mitigation thereof and value drivers, etc., that may have or had a material influ-ence on the achievement of the Group’s targets.
A judgements is made when more detailed specifications are necessary in the presentation of the Group’s assets, liabilities, financial position and results or whether an aggregation of less material amounts is pre-ferred. The notes to the financial statements are prepared with focus on ensuring that the content is relevant and the presentations clear. All judgements are made with due consideration of legislation, interna-tional accounting standards and guidelines and of the Annual Report as a whole presenting a true and fair view.
46 DSV 2012 ANNUAL REPORT – cONSOLiDATED fiNANciAL STATEmENTS

note 2 – segment InformatIon The activities of DSV are divided into three divisions: Air & Sea, Road and Solutions. Segment identification is based on the internal financial reporting of the Group. Other activities and non- allocated Air & Sea Road Solutions items and (DKKm) 2011 Division Division Division Parent eliminations Total
Condensed income statement Revenue 18,926 22,641 5,009 438 - 47,014 Intercompany revenue (781) (1,672) (429) (438) 16 (3,304)Revenue 18,145 20,969 4,580 - 16 43,710 Amortisation and depreciation of intangibles, property, plant and equipment 132 154 158 103 2 549 Operating profit before special items 1,355 834 278 (58) 17 2,426 Share of associates’ profit, net of tax 7 7 Net financials (438) (438)Profit before tax (EBT) 1,995 Condensed balance sheet Total gross investments 101 310 205 85 - 701 Total assets 10,374 9,627 1,611 1,122 - 22,734 Total liabilities 4,183 5,382 1,492 6,368 - 17,425
Rest of Geographical information Europe Americas world Total Revenue 37,836 2,565 3,309 43,710 Total intangibles, property, plant and equipment 10,820 1,640 726 13,186
Other activities and non- allocated Air & Sea Road Solutions items and (DKKm) 2012 Division Division Division Parent eliminations Total
Condensed income statement Revenue 19,855 22,654 5,181 480 144 48,314 Intercompany revenue (846) (1,692) (304) (480) (80) (3,402)Revenue 19,009 20,962 4,877 - 64 44,912 Amortisation and depreciation of intangibles, property, plant and equipment 134 135 145 120 - 534 Operating profit before special items 1,412 933 250 (65) 10 2,540 Special items (275) (275)Share of associates’ profit, net of tax 7 7 Net financials (253) (253)Profit before tax (EBT) 2,019 Condensed balance sheet Total gross investments 151 262 163 127 - 703 Total assets 10,645 9,613 1,546 990 - 22,794 Total liabilities 3,986 5,453 1,514 6,456 - 17,409
Rest of Geographical information Europe Americas world Total Revenue 38,366 2,944 3,602 44,912 Total intangibles, property, plant and equipment 10,636 1,615 711 12,962
Inter-segment transactions are made on an arm’s length basis.
The corporate headquarters of DSV is located in Denmark. Revenue for Denmark came to DKK 6,147 million for 2012 (2011: DKK 6,318 million) and intangibles, property, plant and equipment stood at DKK 2,670 million at 31 December 2012 (2011: DKK 2,978 million).
47DSV 2012 ANNUAL REPORT – cONSOLiDATED fiNANciAL STATEmENTS

note 3 – fees to audItors appoInted at the annual general meetIng (DKKm) 2011 2012
Statutory audit 17 16 Tax and VAT advisory services 3 4 Other services 4 2 Total fees to auditors appointed at the Annual General Meeting 24 22 Others, audit 1 2 Others, total fees 1 2
Total fees 25 24
Auditors appointed at the Annual General Meeting, 2012: KPMG (2011: KPMG).
note 4 – staff Costs(DKKm) 2011 2012
Wages and salaries etc. 5,546 5,702 Defined contribution pension plans, see note 19 246 259 Defined benefit pension plans, see note 19 36 45 Other expenses for social security 1,009 1,035 Share-based payments 34 40 6,871 7,081 Transferred to direct costs (2,119) (2,217)Total staff costs 4,752 4,864 Average number of full-time employees 21,445 21,573 Number of full-time employees at year-end 21,678 21,932 Remuneration of the Executive Board Jens Bjørn Andersen Jens H. Lund Total(DKKm) 2011 2012 2011 2012 2011 2012
Fixed salary 6.2 6.4 4.3 4.6 10.5 11.0 Defined contribution pension plans 0.5 0.5 0.1 0.1 0.6 0.6 Bonus 2.5 2.5 1.7 1.7 4.2 4.2 Share-based payments 1.8 2.1 1.3 1.5 3.1 3.6 Total remuneration of Executive Board 11.0 11.5 7.4 7.9 18.4 19.4
The members of the Executive Board are subject to a notice period of up to 24 months.For information on the exercise of share options by the Executive Board, please refer to note 5.
Remuneration of the Board of Directors of the Parent (DKK’000) 2011 2012
Kurt K. Larsen, Chairman 1,050 1,181 Erik B. Pedersen, Deputy Chairman 525 525 Kaj Christiansen 350 350 Per Skov (resigned 2012) 481 131 Annette Sadolin 481 525 Birgit W. Nørgaard 350 350 Thomas Plenborg (elected 2011) 525 700 Total remuneration of the Board of Directors of the Parent 3,762 3,762
Remuneration of the members of the Executive Board and the Board of Directors is calculated using the principles of the Company’s Remuneration Policy.
48 DSV 2012 ANNUAL REPORT – cONSOLiDATED fiNANciAL STATEmENTS
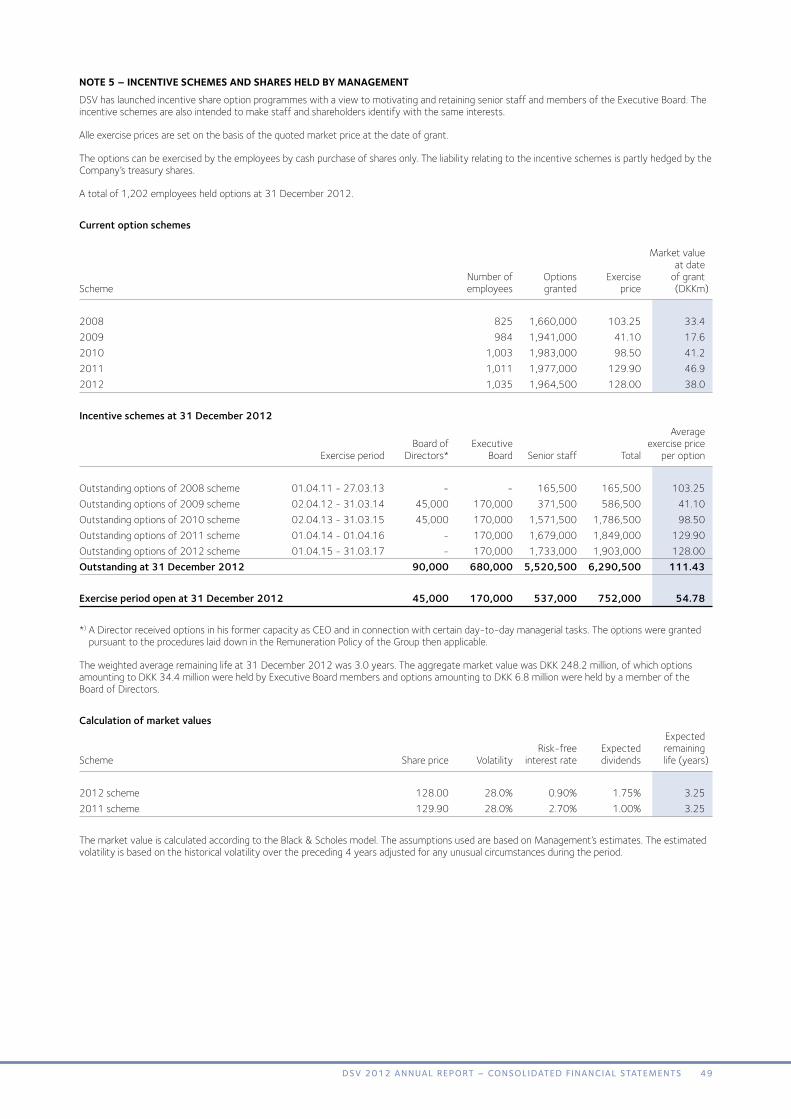
note 5 – InCentIve sChemes and shares held By managementDSV has launched incentive share option programmes with a view to motivating and retaining senior staff and members of the Executive Board. The incentive schemes are also intended to make staff and shareholders identify with the same interests.
Alle exercise prices are set on the basis of the quoted market price at the date of grant.
The options can be exercised by the employees by cash purchase of shares only. The liability relating to the incentive schemes is partly hedged by the Company’s treasury shares.
A total of 1,202 employees held options at 31 December 2012.
Current option schemes Market value at date Number of Options Exercise of grant Scheme employees granted price (DKKm)
2008 825 1,660,000 103.25 33.42009 984 1,941,000 41.10 17.62010 1,003 1,983,000 98.50 41.22011 1,011 1,977,000 129.90 46.92012 1,035 1,964,500 128.00 38.0
Incentive schemes at 31 December 2012 Average Board of Executive exercise price Exercise period Directors* Board Senior staff Total per option
Outstanding options of 2008 scheme 01.04.11 - 27.03.13 - - 165,500 165,500 103.25Outstanding options of 2009 scheme 02.04.12 - 31.03.14 45,000 170,000 371,500 586,500 41.10Outstanding options of 2010 scheme 02.04.13 - 31.03.15 45,000 170,000 1,571,500 1,786,500 98.50Outstanding options of 2011 scheme 01.04.14 - 01.04.16 - 170,000 1,679,000 1,849,000 129.90Outstanding options of 2012 scheme 01.04.15 - 31.03.17 - 170,000 1,733,000 1,903,000 128.00Outstanding at 31 December 2012 90,000 680,000 5,520,500 6,290,500 111.43
Exercise period open at 31 December 2012 45,000 170,000 537,000 752,000 54.78
*) A Director received options in his former capacity as CEO and in connection with certain day-to-day managerial tasks. The options were granted pursuant to the procedures laid down in the Remuneration Policy of the Group then applicable.
The weighted average remaining life at 31 December 2012 was 3.0 years. The aggregate market value was DKK 248.2 million, of which options amounting to DKK 34.4 million were held by Executive Board members and options amounting to DKK 6.8 million were held by a member of the Board of Directors.
Calculation of market values Expected Risk-free Expected remaining Scheme Share price Volatility interest rate dividends life (years)
2012 scheme 128.00 28.0% 0.90% 1.75% 3.252011 scheme 129.90 28.0% 2.70% 1.00% 3.25
The market value is calculated according to the Black & Scholes model. The assumptions used are based on Management’s estimates. The estimated volatility is based on the historical volatility over the preceding 4 years adjusted for any unusual circumstances during the period.
49DSV 2012 ANNUAL REPORT – cONSOLiDATED fiNANciAL STATEmENTS

note 5 – InCentIve sChemes and shares held By management (ContInued)Development in outstanding options Average Board of Executive exercise price Directors Board Senior staff Total per option
Outstanding at 1 Januar 2011 260,000 550,000 5,785,600 6,595,600 82.90Granted in 2011 - 170,000 1,807,000 1,977,000 129.90 Exercised in 2011 - - (943,100) (943,100) 92.86 Options waived/expired - - (212,500) (212,500) 90.94 Outstanding at 31 December 2011 260,000 720,000 6,437,000 7,417,000 93.93
Granted in 2012 - 170,000 1,794,500 1,964,500 128.00 Exercised in 2012 (170,000) (210,000) (2,460,000) (2,840,000) 77.23 Options waived/expired - - (251,000) (251,000) 111.03 Outstanding at 31 December 2012 90,000 680,000 5,520,500 6,290,500 111.43
The average consideration paid for options exercised in the financial year was DKK 127.89 per share at the date of exercise.
Oustanding options for members of the Board of Directors have been granted to Kurt K. Larsen, and outstanding options for Executive Board mem-bers were granted to Jens Bjørn Andersen (400,000 options) and Jens H. Lund (280,000 options).
Shares held by members of the Executive Board and the Board of Directors
Shares at Shares Shares Market beginning purchased sold in Shares at value of year in 2012 2012 year-end (DKKm)
Jens Bjørn Andersen 44,500 100,000 100,000 44,500 6.5 Jens H. Lund 61,370 110,000 161,370 10,000 1.4 Kurt K. Larsen * 232,590 170,000 170,000 232,590 33.9 Erik B. Pedersen 300,000 - - 300,000 43.7 Kaj Christiansen 53,000 - 1,000 52,000 7.6 Annette Sadolin 3,885 - - 3,885 0.6 Total 695,345 380,000 432,370 642,975 93.7
*) Of which, 145,500 shares are held in a custody account in the name of a related party, reference is made to Company Announcement No. 440.
50 DSV 2012 ANNUAL REPORT – cONSOLiDATED fiNANciAL STATEmENTS

note 6 – amortIsatIon and depreCIatIon of IntangIBles, property, plant and equIpment(DKKm) 2011 2012
Software 112 131 Customer relationships 107 109 Buildings 152 141 Other plant and operating equipment 194 185 Net gain on sale of assets (16) (32)Total amortisation and depreciation of intangibles, property, plant and equipment 549 534
note 7 – speCIal Items(DKKm) 2011 2012
Net loss on acquisition and divestment of enterprises and related restructuring costs - 17 Restructuring costs - 258 Special items, total costs - 275
Special items, net - (275)
Special items comprises items not directly attributable to the ordinary operating activities of the Group and which consist of restructuring costs relating to fundamental structural, procedural and managerial reorganisations as well as any related gains or losses on disposals. Moreover, other non-recurring items are classified under this item.
Special items totalled an expense of DKK 275 million. Restructuring costs include a non-recurring expense relating to the planned optimisation of business processes and adjustment of overheads. Overheads have been reduced to enable the Group to meet any challenges and maintain a high level of efficiency and profitability and thereby to meet the financial targets set for the Group.
note 8 – fInanCIal InCome (DKKm) 2011 2012
Interest income 52 52 Expected return on pension assets, see note 19 67 66 Foreign currency translation adjustments, net - 23 Total financial income 119 141
Interest income relates to interest from cash included at amortised cost.
note 9 - fInanCIal expenses (DKKm) 2011 2012
Interest expenses 447 290 Calculated interest on pension obligations, see note 19 104 104 Foreign currency translation adjustments, net 6 - Total financial expenses 557 394
Interest expenses relate to interest on loans included at amortised cost and interest on tax liabilities.
51DSV 2012 ANNUAL REPORT – cONSOLiDATED fiNANciAL STATEmENTS

note 10 – tax(DKKm) 2011 2012
The tax for the year is disaggregated as follows: Tax on profit for the year 546 589 Tax on other changes in equity 14 (16)Tax on other comprehensive income 16 (38)Total tax for the year 576 535
Tax on profit for the year is calculated as follows: Current tax 551 648 Deferred tax (17) (60)Tax adjustment relating to previous years 12 1 Total tax on profit for the year 546 589
The tax on profit for the year breaks down as follows: Calculated 25% tax on profit for the year before tax 499 505 Adjustment of calculated tax in foreign Group enterprises relative to 25% 38 70 Change in deferred tax as a result of change in corporation tax rate (1) (4)Tax effect of: Non-deductible expenses/non-taxable income 8 (42)Non-deductible losses/non-taxable gains on shares - (11)Tax adjustment relating to previous years 12 1 Tax asset valuation adjustments, net (63) 22 Other taxes and adjustments 53 48 Total 546 589 Effective tax rate 27.4% 29.2%
Tax on other comprehensive income 2011 2012 Tax income/ Tax income/ (DKKm) Before tax expense Net of tax Before tax expense Net of tax
Foreign currency translation adjustments, foreign enterprises (8) - (8) (42) - (42)Fair value adjustment of hedging instruments 1 3 4 (24) 23 (1)Actuarial gains/(losses) (171) 41 (130) (115) 15 (100)Other adjustments (1) (60) (61) - - - Total (179) (16) (195) (181) 38 (143)
52 DSV 2012 ANNUAL REPORT – cONSOLiDATED fiNANciAL STATEmENTS

note 11 – earnIngs per share(DKKm) 2011 2012
DSV A/S shareholders’ share of profit for the year 1,440 1,427 Amortisation of customer relationships 107 109Share-based payments 34 40 Special items, net - 275 Tax effect thereof (35) (106)Adjusted profit for the year 1,546 1,745
Total average number of shares (‘000) 204,169 188,596 Average number of treasury shares (‘000) (7,937) (5,966)Average number of shares in circulation (‘000) 196,232 182,630 Average dilutive effect of outstanding options under incentive schemes (‘000) 1,381 1,341 Diluted average number of shares in circulation (‘000) 197,613 183,971
Earnings per share of DKK 1 7.34 7.81Diluted earnings per share of DKK 1 7.29 7.76Adjusted earnings per share of DKK 1 7.88 9.55Diluted adjusted earnings per share of DKK 1 7.82 9.48
Diluted earnings per share and diluted adjusted earnings per share have been calculated exclusive of 2,838,500 out-of-the-money options (2011: 962,500 options), which may have a dilutive effect on earnings per share and adjusted earnings per share.
53DSV 2012 ANNUAL REPORT – cONSOLiDATED fiNANciAL STATEmENTS
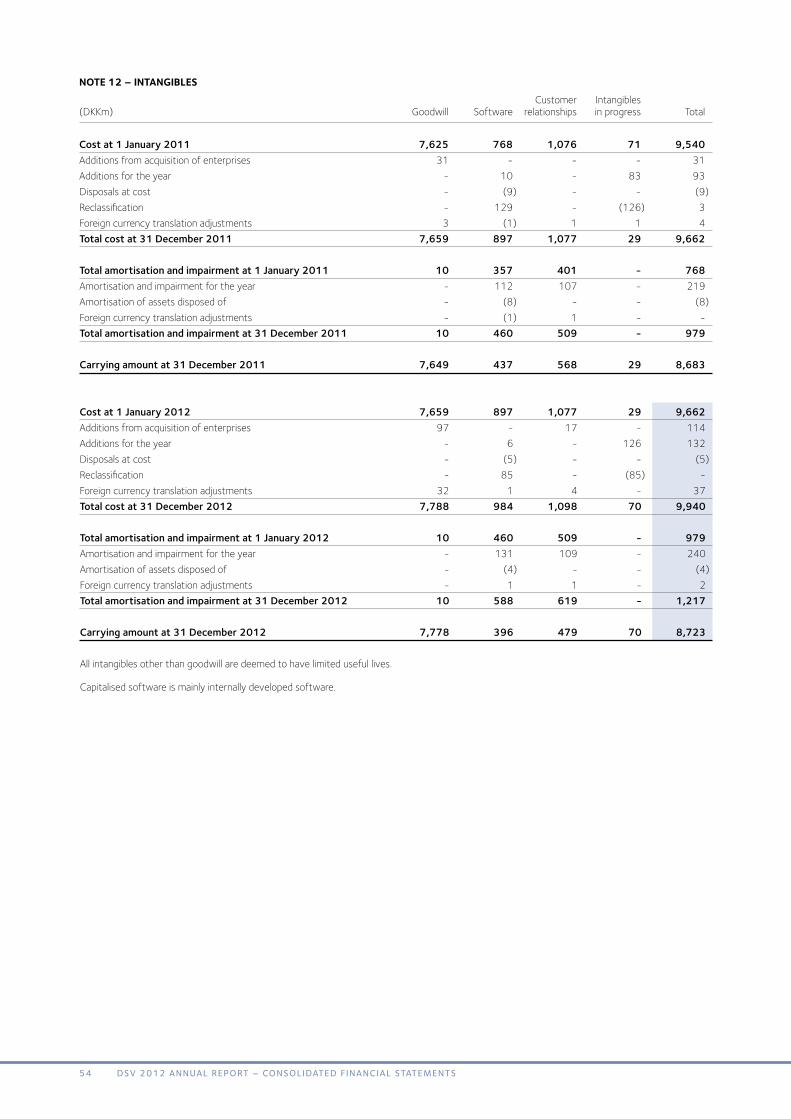
note 12 – IntangIBles Customer Intangibles (DKKm) Goodwill Software relationships in progress Total
Cost at 1 January 2011 7,625 768 1,076 71 9,540Additions from acquisition of enterprises 31 - - - 31Additions for the year - 10 - 83 93Disposals at cost - (9) - - (9)Reclassification - 129 - (126) 3Foreign currency translation adjustments 3 (1) 1 1 4Total cost at 31 December 2011 7,659 897 1,077 29 9,662
Total amortisation and impairment at 1 January 2011 10 357 401 - 768Amortisation and impairment for the year - 112 107 - 219Amortisation of assets disposed of - (8) - - (8)Foreign currency translation adjustments - (1) 1 - -Total amortisation and impairment at 31 December 2011 10 460 509 - 979 Carrying amount at 31 December 2011 7,649 437 568 29 8,683
Cost at 1 January 2012 7,659 897 1,077 29 9,662Additions from acquisition of enterprises 97 - 17 - 114 Additions for the year - 6 - 126 132 Disposals at cost - (5) - - (5)Reclassification - 85 - (85) - Foreign currency translation adjustments 32 1 4 - 37 Total cost at 31 December 2012 7,788 984 1,098 70 9,940 Total amortisation and impairment at 1 January 2012 10 460 509 - 979 Amortisation and impairment for the year - 131 109 - 240 Amortisation of assets disposed of - (4) - - (4)Foreign currency translation adjustments - 1 1 - 2 Total amortisation and impairment at 31 December 2012 10 588 619 - 1,217 Carrying amount at 31 December 2012 7,778 396 479 70 8,723
All intangibles other than goodwill are deemed to have limited useful lives.
Capitalised software is mainly internally developed software.
54 DSV 2012 ANNUAL REPORT – cONSOLiDATED fiNANciAL STATEmENTS

note 12 – IntangIBles (ContInued)Breakdown of goodwill by division The original cost of goodwill is DKK 7,967 million (2011: DKK 7,870 million). The original cost has been applied for calculating ROIC. Goodwill has been allocated to the divisions of the Group: Air & Sea, Road and Solutions. Goodwill % Carrying Carrying (DKKm) 2011 Cost amount Cost amount
Air & Sea 4,131 4,071 52% 53%Road 2,652 2,492 34% 33%Solutions 1,087 1,086 14% 14%Total 7,870 7,649 100% 100%
Goodwill % Carrying Carrying (DKKm) 2012 Cost amount Cost amount
Air & Sea 4,218 4,171 53% 53%Road 2,662 2,520 33% 33%Solutions 1,087 1,087 14% 14%Total 7,967 7,778 100% 100% Goodwill impairment testingAs at 31 December 2012, the carrying amount of goodwill was tested for impairment.
The impairment test is made of the Group’s cash-generating units based on management structure and internal management control. Such determi-nation is generally made at division level, for Air & Sea, Road and Solutions.
The impairment test for the cash-generating units compares the recoverable amount, equivalent to the discounted value of the expected future net cash flow, with the carrying amount of the individual cash-generating unit.
The expected future net cash flow is based on budgets and business plans approved by Management for the year 2013 and projections for subse-quent years up to and including 2017. Important parameters are revenue development, gross profit, EBITA margin, future capital expenditure and growth expectations in the terminal period, based on assessments of the individual division.
The calculation of the discounted net cash flow applies discount rates reflecting the risk-free interest rate with the addition of the risks related to the individual cash-generating units, including geographical location and financial risk.
Impairment tests are based on the following key assumptions:
Air & Sea Road Solutions 2011 2012 2011 2012 2011 2012
Expected annual revenue growth (weighted average) 5.0% 5.0% 5.0% 5.0% 2.7% 5.3%Expected EBITA margin (weighted average) 6.9% 7.1% 4.2% 4.3% 6.0% 6.2%Expected growth in terminal period (%) 2.0% 2.0% 2.0% 2.0% 2.0% 2.0%Discount rate before tax (%) 10.6% 10.1% 10.6% 10.1% 10.5% 10.0%
Management determines the expected annual revenue growth and the expected EBITA margin based on historical experience and assumptions of expected market developments.
Expected growth in the terminal period is deemed not to exceed the long-term average growth rate of the industry.
Based on the impairment tests carried out, it was concluded that no basis for impairment existed at 31 December 2012.
Management assesses that the probable changes in the fundamental assumptions will not make the carrying amount of goodwill exceed the recov-erable amount.
55DSV 2012 ANNUAL REPORT – cONSOLiDATED fiNANciAL STATEmENTS

note 13 – property, plant and equIpment Other Property, plant and plant and Land and operating equipment buildings equipment in progress Total
Cost at 1 January 2011 4,654 1,639 139 6,432Additions from acquisition of enterprises - 1 - 1Additions for the year 43 170 363 576Disposals at cost (447) (155) - (602)Transferred to assets held for sale (44) - (1) (45)Reclassification 58 14 (75) (3)Foreign currency translation adjustments 5 (11) 1 (5)Total cost at 31 December 2011 4,269 1,658 427 6,354 Total depreciation and impairment at 1 January 2011 641 1,009 - 1,650Depreciation for the year 152 194 - 346Depreciation of assets disposed of (36) (106) - (142)Transferred to assets held for sale 3 - - 3Reclassification (1) (1) - (2)Foreign currency translation adjustments 1 (5) - (4)Total depreciation and impairment at 31 December 2011 760 1,091 - 1,851 Carrying amount at 31 December 2011 3,509 567 427 4,503Of which assets under finance leases 409 49 - 458 Cost at 1 January 2012 4,269 1,658 427 6,354Additions from acquisition of enterprises - 4 - 4Additions for the year 48 137 268 453Disposals at cost (174) (187) (202) (563)Transferred to assets held for sale (30) - - (30)Reclassification 30 6 (36) -Foreign currency translation adjustments 50 21 17 88Total cost at 31 December 2012 4,193 1,639 474 6,306 Total depreciation and impairment at 1 January 2012 760 1,091 - 1,851Depreciation for the year 141 185 - 326Depreciation of assets disposed of (24) (161) - (185)Transferred to assets held for sale (4) - - (4)Impairment* 13 - 20 33Foreign currency translation adjustments 9 15 - 24Total depreciation and impairment at 31 December 2012 895 1,130 20 2,045 Carrying amount at 31 December 2012 3,298 509 454 4,261Of which assets under finance leases 395 27 - 422 At 31 December 2012, DSV had contractual liabilities relating to property, plant and equipment in progress of DKK 5 million (2011: DKK 170 mil-lion).
No indication of impairment of property, plant and equipment was identified in the financial year.
*) DKK 33 million recognised as special items (2011: DKK 0 million).
56 DSV 2012 ANNUAL REPORT – cONSOLiDATED fiNANciAL STATEmENTS

note 14 – Investments In assoCIates Summarised aggregate revenue, profit/loss, assets and liabilities of associates listed in the Group structure overview on page 80.
(DKKm) 2011 2012
Revenue 319 435Profit for the year 28 25Total assets 191 182Total liabilities 104 117
DSV Group’s share of profit for the year 7 7Total carrying amount at 31 December 26 17
note 15 – other seCurItIes and reCeIvaBles (DKKm) 2011 2012
Other securities 11 8 Deposits 86 78 Other receivables 47 50 Total other securities and receivables 144 136
Investments in other securities are classified as ‘available for sale’. They mainly relate to unlisted shares and other investments recognised at cost as reliable measurement of their fair value is impossible. No fair value adjustments recognised in equity have been made during the year.
Other receivables relate to loans granted and other financial receivables. The terms of the loans are up to 5 years, and they will be fully repaid in 2017.
note 16 – deferred tax(DKKm) 2011 2012
Deferred tax at 1 January 127 97 Foreign currency translation adjustments, foreign subsidiaries 2 1 Deferred tax for the year (17) (60)Adjustments relating to previous years 7 (10)Tax on equity items (21) (29)Additions from acquisition of enterprises - (2)Other adjustments (1) 5 Deferred tax at 31 December 97 2 Breakdown of deferred tax: Deferred tax asset (430) (409) Deferred tax liability 527 411 Deferred tax at 31 December 97 2
57DSV 2012 ANNUAL REPORT – cONSOLiDATED fiNANciAL STATEmENTS
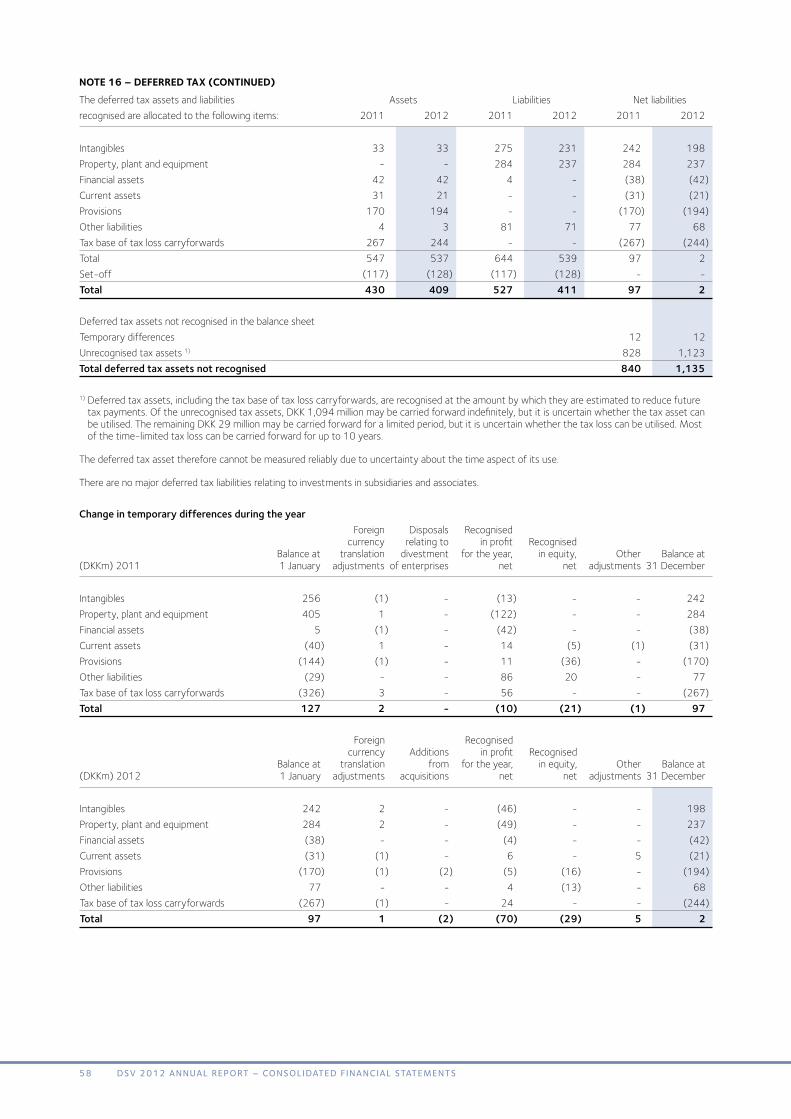
note 16 – deferred tax (ContInued)The deferred tax assets and liabilities Assets Liabilities Net liabilitiesrecognised are allocated to the following items: 2011 2012 2011 2012 2011 2012
Intangibles 33 33 275 231 242 198 Property, plant and equipment - - 284 237 284 237 Financial assets 42 42 4 - (38) (42)Current assets 31 21 - - (31) (21)Provisions 170 194 - - (170) (194)Other liabilities 4 3 81 71 77 68 Tax base of tax loss carryforwards 267 244 - - (267) (244)Total 547 537 644 539 97 2 Set-off (117) (128) (117) (128) - - Total 430 409 527 411 97 2 Deferred tax assets not recognised in the balance sheet Temporary differences 12 12 Unrecognised tax assets 1) 828 1,123 Total deferred tax assets not recognised 840 1,135
1) Deferred tax assets, including the tax base of tax loss carryforwards, are recognised at the amount by which they are estimated to reduce future tax payments. Of the unrecognised tax assets, DKK 1,094 million may be carried forward indefinitely, but it is uncertain whether the tax asset can be utilised. The remaining DKK 29 million may be carried forward for a limited period, but it is uncertain whether the tax loss can be utilised. Most of the time-limited tax loss can be carried forward for up to 10 years.
The deferred tax asset therefore cannot be measured reliably due to uncertainty about the time aspect of its use.
There are no major deferred tax liabilities relating to investments in subsidiaries and associates.
Change in temporary differences during the year Foreign Disposals Recognised currency relating to in profit Recognised Balance at translation divestment for the year, in equity, Other Balance at (DKKm) 2011 1 January adjustments of enterprises net net adjustments 31 December
Intangibles 256 (1) - (13) - - 242 Property, plant and equipment 405 1 - (122) - - 284 Financial assets 5 (1) - (42) - - (38)Current assets (40) 1 - 14 (5) (1) (31)Provisions (144) (1) - 11 (36) - (170)Other liabilities (29) - - 86 20 - 77 Tax base of tax loss carryforwards (326) 3 - 56 - - (267)Total 127 2 - (10) (21) (1) 97
Foreign Recognised currency Additions in profit Recognised Balance at translation from for the year, in equity, Other Balance at (DKKm) 2012 1 January adjustments acquisitions net net adjustments 31 December
Intangibles 242 2 - (46) - - 198 Property, plant and equipment 284 2 - (49) - - 237 Financial assets (38) - - (4) - - (42)Current assets (31) (1) - 6 - 5 (21)Provisions (170) (1) (2) (5) (16) - (194)Other liabilities 77 - - 4 (13) - 68 Tax base of tax loss carryforwards (267) (1) - 24 - - (244)Total 97 1 (2) (70) (29) 5 2
58 DSV 2012 ANNUAL REPORT – cONSOLiDATED fiNANciAL STATEmENTS

note 17 – trade and other reCeIvaBles(DKKm) 2011 2012
Trade receivables 7,112 7,238 Forwarding in progress 604 629 Other receivables etc. 687 584 Prepayments 162 207 Trade and other receivables at 31 December 8,565 8,658 Impairment losses relating to doubtful trade receivables Impairment at 1 January 277 246Impairment for the year 68 55Impairment losses recognised for receivables (71) (78)Reversal of impairments (27) 1 Foreign currency translation adjustments (1) 2 Impairment at 31 December 246 226
In a number of situations DSV receives security in the form of financial guarantees or charges for sales on credit, and the security provided is included in the assessment of the necessity to write down doubtful trade receivables for impairment. At 31 December 2012, security had been provided for DKK 4,031 million of all trade receivables. See note 26 regarding credit risks.
Overdue trade receivables not written off break down as follows: Overdue for 1-30 days 959 1,131 Overdue for 31-120 days 356 414 Overdue for more than 120 days 60 60 The carrying amount of receivables approximates fair value in all essentials.
59DSV 2012 ANNUAL REPORT – cONSOLiDATED fiNANciAL STATEmENTS

note 18 – share CapItal (DKKm) 2011 2012
Share capital, beginning of year 209.2 190.0Capital reduction (19.2) (2.0)Share capital, end of year 190.0 188.0
The share capital of DSV has a nominal value of DKK 188,000,000, corresponding to 188,000,000 shares with a nominal value of DKK 1 each. No share confers any special rights upon its holder. No restrictions apply to the transferability of the shares or to voting rights. The share capital is fully paid up. Treasury shares Shares of DKK 1 Nominal value % of share capital 2011 2012 2011 2012 2011 2012
Treasury shares, beginning of year 2,643,496 4,355,760 2,643,496 4,355,760 1.3 2.3Purchases 21,805,364 10,421,661 21,805,364 10,421,661 10.7 5.5 Used for reduction of share capital (19,150,000) (2,000,000) (19,150,000) (2,000,000) (9.2) (1.0)Used for exercise of share options (943,100) (2,840,000) (943,100) (2,840,000) (0.5) (1.5)Treasury shares, end of year 4,355,760 9,937,421 4,355,760 9,937,421 2.3 5.3
Treasury shares are bought back to hedge the Company’s incentive schemes and adapt its capital structure. The market value of treasury shares at 31 December 2012 was DKK 1,448 million (2011: DKK 449 million). The acquisition price of treasury shares repurchased in 2012 was DKK 1,302 million, and the selling price of treasury shares sold was DKK 326 million.
DividendsIt is proposed to distribute dividends of DKK 1.25 per share (2011: DKK 1.00). DSV A/S paid DKK 190 million as dividends on 27 March 2012, cor-responding to DKK 1 per share (2011: DKK 105 million, corresponding to DKK 0.50 per share).
Distribution of dividends to the shareholders of DSV A/S has no tax consequences for DSV A/S.
note 19 – pensIons and sImIlar oBlIgatIons(DKKm) 2011 2012
Present value of defined benefit plans 2,228 2,606 Fair value of pension plan assets 1,253 1,528 Pensions and similar obligations at 31 December 975 1,078 Development in present value of defined benefit obligations: Obligations at 1 January 2,048 2,228 Foreign currency translation adjustments 15 35 Pension costs relating to current financial year 36 45 Calculated interest on obligations 104 104 Actuarial losses 113 274 Benefits paid (88) (81)Additions from acquisition of enterprises - 1 Obligations at 31 December 2,228 2,606 Specification of present value of defined benefit obligations at year-end Present value of obligations hedged in full or in part 1,458 1,758 Present value of non-hedged obligations 770 848 Present value of defined benefit obligations 2,228 2,606
60 DSV 2012 ANNUAL REPORT – cONSOLiDATED fiNANciAL STATEmENTS

note 19 – pensIons and sImIlar oBlIgatIons (ContInued)(DKKm) 2011 2012
Development in fair value of pension plan assets: Pension plan assets at 1 January 1,177 1,253 Foreign currency translation adjustments 13 20 Expected return on pension plan assets 67 66 Actuarial gains and losses (44) 158 Payments received 132 115 Benefits paid (92) (84)Pension plan assets at 31 December 1,253 1,528
DSV expects to pay DKK 104 million into the assets of the defined benefit plans in 2013. Pension costs recognised in the income statement: Pension costs relating to current financial year 36 45 Calculated interest on obligations 104 104 Expected return on pension plan assets (67) (66)Total recognised for defined benefit plans 73 83 Total recognised for defined contribution plans 246 259 Total recognised in income statement 319 342 Costs are recognised under the following items of the income statement: Staff costs 282 304 Financial income (67) (66)Financial expenses 104 104 Total costs recognised 319 342 The following cumulative actuarial gains and losses have been recognised in the statement of comprehensive income since 1 January 2004: Cumulative actuarial losses (384) (499)Social security costs relating to actuarial losses (11) (11)Cumulative actuarial losses including social security benefits recognised in the statement of comprehensive income (395) (510) Breakdown of pensions plan assets: Shares 27% 23%Bonds 23% 20%Properties 1% 0%Insurance contracts 49% 57%Total 100% 100% Return on pension plan assets: Expected return on pension plan assets 67 66 Actuarial gains and losses on pension plan assets (44) 157 Total actual return on pension plan assets 23 223
61DSV 2012 ANNUAL REPORT – cONSOLiDATED fiNANciAL STATEmENTS

note 19 – pensIons and sImIlar oBlIgatIons (ContInued)Actuarial assumptionsThe actuarial assumptions used in calculations and valuations vary from country to country owing to national economic and social conditions. In the European countries, which have the most significant pension plans, the following assumptions are used: 2011 2012 Weighted Weighted Spread average Spread average
Discount rate 2.50% - 5.25% 4.70% 3.00% - 4.50% 4.01%Expected return on pension plan assets 4.40% - 5.25% 5.09% 3.50% - 4.50% 4.29%Future rate of wage/salary increases 2.50% - 3.75% 2.89% 2.00% - 3.40% 2.82%Future rate of inflation 1.75% - 2.50% 2.11% 1.75% - 2.50% 2.08%
The expected return on pension plan assets is determined on the basis of asset composition and general expectations of the economic development. Five-year overview 2008 2009 2010 2011 2012
Pension obligations 1,785 1,931 2,048 2,228 2,606 Pension assets 975 1,047 1,177 1,253 1,528 Inadequate cover 810 884 871 975 1,078 Experience adjustment to pension obligations (11) 6 (16) (54) 21 Experience adjustment to pension assets 88 (71) (39) 44 (159) In defined contribution pension plans the employer must make a specific contribution (a fixed amount or a fixed percentage of the wage or salary). Defined contribution plans imply no risk to the Group as concerns the future development in yield, inflation, mortality and disability.
In defined benefit pension plans the employer undertakes to pay a specific benefit (an old-age pension as a fixed amount or a fixed percentage of the final wage or salary on retirement). Defined benefit plans imply a risk to the Group as concerns the future development in yield, inflation, mortality and disability. The Group has defined benefit pension plans mainly in Great Britain, the Netherlands, Belgium, Germany, Sweden and Italy.
The pension obligations of certain Group enterprises are hedged by insurance. Foreign enterprises with no or only partial insurance cover (defined benefit plans) measure the unhedged pension obligations actuarially at the present value at the reporting date. The Parent only has defined contribu-tion pension plans.
note 20 – provIsIons Restoration of Disputes leased premises Restructuring and legal Onerous and demo- (DKKm) costs actions contracts lition liabilities Other Total
Provisions at 1 January 2012 163 267 18 85 73 606 Additions from acquisition of enterprises - - - - 1 1Applied for the year (55) (84) (9) (1) (53) (202)Provisions for the year 94 49 18 11 59 231 Adjustment of provisions made in previous years (13) 65 1 - 2 55Foreign currency translation adjustments 1 - - - 1 2 Provisions at 31 December 2012 190 297 28 95 83 693 Expected time frame of provisions: Current liabilities 96 101 13 - 65 275Non-current liabilities 94 196 15 95 18 418Provisions at 31 December 2012 190 297 28 95 83 693
Provisions are not discounted because the resulting effect is immaterial.
Restructuring costs mainly relate to the restructuring plan previously announced and mainly consist of termination benefits and costs under termi-nated leases.
Provisions for disputes and legal actions are mainly probable liabilities taken over at the acquisition of enterprises.
Onerous contracts are mainly onerous contracts taken over in connection with acquisitions, consisting of property leases with rent above market levels as well as contracts concluded with customers and leases under which unavoidable costs exceed earnings.
Other provisions predominantly relate to earn-out agreements, accrued gain on sale and lease-back arrangements and complaints.
Provisions are basically expected to be settled within 1 to 2 years.
62 DSV 2012 ANNUAL REPORT – cONSOLiDATED fiNANciAL STATEmENTS
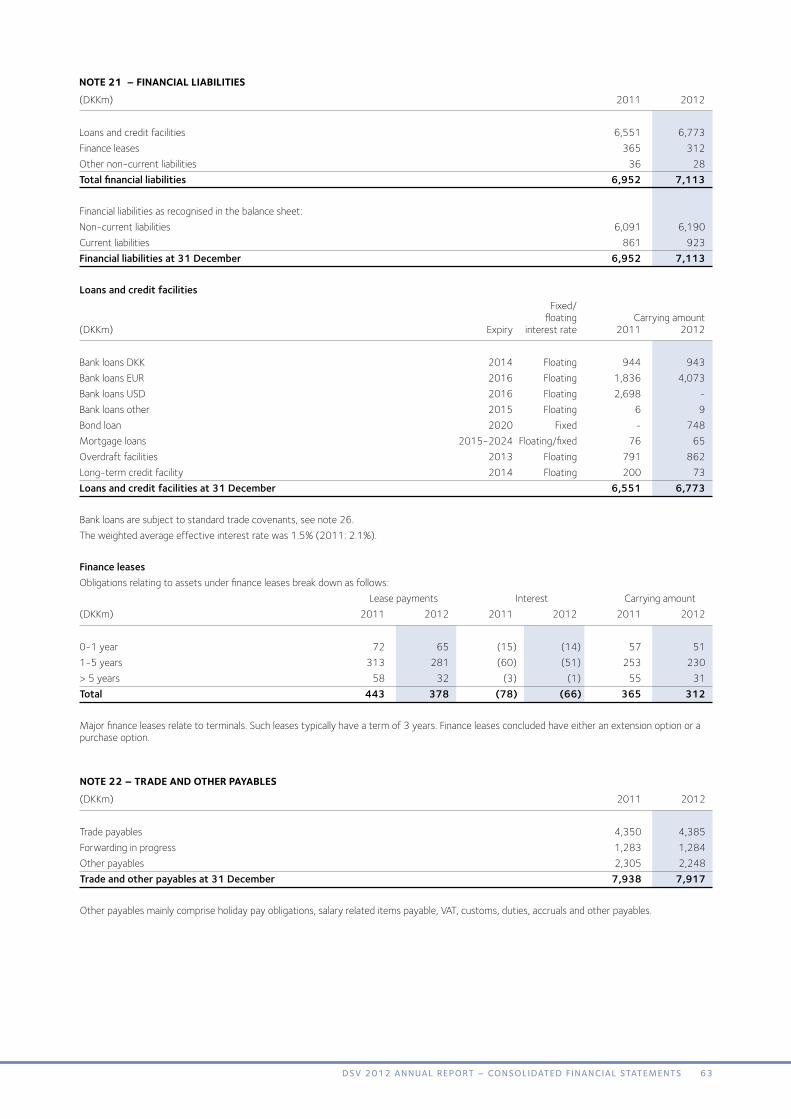
note 21 – fInanCIal lIaBIlItIes (DKKm) 2011 2012
Loans and credit facilities 6,551 6,773Finance leases 365 312Other non-current liabilities 36 28Total financial liabilities 6,952 7,113 Financial liabilities as recognised in the balance sheet: Non-current liabilities 6,091 6,190Current liabilities 861 923Financial liabilities at 31 December 6,952 7,113 Loans and credit facilities Fixed/ floating Carrying amount(DKKm) Expiry interest rate 2011 2012
Bank loans DKK 2014 Floating 944 943Bank loans EUR 2016 Floating 1,836 4,073Bank loans USD 2016 Floating 2,698 -Bank loans other 2015 Floating 6 9Bond loan 2020 Fixed - 748Mortgage loans 2015-2024 Floating/fixed 76 65Overdraft facilities 2013 Floating 791 862Long-term credit facility 2014 Floating 200 73Loans and credit facilities at 31 December 6,551 6,773
Bank loans are subject to standard trade covenants, see note 26. The weighted average effective interest rate was 1.5% (2011: 2.1%). Finance leases Obligations relating to assets under finance leases break down as follows: Lease payments Interest Carrying amount(DKKm) 2011 2012 2011 2012 2011 2012
0-1 year 72 65 (15) (14) 57 511-5 years 313 281 (60) (51) 253 230> 5 years 58 32 (3) (1) 55 31Total 443 378 (78) (66) 365 312
Major finance leases relate to terminals. Such leases typically have a term of 3 years. Finance leases concluded have either an extension option or a purchase option.
note 22 – trade and other payaBles (DKKm) 2011 2012
Trade payables 4,350 4,385 Forwarding in progress 1,283 1,284 Other payables 2,305 2,248 Trade and other payables at 31 December 7,938 7,917 Other payables mainly comprise holiday pay obligations, salary related items payable, VAT, customs, duties, accruals and other payables.
63DSV 2012 ANNUAL REPORT – cONSOLiDATED fiNANciAL STATEmENTS

note 23 – operatIng lease oBlIgatIons(DKKm) 2011 2012
Operating lease obligations relating to land and buildings (including terminals) fall due: 0-1 year 883 928 1-5 years 2,170 2,263 > 5 years 1,341 1,716 Total 4,394 4,907 Operating lease obligations relating to operating equipment fall due:0-1 year 337 381 1-5 years 370 512 > 5 years 1 9 Total 708 902 The following is recognised in the income statement:Operating leases relating to property 994 1,116 Operating leases relating to operating equipment 514 564 Total 1,508 1,680
The Group leases properties under operating leases with an average lease term of 4 years.
The Group has concluded back-to-back leases with several customers, securing future activity at several of its premises leased under operating leases. Of the lease obligations, DKK 0.5 billion relate to back-to-back leases.
The Group leases operating equipment under operating leases. The leases typically have a term of up to 5 years.
note 24 – ContIngent lIaBIlItIes Contingent liabilities In recent years, various competition authorities have carried out inspections of several international transport companies. The inspections are based on alleged violations of competition law within the transport industry. As an international transport provider, DSV has also received notifications and inquiries from the competition authorities. In some of these cases, the authorities issued preliminary rulings, and in one case the authorities found against DSV, see Company Announcement No. 443, published on NASDAQ OMX Copenhagen on 28 March 2012, and one case was decided partly in favour of DSV, see Company Announcement No. 445, published on NASDAQ OMX Copenhagen on 31 March 2012. Management believes that these cases will have no material impact on the financial position of the Group.
As an international transport provider, DSV is regularly involved in tax and VAT cases and other legal proceedings. The effects of some of these cases are recognised based on Management’s assessment of their expected outcome. Other cases are expected to have no material impact on the future financial results of the Group.
Security for debt Bank guaranteesAs part of its ordinary operations DSV has provided bank guarantees to authorities, suppliers, etc. The counterparties may claim the security for any unpaid amount due from DSV. At the reporting date all liabilities relating to the bank guarantees provided were recognised in the balance sheet or stated in note 23 as operating lease obligations.
Property, plant and equipment provided as securityLand and buildings with a carrying amount of DKK 184 million (2011: DKK 185 million) have been provided as security to mortgage banks. Mort-gage debt amounted to DKK 65 million at 31 December 2012 (2011: DKK 76 million).
ContractsDSV has concluded IT service contracts. The costs related to these contracts are recognised as the services are provided.
64 DSV 2012 ANNUAL REPORT – cONSOLiDATED fiNANciAL STATEmENTS

note 25 – aCquIsItIon and dIvestment of enterprIses and aCtIvItIes Acquisition and divestment of subsidiaries and activities in 2012In 2012, the Group acquired enterprises and activities in the Czech Republic, South America, the Middle East and Asia relating to the Group’s three business areas. No significant activities were divested during the year.
On 27 September 2012, DSV signed an agreement to acquire activities from the Czech company AWT Cechofracht a.s. The acquisition strengthened the market position of all three DSV divisions in the Czech Republic.
On 1 October 2012, DSV signed an agreement to acquire the Swift Freight Group of Companies. By the acquisition DSV gained access to new markets on the African continent and strengthened its existing Air & Sea activities in the Middle East and Asia. Under the purchase agreement DSV acquired full ownership of the companies in UAE, China and India and a 33.3% share of ownership of the Swift Freight companies in Africa.
Moreover, on 6 November 2012, DSV signed an agreement to acquire the remaining 60% of the shares in DSV Latin America S.A. (DSV-GL) from the Company’s former Joint Venture partner LOS INKAS S.A. The acquisition strengthened the presence of DSV in Latin America and the existing Air & Sea activities on the continent.
The acquisitions had no significant individual or aggregate impact on Group revenue, profit or balance sheet items. If the acquired companies had been owned by DSV from the beginning of the financial year, this would have had no material effect on consolidated revenue, profit or balance sheet items.
The assets and liabilities acquired include trade receivables and trade payables as well as a small goodwill amount related to the acquisitions. The transaction expenses related to the acquisitions are modest amounts and recognised as special items in the income statement.
Non-controlling interestsNo significant equity investments were purchased from non-controlling shareholders in the financial year of 2012. In the financial year of 2011, DSV acquired equity investments from non-controlling shareholders for a total amount of DKK 26 million, increasing the DSV A/S shareholders’ share of equity by an enquivalent amount.
In the financial years of 2012 and 2011, DSV lost no control over any entities in connection with the sale of shares and sold no shares to non-con-trolling interests in which transaction it would have retained control.
Acquisitions after reporting dateNo significant enterprises have been acquired after the reporting date.
Change in treatment of previous acquisitionsNo significant adjustments were made in 2011 and 2012 to goodwill relating to previous acquisitions.
note 26 – fInanCIal rIsksLiquidity risksThe capital structure of DSV is intended to ensure financial stability for the purpose of reducing its cost of capital and maintain sufficient financial stability to reach its strategic goals.
The capital structure of DSV is assessed on a regular basis. The gearing ratio, i.e. net interest-bearing debt to EBITDA (operating profit before amorti-sation, depreciation and special items), was 2.1 at 31 December 2012. The adjusted target for the Group’s capital structure states that, as a rule, the ratio of net interest-bearing debt to EBITDA may not exceed 2.0.
DSV ensures that it has sufficient cash on demand in the form of short-term credit facilities and long-term credit lines from the main banks of the Group. The total duration of the Group’s long-term loan commitments and the amounts drawn on its credit lines at 31 December 2012 are shown in the table below.
List of commitments and amounts drawn on long-term credit facilities at 31 December 2012:
Amounts Amounts Expiry of Duration Loan facilities (EURm) (DKKm) commitments (years) Not drawn
Long-term loan I 127 947 31/12/2014 2.0 -Long-term loan II 600 4,476 30/09/2016 3.8 1,141Long-term loan III 100 746 15/01/2016 3.0 -Bond loan 101 750 23/11/2020 7.9 -Other 3 22 31/12-14/15 2.2 -Long-term credit facility 1) 55 407 31/12/2013 1.0 334Total and weighted duration 986 7,348 3.7 1,475
1) Credit facilities expiring in 2014 with 12 months’ notice at any time.
DSV obtained a corporate bond loan of DKK 750 million with a Danish pension fund in 2012. The loan is a fixed-rate bullet loan with a duration of 8 years. The loan was obtained with a view to achieving a diverse funding structure, increasing the duration of the Group’s long-term loan facilities and making use of the historic low interest rates. DSV intends to continue to examine the possibilities of further diversifying the funding structure to reduce the Group’s dependecy on bank loans.
65DSV 2012 ANNUAL REPORT – cONSOLiDATED fiNANciAL STATEmENTS

note 26 – fInanCIal rIsks (ContInued)
The loan agreements of the Group are subject to covenants. The covenants of the Group are related to the ratio of net interest-bearing debt to EBITDA (operating profit before amortisation, depreciation and special items) and the Group’s solvency ratio. Quarterly reporting on the development of these covenants is made to the Company’s providers of funding. All covenants were observed in 2012.
The Group’s financial liabilities fall due as follows: 2011 Total cash flows, including (DKKm) 0-1 year 1-3 years 3-5 years > 5 years interest
Loans and credit facilities 955 1,476 4,756 - 7,187Finance leases 72 104 209 58 443Trade payables 4,350 - - - 4,350Interest rate derivatives 117 90 6 - 213Total 5,494 1,670 4,971 58 12,193
2012 Total cash flows, including (DKKm) 0-1 year 1-3 years 3-5 years > 5 years interest
Loans and credit facilities 1,074 1,244 4,190 865 7,373 Finance leases 62 198 81 37 378 Trade payables 4,385 - - - 4,385 Interest rate derivatives 120 95 2 - 217 Total 5,641 1,537 4,273 902 12,353
The analysis of expected maturity is based on contractual cash flows, including estimated interest payments. Amounts have not been discounted for which reason they cannot necessarily be reconciled to the related items of the balance sheet.
Financial instruments categories 2011 2012 Carrying Carrying (DKKm) amounts amounts
Financial assets: Held for trading (derivative financial instruments) 8 16Loans and receivables 7,112 7,238 Financial assets available for sale 11 8 Financial liabilities: Held for trading (derivative financial instruments) 211 210 Financial liabilities measured at amortised cost 11,592 11,470 The fair value of financial assets and liabilities does not differ significantly from the carrying amount.
The valuation of financial instruments measured at fair value is based on other observable inputs than prices quoted in active markets (level 2). Inter-est rate swaps and foreign exchange forward contracts are valued using generally accepted valuation techniques based on relevant observable data.
66 DSV 2012 ANNUAL REPORT – cONSOLiDATED fiNANciAL STATEmENTS

note 26 – fInanCIal rIsks (ContInued)Foreign currency risksDue to the operating activities of the Group, it is exposed to exchange rate fluctuations to a certain extent. DSV seeks to eliminate foreign currency risks related to revenue in foreign currencies in both Danish and foreign subsidiaries by hedging currency exposures centrally via the Treasury Depart-ment. The risk exposure is managed on a net basis by borrowing in foreign currencies, drawing on credit facilities in foreign currencies, or using foreign exchange forward contracts and currency options. The Group’s foreign subsidiaries are not affected where trading income and costs are denomi-nated in the local currency. This applies to most of the Group’s activities. Moreover, a large proportion of the income and expenses of the Group are denominated in euro. The aggregate currency risk is therefore limited.
The Group is also exposed to foreign currency risks, partly on the translation of debt denominated in a foreign currency other than the functional cur-rency of the relevant company, and partly on the translation of net investments in enterprises with a functional currency other than Danish kroner. The former risk affects profit before tax. However, where debt is classified as hedging of net investments in foreign subsidiaries, fair value adjust-ments are recognised directly in equity under other comprehensive income. On recognition of net investments in foreign subsidiaries, the Group is exposed to a translation risk when the profit or loss and equity of foreign subsidiaries are converted into Danish kroner at the reporting date based on the average rate of exchange and the closing rates. It is assessed on an ongoing basis whether to hedge the Parent’s net investment in subsidiaries. It is DSV Group policy to reduce net investments in Group subsidiaries on an ongoing basis by distributing the subsidiaries’ profits as dividends. At 31 December 2012, no net investments in subsidiaries had been hedged.
In general, the Group does not hedge positions in euro as it expects the official Danish fixed exchange-rate policy against the euro to continue.
Exchange rates 31 December Annual average Currency 2011 2012 2011 2012
Euro countries EUR 743.42 746.04 745.05 744.37Great Britain GBP 890.00 913.20 859.05 918.37Norway NOK 95.88 101.67 95.61 99.61Sweden SEK 83.42 87.14 82.52 85.61USA USD 574.56 565.91 536.22 579.79
Exposure in major foreign currencies breaks down as follows: Impact on profit/loss Impact on other Net position Exchange rate comprehensive income(DKKm) 2011 2012 fluctuation 2011 2012 2011 2012
GBP/DKK 10 14 +/- 5% 8 8 13 14 NOK/DKK 11 18 +/- 5% 4 4 12 14 SEK/DKK (3) 15 +/- 5% 8 12 42 145 USD/DKK 28 121 +/- 5% 15 18 23 21 Total +/- 5% 35 42 90 194
The effect of foreign currency translation on revenue and EBITA has been calculated on the basis of the effect of a 5% change in average rates for 2011 and 2012. The effect on other comprehensive income has been calculated on the basis of the effect of a 5% change in year-end closing rates of exchange for 2011 and 2012. The method applied for the sensitivity analysis is unchanged compared to previous years.
Interest rate risksThe major interest rate risk relates to the long-term loans raised by the Parent to finance previous acquisitions. These loans were raised as long-term commitments with a variable rate of interest, but refinanced to a fixed-rate loan by using mainly interest rate swaps with a duration of up to 60 months. The Group also has an interest rate risk in connection with the finance and operating leases concluded. The relevant interest rates are fixed on an ongoing basis for periods of 24 to 48 months.
It is the policy of DSV that the average period of fixed interest rates on all net bank debts must be at least 8 months and not more than 40 months at any time.
At the end of 2012, duration of the hedges on the bank and mortgage loans of the Group was 33 months (2011: 25 months). An increase in inter-est rates by 1 percentage point will reduce profit for the year by DKK 18 million (2011: DKK 11 million) and have an impact on other comprehensive income of DKK 108 million (2011: DKK 133 million).
The method applied for the sensitivity analysis is unchanged compared to previous years.
Credit risksThe Group’s credit risks relate mainly to trade receivables. The Group has no particular concentration of customers or suppliers and is not especially dependent on specific customers or suppliers. The credit risk of the Group is therefore deemed not material. The Group has issued an internal credit limit for each debtor. As set out in the Group Credit Policy, trade receivables are rated on an ongoing basis. Insurance policies are taken out with a credit insurance company for the majority of the Group’s receivables. Based on the internal credit policies and the risk assessment procedures of the Group, the credit quality of unimpaired undue receivables is assessed to have, to a very great extent, a high quality and imply a low risk of loss.
DSV is exposed to a counterparty credit risk when entering into derivative financial instruments. In order to reduce this risk, DSV only enters into derivative financial instruments with the existing banks of the Group whose credit rating from Standard & Poor’s is long-term A or higher. As a gen-eral rule, the Group only makes short-term deposits with banks rated as short-term A-2 or higher by Standard & Poor’s and/or as P-2 or higher by Moody’s.
67DSV 2012 ANNUAL REPORT – cONSOLiDATED fiNANciAL STATEmENTS

note 27 – derIvatIve fInanCIal InstrumentsExternal hedging instruments at 31 December 2011 Of which Of which recognised in recognised other com- Contractual in income prehensive (DKKm) value Maturity Fair value statement income
Currency instruments 10,183 2012 8 40 (32) Interest rate instruments 8,855 2012-2015 (211) (45) (166)Total (203) (5) (198) External hedging instruments at 31 December 2012 Of which Of which recognised in recognised other com- Contractual in income prehensive (DKKm) value Maturity Fair value statement income
Currency instruments 6,326 2013 16 16 -Interest rate instruments 7,893 2013-2016 (210) (26) (184)Total (194) (10) (184)
Outstanding hedging instruments are recognised in the income statement over the remaining life. The majority of the outstanding foreign exchange forward contracts will mature in Q1 2013.
Foreign currency risk hedgingThe Group mainly uses foreign exchange forward contracts to hedge foreign currency risks. The main currencies hedged are SEK, NOK, GBP and USD. The foreign exchange forward contracts are used as fair value hedges of currency exposures relating to balance sheet assets and liabilities.
Foreign exchange forward contracts used to hedge net investments and satisfying the conditions of hedge accounting are recognised directly in other comprehensive income. At 31 December 2012, no net investments in subsidiaries had been hedged.
Other fair value adjustments are recognised in the income statement under financial income or expenses.
Losses on hedging instruments of DKK 34 million (2011: a gain of DKK 13 million) were recognised in the income statement for the financial year of 2012. For the same period, hedged risks were recognised in the income statement by a gain of DKK 57 million (2011: a loss of DKK 18 million).
Interest rate risk hedging The Group has obtained long-term loans on a floating interest rate basis, which implies that the Group is exposed to interest rate fluctuations. The Group mainly uses interest rate swaps to hedge future cash flow relating to interest risks. Thereby floating-rate loans are refinanced as fixed-rate loans. Interest rate swaps and interest rate caps satisfying the conditions of hedge accounting are recognised directly in other comprehensive income. Interest rate swaps and interest rate caps not satisfying the conditions of hedge accounting, as well as accrued interest, are recognised directly in the income statement under financial income or expenses.
The weighted average effective interest rate for existing interest rate instruments used as hedges of long-term loans was 1.87% at the reporting date (2011: 2.43%).
Agreements on the use of derivative financial instruments are only concluded with parties whose credit rating from Standard & Poor’s is A or higher.
Ineffectiveness had no significant effect on the income statement for 2012.
68 DSV 2012 ANNUAL REPORT – cONSOLiDATED fiNANciAL STATEmENTS

note 28 – related partIesDSV has no related parties with control. Related parties of DSV with significant influence comprise associates as mentioned in the overview of the Group structure on page 80 and members of the associates’ boards of directors, executive boards and senior staff as well as family members of those persons. Related parties also comprise companies in which the aforementioned persons have significant interests.
Associated companies The Group had the following transactions with associates:
(DKKm) 2011 2012
Sale of services 129 64 Purchase of services 215 160 The Group had the following outstanding balances with associates at 31 December:
(DKKm) 2011 2012
Receivables 31 13Liabilities 7 3
Transactions with related parties were made on an arm’s length basis. Board of Directors, Executive Board and senior staff Please refer to note 4 - Staff costs and note 5 - Incentive schemes and shares held by Management. The Group made or had no other transactions or outstanding balances with the Board of Directors, Executive Board or senior staff.
69DSV 2012 ANNUAL REPORT – cONSOLiDATED fiNANciAL STATEmENTS

note 29– aCCountIng polICIesThe Annual Report of DSV A/S comprises the consolidated financial statements of DSV A/S and its subsidiaries and separate financial statements of the Parent.
The 2012 consolidated financial statements of the DSV Group have been prepared in accordance with the International Financial Report-ing Standards (IFRS) as adopted by the European Union and Danish disclosure requirements for listed companies.
The Annual Report of the Parent, DSV A/S, is an integral part of the consolidated Annual Report of DSV and is available on the CD-ROM enclosed and at www.dsv.com.
The Board of Directors considered and adopted the 2012 Annual Report of DSV A/S on 20 February 2013. The Annual Report will be submitted to the shareholders of DSV A/S for adoption at the Annual General Meeting on 21 March 2013.
Basis of preparationAmounts in the Annual Report are stated in Danish kroner and rounded to the nearest million.
The Annual Report has been prepared under the historical cost con-vention, with the exception that derivative financial instruments are measured at fair value.
Non-current assets held for sale are measured at the lower of carrying amount before the change in classification and fair value less costs to sell.
The accounting policies described below have been applied consist-ently for the financial year and for the comparative figures.
Changes in accounting policiesDSV A/S has implemented the standards and interpretations that are effective for the financial year of 2012. None of these standards and interpretations had any impact on the recognition and measurement for 2012 and are not expected to impact on DSV A/S.
New accounting regulationsA number of new standards and interpretations have been issued which had not become mandatory at the preparation of the 2012 Annual Report. The Group expects that the amendments of IAS 19 ‘Employee Benefits’ may imply more detailed notes on pension obliga-tions. The other new standards and interpretations are not expected to have any significant impact on the consolidated financial statements of DSV A/S.
DESCRIPTION OF ACCOuNTING POLICIES
Consolidated financial statementsThe consolidated financial statements include the Parent, DSV A/S, and the subsidiaries over which DSV A/S exercises control of the financial and operating policies. Control is obtained by possessing or holding, whether directly or indirectly, more than 50% of voting rights or by otherwise controlling the relevant enterprise.
Enterprises not controlled by the Group, but over which the Group has significant influence, are considered associates. Significant influ-ence is usually obtained by possessing or holding, whether directly or indirectly, more than 20% of voting rights, but less than 50%. When assessing whether DSV A/S controls or has significant influence over an enterprise, potential voting rights must be taken into account.
The consolidated financial statements have been prepared by consoli-dating the financial statements of the Parent and the individual sub-sidiaries, computed in accordance with the accounting policies of the Group, and by eliminating intra-Group income, costs, shareholdings, accounts and dividends as well as realised and unrealised gains from intra-Group transactions. Unrealised gains from transactions with associates are eliminated proportionately to the ownership interest. Unrealised losses are eliminated in the same way as unrealised gains to the extent that no impairment losses are recorded.
Investments in subsidiaries are eliminated by the fair value of the sub-sidiaries’ proportionate share of identifiable net assets and recognised contingent liabilities at the date of acquisition.
Accounting items of subsidiaries are fully recognised in the consoli-dated financial statements. The share attributable to non-controlling interests of the profit or loss for the year and of equity of subsidiaries that are not wholly-owned is included in the consolidated profit or loss and equity, respectively, but is stated separately.
Business combinationsNewly acquired or established enterprises are recognised in the con-solidated financial statements from the date of acquisition. Enterprises divested or otherwise ceasing to be subsidiaries or associates are recognised in the consolidated income statement until the date of disposal.
On acquisition of enterprises over which the Parent obtains control, the purchase method is applied. Identifiable assets, liabilities and contingent liabilities of the acquirees are measured at fair value on acquisition. Identifiable intangibles are recognised if they are separable or arise from a contractual right. Deferred tax is recognised for the revaluation.
The date of acquisition is the date on which DSV A/S or a DSV subsidi-ary actually obtains control of the acquiree.
The date of disposal is the date on which DSV A/S or a DSV subsidi-ary actually surrenders control of the enterprise divested or otherwise ceasing to be a subsidiary or an associate.
The consideration for acquirees consists of the fair value of the agreed consideration in the form of assets and liabilities transferred and equity instruments issued. If part of the consideration is subject to future events or the performance of contractual obligations, such part of the consideration is recognised at fair value on the date of acquisition. Costs attributable to business combinations are recognised directly in the income statement when incurred.
Comparative figures are not adjusted for enterprises recently acquired, divested or otherwise ceasing to be subsidiaries or associates.
Positive differences (goodwill) between, on the one side, the con-sideration, the value of non-controlling interests in the enterprise acquired and the fair value of any participating interests previously acquired and, on the other side, the fair value of identifiable assets, liabilities and contingent liabilities acquired are recognised as goodwill under intangibles. Goodwill is not amortised, but tested for impairment annually. The first impairment test is carried out before the end of the year of acquisition. On acquisition, goodwill is attributed to the cash-generating units on which the impairment test is subsequently based. Goodwill and fair value adjustments in connection with the acquisition of a foreign entity whose functional currency differs from the presen-tation currency of the DSV Group are treated as assets and liabilities belonging to the foreign entity and are translated into the functional currency of the foreign entity using the exchange rate ruling at the date of acquisition. If, on the date of acquisition, there is uncertainty connected with measurement of the identifiable assets, liabilities and contingent liabilities acquired, the first recognition is made on the basis of a preliminary calculation of fair value. If the allocation of acquisition price is considered preliminary and it subsequently turns out that the identifiable assets, liabilities and contingent liabilities had another fair value on acquisition than first assumed, goodwill may be adjusted for up to 12 months following the date of acquisition. The effect of the adjustments is recognised in equity at the beginning of the financial year, and comparative figures are restated. After that, goodwill is not adjusted. Any change in estimated contingent consideration is recog-nised in the income statement.
Gains or losses on divestment of subsidiaries and associates or ces-sation of their status as such are stated as the difference between the selling price or price for the cessation and the carrying amount of net assets, including goodwill, at the date of disposal as well as selling costs or costs related to the cessation.
70 DSV 2012 ANNUAL REPORT – cONSOLiDATED fiNANciAL STATEmENTS

Foreign currency translationA functional currency is determined for each reporting enterprise of the Group. The functional currency is the currency used in the primary financial environment in which the individual reporting enterprise oper-ates. Transactions denominated in currencies other than the functional currency are considered foreign currency transactions.
On initial recognition, foreign currency transactions are translated into the functional currency at the exchange rates ruling at the transac-tion date. Exchange differences between the exchange rate at the individual transaction date and the date of payment are recognised in the income statement under financials.
Receivables, payables and other monetary items denominated in a foreign currency are translated at the exchange rates ruling at the reporting date. The difference between the exchange rates at the re-porting date and the date on which the individual receivable or payable was recorded or the exchange rate used in the latest annual report is recognised in the income statement under financials.
On recognition in the consolidated financial statements of foreign en-terprises whose functional currency differs from the presentation cur-rency of DSV, income statements are translated at the exchange rates ruling at the transaction dates, and balance sheet items are trans-lated at the exchange rates ruling at the reporting date. An average exchange rate for the period is used as the transaction-date exchange rate if this exchange rate does not significantly deviate from the exchange rate ruling at the transaction dates in question. Exchange differences arising on translation of the equity of foreign enterprises at the beginning of the year at the exchange rates ruling at the reporting date and on translation of the income statements from the exchange rates ruling at the transaction dates to the exchange rates ruling at the reporting date are recognised directly in other comprehensive income as a separate foreign currency translation reserve. Foreign exchange gains/losses are allocated between the equity of the Parent and the non-controlling interests.
Foreign currency adjustments of intra-Group balances with foreign enterprises considered as part of the total net investment in the en-terprise, which has a functional currency other than Danish kroner, are recognised directly in other comprehensive income in the consolidated financial statements as a separate foreign currency translation reserve. Similarly, foreign exchange gains and losses on loans and derivative financial instruments which are designated as hedges of net invest-ments in foreign enterprises and which effectively hedge against corresponding exchange gains and losses on the net investment in the enterprise are also recognised directly in other comprehensive income as a separate foreign currency translation reserve.
On recognition in the consolidated financial statements of associates whose functional currency differs from the presentation currency of DSV, the individual associate’s share of the profit or loss for the year is translated using the average exchange rate, and its share of equity, including goodwill, is translated using the exchange rate ruling at the reporting date. Exchange differences arising on translation of DSV’s share of foreign associates’ equity at the beginning of the year at the exchange rates ruling at the reporting date and on translation of the individual associate’s share of the profit for the year from the aver-age exchange rate to the exchange rate ruling at the reporting date are recognised directly in other comprehensive income as a separate foreign currency translation reserve.
Derivative financial instrumentsDerivative financial instruments are recognised as from the trade date and measured at fair value. Positive and negative fair values of deriva-tive financial instruments are included in other current receivables or other current payables. Positive and negative fair values are only offset if the Group has a right and an intention to settle several financial in-struments net (by means of settlement of differences). The fair value of derivative financial instruments is calculated on the basis of market data and recognised valuation models.
Changes in the fair value of derivative financial instruments which are classified as and meet the criteria for recognition as a fair value hedge of a recognised asset or liability are recognised in the income state-
ment together with changes in the value of the part of the asset or liability that has been hedged.
Changes in the part of the fair value of derivative financial instru-ments which are classified as and meet the criteria for recognition as a future cash flow hedge and which effectively hedge against changes in the value of the hedged item are recognised in other comprehensive income as a separate hedging reserve. When a hedged transaction is carried out, any gain or loss on such hedging transaction is transferred from equity and recognised in the same item as the hedged item. In connection with hedging of proceeds from future loans, gains or losses on such hedging transactions are, however, transferred from equity over the term of the loan.
Changes in the fair value of derivative financial instruments not meet-ing the criteria for treatment as hedging instruments are recognised on an ongoing basis in the income statement under financials.
INCOME STATEMENT
RevenueRevenue comprises the freight forwarded and the services provided in the financial year as well as changes in the value of forwarding in pro-gress. All kinds of discounts, including cash discounts, are recognised in revenue. Revenue is measured exclusive of VAT and other tax collected on behalf of third parties.
Direct costsDirect costs comprise costs paid to generate the revenue for the year. Direct costs include settlement of accounts with haulage contractors, shipping companies and airlines, etc., other direct costs, including staff costs for own staff used for fulfilling orders, as well as other operating costs.
Other external expensesOther external expenses include expenses relating to marketing, IT, rent, training and education, office premises, travelling and communi-cations as well as other selling costs and administrative expenses.
Staff costsStaff costs include wages and salaries, pensions, social security costs and other staff costs, but are exclusive of staff costs recorded as direct costs.
Special itemsSpecial items include material income and expenses not directly attributable to the operating activities of the Group, consisting of restructuring costs relating to fundamental structural, procedural and managerial reorganisations as well as any related gains or losses on disposals. Moreover, other significant non-recurring items are classified under this item.
The items are stated separately to give a fairer view of the primary activities of the Group.
Profit from investments in associatesThe proportionate share of the results after tax of associates is rec-ognised in the consolidated income statement after elimination of the proportionate share of intra-Group profits/losses.
FinancialsFinancials include interest, exchange gains and losses and impairment of securities, payables and foreign currency transactions as well as am-ortisation of financial assets and liabilities, including obligations under finance leases. Furthermore, realised and unrealised gains and losses on derivative financial instruments that cannot be classified as hedging contracts are included.
Tax on profit or loss for the year Tax for the year comprises current tax and changes in deferred tax. The share attributable to the profit or loss for the year is recognised in the income statement, and the share attributable to entries directly under other comprehensive income is recognised directly in other comprehensive income.
71DSV 2012 ANNUAL REPORT – cONSOLiDATED fiNANciAL STATEmENTS

If the Group is able to claim tax allowances when reporting its taxable income in Denmark or abroad due to share-based compensation plans, the tax effect of these plans is recognised under tax on profit for the year. If the total tax allowance exceeds total accounting costs, the tax effect of the excess tax allowance is, however, recognised directly in equity.
BALANCE ShEET, ASSETS
Intangibles
GoodwillOn initial recognition, goodwill is recognised in the balance sheet at cost as described under ‘Business combinations’. Subsequently, good-will is measured at cost less accumulated impairment losses. Goodwill is not amortised.
The carrying amount of goodwill is allocated to the Group’s cash-generating units on acquisition. Determination of cash-generating units is based on the management structure and system of internal financial reporting. Such determination is generally made at division level, i.e. for Air & Sea, Road and Solutions.
Customer relationshipsOn initial recognition, customer relationships are recognised in the balance sheet at fair value as described under ‘Business combinations’. Subsequently, customer relationships are measured at cost less ac-cumulated amortisation and impairment losses. Customer relationships are amortised on a straight-line basis over the expected duration of these relations, which is estimated to be 10 years.
Computer softwareComputer software bought or developed for internal use is measured at the lower of cost less accumulated amortisation and impairment losses and the recoverable amount.
Cost is calculated as costs, salaries and amortisation directly or indi-rectly attributable to software.
After commissioning, software is amortised on a straight-line basis over its expected useful life. The amortisation period is 1-8 years.
Gains and losses from the disposal of software are calculated as the difference between the selling price less costs to sell and the carrying amount at the date of sale. Gains and losses are recognised in the income statement under amortisation and depreciation of intangibles, property, plant and equipment.
Property, plant and equipmentLand and buildings, other plant and operating equipment are measured at cost less accumulated depreciation and impairment losses.
The cost comprises the acquisition price and costs directly associated with the acquisition until the time when the asset is ready for use. The cost of assets produced in-house comprises direct and indirect costs for materials, components, sub-contractors, wages and salaries. The present value of estimated obligations for dismantling and dispos-ing of the asset as well as restoration costs are added to cost if such costs are recognised as a provision. Material borrowing costs directly attributable to the production of the individual asset are also added to cost. If the individual components of an asset have different useful lives, each component will be depreciated separately.
The cost of assets under finance leases is determined as the lower of the fair value of the assets and the present value of the future minimum lease payments. When the present value is calculated, the internal rate of return of the lease, or an alternative borrowing rate, is applied as the discount rate.
Subsequent costs, such as partial replacement of property, plant and equipment, are included in the carrying amount of the asset in ques-tion when it is probable that such costs will result in future economic benefits for the Group. The carrying amount of the replaced parts is derecognised from the balance sheet and recognised in the income
statement. All other costs for general repairs and maintenance are recognised in the income statement when incurred.
Depreciation is provided on a straight-line basis over the expected useful lives of the assets. The expected useful lives are as follows:
Terminals and administration buildings 40-60 yearsOther buildings and building elements 10-25 yearsTechnical plant and machinery 6-10 yearsOther plant and operating equipment 3-8 yearsLand is not depreciated
The depreciation basis takes into account the residual value of as-sets and is reduced by any impairment losses. The residual value is calculated on the date of acquisition and reassessed once a year. If the residual value exceeds the carrying amount of the asset, depreciation will no longer be provided.
If the depreciation period or the residual value is changed, the effect on future depreciation will be recognised as a change in accounting estimates.
Depreciation is recognised in the income statement under amortisation and depreciation of intangibles, property, plant and equipment.
Gains and losses on the disposal of property, plant and equipment are determined as the difference between the selling price less costs to sell and the carrying amount at the date of disposal. Gains and losses are recognised in the income statement under amortisation and deprecia-tion of intangibles, property, plant and equipment.
Investments in associatesInvestments in associates are measured using the equity method.
Investments in associates are recognised in the balance sheet at the proportionate share of the associates’ equity values in accordance with Group accounting policies with the deduction and addition of the proportionate share of unrealised intra-Group gains and losses and with the addition of the carrying amount of goodwill.
Associates having a negative equity value are measured at DKK 0. If the Group has a legal or constructive obligation to cover the negative balance of an associate, such an obligation will be recognised as a liability.
Receivables from associates are written down to the extent deemed irrecoverable.
Impairment of non-current assetsThe carrying amount of goodwill is tested for impairment at least once a year together with the other non-current assets of the division to which the goodwill is allocated and written down to the recoverable amount through the income statement if the carrying amount is higher. The recoverable amount is determined as the discounted value of the expected future net cash flow from the division to which the goodwill is associated. Goodwill impairment is recognised as a separate item in the income statement.
Ongoing IT projects are also tested for impairment annually.
Deferred tax assets are tested annually and are only recognised if they are likely to be utilised.
The carrying amount of other non-current assets is tested once a year to determine whether there is an indication of impairment. If so, the recoverable amount is calculated. The recoverable amount is the higher of the fair value of an asset less the expected costs to sell and the value in use. The value in use is calculated as the present value of expected future cash flow from the asset or the division of which the asset forms part.
Impairment losses are recognised if the carrying amount of an asset or a division exceeds the recoverable amount of the asset or division. Impairment losses are recognised in the income statement under amortisation, depreciation and impairment losses.
72 DSV 2012 ANNUAL REPORT – cONSOLiDATED fiNANciAL STATEmENTS
Impairment of goodwill is not reversed. Impairment of other assets is reversed if the assumptions and estimates on which the impairment is based have changed. Impairments are only reversed if the new carry-ing amount of an asset does not exceed the carrying amount that the asset would have had if it had not been written down.
ReceivablesReceivables are measured at amortised cost. Provision is made for expected losses on an individual basis.
EquITy
DividendsProposed dividends are recognised as a liability when adopted at the annual general meeting (date of declaration). Dividends expected to be paid for the year are shown as a separate item under equity.
Interim dividends are recognised as a liability as from the date of the resolution.
Treasury sharesPurchase and selling prices as well as dividends on treasury shares are recognised directly in equity under retained earnings. Capital reduc-tions through the cancellation of treasury shares will reduce the share capital by an amount corresponding to the nominal value of the equity interest.
Proceeds from the sale of treasury shares in connection with the exer-cise of share options are recognised directly in equity.
Foreign currency translation reserveThe foreign currency translation reserve comprises the Parent share-holders’ share of gains and losses resulting from the translation of financial statements of foreign enterprises having a different functional currency than the presentation currency of the DSV Group (Danish kroner).
In the event of realisation of a net investment or part thereof, foreign exchange gains/losses will be recognised in the income statement.
hedging reserve The hedging reserve comprises the cumulative net change in the fair value of hedging transactions which satisfy the criteria for hedging future cash flows and where the hedged transactions have not yet been realised.
Incentive schemesThe incentive schemes of the DSV Group consist of share option schemes.
The value of the employee services received in exchange for the grant of options is measured at the fair value of the options.
The fair value of equity-settled share-based schemes is measured at the grant date and recognised in the income statement under staff costs over the period until the options are vested. The offsetting item is recognised directly in equity.
On initial recognition of such share-based schemes, an estimate is made of the number of options that the employees are expected to earn. The estimated number of options is adjusted subsequently to reflect the actual number of options earned.
The fair value of the options granted is estimated on the basis of the Black & Scholes valuation model. The estimate is based on the terms and conditions applicable to the grant of options and Management’s expectations of the development in the elements on which the valua-tion model is based.
BALANCE ShEET, LIABILITIES
Pension and similar obligationsObligations relating to defined contribution pension plans under which the Group pays regular pension contributions to independent pension funds are recognised in the income statement for the period in which they are earned, and contributions payable are recognised in the bal-ance sheet under other current liabilities.
As regards defined benefit plans, an actuarial valuation of the value in use of future benefits payable under the plan is made once a year. The value in use is calculated on the basis of the assumptions of future development in wage/salary level, interest rates, inflation, mortal-ity, etc. The value in use is only calculated for benefits to which the employees have become entitled during their employment with the Group. The actuarial calculation of the value in use less the fair value of any assets under the plan is recognised in the balance sheet under pension obligations.
Pension costs of the year are recognised in the income statement based on actuarial estimates and financial expectations at the begin-ning of the year.
The differences between the expected development in pension assets and pension liabilities and the realised values are referred to as actuarial gains and losses and are recognised directly in other comprehensive income.
Changes in the benefits payable for employees’ past services to the enterprise result in an adjustment of the actuarial calculation of the value in use, which is classified as past service costs. Past service costs are charged to the income statement immediately if the employees have already earned the right to the adjusted benefits. Otherwise, the benefits will be recognised in the income statement over the period in which the employees earn the right to the adjusted benefits.
Corporation tax and deferred taxCurrent tax payable and receivable is recognised in the balance sheet as tax calculated on the taxable income for the year, adjusted for tax on the taxable income for previous years and for prepaid tax.
Deferred tax is recognised based on temporary differences between the carrying amount and the tax value of assets and liabilities. No recognition is made of deferred tax on temporary differences relating to amortisation or depreciation of goodwill, office properties and other items disallowed for tax purposes if, except at the acquisition of en-terprises, such temporary differences arose on the date of acquisition without affecting the results or the taxable income. In cases where it is possible to calculate the tax value according to different taxation rules, deferred tax is measured on the basis of the planned use of the asset or the settlement of the liability.
Deferred tax assets, including the tax base of tax loss carryforwards, are recognised under other non-current assets at the expected value of their utilisation, either by elimination in tax on future earnings or by offsetting deferred tax liabilities within the same legal tax entity and jurisdiction.
Deferred tax assets and tax liabilities are offset if the enterprise has a legally enforceable right to set off current tax liabilities and tax assets or intends either to settle current tax liabilities and tax assets on a net basis or to realise the assets and liabilities simultaneously.
Deferred tax is adjusted for elimination of unrealised intra-Group gains and losses.
Deferred tax is measured on the basis of the tax rules and tax rates of the relevant countries which will be effective under current legislation at the reporting date on which the deferred tax is expected to crystal-lise as current tax. Changes in deferred tax as a result of different tax rates are recognised in the income statement.
ProvisionsProvisions are recognised when, due to an event occurring on or before the reporting date, the Group has a legal or constructive obligation, and it is probable that the Group will have to give up future economic benefits to meet the obligation.
73DSV 2012 ANNUAL REPORT – cONSOLiDATED fiNANciAL STATEmENTS
Provisions are measured on the basis of Management’s best estimate of the anticipated expenditure for settlement of the relevant obliga-tion.
When provisions are measured, the costs necessary to settle the obligation are discounted to net present value if such discounting has a material impact on the measurement of the obligation. A pre-tax discount rate is used which reflects the general level of interest rates in society and the actual risks which are deemed to affect the provision in question. Changes in present values during the financial year are recognised under financial expenses.
Restructuring costs are recognised as provisions when a detailed, formal restructuring plan has been published on or before the report-ing date and communicated to the parties affected by the plan. In connection with the acquisition of enterprises, provisions for the restructuring of such enterprises are solely included in the calculation of goodwill if the acquirees are subject to an obligation at the date of acquisition.
Provisions are made for onerous contracts if the expected benefits to the Group are outweighed by the unavoidable costs under the contract.
If the Group is under an obligation to dismantle an asset or restore the site where the asset has been used, a provision is made corresponding to the present value of the expected future costs.
Financial liabilitiesBank loans and other loans are recognised initially at fair value net of transaction expenses. In subsequent periods, financial liabilities are measured at amortised cost, corresponding to the capitalised value us-ing the effective interest method, so that the difference between the proceeds and the nominal value is recognised in the income statement over the term of the loan.
The residual lease obligation under finance leases is also capitalised and recognised as a financial liability.
Other liabilities, including trade payables, payables to associates, accru-als relating to forwarding in progress and other payables, are measured at amortised cost, which corresponds to the net realisable value in all essentials.
LeasesIn the financial statements, lease obligations are divided into obligations under finance leases and operating leases.
A lease is classified as a finance lease when, in all essentials, it transfers the risks and benefits of ownership of the leased asset. Other leases are classified as operating leases.
The treatment in financial statements of assets under finance leases and the corresponding obligations is described in the sections ‘Prop-erty, plant and equipment’ and ‘Financial liabilities’.
Lease payments under operating leases are recognised in the income statement on a straight-line basis over the term of the lease.
Cash flow statementThe cash flow statement shows the cash flows from operating, invest-ing and financing activities for the year, the year’s changes in cash and cash equivalents as well as cash and cash equivalents at the beginning and end of the year.
The cash flow effect of the acquisition and divestment of enterprises is shown as a separate item under cash flow from investing activi-ties. The cash flow from acquired enterprises is recognised in the cash flow statement from the date of acquisition, and the cash flow from divested enterprises is recognised until the date of divestment.
Cash flow from operating activitiesThe cash flow from operating activities is recognised as a pre-tax amount, adjusted for non-cash operating items, working capital changes as well as interest and corporation tax paid.
Cash flow from investing activitiesThe cash flow from investing activities comprises payments relating to the acquisition and divestment of enterprises and activities, the purchase and sale of intangibles, property, plant and equipment and other non-current assets as well as the purchase and sale of securities not classified as cash and cash equivalents.
Free cash flowThe free cash flow is what remains after operating and investing activities.
Cash flow from financing activitiesThe cash flow from financing activities comprises changes in the amount or composition of the Group’s share capital and related costs, including the purchase and sale of treasury shares as well as the raising of loans, repayments on interest-bearing debt and the payment of dividends to shareholders.
Cash and cash equivalentsCash and cash equivalents comprise cash and short-term marketable securities that may readily be converted into cash without any risk of considerable loss in value.
SEGMENT INFORMATION
Information is provided on business segments and geographical markets. The segmentation is based on the risk factors affecting the Group and the internal financial management of the Group. Segment information has been prepared in accordance with the Group’s ac-counting policies.
Income/expenses and assets/liabilities in the segments comprise the items directly attributable to the individual segment as well as the items that may be allocated to the individual segment on a reliable basis. Non-allocated items mainly comprise assets and liabilities as well as income and expenses relating to the Group’s administrative func-tions, investing activities, corporation tax, etc.
The non-current assets in a segment comprise the non-current assets which are used directly for the operation of the segment, including intangibles and property, plant and equipment as well as investments in associates.
The current assets in a segment comprise the current assets which are used directly for the operation of the segment, including trade re-ceivables, other receivables, prepayments and cash and bank deposits.
Segment liabilities comprise liabilities resulting from the operation of the segment, including trade payables and other payables. Segment liabilities also comprise interest-bearing liabilities.
74 DSV 2012 ANNUAL REPORT – cONSOLiDATED fiNANciAL STATEmENTS

DEFINITION OF FINANCIAL hIGhLIGhTS
Net interest-bearing debtInterest-bearing debt at year-end less interest-bearing assets at year-end.
Net working capital (NWC)The sum of inventories, receivables and other current operating assets less trade payables and other payables and other current operating liabilities.
Invested capital including goodwill and customer relationshipsThe sum of the net working capital with the addition of property, plant and equipment, intangibles including goodwill and customer relationships and assets held for sale less long-term provisions, pension obligations and negative goodwill.
Gross margin Gross profit multiplied by 100 and divided by revenue.
EBITDA marginOperating profit before amortisation, depreciation, impairment of goodwill and special items multiplied by 100 and divided by revenue.
EBITA marginOperating profit before impairment of goodwill and special items mul-tiplied by 100 and divided by revenue.
EBIT marginOperating profit multiplied by 100 and divided by revenue.
Conversion ratio*Operating profit before impairment of goodwill and special items (EBITA) multiplied by 100 and divided by gross profit.
ROIC before tax including goodwill and customer relationshipsOperating profit before impairment of goodwill and special items multiplied by 100 and divided by average invested capital including goodwill and customer relationships.
ROIC before tax excluding goodwill and customer relationshipsOperating profit before impairment of goodwill and special items multiplied by 100 and divided by average invested capital excluding goodwill and customer relationships.
Effective tax rate*Tax on profit for the year divided by profit before tax.
Return on equity (ROE)The DVS A/S shareholders’ share of the profit for the year multiplied by 100 and divided by average equity exclusive of non-controlling interests.
Solvency ratioEquity exclusive of non-controlling interests multiplied by 100 and divided by total assets.
Net interest-bearing debt to EBITDA (financial gearing ratio)*Interest-bearing liabilities at year-end less interest-bearing assets at year-end divided by operating profit before amortisation, depreciation, impairment of goodwill and special items (EBITDA).
Earnings per shareThe DSV A/S shareholders’ share of profit for the year divided by the average number of shares.
Diluted earnings per shareThe DVS A/S shareholders’ share of profit for the year divided by the average number of fully diluted shares.
Adjusted earningsThe DSV A/S shareholders’ share of profit for the year, adjusted for amortisation and impairment of goodwill and customer relationships, costs related to share-based payments and special items. The tax ef-fect of the adjustments has been taken into account.
Diluted adjusted earnings per share Adjusted earnings divided by the average number of fully diluted shares.
Number of shares at year-endTotal number of shares outstanding at year-end, exclusive of treasury shares.
Diluted average number of sharesAverage number of shares during the year inclusive of share options, but exclusive of out-of-the-money options measured relative to the average share price for the year.
Earnings per share and diluted earnings per share are calculated pursu-ant to IAS 33. The other financial ratios are calculated in accordance with ‘Recommendations & Financial Ratios 2010’ published by the Danish Society of Financial Analysts, except for financial ratios marked with * as these ratios are not included in the Recommendations.
75DSV 2012 ANNUAL REPORT – cONSOLiDATED fiNANciAL STATEmENTS

jens Bjørn andersenCeoBorn: 22 March 1966Member of the Executive Board since: 2008
jens h. lundCfoBorn: 8 November 1969Member of the Executive Board since: 2002
executive Board
the Board of directors and the executive Board
Standing (from left): Thomas Plenborg, Kurt K. Larsen, Jens H. Lund, Birgit W. Nørgaard, Jens Bjørn Andersen, Erik B. Pedersen. Sitting (from left): Annette Sadolin, Kaj Christiansen.
76 DSV 2012 ANNUAL REPORT – mANAgEmENT ’S cOmmENTARy – BOARD Of DiREc TORS AND ExEcUTiVE BOARD

Board of directorsBoard posItIons speCIal CompetenCIes
kurt k. larsenChaIrmanBorn: 17 September 1945Member of the Audit CommitteeBoard member since: 2008Elected until: 2013
(Board member) Saxo Bank A/S Polaris III Invest Fonden Ove Wrist & Co. A/S
• General management experience• CEO of DSV A/S 2005-2008• Group CEO of DSV A/S 1991-2005
erik B. pedersendeputy ChaIrmanBorn: 13 June 1948Board member since: 1989Elected until: 2013
• General management experience• Sector-specific production experience• Independent haulier 1976-2012
thomas plenborgmemBer of the BoardBorn: 23 January 1967Chairman of the Audit CommitteeBoard member since: 2011Elected until: 2013
(Chairman) Rosemunde ApS(Board member) COWI Holding A/S
Saxo Bank A/S, chairman of the Audit Committee
• Professor of accounting and auditing at Copenhagen Business School
• Management experience from directorships and honorary offices held
• Experience with strategic and financial planning
• MSc. in Economics and Business Administra-tion, Ph.d., Copenhagen Business School
kaj ChristiansenmemBer of the BoardBorn: 20 February 1944Board member since: 1995Elected until: 2013
• General management experience• Sector-specific production experience• Independent haulier 1978-2001
annette sadolinmemBer of the BoardBorn: 4 January 1947Member of the Audit CommitteeBoard member since: 2009Elected until: 2013
(Chairman) Østre Gasværk Theatre(Deputy chairman) DSB A/S
Danish Standards(Board member) Topdanmark A/S
Skodsborg Kurhotel & Spa A/S Ratos AB (Sweden) Ny Carlsberg Glyptotek (art museum) Blue Square Reinsurance NV
• General global management experience from General Electric (GE), the reinsurance industry and other organisations
• Acquisition and divestment of international enterprises
• Former executive officer of GE Frankona, Munich, Germany
• Former CEO of Employers Reinsurance International
• Master of Laws (LL.M.)
Birgit w. nørgaardmemBer of the BoardBorn: 9 July 1958Board member since: 2010Elected until: 2013
(Chairman) E. Pihl & Søn A/S NNE Pharmaplan A/S Investeringsforeningen StockRate Invest (unit trust)Stakeholder Forum for Energi.dk
(Deputy Chairman) The Danish Council for IT Projects
(Board member) Sonion A/S (Xilco A/S, Xilco Holding A/S) Abeo A/S GEO The Energy Technology Development and Demon-stration Programme (EUDP) Dansk Vækstkapital Lindab International AB (Sweden) IMI Plc. (UK)
• General management experiences from Grontmij NV (COO), Grontmij | Carl Bro A/S (Managing Director), Danisco and McKinsey
• Acquisition and divestment of enterprises, strategy
• Financial management experience• MSc in Economics and Business Administra-
tion, MBA, Insead
77DSV 2012 ANNUAL REPORT – mANAgEmENT ’S cOmmENTARy – BOARD Of DiREc TORS AND ExEcUTiVE BOARD

statement by the Board of directors and the executive Board
The Board of Directors and the Executive Board have today discussed and approved the Annual Report of DSV A/S for the financial year 2012.
The Annual Report has been prepared in accordance with International Financial Reporting Standards as adopted by the European Union and Danish disclosure requirements for listed companies.
It is our opinion that the consolidated financial statements and the parent company financial statements give a true and fair view of the Group’s and the Parent Company’s fi-nancial position at 31 December 2012 and of the results of
the Group’s and the Parent Company’s operations and cash flows for the financial year 1 January – 31 December 2012.
In our opinion, the Management’s Commentary includes a fair review of the development in the Parent Company’s and the Group’s operations and financial conditions, the re-sults for the year, cash flow and financial position as well as a description of the more significant risks and uncertainty factors that the Parent Company and the Group face.
We recommend that the Annual Report be approved at the Annual General Meeting.
Brøndby, 20 February 2013
executive Board:
Jens Bjørn Andersen Jens H. LundCEO CFO
Board of directors:
Kurt K. Larsen Erik B. Pedersen Kaj ChristiansenChairman Deputy Chairman
Annette Sadolin Birgit W. Nørgaard Thomas Plenborg
78 DSV 2012 ANNUAL REPORT – mANAgEmENT ’S cOmmENTARy – STATEmENT By ThE BOARD Of DiREcTORS AND ExEcUTiVE BOARD
Independent auditors’ report
to the shareholders of dsv a/s
Independent audItors’ report on the ConsolIdated fInanCIal statements and the parent Company fInanCIal statementsWe have audited the consolidated financial statements and the Parent Company financial statements of DSV A/S for the financial year 1 January – 31 December 2012. The consoli-dated financial statements and the Parent Company financial statements comprise income statement, statement of compre-hensive income, balance sheet, statement of changes in equity, cash flow statement and notes, including a summary of signifi-cant accounting policies for the Group as well as for the Parent Company. The consolidated financial statements and the Parent Company financial statements are prepared in accordance with International Financial Reporting Standards as adopted by the EU and Danish disclosure requirements for listed companies.
management’s responsIBIlIty for the ConsolIdated fInanCIal statements and the parent Company fInanCIal statementsManagement is responsible for the preparation of consolidated financial statements and Parent Company financial statements that give a true and fair view in accordance with International Financial Reporting Standards as adopted by the EU and Dan-ish disclosure requirements for listed companies and for such internal control that Management determines is necessary to enable the preparation of consolidated financial statements and Parent Company financial statements that are free from mate-rial misstatement, whether due to fraud or error.
audItors’ responsIBIlItyOur responsibility is to express an opinion on the consolidated financial statements and the Parent Company financial state-ments based on our audit. We conducted our audit in accord-ance with International Standards on Auditing and additional requirements under Danish audit regulation. This requires that we comply with ethical requirements and plan and perform the audit to obtain reasonable assurance as to whether the consol-idated financial statements and the Parent Company financial statements are free from material misstatement.
An audit involves performing procedures to obtain audit evidence about the amounts and disclosures in the consoli-dated financial statements and the Parent Company financial statements. The procedures selected depend on the auditors’ judgement, including the assessment of the risks of material misstatement of the consolidated financial statements and the
Parent Company financial statements, whether due to fraud or error. In making those risk assessments, the auditors consider internal control relevant to the Company’s preparation of con-solidated financial statements and Parent Company financial statements that give a true and fair view in order to design audit procedures that are appropriate in the circumstances, but not for the purpose of expressing an opinion on the ef-fectiveness of the Company’s internal control. An audit also includes evaluating the appropriateness of accounting policies used and the reasonableness of accounting estimates made by Management, as well as evaluating the overall presentation of the consolidated financial statements and the Parent Company financial statements.
We believe that the audit evidence we have obtained is suf-ficient and appropriate to provide a basis for our opinion.
Our audit has not resulted in any qualification.
opInIonIn our opinion, the consolidated financial statements and the Parent Company financial statements give a true and fair view of the Group’s and the Parent Company’s financial position at 31 December 2012 and of the results of the Group’s and the Parent Company’s operations and cash flows for the financial year 1 January – 31 December 2012 in accordance with In-ternational Financial Reporting Standards as adopted by the EU and Danish disclosure requirements for listed companies.
statement on the management’s CommentaryPursuant to the Danish Financial Statements Act, we have read the Management’s Commentary. We have not performed any further procedures in addition to the audit of the consolidated financial statements and the Parent Company financial state-ments. On this basis, it is our opinion that the information provided in the Management commentary is consistent with the consolidated financial statements and the Parent Company financial statements.
Copenhagen, 20 February 2013
kpmgStatsautoriseret Revisionspartnerselskab
Jesper Koefod Gerda Retbøll-BauerState Authorised State AuthorisedPublic Accountant Public Accountant
79DSV 2012 ANNUAL REPORT – mANAgEmENT ’S cOmmENTARy – iNDEPENDENT AUDiTORS’ REPORT

parent DSV A/S Denmark - subsidiaries europe DSV Air&Sea NV Belgium 100% x ABX LOGISTICS Worldwide NV/SA Belgium 100% x ABX Worldwide Holdings NV/SA Belgium 100% x ABX LOGISTICS Air & Sea Worldwide NV/SA Belgium 100% x DSV Road N.V. Belgium 100% x Marine Cargo Insurance (MCI) Agents N.V. Belgium 100% x DSV Solutions NV Belgium 100% xDSV Solutions (Automotive) NV Belgium 100% xDSV Air & Sea OOD Bulgaria 100% x DSV Road EOOD Bulgaria 100% x DSV Air & Sea Holding A/S Denmark 100% x DSV Air & Sea A/S Denmark 100% x DSV Road Holding A/S Denmark 100% x DSV Road A/S Denmark 100% x DSV Insurance A/S Denmark 100% DSV FinCo A/S Denmark 100% DSV Group Services A/S Denmark 100% DSV Solutions Holding A/S Denmark 100% xDSV Solutions A/S Denmark 100% xDSV Transport AS Estonia 100% x DSV Air & Sea Oy Finland 100% x Ab Wasa Logistics Ltd Oy Finland 100% x DSV Road Oy Finland 100% x Uudenmaan Pikakuljetus OY Finland 100% x DSV Solutions Oy Finland 100% xDSV Road Holding S.A. France 100% x DSV Road SAS France 100% x ING Reeif Wattrelos France 100% x DSV Air & Sea SAS France 100% x Frans Maas Holding France S.A. France 100% x DSV Solutions SAS France 100% xDSV HELLAS S.A. Greece 100% x DSV Solutions Holding B.V. The Netherlands 100% xDSV Solutions (Dordrecht) B.V. The Netherlands 100% xABX LOGISTICS (Nederland) B.V. The Netherlands 100% x DSV Solutions Nederland B.V. The Netherlands 100% xVastgoed Oostrum C.V. The Netherlands 100% xDSV Air & Sea B.V. The Netherlands 100% x DSV Road B.V. The Netherlands 100% x DSV Road Holding NV The Netherlands 100% x DSV Transport Ltd. Belarus 100% x DSV Air & Sea Limited Ireland 100% x DSV Road Limited Ireland 100% x DSV Solutions Ltd. Ireland 100% xSaima Avandero SpA Italy 99.1% x Logimek SRL Italy 100% xSaima Caspian LLC Kazakhstan 100% x DSV Hrvatska d.o.o. Croatia 100% x DSV Transport SIA Latvia 100% x DSV Transport UAB Lithuania 100% x XB Luxembourg Holdings 1 SA Luxemburg 100% x XB Luxembourg Holdings 2 SARL Luxemburg 100% x DSV Road S.A. Luxemburg 100% x DSV Air & Sea AS Norway 100% x DSV Road AS Norway 100% x Kongeveien 47 AS Norway 100% x Åsbieveien 15 AS Norway 100% x DSV Solutions AS Norway 100% x
Ownership Country share Air & Sea Road Solutions
group struCtureThe overview of the Group structure active companies at 31 December 2012 by segment and not by legal structure.
80 DSV 2012 ANNUAL REPORT – gROUP STRUc TURE

subsidiaries europe - continued DSV Air & Sea Sp. z o.o. Poland 100% x DSV Road Sp. z.o.o. Poland 100% x DSV Solutions Sp.z o.o. Poland 100% xDSV International Shared Services Sp. z o.o. Poland 100% DSV SGPS, Lda.’ Portugal 100% x DSV Solutions, Lda. Portugal 100% x DSV Transitarios, Lda. Portugal 100% x DSV Solutions S.R.L. Romania 100% xOOO DSV Transport Russia 100% x DSV Road OOO Russia 100% x DSV Solutions OOO Russia 100% xDSV Logistics SA Switzerland 100% x DSV Road d.o.o. Serbia 100% x DSV Slovakia S.R.O. Slovakia 100% x DSV Transport d.o.o. Slovenia 100% x DSV Holding Spain S.L. Spain 100% x DSV Road S.A.U Spain 100% x DSV Solutions S.A.U Spain 100% xDSV Air & Sea S.A.U Spain 100% x DSV Solutions Ltd. Great Britain 100% xDSV Air & Sea Limited Great Britain 100% x DSV Road Holding Ltd. Great Britain 100% x DSV Commercials Ltd. Great Britain 100% x DSV Road Ltd. Great Britain 100% x DSV Air & Sea AB Sweden 100% x DSV Road Holding AB Sweden 100% x DSV Group AB Sweden 100% x DSV Road AB Sweden 100% x Göinge Frakt EK Sweden 100% x NTS European Distribution AB Sweden 100% x DSV Solutions AB Sweden 100% xDSV Road Property Holding AB Sweden 100% x DSV Air & Sea s.r.o. Czech Republic 100% x DSV Road a.s. Czech Republic 100% x DSV Air & Sea A.S. Turkey 100% x DSV Road & Solutions A.S. Turkey 100% x DSV Road GmbH Germany 100% x DSV Immobilien GmbH Germany 100% x POP Gesellschaft für Prozesslogistik mbH Germany 100% xCollico Verpackungslogistik und Service GmbH Germany 100% xAdministration & Accounting Service GmbH Germany 100% x Jolkos Grundstücksverwaltungsgesellschaft mbH Germany 94% x DSV Air & Sea GmbH Germany 100% x DSV Solutions Group GmbH Germany 100% xDSV Solutions GmbH Germany 100% xDSV Stuttgart GmbH & Co. KG Germany 100% x DSV Ukraine Ukraine 100% x DSV Hungaria Kft. Hungary 100% x ABX LOGISTICS (Austria) GmbH Austria 100% x DSV Österreich Spedition GmbH Austria 100% x north america DSV Air & Sea Inc. Canada 100% x DSV Air & Sea, S.A. de C.V. Mexico 100% x DSV Air & Sea Inc. USA 100% x DSV Air & Sea Holding Inc. USA 100% x ABX LOGISTICS (USA) Inc. USA 100% x south america DSV-GL Argentina S.A. Argentina 100% x DSV Air & Sea Logística Ltda. Brazil 100% x DSV-GL Chile S.A. Chile 100% x DSV-GL Latin America S.A. Chile 100% x DSV-GL Peru S.A. Peru 100% x
Ownership Country share Air & Sea Road Solutions
81DSV 2012 ANNUAL REPORT – gROUP STRUc TURE
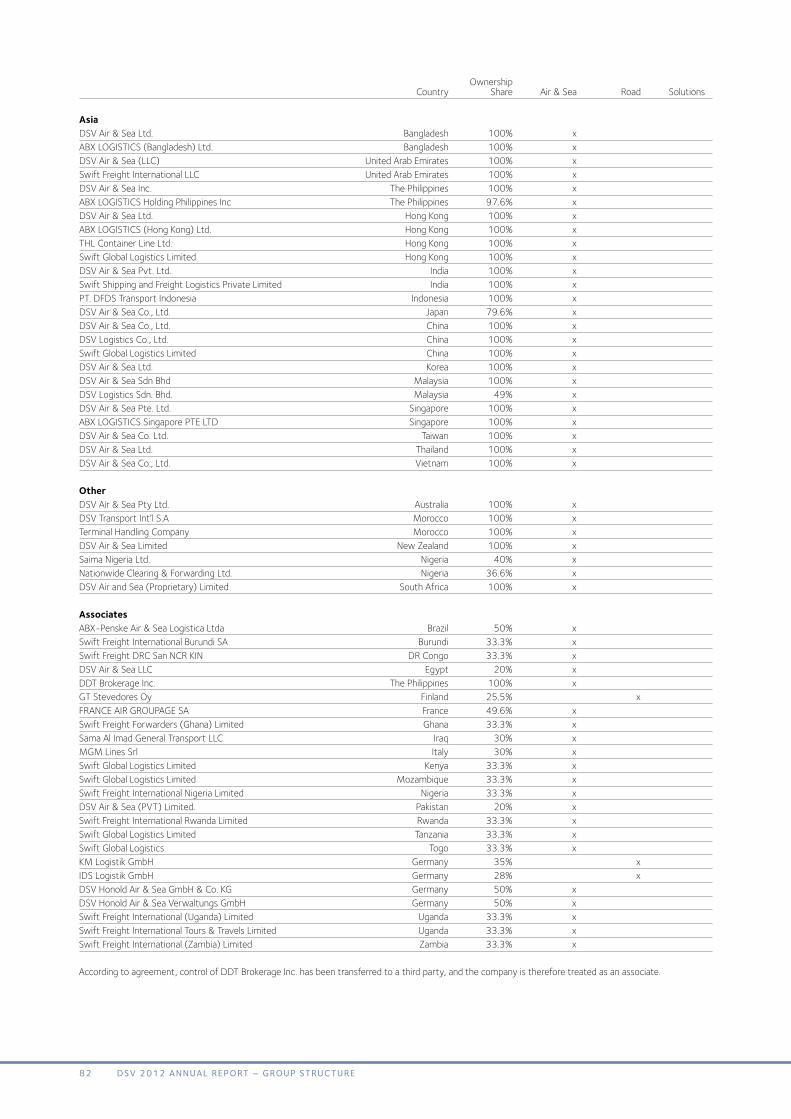
Ownership Country Share Air & Sea Road Solutions
asia DSV Air & Sea Ltd. Bangladesh 100% x ABX LOGISTICS (Bangladesh) Ltd. Bangladesh 100% x DSV Air & Sea (LLC) United Arab Emirates 100% x Swift Freight International LLC United Arab Emirates 100% x DSV Air & Sea Inc. The Philippines 100% x ABX LOGISTICS Holding Philippines Inc The Philippines 97.6% x DSV Air & Sea Ltd. Hong Kong 100% x ABX LOGISTICS (Hong Kong) Ltd. Hong Kong 100% x THL Container Line Ltd. Hong Kong 100% x Swift Global Logistics Limited Hong Kong 100% x DSV Air & Sea Pvt. Ltd. India 100% x Swift Shipping and Freight Logistics Private Limited India 100% x PT. DFDS Transport Indonesia Indonesia 100% x DSV Air & Sea Co., Ltd. Japan 79.6% x DSV Air & Sea Co., Ltd. China 100% x DSV Logistics Co., Ltd. China 100% x Swift Global Logistics Limited China 100% x DSV Air & Sea Ltd. Korea 100% x DSV Air & Sea Sdn Bhd Malaysia 100% x DSV Logistics Sdn. Bhd. Malaysia 49% x DSV Air & Sea Pte. Ltd. Singapore 100% x ABX LOGISTICS Singapore PTE LTD Singapore 100% x DSV Air & Sea Co. Ltd. Taiwan 100% x DSV Air & Sea Ltd. Thailand 100% x DSV Air & Sea Co., Ltd. Vietnam 100% x other DSV Air & Sea Pty Ltd. Australia 100% x DSV Transport Int’l S.A Morocco 100% x Terminal Handling Company Morocco 100% x DSV Air & Sea Limited New Zealand 100% x Saima Nigeria Ltd. Nigeria 40% x Nationwide Clearing & Forwarding Ltd. Nigeria 36.6% x DSV Air and Sea (Proprietary) Limited South Africa 100% x associates ABX-Penske Air & Sea Logistica Ltda Brazil 50% x Swift Freight International Burundi SA Burundi 33.3% x Swift Freight DRC San NCR KIN DR Congo 33.3% x DSV Air & Sea LLC Egypt 20% x DDT Brokerage Inc. The Philippines 100% x GT Stevedores Oy Finland 25.5% x FRANCE AIR GROUPAGE SA France 49.6% x Swift Freight Forwarders (Ghana) Limited Ghana 33.3% x Sama Al Imad General Transport LLC Iraq 30% x MGM Lines Srl Italy 30% x Swift Global Logistics Limited Kenya 33.3% x Swift Global Logistics Limited Mozambique 33.3% x Swift Freight International Nigeria Limited Nigeria 33.3% x DSV Air & Sea (PVT) Limited. Pakistan 20% x Swift Freight International Rwanda Limited Rwanda 33.3% x Swift Global Logistics Limited Tanzania 33.3% x Swift Global Logistics Togo 33.3% x KM Logistik GmbH Germany 35% x IDS Logistik GmbH Germany 28% x DSV Honold Air & Sea GmbH & Co. KG Germany 50% x DSV Honold Air & Sea Verwaltungs GmbH Germany 50% x Swift Freight International (Uganda) Limited Uganda 33.3% x Swift Freight International Tours & Travels Limited Uganda 33.3% x Swift Freight International (Zambia) Limited Zambia 33.3% x According to agreement, control of DDT Brokerage Inc. has been transferred to a third party, and the company is therefore treated as an associate.
82 DSV 2012 ANNUAL REPORT – gROUP STRUc TURE

83DSV 2011 ANNUAL REPORT – cD cONTAiNiNg 2012 ANNUAL REPORT Of PARENT AND cSR REPORT Of DSV
DSV A/SBanemarksvej 58
2605 BrøndbyDenmark
Tel. +45 43 20 30 40www.dsv.com
CVR-No. 58 23 35 2836th financial year
Annual Report for the year ended 31 December 2012
Published 20 February 2013
The Annual Report has been prepared in Danish and English.In case of discrepancies, the Danish version shall apply.
Design and graphic production: meyer & bukdahl as
Global Transport and Logistics

2012 Annual Report – ParentThe Annual Report of DSV A/S (Parent) is an integral part of the 2012 Consolidated Annual Report of DSV
Global Transport and Logistics

TABLE OF CONTENT
Financial statementsIncome statement ......................................................................................................................87Statement of comprehensive income ...................................................................................87Balance sheet .............................................................................................................................88Cash flow statement .................................................................................................................89Statement of changes in equity .............................................................................................90 Notes – Financial statements1 Significant accounting estimates and judgements ....................................................91 Notes – Income statement2 Revenue ................................................................................................................................913 Fees to auditors appointed at the Annual General Meeting ...................................914 Staff costs ............................................................................................................................925 Incentive programmes ......................................................................................................936 Special items........................................................................................................................937 Financial income .................................................................................................................948 Financial expenses..............................................................................................................949 Tax ..........................................................................................................................................94
Notes – Balance sheet10 Intangibles ............................................................................................................................9511 Property, plant and equipment .....................................................................................9612 Investments in Group enterprises .................................................................................9613 Other non-current receivables .......................................................................................9614 Receivables from Group enterprises and other receivables ...................................9715 Share capital ........................................................................................................................9716 Deferred tax ........................................................................................................................9817 Financial liabilities ...............................................................................................................9818 Payables to Group enterprises and other payables ...................................................98 Notes – Supplementary information19 Contingent liabilities, collaterals and other financial liabilities etc. ........................9920 Derivative financial instruments.....................................................................................9921 Financial risks.................................................................................................................... 10022 Related parties ................................................................................................................ 10123 Accounting policies ......................................................................................................... 101
86 DSV 2012 AnnuAl report – pArent
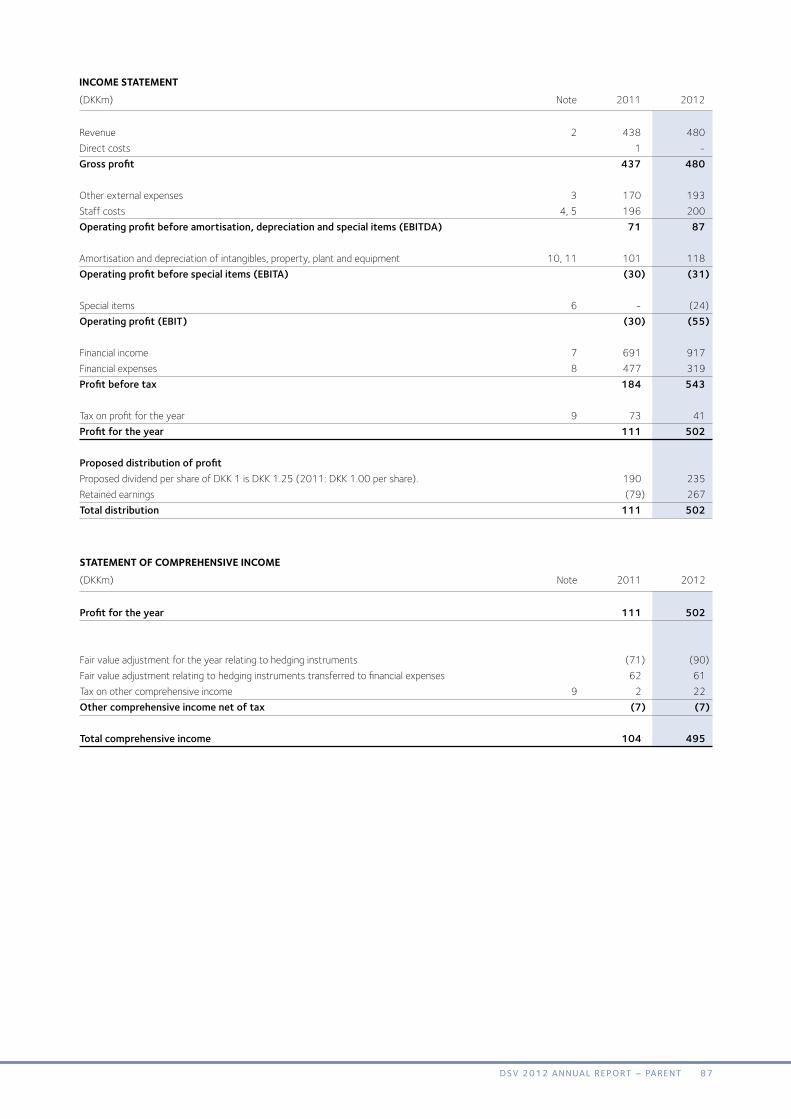
INCOmE STATEmENT(DKKm) Note 2011 2012
Revenue 2 438 480Directcosts 1 -Gross profit 437 480 Otherexternalexpenses 3 170 193Staffcosts 4,5 196 200Operating profit before amortisation, depreciation and special items (EBITDA) 71 87 Amortisationanddepreciationofintangibles,property,plantandequipment 10,11 101 118Operating profit before special items (EBITA) (30) (31) Specialitems 6 - (24)Operating profit (EBIT) (30) (55) Financialincome 7 691 917Financialexpenses 8 477 319Profit before tax 184 543 Taxonprofitfortheyear 9 73 41Profit for the year 111 502 Proposed distribution of profit ProposeddividendpershareofDKK1isDKK1.25(2011:DKK1.00pershare). 190 235Retainedearnings (79) 267Total distribution 111 502
STATEmENT OF COmprEhENSIvE INCOmE(DKKm) Note 2011 2012
Profit for the year 111 502 Fairvalueadjustmentfortheyearrelatingtohedginginstruments (71) (90)Fairvalueadjustmentrelatingtohedginginstrumentstransferredtofinancialexpenses 62 61Taxonothercomprehensiveincome 9 2 22Other comprehensive income net of tax (7) (7) Total comprehensive income 104 495
87DSV 2012 AnnuAl report – pArent
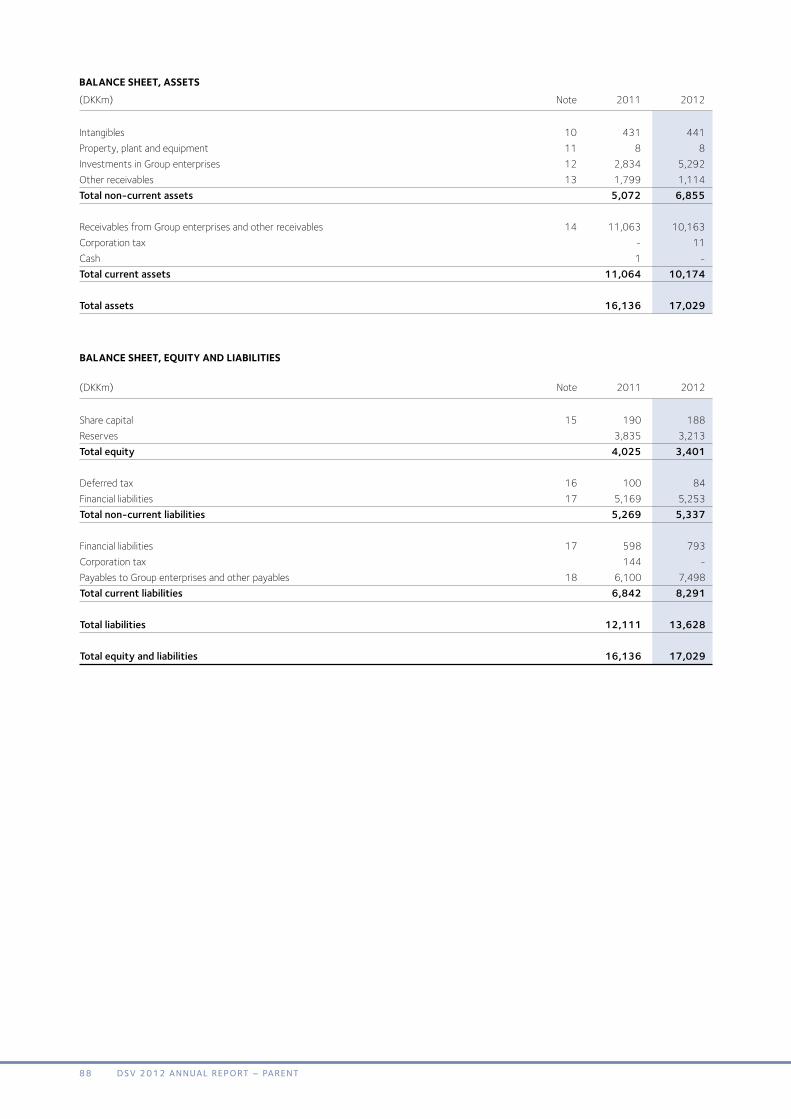
BALANCE ShEET, ASSETS(DKKm) Note 2011 2012
Intangibles 10 431 441Property,plantandequipment 11 8 8InvestmentsinGroupenterprises 12 2,834 5,292Otherreceivables 13 1,799 1,114Total non-current assets 5,072 6,855 ReceivablesfromGroupenterprisesandotherreceivables 14 11,063 10,163Corporationtax - 11Cash 1 -Total current assets 11,064 10,174
Total assets 16,136 17,029
BALANCE ShEET, EquITy ANd LIABILITIES (DKKm) Note 2011 2012
Sharecapital 15 190 188Reserves 3,835 3,213Total equity 4,025 3,401 Deferredtax 16 100 84Financialliabilities 17 5,169 5,253Total non-current liabilities 5,269 5,337 Financialliabilities 17 598 793Corporationtax 144 -PayablestoGroupenterprisesandotherpayables 18 6,100 7,498Total current liabilities 6,842 8,291
Total liabilities 12,111 13,628
Total equity and liabilities 16,136 17,029
88 DSV 2012 AnnuAl report – pArent
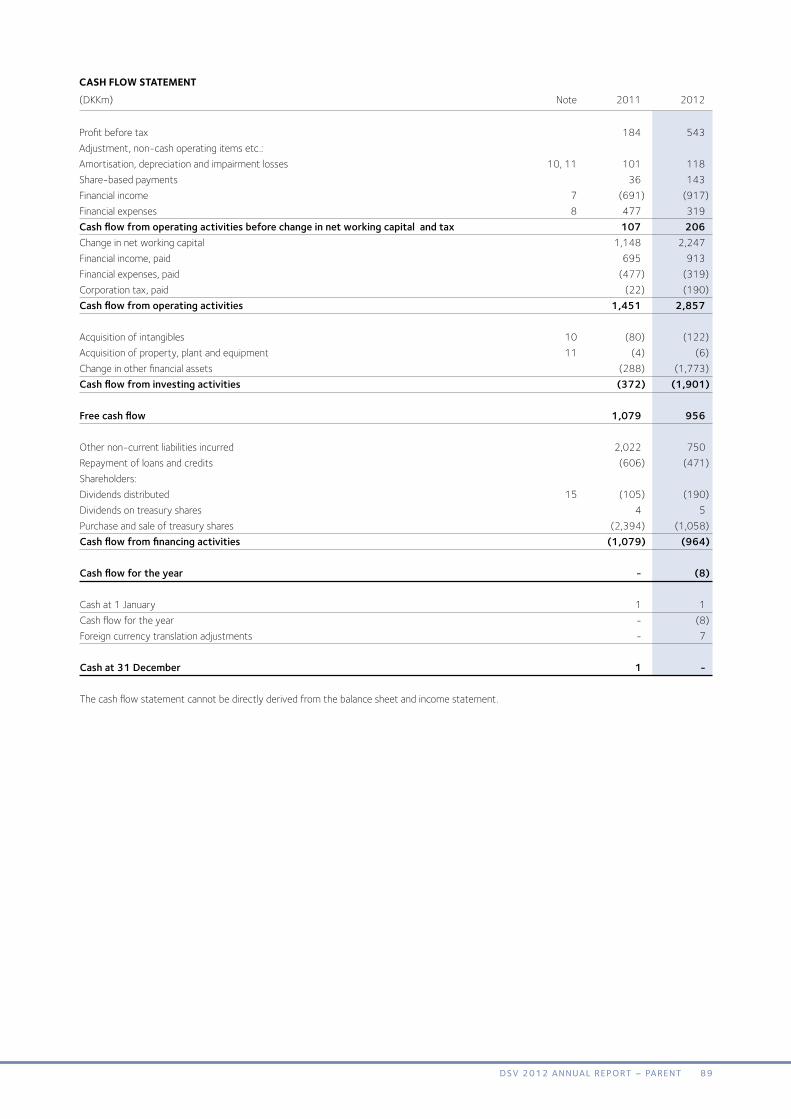
CASh FLOw STATEmENT(DKKm) Note 2011 2012
Profitbeforetax 184 543Adjustment,non-cashoperatingitemsetc.: Amortisation,depreciationandimpairmentlosses 10,11 101 118Share-basedpayments 36 143Financialincome 7 (691) (917)Financialexpenses 8 477 319Cash flow from operating activities before change in net working capital and tax 107 206Changeinnetworkingcapital 1,148 2,247Financialincome,paid 695 913Financialexpenses,paid (477) (319)Corporationtax,paid (22) (190)Cash flow from operating activities 1,451 2,857 Acquisitionofintangibles 10 (80) (122)Acquisitionofproperty,plantandequipment 11 (4) (6)Changeinotherfinancialassets (288) (1,773)Cash flow from investing activities (372) (1,901)
Free cash flow 1,079 956 Othernon-currentliabilitiesincurred 2,022 750Repaymentofloansandcredits (606) (471)Shareholders: Dividendsdistributed 15 (105) (190)Dividendsontreasuryshares 4 5Purchaseandsaleoftreasuryshares (2,394) (1,058)Cash flow from financing activities (1,079) (964) Cash flow for the year - (8) Cashat1January 1 1Cashflowfortheyear - (8)Foreigncurrencytranslationadjustments - 7
Cash at 31 December 1 -
Thecashflowstatementcannotbedirectlyderivedfromthebalancesheetandincomestatement.
89DSV 2012 AnnuAl report – pArent

STATEmENT OF ChANgES IN EquITy - 2011 Hedging Retained Proposed Total(DKKm) Sharecapital reserve earnings dividends equityEquity at 1 January 2011 209 (8) 6,155 105 6,461 Profit for the year - - (79) 190 111 Fairvalueadjustmentfortheyearrelatingtohedginginstruments - (71) - - (71)Fairvalueadjustmentrelatingtohedginginstrumentstransferredtofinancialexpenses - 62 - - 62Taxonothercomprehensiveincome - 2 - - 2Total comprehensive income - (7) - - (7)
Total comprehensive income for the year - (7) (79) 190 104 Share-basedpayments - - 5 - 5Dividendsdistributed - - - (105) (105)Purchaseandsaleoftreasuryshares,net - - (2,418) - (2,418)Capitalreduction (19) - 19 - -Dividendsontreasuryshares - - 4 - 4Otheradjustments - - (26) - (26)Total changes in equity in 2011 (19) (7) (2,495) 85 (2,436)
Equity at 31 December 2011 190 (15) 3,660 190 4,025
STATEmENT OF ChANgES IN EquITy - 2012 Hedging Retained Proposed Total(DKKm) Sharecapital reserve earnings dividends equity
Equity at 1 January 2012 190 (15) 3,660 190 4,025 Profit for the year - - 267 235 502 Fairvalueadjustmentfortheyearrelatingtohedginginstruments - (90) - - (90)Fairvalueadjustmentrelatingtohedginginstrumentstransferredtofinancialexpenses - 61 - - 61Taxonothercomprehensiveincome - 22 - - 22Total comprehensive income - (7) - - (7)
Total comprehensive income for the year - (7) 267 235 495 Share-basedpayments - - 6 - 6Dividendsdistributed - - - (190) (190)Purchaseandsaleoftreasuryshares,net - - (1,084) - (1,084)Capitalreduction (2) - 2 - -Dividendsontreasuryshares - - 5 - 5Otheradjustments - - 144 - 144Total changes in equity in 2012 (2) (7) (660) 45 (624)
Equity at 31 December 2012 188 (22) 3,000 235 (3,401)
Theretainedearningsreserveat31December2012comprisedapremiumofDKK1,354millionarisingontheissueofshares(2011:DKK1,354million)lessthenegativebalancebetweenthepurchaseandsaleoftreasurysharesofDKK6,314million(2011:anegativebalanceofDKK5,230million).
90 DSV 2012 AnnuAl report – pArent
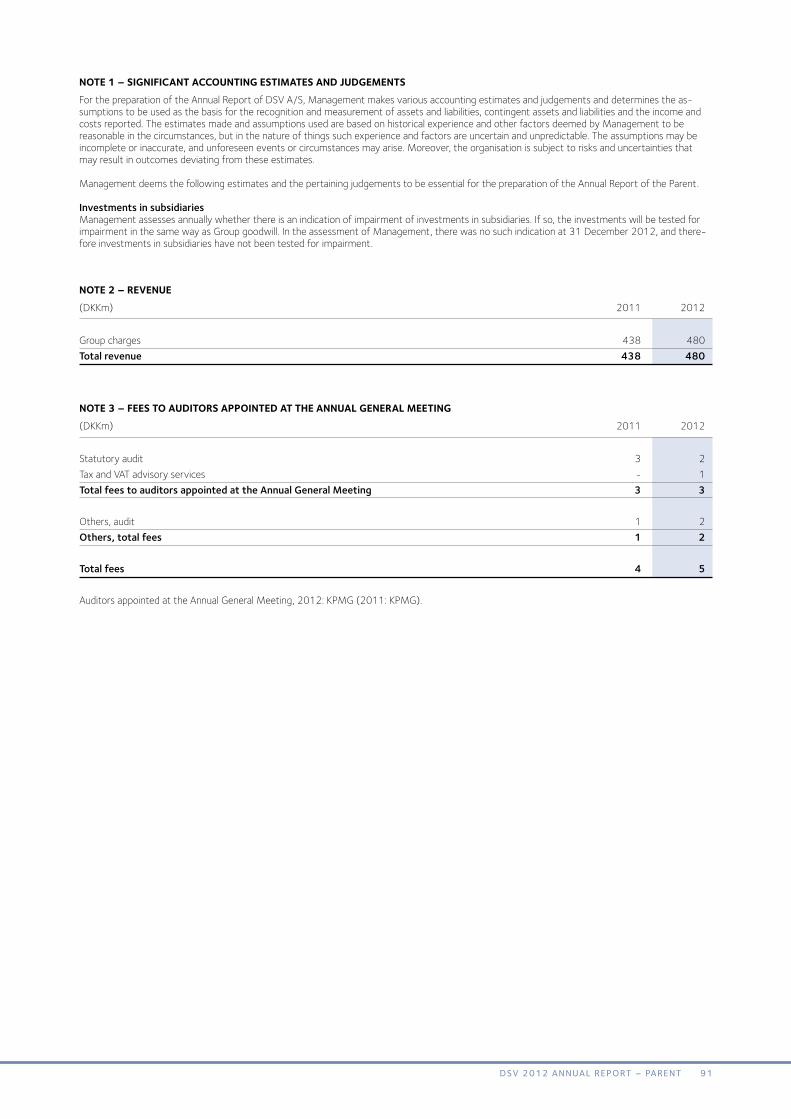
NOTE 1 – SIgNIFICANT ACCOuNTINg ESTImATES ANd judgEmENTSForthepreparationoftheAnnualReportofDSVA/S,Managementmakesvariousaccountingestimatesandjudgementsanddeterminestheas-sumptionstobeusedasthebasisfortherecognitionandmeasurementofassetsandliabilities,contingentassetsandliabilitiesandtheincomeandcostsreported.TheestimatesmadeandassumptionsusedarebasedonhistoricalexperienceandotherfactorsdeemedbyManagementtobereasonableinthecircumstances,butinthenatureofthingssuchexperienceandfactorsareuncertainandunpredictable.Theassumptionsmaybeincompleteorinaccurate,andunforeseeneventsorcircumstancesmayarise.Moreover,theorganisationissubjecttorisksanduncertaintiesthatmayresultinoutcomesdeviatingfromtheseestimates.
ManagementdeemsthefollowingestimatesandthepertainingjudgementstobeessentialforthepreparationoftheAnnualReportoftheParent.
Investments in subsidiariesManagementassessesannuallywhetherthereisanindicationofimpairmentofinvestmentsinsubsidiaries.Ifso,theinvestmentswillbetestedforimpairmentinthesamewayasGroupgoodwill.IntheassessmentofManagement,therewasnosuchindicationat31December2012,andthere-foreinvestmentsinsubsidiarieshavenotbeentestedforimpairment.
NOTE 2 – rEvENuE(DKKm) 2011 2012
Groupcharges 438 480Total revenue 438 480
NOTE 3 – FEES TO AudITOrS AppOINTEd AT ThE ANNuAL gENErAL mEETINg (DKKm) 2011 2012
Statutoryaudit 3 2TaxandVATadvisoryservices - 1Total fees to auditors appointed at the Annual General Meeting 3 3 Others,audit 1 2Others, total fees 1 2
Total fees 4 5
AuditorsappointedattheAnnualGeneralMeeting,2012:KPMG(2011:KPMG).
91DSV 2012 AnnuAl report – pArent
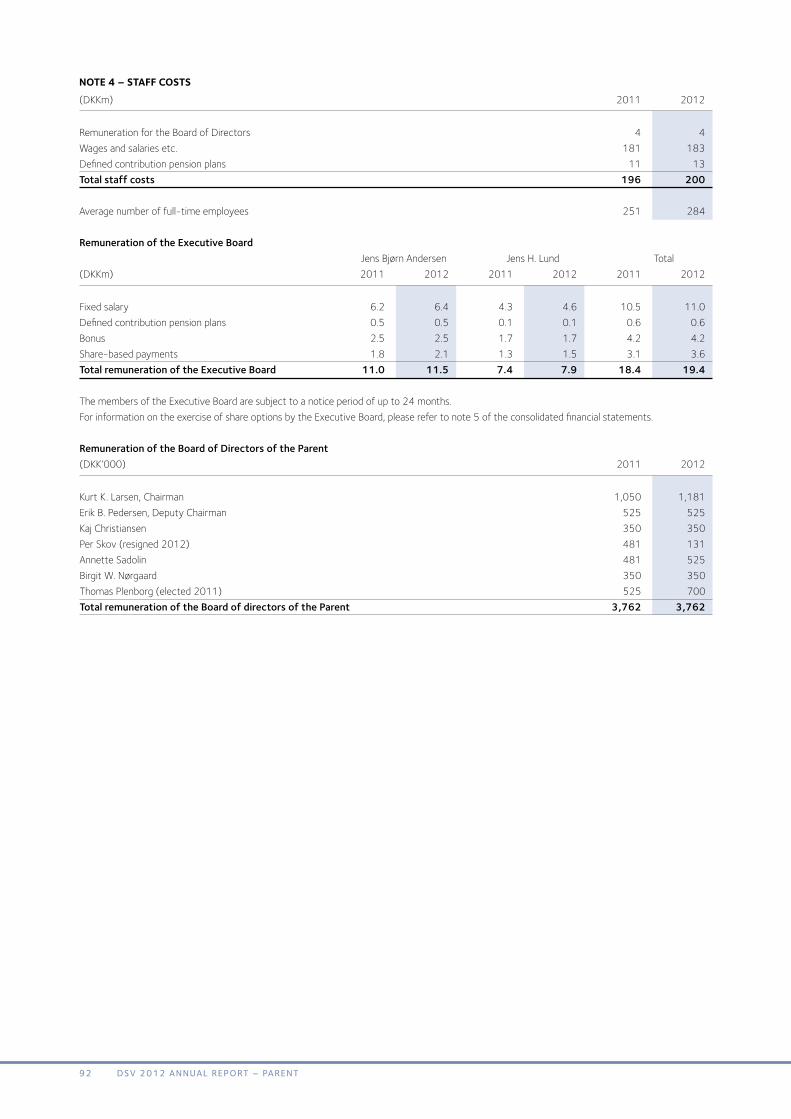
NOTE 4 – STAFF COSTS (DKKm) 2011 2012
RemunerationfortheBoardofDirectors 4 4Wagesandsalariesetc. 181 183Definedcontributionpensionplans 11 13Total staff costs 196 200 Averagenumberoffull-timeemployees 251 284 Remuneration of the Executive Board JensBjørnAndersen JensH.Lund Total(DKKm) 2011 2012 2011 2012 2011 2012
Fixedsalary 6.2 6.4 4.3 4.6 10.5 11.0Definedcontributionpensionplans 0.5 0.5 0.1 0.1 0.6 0.6Bonus 2.5 2.5 1.7 1.7 4.2 4.2Share-basedpayments 1.8 2.1 1.3 1.5 3.1 3.6Total remuneration of the Executive Board 11.0 11.5 7.4 7.9 18.4 19.4 ThemembersoftheExecutiveBoardaresubjecttoanoticeperiodofupto24months.ForinformationontheexerciseofshareoptionsbytheExecutiveBoard,pleaserefertonote5oftheconsolidatedfinancialstatements.Remuneration of the Board of Directors of the Parent (DKK’000) 2011 2012
KurtK.Larsen,Chairman 1,050 1,181ErikB.Pedersen,DeputyChairman 525 525KajChristiansen 350 350PerSkov(resigned2012) 481 131AnnetteSadolin 481 525BirgitW.Nørgaard 350 350ThomasPlenborg(elected2011) 525 700Total remuneration of the Board of directors of the Parent 3,762 3,762
92 DSV 2012 AnnuAl report – pArent

NOTE 5 – INCENTIvE SChEmES DSVA/Shasissuedshareoptionstostaff,seniorstaffandmembersoftheExecutiveBoardoftheCompany.Pleaserefertonote5oftheconsoli-datedfinancialstatementsforacalculationofmarketvaluesandalistofcurrentincentiveshareoptionprogrammes.
Incentive schemes at 31 December 2012 Average exercise Boardof Executive Senior price Exerciseperiod Directors* Board Staff Total peroption
Outstandingoptionsof2009scheme 02/04/2012-31/03/2014 45,000 170,000 27,000 242,000 41.10Outstandingoptionsof2010scheme 02/04/2013-31/03/2015 45,000 170,000 108,000 323,000 98.50Outstandingoptionsof2011scheme 01/04/2014-01/04/2016 - 170,000 103,000 273,000 129.90Outstandingoptionsof2012scheme 01/04/2015-31/03/2017 - 170,000 114,000 284,000 128.00Outstanding at 31 December 2012 90,000 680,000 352,000 1,122,000 101.23
Exercise period open at 31 December 2012 45,000 170,000 27,000 242,000 41.10
*ADirectorreceivedoptionsinhisformercapacityasCEOandinconnectionwithcertainday-to-daymanagerialtasks.TheoptionsweregrantedpursuanttotheprocedureslaiddownintheRemunerationPolicyoftheGroupthenapplicable.
Theweightedaverageremaininglifeat31December2012was2.8years.TheaggregatemarketvaluewasDKK54.6million,ofwhichoptionsamountingtoDKK34.4millionwereheldbyExecutiveBoardmembersandoptionsamountingtoDKK6.8millionwereheldbyamemberoftheBoardofDirectors.
Development in outstanding options Average exercise Boardof Executive Senior price Directors Board Staff Total peroption
Outstandingat1January2011 90,000 340,000 180,000 610,000 71.68
Grantedin2011 - 170,000 105,500 275,500 129.90Optionswaived/expired - - (5,500) (5,500) 69.80Outstanding at 31 December 2011 90,000 510,000 280,000 880,000 89.72
Grantedin2012 - 170,000 114,000 284,000 128.00Exercisedin2012 - - (42,000) (42,000) 41.10Outstanding at 31 December 2012 90,000 680,000 352,000 1,122,000 101.23
NOTE 6 – SpECAL ITEmS(DKKm) 2011 2012
Restructuringcosts - (24)Total special items, net - (24)
93DSV 2012 AnnuAl report – pArent

NOTE 7 – FINANCIAL INCOmE (DKKm) 2011 2012
Interestincome 47 48InterestincomefromGroupenterprises 625 487Foreigncurrencytranslationadjustments,net 19 -Dividendsfromsubsidiaries - 382Total financial income 691 917
Interestincomerelatestointerestfromcashincludedatamortisedcost.
NOTE 8 – FINANCIAL ExpENSES (DKKm) 2011 2012
Interestexpenses 352 211InterestexpensesforGroupenterprises 125 95Foreigncurrencytranslationadjustments,net - 13Total financial expenses 477 319
Interestexpensesrelatetointerestonloansincludedatamortisedcost.
NOTE 9 – TAx (DKKm) 2011 2012
Thetaxfortheyearisdisaggregatedasfollows: Taxonprofitfortheyear 73 41Taxonothercomprehensiveincome (2) (22)Total tax for the year 71 19
Taxonprofitfortheyeariscalculatedasfollows: Currenttax 51 40Deferredtax 9 (16)Taxadjustmentrelatingtopreviousyears 13 17Total tax on profit for the year 73 41 Taxonprofitfortheyearbreaksdownasfollows: Calculated25%taxonprofitfortheyearbeforetax 46 136Taxeffectof: Non-deductibleexpenses/non-taxableincomeetc. 13 (112)Taxadjustmentrelatingtopreviousyears 14 17Total tax on profit for the year 73 41 Effective tax rate 39.7% 7.6% Tax on other comprehensive income 2011 2012 Taxincome/ Taxincome/(DKKm) Beforetax expense Netoftax Beforetax expense Netoftax
Fairvalueadjustmentofhedginginstruments (9) 2 (7) (29) 22 (7)Total (9) 2 (7) (29) 22 (7)
94 DSV 2012 AnnuAl report – pArent

NOTE 10 – INTANgIBLES Intangiblesin(DKKm) Software progress Total
Cost at 1 January 2011 530 71 601 Additionsfortheyear - 80 80Reclassifications 124 (124) -Total cost at 31 December 2011 654 27 681 Total amortisation and impairment at 1 January 2011 155 - 155 Amortisationfortheyear 95 - 95Total amortisation and impairment at 31 December 2011 250 - 250
Carrying amount at 31 December 2011 404 27 431
Cost at 1 January 2012 654 27 681 Additionsfortheyear - 122 122Reclassifications 85 (85) -Total cost at 31 December 2012 739 64 803 Total amortisation and impairment at 1 January 2012 250 - 250 Amortisationfortheyear 112 - 112Total amortisation and impairment at 31 December 2012 362 - 362
Carrying amount at 31 December 2012 377 64 441
Intangiblesinprogressandallmaterialsoftwareassetshavebeentestedforimpairment,anditwasconcludedthatnobasisforimpairmentexistedat31December2012.
95DSV 2012 AnnuAl report – pArent

NOTE 11 – prOpErTy, pLANT ANd EquIpmENT Otherplant andoperating(DKKm) equipment
Cost at 1 January 2011 16 Additionsfortheyear 4Total cost at 31 December 2011 20Total depreciation and impairment at 1 January 2011 6Depreciationfortheyear 6Total depreciation and impairment at 31 December 2011 12
Carrying amount at 31 December 2011 8
Cost at 1 January 2012 20 Additionsfortheyear 6Total cost at 31 December 2012 26Total depreciation and impairment at 1 January 2012 12Depreciationfortheyear 6Total depreciation and impairment at 31 December 2012 18
Carrying amount at 31 December 2012 8Noeventsoccurredinthefinancialyearthatgaverisetoanyindicationofimpairmentofproperty,plantandequipment.
NOTE 12 – INvESTmENTS IN grOup ENTErprISESDSVA/Sownsthefollowingsubsidiaries,allofwhichareincludedintheconsolidatedfinancialstatements Ownership Ownership Company’s share share Registered sharecapital 2011 2012 office (DKKm)
DSVRoadHoldingA/S 100% 100% Brøndby,Danmark 100DSVAir&SeaHoldingA/S 100% 100% Brøndby,Danmark 50DSVSolutionsHoldingA/S 100% 100% Taastrup,Danmark 151DSVInsuranceA/S 100% 100% Brøndby,Danmark 25DSVGroupServicesA/S 100% Brøndby,Danmark 5DSVFinCoA/S 100% Brøndby,Danmark 0.5
AdditionstoinvestmentsinGroupenterprisesrelatetotherecapitalisationofasubsidiaryinallessentials.
NOTE 13 – OThEr NON-CurrENT rECEIvABLES(DKKm) 2011 2012
ReceivablesfromGroupenterprises 1,799 1,113Otherreceivables - 1Other non-current receivables at 31 December 1,799 1,114
96 DSV 2012 AnnuAl report – pArent

NOTE 14 – rECEIvABLES FrOm grOup ENTErprISES ANd OThEr rECEIvABLES (DKKm) 2011 2012
ReceivablesfromGroupenterprises 10,968 10,086Fairvalueofderivativefinancialinstruments 84 23Otherreceivablesetc. 11 54Receivables from Group enterprises and other receivables at 31 December 11,063 10,163
NOTE 15 - ShArE CApITAL (DKKm) 2011 2012
Share capital, beginning of year 209.2 190.0Capitalreduction (19.2) (2.0)Share capital, end of year 190.0 188.0
ThesharecapitalofDSVA/ShasanominalvalueofDKK188,000,000,correspondingto188,000,000shareswithanominalvalueofDKK1each.Noshareconfersanyspecialrightsuponitsholder.Norestrictionsapplytothetransferabilityofthesharesortovotingrights.Thesharecapitalisfullypaidup.
Treasury shares SharesofDKK1 Nominalvalue %ofsharecapital 2011 2012 2011 2012 2011 2012
Treasury shares, beginning of year 2,643,496 4,355,760 2,643,496 4,355,760 1.3 2.3Purchases 21,805,364 10,421,661 21,805,364 10,421,661 10.7 5.5Usedforreductionofsharecapital (19,150,000) (2,000,000)(19,150,000) (2,000,000) (9.2) (1.0)Usedforexerciseofshareoptions (943,100) (2,840,000) (943,100) (2,840,000) (0.5) (1.5)Treasury shares, end of year 4,355,760 9,937,421 4,355,760 9,937,421 2.3 5.3
TreasurysharesareboughtbacktohedgetheCompany’sincentiveschemesandadaptitscapitalstructure.Themarketvalueoftreasurysharesat31December2012wasDKK1,448million(2011:DKK449million).Theacquisitionpriceoftreasurysharesrepurchasedin2012wasDKK1,302million,andthesellingpriceoftreasurysharessoldwasDKK326million.
Dividends ItisproposedtodistributedividendsofDKK1.25pershare(2011:DKK1.00).DSVA/SpaidDKK190millionasdividendson27March2012,cor-respondingtoDKK1pershare(2011:DKK105million,correspondingtoDKK0.50pershare).
DistributionofdividendstotheshareholdersofDSVA/ShasnotaxconsequencesforDSVA/S.
97DSV 2012 AnnuAl report – pArent
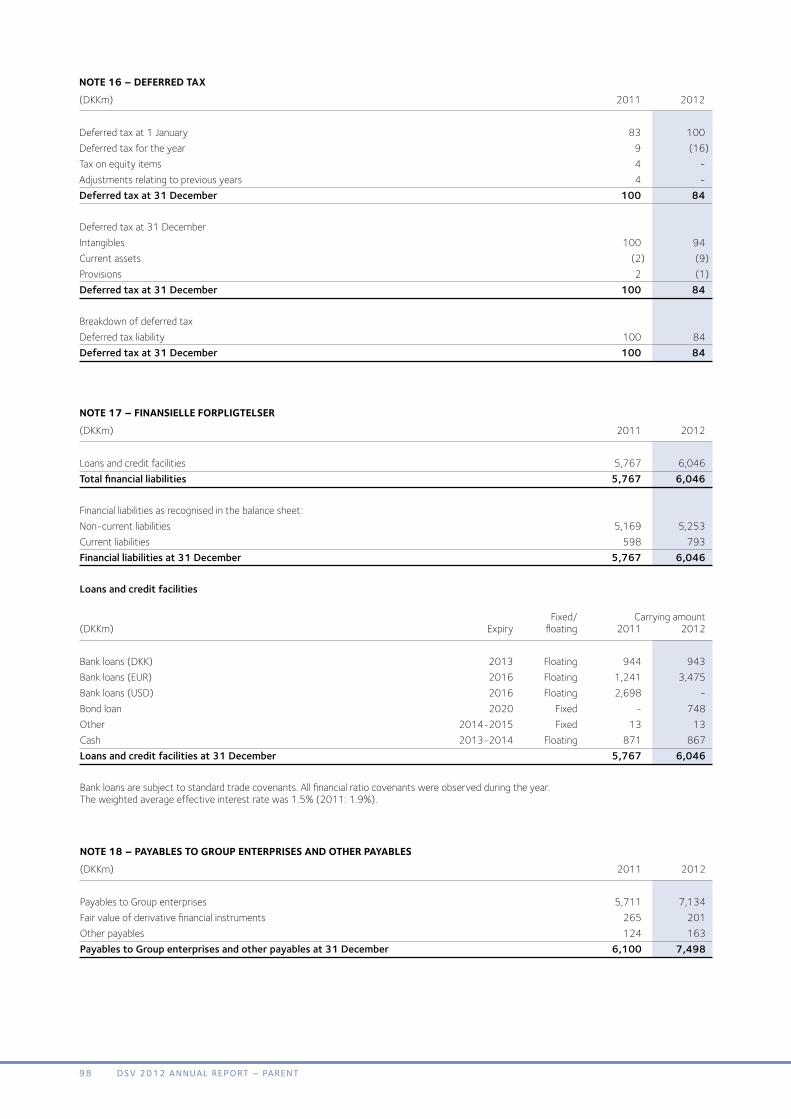
NOTE 16 – dEFErrEd TAx(DKKm) 2011 2012
Deferredtaxat1January 83 100Deferredtaxfortheyear 9 (16)Taxonequityitems 4 -Adjustmentsrelatingtopreviousyears 4 -Deferred tax at 31 December 100 84 Deferredtaxat31December Intangibles 100 94Currentassets (2) (9)Provisions 2 (1)Deferred tax at 31 December 100 84 Breakdownofdeferredtax Deferredtaxliability 100 84Deferred tax at 31 December 100 84
NOTE 17 – FINANSIELLE FOrpLIgTELSEr (DKKm) 2011 2012
Loansandcreditfacilities 5,767 6,046Total financial liabilities 5,767 6,046 Financialliabilitiesasrecognisedinthebalancesheet:Non-currentliabilities 5,169 5,253Currentliabilities 598 793Financial liabilities at 31 December 5,767 6,046Loans and credit facilities Fixed/ Carryingamount(DKKm) Expiry floating 2011 2012
Bankloans(DKK) 2013 Floating 944 943Bankloans(EUR) 2016 Floating 1,241 3,475Bankloans(USD) 2016 Floating 2,698 -Bondloan 2020 Fixed - 748Other 2014-2015 Fixed 13 13Cash 2013-2014 Floating 871 867Loans and credit facilities at 31 December 5,767 6,046
Bankloansaresubjecttostandardtradecovenants.Allfinancialratiocovenantswereobservedduringtheyear. Theweightedaverageeffectiveinterestratewas1.5%(2011:1.9%).
NOTE 18 – pAyABLES TO grOup ENTErprISES ANd OThEr pAyABLES (DKKm) 2011 2012
PayablestoGroupenterprises 5,711 7,134Fairvalueofderivativefinancialinstruments 265 201Otherpayables 124 163Payables to Group enterprises and other payables at 31 December 6,100 7,498
98 DSV 2012 AnnuAl report – pArent

NOTE 19 – CONTINgENT LIABILITIES, COLLATErALS CANd OThEr FINANCIAL LIABILITIES ETC.Operating leases:(DKKm) 2011 2012
Operatingleaseobligationsrelatingtooperatingequipmentfalldue: 0-1year 16 241-5years 15 24Total 31 48
Thefollowingisrecognisedintheincomestatement: Operatingleasesrelatingtooperatingequipment 24 19Total 24 19
DSVA/Sleasespropertiesunderoperatingleaseswithanaverageleasetermof4years. Contractual obligationsDSVA/ShasconcludedITservicecontracts.Thecostsrelatedtothesecontractsarerecognisedastheservicesareprovided.
DSVA/Shasguaranteedforsubsidiaries’outstandingbalanceswithbanksandliabilitiestoleasingcompanies,suppliersandpublicauthoritiesetc.intheamountofDKK3,262million(2011:DKK3,659million).
Moreover,DSVA/Shasissuedseveraldeclarationsofintentrelatingtobalancesbetweensubsidiariesandthirdparties.
Joint and several liability DSVA/SandtheotherDanishGroupenterprisesregisteredjointlyforVATpurposesarejointlyandseverallyliablefortheVATliabilities.DSVA/Sistheadministrationcompanyofthejointtaxationarrangementandisonlyliablefortaxpaymentsreceivedonaccountfromthesubsidiaries.
NOTE 20 – dErIvATIvE FINANCIAL INSTrumENTSHedging instruments at 31 December 2011 Ofwhich Ofwhich recognised recognised inother Contractual inincome comprehen-(DKKm) value Maturity Fairvalue statement siveincome
Currencyinstruments 10,959 2012 7 39 (32)Interestrateinstruments 8,476 2012-2015 (189) (44) (145)Total (182) (5) (177) Hedging instruments at 31 December 2012 Ofwhich Ofwhich recognised recognised inother Contractual inincome comprehen-(DKKm) value Maturity Fairvalue statement siveincome
Currencyinstruments 7,358 2013 16 16 -Interestrateinstruments 7,518 2013-2016 (193) (23) (170)Total (177) (7) (170)
Foreign currency risk hedging TheCompanymainlyusesforeignexchangeforwardcontractstohedgeforeigncurrencyrisks.ThemaincurrencieshedgedareSEK,NOK,GBPandUSD.TheCompanyisexposedtoalowforeigncurrencyrisk.Foreignexchangeforwardcontractsusedtohedgenetinvestmentsandsatisfyingtheconditionsofhedgeaccountingarerecognisedinothercomprehensiveincome.Otherfairvalueadjustmentsarerecognisedintheincomestatementunderfinancialincomeorexpenses. Interest rate risk hedging TheCompanyusesinterestrateswapsandinterestratecapstohedgeinterestraterisks.Therebyfloating-rateloansarerefinancedasfixed-rateloans.Interestrateswapsandinterestratecapssatisfyingtheconditionsofhedgeaccountingarerecogniseddirectlyinothercomprehensiveincome.Interestrateswapsandinterestratecapsnotsatisfyingtheconditionsofhedgeaccountingaswellasaccruedinterestarerecogniseddirectlyintheincomestatementunderfinancialincomeorexpenses.
Theweightedaverageeffectiveinterestrateforexistinginterestrateinstrumentswas1.77%atthereportingdate(2011:2.39%).
99DSV 2012 AnnuAl report – pArent

NOTE 21 – FINANCIAL rISkS Referenceismadetonote26ofthe2012ConsolidatedAnnualReportforadetaileddescriptionofthefinancialrisks.
The liabilities of DSV A/S fall due as listed below: 2011 Contractual cashflows,(DKKm) 0-1year 1-3years 3-5years >5years incl.interest
Loansandcreditfacilities 727 1,366 4,114 - 6,207Otherpayables 124 - - - 124PayablestoGroupenterprises 5,711 - - - 5,711Currencyderivatives (7) - - - (7)Interestratederivatives 106 78 6 - 190Total 6,661 1,444 4,120 - 12,225
2012 Contractual cashflows,(DKKm) 0-1year 1-3years 3-5years >5years incl.interest
Loansandcreditfacilities 918 1,199 3,575 835 6,527Otherpayables 163 - - - 163PayablestoGroupenterprises 7,134 - - - 7,134Currencyderivatives (16) - - - (16)Interestratederivatives 107 91 2 - 200Total 8,306 1,290 3,577 835 14,008
Theanalysisofexpectedmaturityisbasedoncontractualcashflows,includingestimatedinterestpayments.Amountshavenotbeendiscountedforwhichreasontheycannotnecessarilybereconciledtotherelateditemsofthebalancesheet.
Financial instruments categories 2011 2012 Carrying Carrying amounts amounts
Financialassets: Heldfortrading(derivativefinancialcurrencyinstruments) 7 16Loansandreceivables 12,862 11,277
Financialliabilities: Heldfortrading(derivativefinancialinstruments) 188 193Financialliabilitiesmeasuredatamortisedcost 11,602 13,343 Thefairvalueoffinancialassetsandliabilitiesdoesnotdiffersignificantlyfromthecarryingamount. Thevaluationoffinancialinstrumentsmeasuredatfairvaluewasbasedonotherobservableinputsthanpricesquotedinactivemarkets(level2).Interestrateswapsandforeignexchangeforwardcontractswerevaluedusinggenerallyacceptedvaluationtechniquesbasedonrelevantobservabledata.
DSVA/SobtainedacorporatebondloanofDKK750millionwithaDanishpensionfundin2012.Theloanisafixed-ratebulletloanwithadurationof8years.
100 DSV 2012 AnnuAl report – pArent
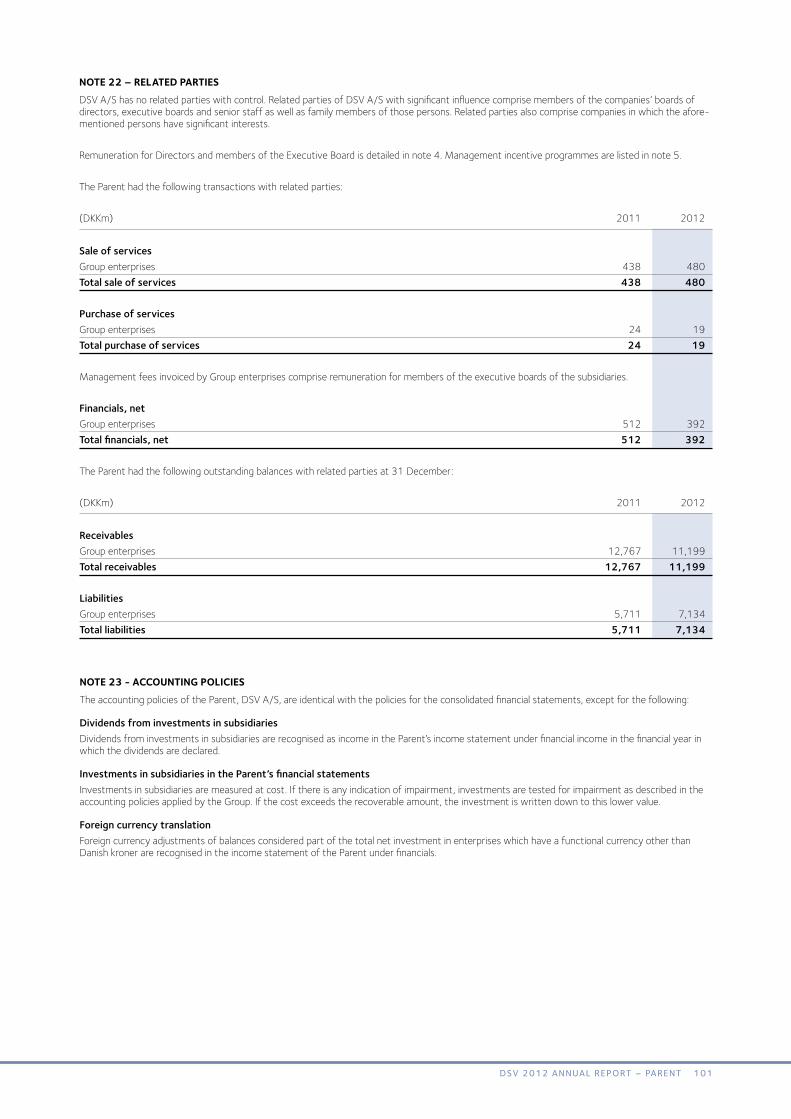
NOTE 22 – rELATEd pArTIES DSVA/Shasnorelatedpartieswithcontrol.RelatedpartiesofDSVA/Swithsignificantinfluencecomprisemembersofthecompanies’boardsofdirectors,executiveboardsandseniorstaffaswellasfamilymembersofthosepersons.Relatedpartiesalsocomprisecompaniesinwhichtheafore-mentionedpersonshavesignificantinterests.
RemunerationforDirectorsandmembersoftheExecutiveBoardisdetailedinnote4.Managementincentiveprogrammesarelistedinnote5.
TheParenthadthefollowingtransactionswithrelatedparties:
(DKKm) 2011 2012
Sale of services Groupenterprises 438 480Total sale of services 438 480 Purchase of services Groupenterprises 24 19Total purchase of services 24 19
ManagementfeesinvoicedbyGroupenterprisescompriseremunerationformembersoftheexecutiveboardsofthesubsidiaries. Financials, net Groupenterprises 512 392Total financials, net 512 392 TheParenthadthefollowingoutstandingbalanceswithrelatedpartiesat31December:
(DKKm) 2011 2012
Receivables Groupenterprises 12,767 11,199Total receivables 12,767 11,199 Liabilities Groupenterprises 5,711 7,134Total liabilities 5,711 7,134
NOTE 23 - ACCOuNTINg pOLICIESTheaccountingpoliciesoftheParent,DSVA/S,areidenticalwiththepoliciesfortheconsolidatedfinancialstatements,exceptforthefollowing:
Dividends from investments in subsidiaries DividendsfrominvestmentsinsubsidiariesarerecognisedasincomeintheParent’sincomestatementunderfinancialincomeinthefinancialyearinwhichthedividendsaredeclared.
Investments in subsidiaries in the Parent’s financial statementsInvestmentsinsubsidiariesaremeasuredatcost.Ifthereisanyindicationofimpairment,investmentsaretestedforimpairmentasdescribedintheaccountingpoliciesappliedbytheGroup.Ifthecostexceedstherecoverableamount,theinvestmentiswrittendowntothislowervalue.
Foreign currency translationForeigncurrencyadjustmentsofbalancesconsideredpartofthetotalnetinvestmentinenterpriseswhichhaveafunctionalcurrencyotherthanDanishkronerarerecognisedintheincomestatementoftheParentunderfinancials.
101DSV 2012 AnnuAl report – pArent

DSV A/SBanemarksvej58
2605BrøndbyDenmark
Tel.+4543203040www.dsv.com
CVR-No.5823352836thfinancialyear
AnnualReportfortheyearended31December2012
Published20February2013
TheAnnualReporthasbeenpreparedinDanishandEnglish.Incaseofdiscrepancies,theDanishversionshallapply.
Designandgraphicproduction:meyer&bukdahlas
Global Transport and Logistics