2011 Scholarships by Race
19
- 1 - Student Aid Policy Analysis The Distribution of Grants and Scholarships by Race Mark Kantrowitz Publisher of Fastweb.com and FinAid.org September 2, 2011 This paper presents data concerning the distribution of grants and scholarships by race. It debunks the race myth, which claims that minority students receive more than their fair share of scholarships. The reality is that minority students are less likely to win private scholarships or receive merit-based institutional grants than Caucasian 1 students. Among undergraduate students e nrolled full-time/full-year in Bachelor’s degree programs at four-year colleges and universities, minority students represent about a third of applicants but slightly more than a quarter of private scholarship recipients. Caucasian students receive more than three-quarters (76%) of all institutional merit-based scholarship and grant funding, even though they represent less than two-thirds (62%) of the student population. Caucasian students are 40% more likely to win private scholarships than minority students. SCHOLARSHIPS RESTRICTED TO CAUCASIAN STUDENTS Every few years someone creates a “Whites Only” scholarship and justifies it by claiming that there aren’t any scholarships for Caucasian students. For example, Colby Bohannan, one of the founders of the Former Majority Association for Equality (FMAE), was quoted in an article on the web site of a Texas television station 2 as saying “It just got really f rustrating when every other scholarship you happen to find online you need not apply to based on your ethnicity or gender.” Similar scholarships are a lso created to protest affirmative action policies and race-based scholarships. While there are very few private scholarships that are explicitly targeted at Caucasian students as a category, 3 Caucasian students receive a disproportionately greater share of private scholarships and merit- based grants. Caucasian students receive more than three times as much in merit-based grant and private scholarship funding as minority students. These “Whites Only” scholarships are usually created by students who are frustrated at their own inability to find and win scholarships. Nationwide, only about 1 in 20 (5.5%) of undergraduate students and about 1 in 8 (12.1%) of full-time Bachelor’s degree students at 4-year colleges and universities pay for college with private scholarships. The average amount per recipient used per year is only about $2,500 to $3,000. While the odds of winning a private scholarship are somewhat higher for Caucasian students, most families tend to overestimate their eligibility for merit-based scholarships. For example, graduating with high class rank does not guarantee that the student will win a scholarship, since there are more than 85,000 high school valedictorians and salutatorians nationwide each year. 4 Private scholarships are 1 The terms ‘White’ and ‘Caucasian’ are used interchangeably and synonymously in this paper, as are the terms ‘Black’ and ‘African-American’ and the terms ‘Latino’ and ‘Hispanic’. 2 Jason Whitely, African-American hands out a 'whites-only' scholarship, WFAA-TV (Dallas/Fort Worth), June 30, 2011. www.wfaa.com/news/national/African-American-hands-out-a-whites-only-scholarship-124822514.html 3 There are, however, many scholarship programs restricted to particular Caucasian ethnicities, such as scholarships for students of German, Greek, Italian, Irish, Norwegian, Polish, Scottish, Swedish or Welsh heritage. 4 This estimate is derived from the number of public and private secondary schools in the US by assuming one valedictorian and one salutatorian per school.
Transcript of 2011 Scholarships by Race

7/31/2019 2011 Scholarships by Race
http://slidepdf.com/reader/full/2011-scholarships-by-race 1/19
- 1 -
Student Aid Policy Analysis
The Distribution of Grants and Scholarships by Race
Mark KantrowitzPublisher of Fastweb.com and FinAid.org
September 2, 2011
This paper presents data concerning the distribution of grants and scholarships by race. It debunks the
race myth, which claims that minority students receive more than their fair share of scholarships. The
reality is that minority students are less likely to win private scholarships or receive merit-based
institutional grants than Caucasian1 students. Among undergraduate students enrolled full-time/full-year
in Bachelor’s degree programs at four-year colleges and universities, minority students represent about a
third of applicants but slightly more than a quarter of private scholarship recipients. Caucasian students
receive more than three-quarters (76%) of all institutional merit-based scholarship and grant funding,
even though they represent less than two-thirds (62%) of the student population. Caucasian students are
40% more likely to win private scholarships than minority students.
SCHOLARSHIPS RESTRICTED TO CAUCASIAN STUDENTS
Every few years someone creates a “Whites Only” scholarship and justifies it by claiming that there aren’t
any scholarships for Caucasian students. For example, Colby Bohannan, one of the founders of the
Former Majority Association for Equality (FMAE), was quoted in an article on the web site of a Texas
television station2 as saying “It just got really frustrating when every other scholarship you happen to find
online you need not apply to based on your ethnicity or gender.” Similar scholarships are also created to
protest affirmative action policies and race-based scholarships.
While there are very few private scholarships that are explicitly targeted at Caucasian students as a
category,3 Caucasian students receive a disproportionately greater share of private scholarships and merit-
based grants. Caucasian students receive more than three times as much in merit-based grant and private
scholarship funding as minority students.
These “Whites Only” scholarships are usually created by students who are frustrated at their own inability
to find and win scholarships. Nationwide, only about 1 in 20 (5.5%) of undergraduate students and about
1 in 8 (12.1%) of full-time Bachelor’s degree students at 4-year colleges and universities pay for college
with private scholarships. The average amount per recipient used per year is only about $2,500 to $3,000.
While the odds of winning a private scholarship are somewhat higher for Caucasian students, most
families tend to overestimate their eligibility for merit-based scholarships. For example, graduating with
high class rank does not guarantee that the student will win a scholarship, since there are more than
85,000 high school valedictorians and salutatorians nationwide each year.4 Private scholarships are
1The terms ‘White’ and ‘Caucasian’ are used interchangeably and synonymously in this paper, as are the terms
‘Black’ and ‘African-American’ and the terms ‘Latino’ and ‘Hispanic’.2
Jason Whitely, African-American hands out a 'whites-only' scholarship, WFAA-TV (Dallas/Fort Worth), June 30,
2011. www.wfaa.com/news/national/African-American-hands-out-a-whites-only-scholarship-124822514.html 3
There are, however, many scholarship programs restricted to particular Caucasian ethnicities, such as
scholarships for students of German, Greek, Italian, Irish, Norwegian, Polish, Scottish, Swedish or Welsh heritage.4
This estimate is derived from the number of public and private secondary schools in the US by assuming one
valedictorian and one salutatorian per school.
7/31/2019 2011 Scholarships by Race
http://slidepdf.com/reader/full/2011-scholarships-by-race 2/19
- 2 -
competitive enough that the majority of students will not win a scholarship. When they don’t win a
scholarship, some students express their disappointment by blaming racial or gender preferences and
restrictions, implying that minority students would not otherwise qualify for a scholarship.
Most such Caucasian-restricted scholarship programs do not survive for more than a few years, typically
ending soon after the founders graduate. Examples of these race-restricted private scholarships include:
• Former Majority Association for Equality (FMAE), founded by a student (and veteran) from
Texas State University (San Marcos, Texas) in 2011.5 Restricted to male college students who are
at least ¼ Caucasian with a 3.0 or higher GPA.
• United Caucasian College Fund (UNCCF), founded by a veteran in 2008.6 Restricted to
Caucasian students.
• The BUCR Caucasian Achievement and Recognition Scholarship (CARS), founded by the
College Republicans at Boston University (Boston, Massachusetts) in 2006.7 Restricted to full-
time BU undergraduate students who are at least ¼ Caucasian with a 3.2 or higher GPA. Defunct.
• Average Joe Scholarship Fund in 2006, founded by the mother of a college student.8 Restricted to
Caucasian male undergraduate students. Defunct.
• Kerr-Otis Partnership for Socio-Economic Scholarships (KOPSES) by students at the University
of Missouri (Columbia, Missouri), in 2004.9 Later renamed American-Coalition for Socio-
Economic Scholarships (ACSES). Restricted to undergraduate students who are at least 1/8
European-American descent. Defunct.
• RWUCR White Scholarship Award, founded by the Roger Williams University chapter of the
College Republicans (Bristol, Rhode Island) in 2004. Defunct.
•
United White Persons College Fund, founded by a student at Texas Tech University (Lubbock,Texas) in 2003. Defunct.
State initiatives banning the use of racial preferences in college admissions and financial aid at public
colleges, such as the Michigan Civil Rights Initiative (Proposal 2), the Washington Civil Rights Act
(Initiative 200) and California’s Proposition 209 also claim that they are motivated in part by concern
over the inequitable distribution of funds. They argue that granting of racial preferences unfairly
discriminates against non-minorities. They say that they believe that scholarships and financial aid should
be awarded solely on the basis of need and ability, not race.
There are also several college-specific endowed scholarships that are restricted to Caucasian students.
These scholarships and their restrictions were established by testamentary bequests to the colleges or
associated college foundations.
5 www.fmafe.org
6 www.unccfonline.com
7The web site at http://people.bu.edu/colrepub has not been updated since 2006.
8The web site at averagejoescholarshipfund.org has been defunct since 2007. A press release announcing the
scholarship can be found at www.prweb.com/releases/2006/01/prweb330108.htm.9 www.columbiamissourian.com/stories/2004/04/15/duo-creates-white-scholarship-as-protest/
7/31/2019 2011 Scholarships by Race
http://slidepdf.com/reader/full/2011-scholarships-by-race 3/19
- 3 -
• Bequest from Marguerite Hornbeck to the University of California’s Board of Regents for
scholarships for “very poor, American, Caucasian scholars” in 1992.
• Mr. and Mrs. Skip Bean Scholarship at the University of Southern Mississippi. Restricted to
dependents of a single parent with financial need. “Preference is to be given to a Caucasian, out-
of-state student with a minimum 2.5 GPA.”
• Stefan Allan Zweig Memorial Scholarship at State University of New York, Binghamton.
Restricted to male Caucasian students in urban planning and development or a related field.
• Francis C. Arthur Scholarship at the University of South Carolina. Restricted to unmarried
Caucasian freshmen who are residents of South Carolina.
• Werner Scott Scholarship at the University of California, Los Angeles in 1945. Restricted to
Caucasian students from Hawaii who are not of Polynesian blood.
Others scholarships for Caucasian students were created for integration and race-relations purposes.
• Oregon League of Minority Voters in 2010, for Caucasian students studying race relations.10
• Diversity Scholarship programs at Alcorn State University, Jackson State University and
Mississippi Valley State University, funded by the Mississippi state legislature in 1997, ordered
by US District Judge Neal Biggers Jr. to award at least 65% of the scholarships from the trust
fund to white students, not just nonblack students.11 These scholarships were designed to attract
Caucasian students to the three historically-black institutions.
• Diversity Scholarship programs at Alabama State University and Alabama A&M University,
created by federal court order in 1995.12 These scholarships were designed to attract Caucasian
students to the two historically-black institutions.
METHODOLOGY
The tables presented in this report are based on data from the National Postsecondary Student Aid Study
(NPSAS), analyzed using the data analysis system for the 2003-04 and 2007-08 studies. The NPSAS is a
large, statistically significant survey of undergraduate and graduate students to determine how they paid
for college. The NPSAS is conducted every four years by the National Center for Education Statistics
(NCES) at the US Department of Education. The 2007-08 NPSAS was based on a nationally-
representative stratified sample of more than 114,000 undergraduate students and 14,000 graduate and
professional students. The 2003-04 NPSAS was based on a nationally-representative stratified sample of
more than 80,000 undergraduate students and 11,000 graduate and professional students.
The statistics in this report concern the distribution of financial aid according to race, without regard towhether racial preferences were used in the awarding of the financial aid funds. Most scholarships do not
use explicit racial preferences. There may, however, be implicit racial preferences. For example,
scholarship search background profile data demonstrates that minority students are less likely to
10 www.oregonlive.com/education/index.ssf/2010/02/oregon_minority_group_to_offer.html
11 www.chronicle.com/article/Judge-Tells-Black-Colleges-in/20522/
12 Ayers v. Fordice, 879 F. Supp. 1419, 1477 (N.D. Miss. 1995), aff’d in part, rev’d in part, remanded , 111 F.3d 1183
(5th Cir. 1997), cert. denied , 118 S. Ct. 871 (1998).
7/31/2019 2011 Scholarships by Race
http://slidepdf.com/reader/full/2011-scholarships-by-race 4/19
- 4 -
participate in equestrian sports, so rodeo scholarships and scholarships for horseback riding tend to be
disproportionately awarded to Caucasian students. Similarly, scholarships for students majoring in Black
Studies tend to be disproportionately awarded to African-American students. Additional examples of
implicit racial preferences are discussed in the analysis section at the end of this paper.
PRIVATE SCHOLARSHIPS
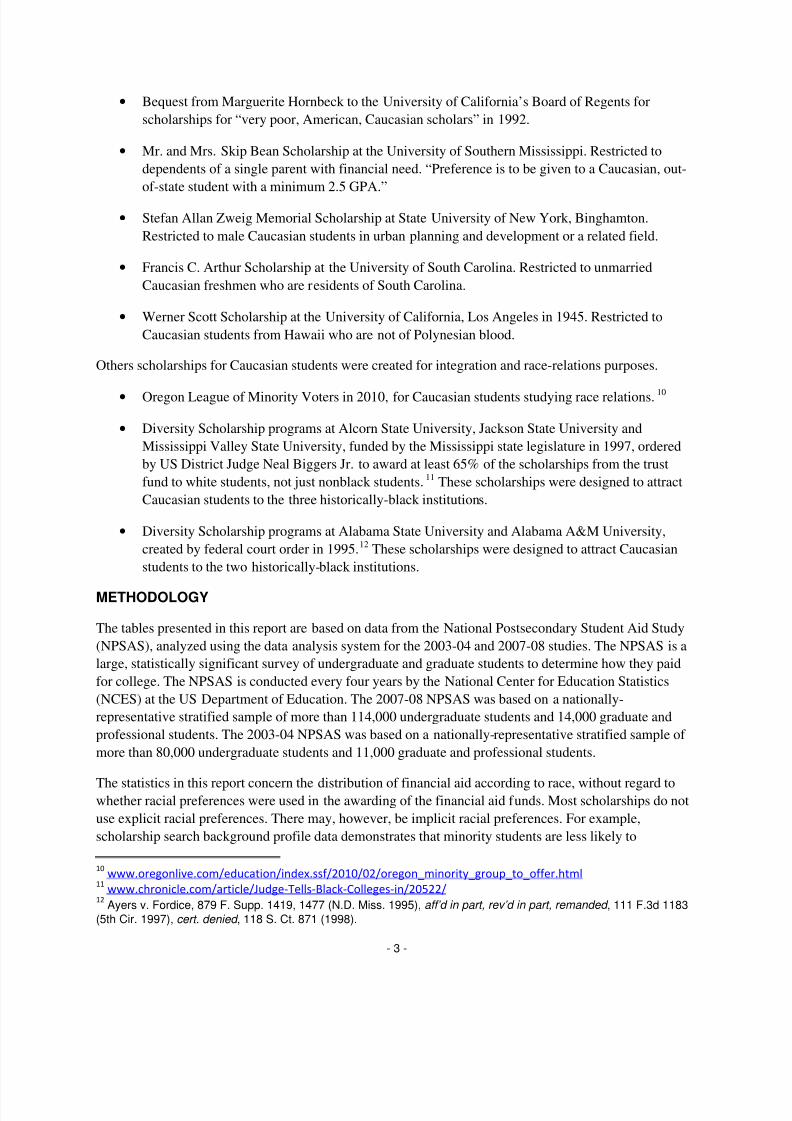
Overall, 5.5% of undergraduate students received private sector scholarships in 2007-08, and the average
amount received by those students was $2,523.
The following table provides information about the distribution of private scholarships to students from
each race, including the probability of winning a scholarship, the number of recipients, the total
scholarship funding and a comparison of the percentage of recipients, the percentage of funding and the
percentage of the student population. As this table demonstrates, Caucasian students are more likely to
win private scholarships than African-American, Latino or Asian students. While there are very few
private scholarships that are explicitly restricted to Caucasian students, Caucasian students receive a
disproportionately greater share of private scholarship funding. Caucasian students represent 69.3% of
private scholarship recipients but only 61.8% of the undergraduate student population. This is in contrastwith minority students, who represent 30.5% of scholarship recipients and 38.0% of the undergraduate
student population. Caucasian students are 40% more likely to win private scholarships than minority
students.
To put minority students on an equal footing would require increasing annual private scholarship awards
for African-American students by $83 million and Latino students by $197 million. These figures are
based on equalizing the mean grant, the ratio of total funding to total student enrollment, so that all racial
groups have the same mean grant. Equalizing just the probability of receiving a private scholarship
without changing the average scholarship amount per recipient would require increasing total private
scholarship funding by $138 million for African-American students and $179 million for Latino students.
Private ScholarshipsAll Students
Race
PercentageReceiving
Private
Scholarships
AverageScholarship
Amount
Received
TotalPrivate
Scholarship
Funding
Numberof
Scholarship
Recipients
Percentageof
Scholarship
Recipients
Percentageof
Total
Funding
Percentageof
Student
Population
Total 5.5% $2,523 $2,908 million 1,152,300 100.0% 100.0% 100.0%
White 6.2% $2,368 $1,891 million 798,400 69.3% 65.0% 61.8%
All Minority Students 4.4% $2,871 $1,008 million 351,100 30.5% 34.7% 38.0%
Black or African-American 4.4% $2,671 $345 million 129,000 11.2% 11.9% 14.0%
Hispanic or Latino 3.5% $2,269 $236 million 103,900 9.0% 8.1% 14.1%
Asian 4.3% $3,516 $186 million 52,800 4.6% 6.4% 5.9%
American Indian or Alaska Native13
10.8% $2,935 $56 million 19,000 1.6% 1.9% 0.8%
Native Hawaiian or Pacific Islander14
4.1% $4,900 $30 million 6,200 0.5% 1.0% 0.7%
More Than One Race 8.1% $3,878 $156 million 40,200 3.5% 5.4% 2.4%
This table reports the percentage of students receiving scholarships by race and not the percentage of
scholarships that are restricted to students of each race. Minority students can and do win many
scholarships that are not race-exclusive. Less than 5% of all scholarship programs and less than 10% of
the total number of individual scholarships consider the student's race among their eligibility criteria.
Most race-restricted scholarships also include additional criteria based on academic performance,
extracurricular activities and community service.
13The figures for American Indian or Alaska Native students may be unreliable due to small sample size.
14The figures for Native Hawaiian or Pacific Islander students may be unreliable due to small sample size.

7/31/2019 2011 Scholarships by Race
http://slidepdf.com/reader/full/2011-scholarships-by-race 5/19
- 5 -
The following pie chart shows the distribution of total private scholarship funding by race, demonstrating
that Caucasian students receive the majority of private scholarship funding.
The next table provides information on the distribution of private scholarships by race, but only for
students who are enrolled full-time/full-year in Bachelor’s degree programs at 4-year colleges and
universities.15 Caucasian students receive a disproportionately greater share of these scholarships.
Minority students represent 31.0% of the student population but only 27.5% of the scholarship recipients,
while Caucasian students represent 68.2% of the student population and 71.7% of the scholarship
recipients.
Private Scholarships
Bachelor’s Degree Programs
4-year, Full-Time/Full-Year
Race
Percentage
Receiving
Private
Scholarships
Average
Scholarship
Amount
Received
Total
Private
Scholarship
Funding
Number
of
Scholarship
Recipients
Percentage
of
Scholarship
Recipients
Percentage
of
Total
Funding
Percentage
of
Student
Population
Total 12.1% $2,789 $1,799 million 644,800 100.0% 100.0% 100.0%
White 12.7% $2,651 $1,226 million 462,400 71.7% 68.1% 68.2%
All Minority Students 10.7% $3,073 $544 million 177,000 27.5% 30.2% 31.0%
Black or African-American 11.7% $2,949 $196 million 66,400 10.3% 10.9% 10.7%
Hispanic or Latino 9.1% $2,330 $123 million 52,600 8.2% 6.8% 10.9%
Asian 8.4% $3,158 $90 million 28,500 4.4% 5.0% 6.4%
American Indian or Alaska Native16
30.0% $4,153 $35 million 8,500 1.3% 2.0% 0.5%
Native Hawaiian or Pacific Islander17
13.1% NA NA NA NA NA NA
More Than One Race 15.4% $4,773 $100 million 21,000 3.3% 5.6% 2.6%
15The table on page 17 of the Secrets to Winning a Scholarship (2011) book reports that minority students
represent 33.8% of applicants but only 28.5% of scholarship recipients, compared with the 31.0% and 27.5%
figures from this table. The book’s table differs from this table because that table adds a restriction to students
who applied for financial aid and this table adds a restriction to students in Bachelor’s degree programs (some
undergraduate students at 4-year colleges are enrolled in Associate’s degree or Certificate programs).16
The figures for American Indian or Alaska Native students may be unreliable due to small sample size.17
The figures for Native Hawaiian or Pacific Islander students may be unreliable due to small sample size.
White65.2%
Black or African
American11.9%
Hispanic or
Latino
8.1%
Asian
6.4%
American Indian
or Alaska Native
1.9%
Native Hawaiianor Pacific Islander
1%
More than
one race
5%
Distribution of Private Scholarship Funding
by Race, 2007-08

7/31/2019 2011 Scholarships by Race
http://slidepdf.com/reader/full/2011-scholarships-by-race 6/19
- 6 -
The following table provides information on the distribution of private scholarships by race, but only for
students who received a Pell Grant. This demonstrates that Caucasian students are still more likely to win
private scholarships than African-American, Latino or Asian students even when adjusted for differences
in financial need. Minority students represent 52.7% of Pell Grant recipients but receive only 46.6% of
private scholarships, while Caucasian students represent 46.3% of Pell Grant recipients but receive 52.5%of private scholarships.
Private Scholarships
Pell Grant Recipients
Race
Percentage
Receiving
Private
Scholarships
Average
Scholarship
Amount
Received
Total
Private
Scholarship
Funding
Number
of
Scholarship
Recipients
Percentage
of
Scholarship
Recipients
Percentage
of
Total
Funding
Percentage
of
Student
Population
Total 6.0% $2,658 $919 million 345,800 100.0% 100.0% 100.0%
White 6.9% $2,446 $444 million 181,700 52.5% 48.3% 46.3%
All Minority Students 5.3% $2,872 $463 million 161,100 46.6% 50.3% 52.7%
Black or African-American 5.2% $2,716 $192 million 70,800 20.5% 20.9% 23.7%
Hispanic or Latino 4.1% $2,366 $112 million 47,400 13.7% 12.2% 20.4%
Asian 6.8% $3,832 $72 million 18,900 5.5% 7.9% 4.8%
American Indian or Alaska Native 10.0% $3,235 $21 million 6,400 1.9% 2.3% 1.1%
Native Hawaiian or Pacific Islander 4.0% NA NA NA NA NA NA
More Than One Race 11.5% $3,703 $65 million 17,600 5.1% 7.1% 2.7%
The following table provides information on the distribution of private scholarships by race, but only for
students with a high school GPA of 3.5 or better on a 4.0 scale (A- to A). Even among these high GPA
students, Caucasian students are more likely to win private scholarships than African-American, Latino or
Asian students. Minority students represent 29.2% of high GPA students but receive only 22.4% of
private scholarships, while Caucasian students represent 70.0% of high GPA students but receive 76.8%
of private scholarships.
Private Scholarships
H.S. GPA ≥ 3.5 (A- to A)
Race
Percentage
Receiving
Private
Scholarships
Average
Scholarship
Amount
Received
Total
Private
Scholarship
Funding
Number
of
Scholarship
Recipients
Percentage
of
Scholarship
Recipients
Percentage
of
Total
Funding
Percentage
of
Student
Population18
Total 10.4% $2,731 $1,531 million 560,400 100.0% 100.0% 100.0%White 11.4% $2,570 $1,106 million 430,600 76.8% 72.3% 70.0%
All Minority Students 8.0% $3,228 $405 million 125,400 22.4% 26.5% 29.2%
Black or African-American 9.1% $3,235 $112 million 34,600 6.2% 7.3% 7.1%
Hispanic or Latino 6.2% $2,665 $103 million 38,600 6.9% 6.7% 11.6%
Asian 6.9% $3,160 $88 million 27,800 5.0% 5.7% 7.5%
American Indian or Alaska Native 20.3% $4,890 $33 million 6,800 1.2% 2.2% 0.6%
Native Hawaiian or Pacific Islander 9.4% NA NA NA NA NA NA
More Than One Race 14.0% $3,917 $69 million 17,600 3.1% 4.5% 2.3%
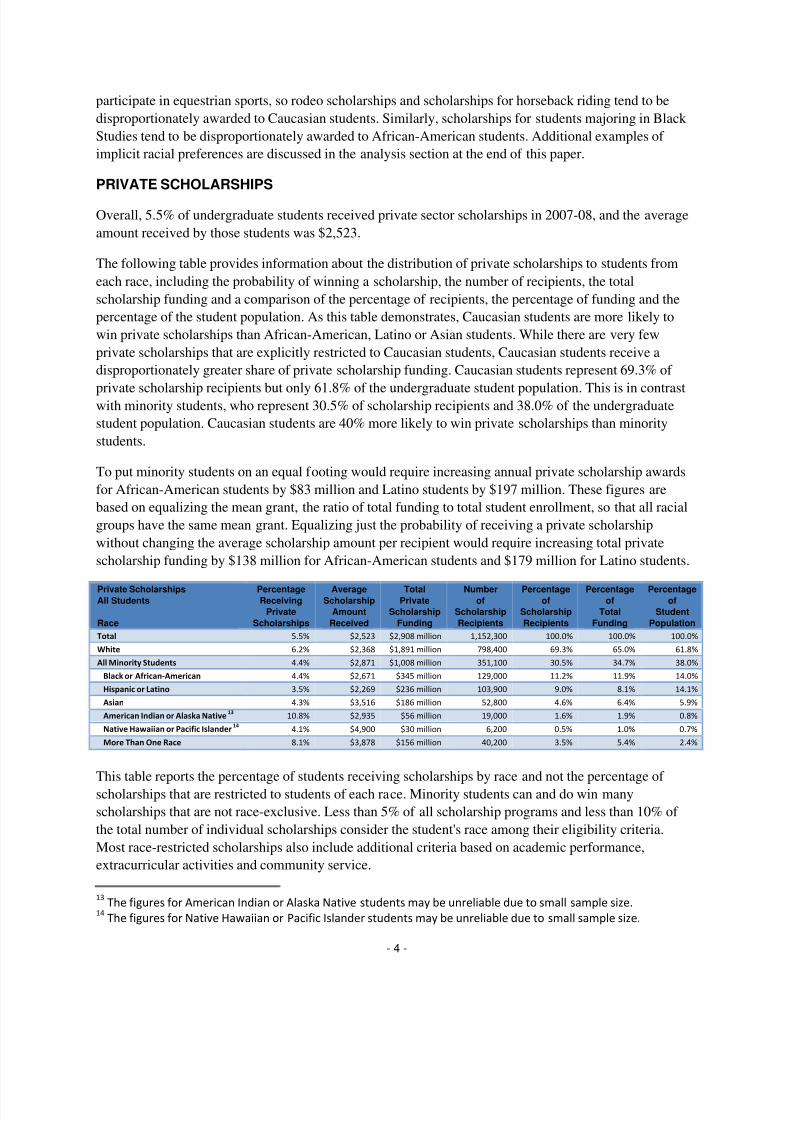
The following table provides information on the distribution of private scholarships by race, but only for
students with a college GPA of 3.5 or better on a 4.0 scale (A- to A). Even among these high GPA
students, Caucasian students are more likely to win private scholarships than African-American, Latino or
Asian students. Minority students represent 29.9% of high GPA students but receive only 22.2% of private scholarships, while Caucasian students represent 69.3% of high GPA students but receive 76.9%
of private scholarships.
18The percentage of student population column in both the high school and college GPA tables is restricted to the
percentage of just high GPA students. A subsequent table illustrates how the percentage of students in the high
GPA group varies according to race. Note that 14.0% of Caucasian students and 13.3% of Asian students with an
SAT combined score (or ACT equivalent) of 1300/1600 received private scholarships, compared with 8.9% of
African-American students and 5.7% of Latino students.
7/31/2019 2011 Scholarships by Race
http://slidepdf.com/reader/full/2011-scholarships-by-race 7/19
- 7 -
Private Scholarships
College GPA ≥ 3.5 (A- to A)
Race
Percentage
Receiving
Private
Scholarships
Average
Scholarship
Amount
Received
Total
Private
Scholarship
Funding
Number
of
Scholarship
Recipients
Percentage
of
Scholarship
Recipients
Percentage
of
Total
Funding
Percentage
of
Student
Population
Total 7.3% $2,623 $1,152 million 439,100 100.0% 100.0% 100.0%
White 8.1% $2,444 $825 million 337,600 76.9% 71.6% 69.3%
All Minority Students 5.4% $3,181 $310 million 97,400 22.2% 26.9% 29.9%
Black or African-American 5.1% $2,654 $75 million 28,200 6.4% 6.5% 9.2%
Hispanic or Latino 3.8% $2,583 $67 million 25,900 5.9% 5.8% 11.3%
Asian 6.8% $3,363 $88 million 26,200 6.0% 7.7% 6.4%
American Indian or Alaska Native 11.5% $2,897 $13 million 4,500 1.0% 1.1% 0.7%
Native Hawaiian or Pacific Islander 7.4% NA NA NA NA NA NA
More Than One Race 8.9% $5,311 $67 million 12,600 2.9% 5.8% 2.4%
The following table shows how the number of private scholarship recipients in the high GPA group varies
as a percentage of total student enrollments according to race. Almost a third of Caucasian students and
Asian students who received private scholarships are in the high college GPA group, but only about a
fifth of African-American, Latino, American Indian or Alaska Native, and Native Hawaiian or Pacific
Islander students. This difference is the equivalent of about a 0.25 difference in the GPA on a 4.0 scaleoverall, and a 0.40 GPA difference for African-American students.
GPA ≥ 3.5 (A- to A)
Race
Percentage
with
High GPA
(College)
Percentage
with
High GPA
(High School)
Total 28.8% 25.7%
White 32.3% 29.2%
All Minority Students 23.1% 20.2%
Black or African-American 18.8% 13.0%
Hispanic or Latino 22.9% 21.2%
Asian 31.3% 32.7%
American Indian or Alaska Native 22.4% 19.0%
Native Hawaiian or Pacific Islander 23.8% 22.7%
More Than One Race 28.6% 25.4%
The next table shows the distribution of high school GPA for all students, not just private scholarship
recipients. Caucasian students are more likely to have higher grades than African-American, Latino and
other minority students except for Asian students.
High School GPA
Race0.5-0.9
(D- to D)1.0-1.4
(D to C-)1.5-1.9
(C- to C)2.0-2.4
(C to B-)2.5-2.9
(B- to B)3.0-3.4
(B to A-)3.5-4.0
(A- to A)
Total 0.1% 0.4% 1.9% 12.9% 14.0% 37.3% 33.4%
White 0.1% 0.3% 1.8% 11.1% 13.0% 36.5% 37.3%
All Minority Students 0.2% 0.5% 2.2% 16.0% 15.6% 38.6% 27.0%
Black or African-American 0.1% 0.8% 3.3% 20.2% 19.2% 36.8% 19.7%
Hispanic or Latino 0.2% 0.3% 1.9% 15.4% 15.4% 40.4% 26.4%
Asian 0.2% 0.2% 1.1% 9.8% 10.9% 37.6% 40.2%
American Indian or Alaska Native 0.8% 1.3% 2.8% 16.1% 10.6% 40.3% 28.2%
Native Hawaiian or Pacific Islander 0.0% 0.2% 2.9% 17.0% 15.5% 36.7% 27.7%
More Than One Race 0.1% 0.4% 1.6% 14.8% 11.8% 39.0% 32.4%
The next table shows the distribution of college GPA for all students, not just private scholarship
recipients. Caucasian students are much more likely to have higher grades than African-American, Latino
and other minority students except for Asian students.
7/31/2019 2011 Scholarships by Race
http://slidepdf.com/reader/full/2011-scholarships-by-race 8/19
- 8 -
College GPA
Race0.5-0.9
(D- to D)1.0-1.4
(D to C-)1.5-1.9
(C- to C)2.0-2.4
(C to B-)2.5-2.9
(B- to B)3.0-3.4
(B to A-)3.5-4.0
(A- to A)
Total 1.1% 3.4% 5.4% 13.2% 19.1% 25.6% 32.3%
White 0.9% 2.8% 4.3% 11.7% 17.8% 26.2% 36.3%
All Minority Students 1.4% 4.3% 7.0% 15.6% 21.3% 24.6% 25.8%
Black or African-American 2.0% 5.1% 8.2% 18.0% 22.1% 23.5% 21.0%
Hispanic or Latino 1.3% 4.2% 7.0% 15.3% 21.1% 25.4% 25.6%
Asian 0.7% 2.8% 4.1% 12.1% 19.0% 26.0% 35.3%
American Indian or Alaska Native 1.2% 4.1% 10.2% 13.7% 25.8% 20.4% 24.6%
Native Hawaiian or Pacific Islander 1.1% 5.0% 5.9% 18.0% 18.4% 25.9% 25.7%
More Than One Race 0.8% 3.2% 6.1% 12.3% 22.0% 23.5% 32.1%
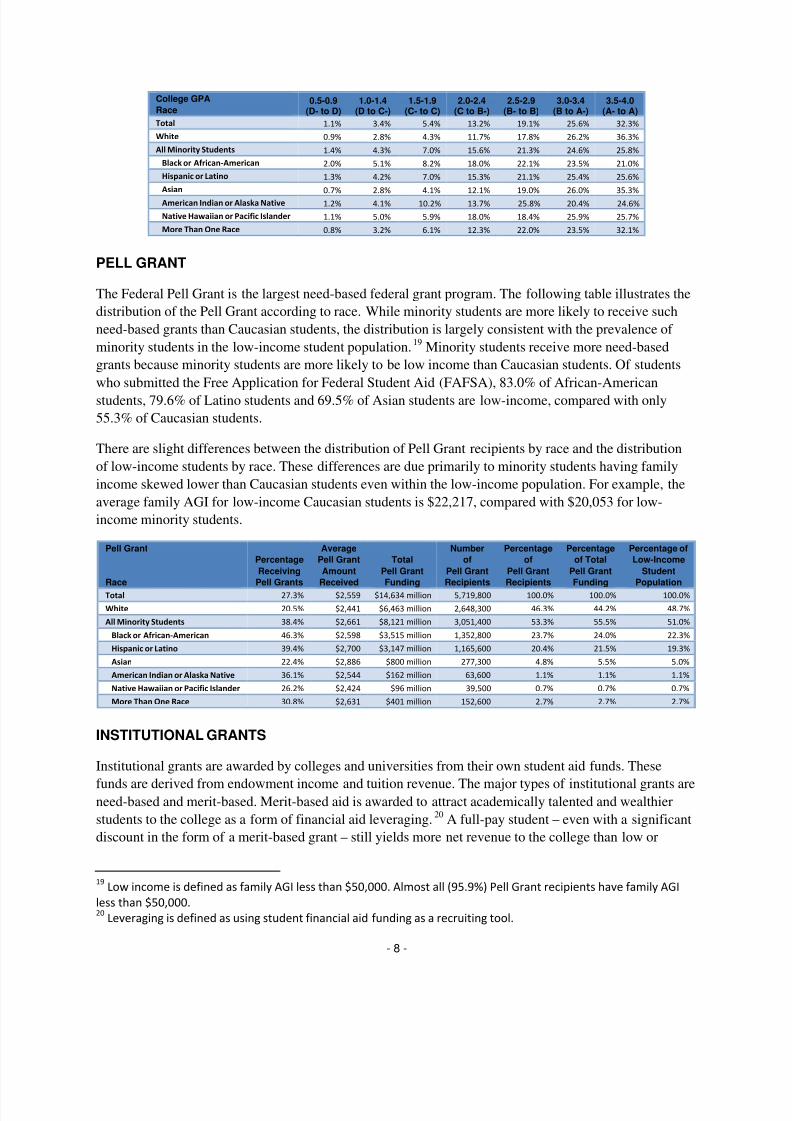
PELL GRANT
The Federal Pell Grant is the largest need-based federal grant program. The following table illustrates the
distribution of the Pell Grant according to race. While minority students are more likely to receive such
need-based grants than Caucasian students, the distribution is largely consistent with the prevalence of
minority students in the low-income student population.19 Minority students receive more need-based
grants because minority students are more likely to be low income than Caucasian students. Of students
who submitted the Free Application for Federal Student Aid (FAFSA), 83.0% of African-American
students, 79.6% of Latino students and 69.5% of Asian students are low-income, compared with only
55.3% of Caucasian students.
There are slight differences between the distribution of Pell Grant recipients by race and the distribution
of low-income students by race. These differences are due primarily to minority students having family
income skewed lower than Caucasian students even within the low-income population. For example, the
average family AGI for low-income Caucasian students is $22,217, compared with $20,053 for low-
income minority students.
Pell Grant
Race
Percentage
Receiving
Pell Grants
Average
Pell Grant
Amount
Received
Total
Pell Grant
Funding
Number
of
Pell Grant
Recipients
Percentage
of
Pell Grant
Recipients
Percentage
of Total
Pell Grant
Funding
Percentage of
Low-Income
Student
Population
Total 27.3% $2,559 $14,634 million 5,719,800 100.0% 100.0% 100.0%
White 20.5% $2,441 $6,463 million 2,648,300 46.3% 44.2% 48.7%
All Minority Students 38.4% $2,661 $8,121 million 3,051,400 53.3% 55.5% 51.0%
Black or African-American 46.3% $2,598 $3,515 million 1,352,800 23.7% 24.0% 22.3%
Hispanic or Latino 39.4% $2,700 $3,147 million 1,165,600 20.4% 21.5% 19.3%
Asian 22.4% $2,886 $800 million 277,300 4.8% 5.5% 5.0%
American Indian or Alaska Native 36.1% $2,544 $162 million 63,600 1.1% 1.1% 1.1%
Native Hawaiian or Pacific Islander 26.2% $2,424 $96 million 39,500 0.7% 0.7% 0.7%
More Than One Race 30.8% $2,631 $401 million 152,600 2.7% 2.7% 2.7%
INSTITUTIONAL GRANTS
Institutional grants are awarded by colleges and universities from their own student aid funds. These
funds are derived from endowment income and tuition revenue. The major types of institutional grants areneed-based and merit-based. Merit-based aid is awarded to attract academically talented and wealthier
students to the college as a form of financial aid leveraging.20 A full-pay student – even with a significant
discount in the form of a merit-based grant – still yields more net revenue to the college than low or
19Low income is defined as family AGI less than $50,000. Almost all (95.9%) Pell Grant recipients have family AGI
less than $50,000.20
Leveraging is defined as using student financial aid funding as a recruiting tool.
7/31/2019 2011 Scholarships by Race
http://slidepdf.com/reader/full/2011-scholarships-by-race 9/19
- 9 -
moderate-income students. This helps the college control its discount rate, the ratio of institutional grant
aid to tuition revenue. There are also institutional grants that are based on neither financial need nor merit,
such as tuition waivers for children of college faculty and staff and tuition waivers for resident assistants
in the dormitories, but these grants represent less than 8% of total institutional grant funding. As the
following tables demonstrate, there are significant differences in the distribution of need-based and merit-
based institutional grants by race.
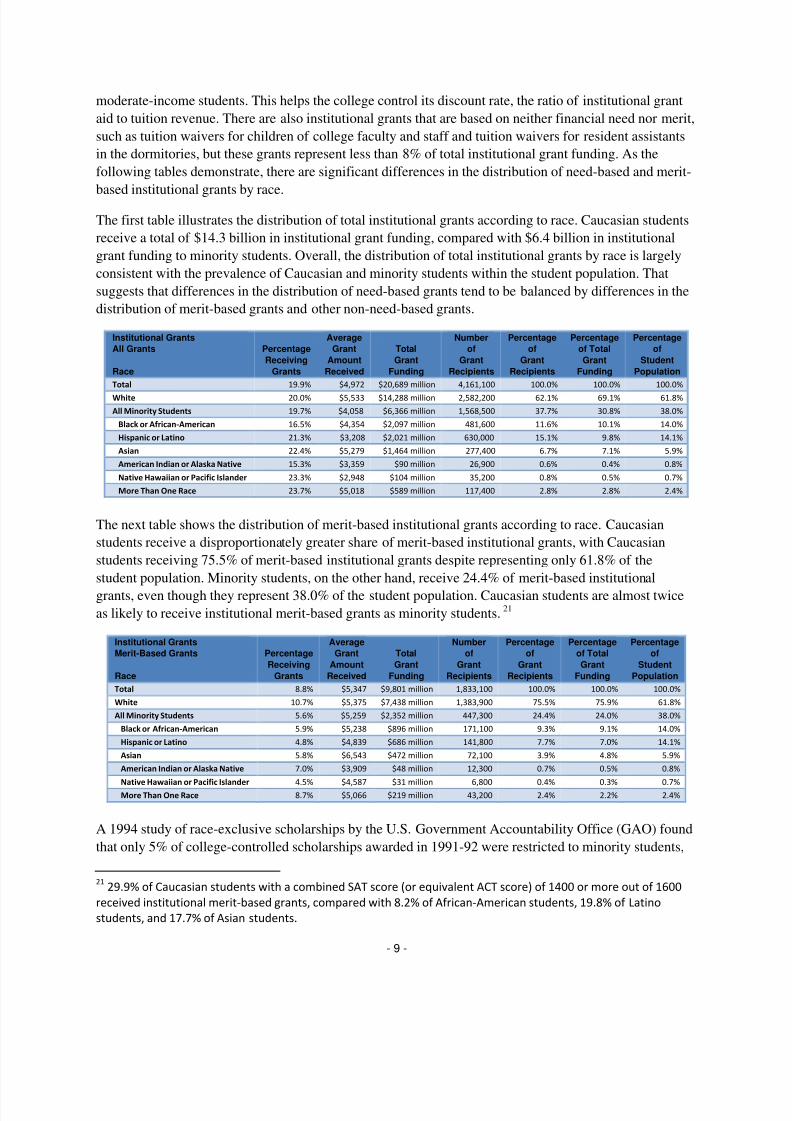
The first table illustrates the distribution of total institutional grants according to race. Caucasian students
receive a total of $14.3 billion in institutional grant funding, compared with $6.4 billion in institutional
grant funding to minority students. Overall, the distribution of total institutional grants by race is largely
consistent with the prevalence of Caucasian and minority students within the student population. That
suggests that differences in the distribution of need-based grants tend to be balanced by differences in the
distribution of merit-based grants and other non-need-based grants.
Institutional Grants
All Grants
Race
Percentage
Receiving
Grants
Average
Grant
Amount
Received
Total
Grant
Funding
Number
of
Grant
Recipients
Percentage
of
Grant
Recipients
Percentage
of Total
Grant
Funding
Percentage
of
Student
Population
Total 19.9% $4,972 $20,689 million 4,161,100 100.0% 100.0% 100.0%
White 20.0% $5,533 $14,288 million 2,582,200 62.1% 69.1% 61.8%
All Minority Students 19.7% $4,058 $6,366 million 1,568,500 37.7% 30.8% 38.0%
Black or African-American 16.5% $4,354 $2,097 million 481,600 11.6% 10.1% 14.0%
Hispanic or Latino 21.3% $3,208 $2,021 million 630,000 15.1% 9.8% 14.1%
Asian 22.4% $5,279 $1,464 million 277,400 6.7% 7.1% 5.9%
American Indian or Alaska Native 15.3% $3,359 $90 million 26,900 0.6% 0.4% 0.8%
Native Hawaiian or Pacific Islander 23.3% $2,948 $104 million 35,200 0.8% 0.5% 0.7%
More Than One Race 23.7% $5,018 $589 million 117,400 2.8% 2.8% 2.4%
The next table shows the distribution of merit-based institutional grants according to race. Caucasian
students receive a disproportionately greater share of merit-based institutional grants, with Caucasian
students receiving 75.5% of merit-based institutional grants despite representing only 61.8% of the
student population. Minority students, on the other hand, receive 24.4% of merit-based institutional
grants, even though they represent 38.0% of the student population. Caucasian students are almost twice
as likely to receive institutional merit-based grants as minority students.21
Institutional Grants
Merit-Based Grants
Race
Percentage
Receiving
Grants
Average
Grant
Amount
Received
Total
Grant
Funding
Number
of
Grant
Recipients
Percentage
of
Grant
Recipients
Percentage
of Total
Grant
Funding
Percentage
of
Student
Population
Total 8.8% $5,347 $9,801 million 1,833,100 100.0% 100.0% 100.0%
White 10.7% $5,375 $7,438 million 1,383,900 75.5% 75.9% 61.8%
All Minority Students 5.6% $5,259 $2,352 million 447,300 24.4% 24.0% 38.0%
Black or African-American 5.9% $5,238 $896 million 171,100 9.3% 9.1% 14.0%
Hispanic or Latino 4.8% $4,839 $686 million 141,800 7.7% 7.0% 14.1%
Asian 5.8% $6,543 $472 million 72,100 3.9% 4.8% 5.9%
American Indian or Alaska Native 7.0% $3,909 $48 million 12,300 0.7% 0.5% 0.8%
Native Hawaiian or Pacific Islander 4.5% $4,587 $31 million 6,800 0.4% 0.3% 0.7%More Than One Race 8.7% $5,066 $219 million 43,200 2.4% 2.2% 2.4%
A 1994 study of race-exclusive scholarships by the U.S. Government Accountability Office (GAO) found
that only 5% of college-controlled scholarships awarded in 1991-92 were restricted to minority students,
2129.9% of Caucasian students with a combined SAT score (or equivalent ACT score) of 1400 or more out of 1600
received institutional merit-based grants, compared with 8.2% of African-American students, 19.8% of Latino
students, and 17.7% of Asian students.

7/31/2019 2011 Scholarships by Race
http://slidepdf.com/reader/full/2011-scholarships-by-race 10/19
- 10 -
representing 4% of college-controlled scholarship funding.22 Accordingly, minority-targeted grants
represent a very small share of institutional grants. The study was based on a nationally-representative
survey of 300 4-year colleges and universities.
The next table shows the distribution of need-based institutional grants according to race. Minority
students receive a higher share of need-based institutional grants (45.0% of need-based institutional grants
vs. 38.0% of the student population) because they are more likely to have lower income than Caucasian
students.
Institutional Grants
Need-Based Grants
Race
Percentage
Receiving
Grants
Average
Grant
Amount
Received
Total
Grant
Funding
Number
of
Grant
Recipients
Percentage
of
Grant
Recipients
Percentage
of Total
Grant
Funding
Percentage
of
Student
Population
Total 12.6% $3,539 $9,297 million 2,626,800 100.0% 100.0% 100.0%
White 11.1% $3,924 $5,642 million 1,437,700 54.7% 60.7% 61.8%
All Minority Students 14.9% $3,082 $3,640 million 1,180,900 45.0% 39.1% 38.0%
Black or African-American 10.8% $3,295 $1,043 million 316,600 12.1% 11.2% 14.0%
Hispanic or Latino 17.3% $2,375 $1,220 million 513,500 19.5% 13.1% 14.1%
Asian 17.9% $4,226 $936 million 221,500 8.4% 10.1% 5.9%
American Indian or Alaska Native 9.1% $2,512 $40 million 16,100 0.6% 0.4% 0.8%
Native Hawaiian or Pacific Islander 19.7% $2,200 $66 million 29,800 1.1% 0.7% 0.7%More Than One Race 16.8% $4,016 $335 million 83,400 3.2% 3.6% 2.4%
Opponents of affirmative action have targeted affirmative action policies at public colleges through
lawsuits in state courts and ballot initiatives. The next several tables explore differences in institutional
grants by control of institution for public, non-profit and for-profit colleges.
Public Colleges
The first table shows the distribution of institutional grants according to race at public colleges. Minority
students receive a higher share of institutional grant funding at public colleges, 43.3% of the institutional
grants vs. 37.0% of the student population. But this is largely due to differences in the distribution of
need-based and merit-based institutional grants at public colleges. Since public colleges are often thelowest-cost option available to low-income students, they tend to attract a greater share of low-income
students than non-profit colleges. Minority students are more likely to be in the low-income group than
Caucasian students.
Institutional Grants
Public Colleges
All Grants
Race
Percentage
Receiving
Grants
Average
Grant
Amount
Received
Total
Grant
Funding
Number
of
Grant
Recipients
Percentage
of
Grant
Recipients
Percentage
of Total
Grant
Funding
Percentage
of
Student
Population
Total 15.6% $2,445 $6,060 million 2,478,600 100.0% 100.0% 100.0%
White 14.0% $2,674 $3,735 million 1,396,800 56.4% 61.6% 62.7%
All Minority Students 18.3% $2,154 $2,314 million 1,074,200 43.3% 38.2% 37.0%
Black or African-American 14.8% $2,900 $894 million 308,100 12.4% 14.7% 13.1%
Hispanic or Latino 21.2% $1,559 $717 million 459,900 18.6% 11.8% 13.7%
Asian 18.8% $2,342 $442 million 188,600 7.6% 7.3% 6.3%
American Indian or Alaska Native 13.0% $2,184 $40 million 18,300 0.7% 0.7% 0.9%
Native Hawaiian or Pacific Islander 21.6% $1,429 $36 million 25,000 1.0% 0.6% 0.7%
More Than One Race 19.8% $2,499 $185 million 74,200 3.0% 3.1% 2.4%
22Linda G. Morra, Higher Education: Information on Minority-Targeted Scholarships, U.S. Government
Accountability Office (GAO), HEHS-94-77, January 14, 1994.
Summary: http://www.gao.gov/products/HEHS-94-77
Full Report: http://archive.gao.gov/t2pbat4/150617.pdf

7/31/2019 2011 Scholarships by Race
http://slidepdf.com/reader/full/2011-scholarships-by-race 11/19
- 11 -
The next table shows the distribution of institutional merit-based grants at public colleges. Caucasian
students receive a disproportionately greater share of these grants. Caucasian students represent 73.1% of
merit-based grant recipients, but only 62.7% of the student population at public colleges. Caucasian
students are more than one-and-a-half times as likely as minority students to receive a merit-based
scholarship at a public college. Caucasian students receive $2.0 billion in institutional merit-based grant
funding, more than double the $937 million received by minority students.Institutional Grants
Public Colleges
Merit-Based Grants
Race
Percentage
Receiving
Grants
Average
Grant
Amount
Received
Total
Grant
Funding
Number
of
Grant
Recipients
Percentage
of
Grant
Recipients
Percentage
of Total
Grant
Funding
Percentage
of
Student
Population
Total 5.3% $3,503 $2,965 million 846,400 100.0% 100.0% 100.0%
White 6.2% $3,269 $2,022 million 618,700 73.1% 68.2% 62.7%
All Minority Students 3.9% $4,133 $937 million 226,800 26.8% 16.6% 37.0%
Black or African-American 4.7% $5,075 $491 million 96,800 11.4% 7.2% 13.1%
Hispanic or Latino 3.0% $3,234 $212 million 65,700 7.8% 4.3% 13.7%
Asian 3.2% $4,032 $129 million 31,900 3.8% 0.7% 6.3%
American Indian or Alaska Native 5.5% $2,528 $20 million 7,800 0.9% NA 0.9%
Native Hawaiian or Pacific Islander 1.8% NA NA NA NA NA 0.7%
More Than One Race 6.0% $3,552 $80 million 22,500 2.7% 2.7% 2.4%
The next table shows the distribution of institutional need-based grants at public colleges. Minority
students are more likely to receive these grants than Caucasian students. Minority students represent
52.4% of institutional need-based grant recipients, but only 37.0% of the student population.
Institutional Grants
Public Colleges
Need-Based Grants
Race
Percentage
Receiving
Grants
Average
Grant
Amount
Received
Total
Grant
Funding
Number
of
Grant
Recipients
Percentage
of
Grant
Recipients
Percentage
of Total
Grant
Funding
Percentage
of
Student
Population
Total 10.1% $1,526 $2,453 million 1,607,000 100.0% 100.0% 100.0%
White 7.6% $1,662 $1,261 million 758,400 47.2% 51.4% 62.7%
All Minority Students 14.3% $1,408 $1,186 million 842,000 52.4% 48.3% 37.0%
Black or African-American 9.8% $1,584 $321 million 202,800 12.6% 13.1% 13.1%
Hispanic or Latino 18.2% $1,157 $458 million 395,800 24.6% 18.7% 13.7%
Asian 16.0% $1,792 $286 million 159,600 9.9% 11.7% 6.3%
American Indian or Alaska Native 7.9% $1,651 $18 million 11,100 0.7% 0.7% 0.9%
Native Hawaiian or Pacific Islander 18.5% $1,087 $23 million 21,400 1.3% 0.9% 0.7%
More Than One Race 13.6% $1,544 $79 million 51,200 3.2% 3.2% 2.4%
Non-Profit Colleges
The next table shows the distribution of institutional grants by race at non-profit colleges. Caucasian
students receive a disproportionately greater share of institutional grants at non-profit colleges. Caucasian
students receive almost three-quarters (72.7%) of institutional grants at non-profit colleges, but represent
only two-thirds (66.8%) of the student population.
Institutional Grants
Non-Profit Colleges
All GrantsRace
Percentage
ReceivingGrants
Average
Grant
AmountReceived
Total
GrantFunding
Number
of
GrantRecipients
Percentage
of
GrantRecipients
Percentage
of Total
GrantFunding
Percentage
of
StudentPopulation
Total 50.7% $9,345 $14,397 million 1,540,600 100.0% 100.0% 100.0%
White 55.2% $9,344 $10,466 million 1,120,100 72.7% 72.7% 66.8%
All Minority Students 41.9% $9,350 $3,909 million 418,100 27.1% 27.2% 32.9%
Black or African-American 37.4% $8,618 $1,140 million 132,300 8.6% 7.9% 11.7%
Hispanic or Latino 39.2% $8,592 $1,242 million 144,500 9.4% 8.6% 12.1%
Asian 50.4% $11,877 $1,017 million 85,600 5.6% 7.1% 5.6%
American Indian or Alaska Native 38.9% $6,594 $42 million 6,300 0.4% 0.3% 0.5%
Native Hawaiian or Pacific Islander 45.2% $6,863 $68 million 9,900 0.6% 0.5% 0.7%
More Than One Race 58.1% $10,154 $401 million 39,500 2.6% 2.8% 2.2%
7/31/2019 2011 Scholarships by Race
http://slidepdf.com/reader/full/2011-scholarships-by-race 12/19
- 12 -
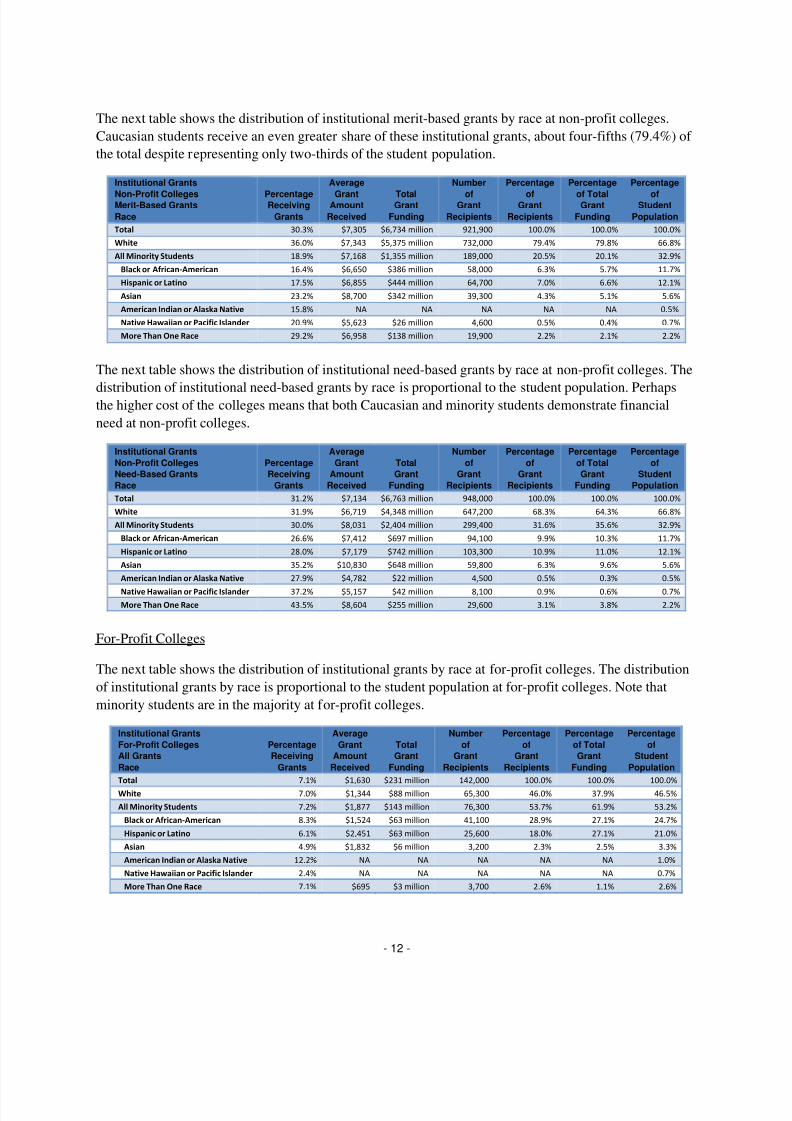
The next table shows the distribution of institutional merit-based grants by race at non-profit colleges.
Caucasian students receive an even greater share of these institutional grants, about four-fifths (79.4%) of
the total despite representing only two-thirds of the student population.
Institutional Grants
Non-Profit CollegesMerit-Based Grants
Race
PercentageReceiving
Grants
Average
GrantAmount
Received
TotalGrant
Funding
Number
ofGrant
Recipients
Percentage
ofGrant
Recipients
Percentage
of TotalGrant
Funding
Percentage
ofStudent
Population
Total 30.3% $7,305 $6,734 million 921,900 100.0% 100.0% 100.0%
White 36.0% $7,343 $5,375 million 732,000 79.4% 79.8% 66.8%
All Minority Students 18.9% $7,168 $1,355 million 189,000 20.5% 20.1% 32.9%
Black or African-American 16.4% $6,650 $386 million 58,000 6.3% 5.7% 11.7%
Hispanic or Latino 17.5% $6,855 $444 million 64,700 7.0% 6.6% 12.1%
Asian 23.2% $8,700 $342 million 39,300 4.3% 5.1% 5.6%
American Indian or Alaska Native 15.8% NA NA NA NA NA 0.5%
Native Hawaiian or Pacific Islander 20.9% $5,623 $26 million 4,600 0.5% 0.4% 0.7%
More Than One Race 29.2% $6,958 $138 million 19,900 2.2% 2.1% 2.2%
The next table shows the distribution of institutional need-based grants by race at non-profit colleges. The
distribution of institutional need-based grants by race is proportional to the student population. Perhapsthe higher cost of the colleges means that both Caucasian and minority students demonstrate financial
need at non-profit colleges.
Institutional Grants
Non-Profit Colleges
Need-Based Grants
Race
Percentage
Receiving
Grants
Average
Grant
Amount
Received
Total
Grant
Funding
Number
of
Grant
Recipients
Percentage
of
Grant
Recipients
Percentage
of Total
Grant
Funding
Percentage
of
Student
Population
Total 31.2% $7,134 $6,763 million 948,000 100.0% 100.0% 100.0%
White 31.9% $6,719 $4,348 million 647,200 68.3% 64.3% 66.8%
All Minority Students 30.0% $8,031 $2,404 million 299,400 31.6% 35.6% 32.9%
Black or African-American 26.6% $7,412 $697 million 94,100 9.9% 10.3% 11.7%
Hispanic or Latino 28.0% $7,179 $742 million 103,300 10.9% 11.0% 12.1%
Asian 35.2% $10,830 $648 million 59,800 6.3% 9.6% 5.6%
American Indian or Alaska Native 27.9% $4,782 $22 million 4,500 0.5% 0.3% 0.5%
Native Hawaiian or Pacific Islander 37.2% $5,157 $42 million 8,100 0.9% 0.6% 0.7%
More Than One Race 43.5% $8,604 $255 million 29,600 3.1% 3.8% 2.2%
For-Profit Colleges
The next table shows the distribution of institutional grants by race at for-profit colleges. The distribution
of institutional grants by race is proportional to the student population at for-profit colleges. Note that
minority students are in the majority at for-profit colleges.
Institutional Grants
For-Profit Colleges
All Grants
Race
Percentage
Receiving
Grants
Average
Grant
Amount
Received
Total
Grant
Funding
Number
of
Grant
Recipients
Percentage
of
Grant
Recipients
Percentage
of Total
Grant
Funding
Percentage
of
Student
Population
Total 7.1% $1,630 $231 million 142,000 100.0% 100.0% 100.0%
White 7.0% $1,344 $88 million 65,300 46.0% 37.9% 46.5%
All Minority Students 7.2% $1,877 $143 million 76,300 53.7% 61.9% 53.2%
Black or African-American 8.3% $1,524 $63 million 41,100 28.9% 27.1% 24.7%
Hispanic or Latino 6.1% $2,451 $63 million 25,600 18.0% 27.1% 21.0%
Asian 4.9% $1,832 $6 million 3,200 2.3% 2.5% 3.3%
American Indian or Alaska Native 12.2% NA NA NA NA NA 1.0%
Native Hawaiian or Pacific Islander 2.4% NA NA NA NA NA 0.7%
More Than One Race 7.1% $695 $3 million 3,700 2.6% 1.1% 2.6%
7/31/2019 2011 Scholarships by Race
http://slidepdf.com/reader/full/2011-scholarships-by-race 13/19
- 13 -
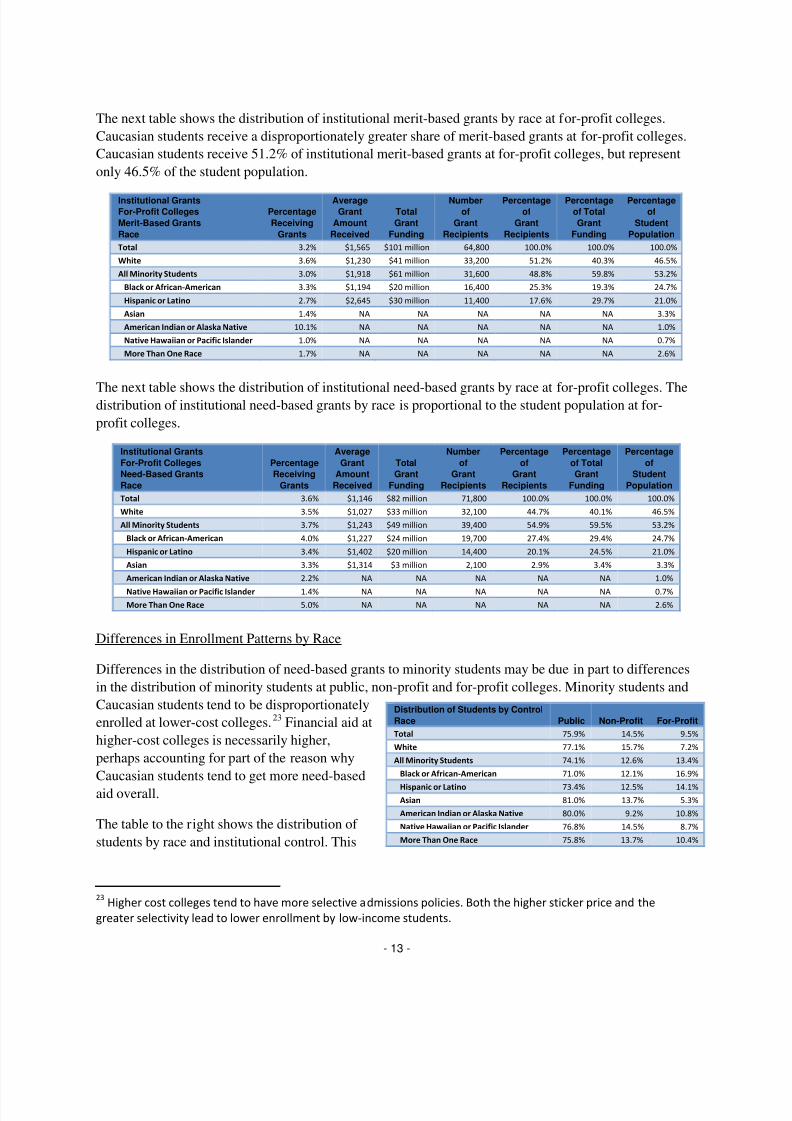
The next table shows the distribution of institutional merit-based grants by race at for-profit colleges.
Caucasian students receive a disproportionately greater share of merit-based grants at for-profit colleges.
Caucasian students receive 51.2% of institutional merit-based grants at for-profit colleges, but represent
only 46.5% of the student population.
Institutional Grants
For-Profit Colleges
Merit-Based Grants
Race
Percentage
Receiving
Grants
Average
Grant
Amount
Received
Total
Grant
Funding
Number
of
Grant
Recipients
Percentage
of
Grant
Recipients
Percentage
of Total
Grant
Funding
Percentage
of
Student
Population
Total 3.2% $1,565 $101 million 64,800 100.0% 100.0% 100.0%
White 3.6% $1,230 $41 million 33,200 51.2% 40.3% 46.5%
All Minority Students 3.0% $1,918 $61 million 31,600 48.8% 59.8% 53.2%
Black or African-American 3.3% $1,194 $20 million 16,400 25.3% 19.3% 24.7%
Hispanic or Latino 2.7% $2,645 $30 million 11,400 17.6% 29.7% 21.0%
Asian 1.4% NA NA NA NA NA 3.3%
American Indian or Alaska Native 10.1% NA NA NA NA NA 1.0%
Native Hawaiian or Pacific Islander 1.0% NA NA NA NA NA 0.7%
More Than One Race 1.7% NA NA NA NA NA 2.6%
The next table shows the distribution of institutional need-based grants by race at for-profit colleges. Thedistribution of institutional need-based grants by race is proportional to the student population at for-
profit colleges.
Institutional Grants
For-Profit Colleges
Need-Based Grants
Race
Percentage
Receiving
Grants
Average
Grant
Amount
Received
Total
Grant
Funding
Number
of
Grant
Recipients
Percentage
of
Grant
Recipients
Percentage
of Total
Grant
Funding
Percentage
of
Student
Population
Total 3.6% $1,146 $82 million 71,800 100.0% 100.0% 100.0%
White 3.5% $1,027 $33 million 32,100 44.7% 40.1% 46.5%
All Minority Students 3.7% $1,243 $49 million 39,400 54.9% 59.5% 53.2%
Black or African-American 4.0% $1,227 $24 million 19,700 27.4% 29.4% 24.7%
Hispanic or Latino 3.4% $1,402 $20 million 14,400 20.1% 24.5% 21.0%
Asian 3.3% $1,314 $3 million 2,100 2.9% 3.4% 3.3%
American Indian or Alaska Native 2.2% NA NA NA NA NA 1.0%
Native Hawaiian or Pacific Islander 1.4% NA NA NA NA NA 0.7%
More Than One Race 5.0% NA NA NA NA NA 2.6%
Differences in Enrollment Patterns by Race
Differences in the distribution of need-based grants to minority students may be due in part to differences
in the distribution of minority students at public, non-profit and for-profit colleges. Minority students and
Caucasian students tend to be disproportionately
enrolled at lower-cost colleges.23 Financial aid at
higher-cost colleges is necessarily higher,
perhaps accounting for part of the reason why
Caucasian students tend to get more need-based
aid overall.
The table to the right shows the distribution of
students by race and institutional control. This
23Higher cost colleges tend to have more selective admissions policies. Both the higher sticker price and the
greater selectivity lead to lower enrollment by low-income students.
Distribution of Students by Control
Race Public Non-Profit For-Profit
Total 75.9% 14.5% 9.5%
White 77.1% 15.7% 7.2%
All Minority Students 74.1% 12.6% 13.4%
Black or African-American 71.0% 12.1% 16.9%
Hispanic or Latino 73.4% 12.5% 14.1%
Asian 81.0% 13.7% 5.3%
American Indian or Alaska Native 80.0% 9.2% 10.8%
Native Hawaiian or Pacific Islander 76.8% 14.5% 8.7%
More Than One Race 75.8% 13.7% 10.4%
7/31/2019 2011 Scholarships by Race
http://slidepdf.com/reader/full/2011-scholarships-by-race 14/19
- 14 -
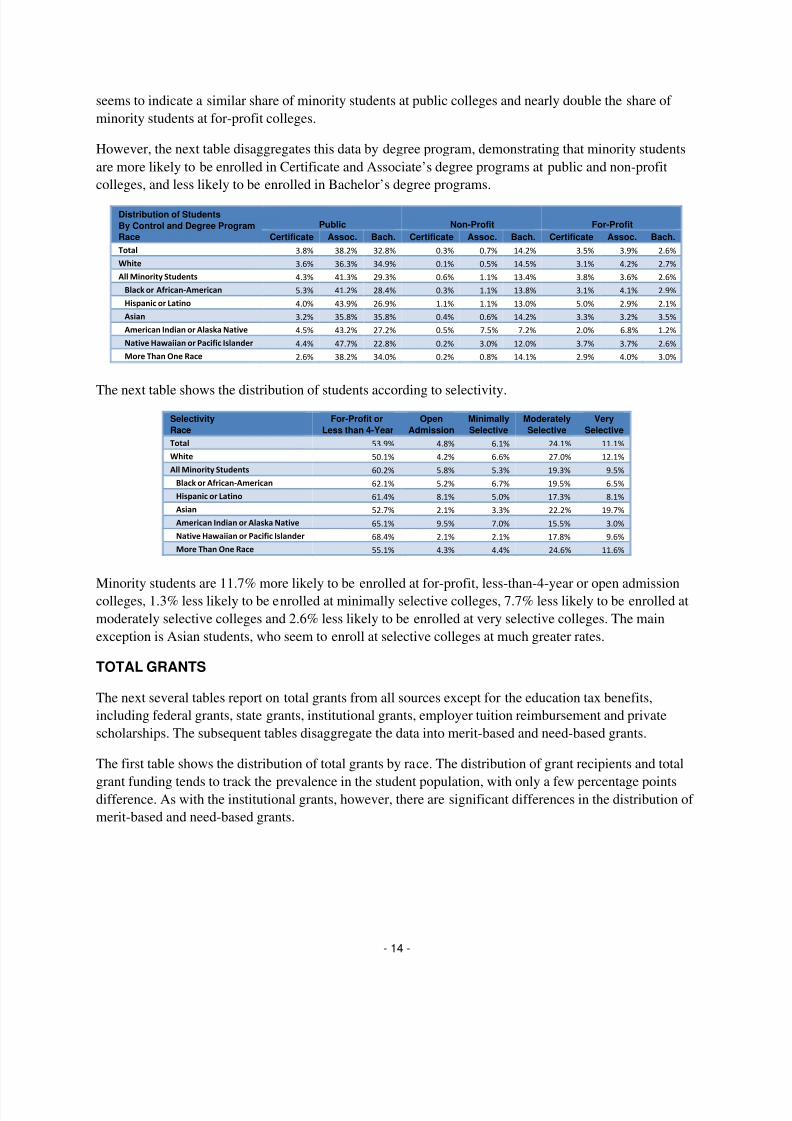
seems to indicate a similar share of minority students at public colleges and nearly double the share of
minority students at for-profit colleges.
However, the next table disaggregates this data by degree program, demonstrating that minority students
are more likely to be enrolled in Certificate and Associate’s degree programs at public and non-profit
colleges, and less likely to be enrolled in Bachelor’s degree programs.
Distribution of Students
By Control and Degree Program
Race
Public Non-Profit For-Profit
Certificate Assoc. Bach. Certificate Assoc. Bach. Certificate Assoc. Bach.
Total 3.8% 38.2% 32.8% 0.3% 0.7% 14.2% 3.5% 3.9% 2.6%
White 3.6% 36.3% 34.9% 0.1% 0.5% 14.5% 3.1% 4.2% 2.7%
All Minority Students 4.3% 41.3% 29.3% 0.6% 1.1% 13.4% 3.8% 3.6% 2.6%
Black or African-American 5.3% 41.2% 28.4% 0.3% 1.1% 13.8% 3.1% 4.1% 2.9%
Hispanic or Latino 4.0% 43.9% 26.9% 1.1% 1.1% 13.0% 5.0% 2.9% 2.1%
Asian 3.2% 35.8% 35.8% 0.4% 0.6% 14.2% 3.3% 3.2% 3.5%
American Indian or Alaska Native 4.5% 43.2% 27.2% 0.5% 7.5% 7.2% 2.0% 6.8% 1.2%
Native Hawaiian or Pacific Islander 4.4% 47.7% 22.8% 0.2% 3.0% 12.0% 3.7% 3.7% 2.6%
More Than One Race 2.6% 38.2% 34.0% 0.2% 0.8% 14.1% 2.9% 4.0% 3.0%
The next table shows the distribution of students according to selectivity.
Selectivity
Race
For-Profit or
Less than 4-Year
Open
Admission
Minimally
Selective
Moderately
Selective
Very
Selective
Total 53.9% 4.8% 6.1% 24.1% 11.1%
White 50.1% 4.2% 6.6% 27.0% 12.1%
All Minority Students 60.2% 5.8% 5.3% 19.3% 9.5%
Black or African-American 62.1% 5.2% 6.7% 19.5% 6.5%
Hispanic or Latino 61.4% 8.1% 5.0% 17.3% 8.1%
Asian 52.7% 2.1% 3.3% 22.2% 19.7%
American Indian or Alaska Native 65.1% 9.5% 7.0% 15.5% 3.0%
Native Hawaiian or Pacific Islander 68.4% 2.1% 2.1% 17.8% 9.6%
More Than One Race 55.1% 4.3% 4.4% 24.6% 11.6%
Minority students are 11.7% more likely to be enrolled at for-profit, less-than-4-year or open admissioncolleges, 1.3% less likely to be enrolled at minimally selective colleges, 7.7% less likely to be enrolled at
moderately selective colleges and 2.6% less likely to be enrolled at very selective colleges. The main
exception is Asian students, who seem to enroll at selective colleges at much greater rates.
TOTAL GRANTS
The next several tables report on total grants from all sources except for the education tax benefits,
including federal grants, state grants, institutional grants, employer tuition reimbursement and private
scholarships. The subsequent tables disaggregate the data into merit-based and need-based grants.
The first table shows the distribution of total grants by race. The distribution of grant recipients and total
grant funding tends to track the prevalence in the student population, with only a few percentage pointsdifference. As with the institutional grants, however, there are significant differences in the distribution of
merit-based and need-based grants.

7/31/2019 2011 Scholarships by Race
http://slidepdf.com/reader/full/2011-scholarships-by-race 15/19
- 15 -
Total Grants
All Grants
Race
Percentage
Receiving
Grants
Average
Grant
Amount
Received
Total
Grant
Funding
Number
of
Grant
Recipients
Percentage
of
Grant
Recipients
Percentage
of Total
Grant
Funding
Percentage
of
Student
Population
Total 51.7% $4,864 $52,646 million 10,822,900 100.0% 100.0% 100.0%
White 48.2% $5,008 $31,230 million 6,235,700 57.6% 59.3% 61.8%
All Minority Students 57.4% $4,672 $21,287 million 4,556,300 42.1% 40.4% 38.0%
Black or African-American 63.5% $4,372 $8,113 million 1,855,800 17.1% 15.4% 14.0%
Hispanic or Latino 58.1% $4,314 $7,425 million 1,720,900 15.9% 14.1% 14.1%
Asian 43.1% $6,444 $3,430 million 532,200 4.9% 6.5% 5.9%
American Indian or Alaska Native 60.4% $4,327 $461 million 106,600 1.0% 0.9% 0.8%
Native Hawaiian or Pacific Islander 49.3% $4,097 $305 million 74,500 0.7% 0.6% 0.7%
More Than One Race 53.8% $5,831 $1,553 million 266,300 2.5% 2.9% 2.4%
The next table shows the distribution of total merit-based grants by race. Caucasian students receive a
disproportionately greater share of total merit-based grants. Caucasian students represent 73.6% of merit-
based grant recipients but only 61.8% of the student population. Minority students represent 26.2% of
merit-based grant recipients, but only 38.0% of the student population.
Total Grants
Merit-Based Grants
Race
Percentage
ReceivingGrants
Average
Grant
AmountReceived
Total
GrantFunding
Number
of
GrantRecipients
Percentage
of
GrantRecipients
Percentage
of Total
GrantFunding
Percentage
of
StudentPopulation
Total 12.0% $4,646 $11,698 million 2,517,700 100.0% 100.0% 100.0%
White 14.3% $4,774 $8,845 million 1,853,000 73.6% 75.6% 61.8%
All Minority Students 8.3% $4,296 $2,838 million 660,700 26.2% 24.3% 38.0%
Black or African-American 9.5% $3,982 $1,107 million 278,100 11.0% 9.5% 14.0%
Hispanic or Latino 6.9% $4,092 $835 million 204,100 8.1% 7.1% 14.1%
Asian 7.8% $5,613 $542 million 96,500 3.8% 4.6% 5.9%
American Indian or Alaska Native 8.9% $3,375 $53 million 15,600 0.6% 0.5% 0.8%
Native Hawaiian or Pacific Islander 5.6% $4,636 $39 million 8,400 0.3% 0.3% 0.7%
More Than One Race 11.7% $4,525 $262 million 58,000 2.3% 2.2% 2.4%
The following pie chart shows the distribution of total merit-based grants by race, demonstrating that
Caucasian students receive a disproportionately greater share of all merit-based grant funding, about
three-quarters of merit-based grant funding.
White
75.7%
Black or African
American
9.5%
Hispanic or Latino
7.1%
Asian
4.6%
American
Indian orAlaska
Native
0.5%Native
Hawaiian or
Pacific
Islander
0.3%
More than
one race
2.2%
Distribution of Total Merit-Based Grants
by Race, 2007-08
7/31/2019 2011 Scholarships by Race
http://slidepdf.com/reader/full/2011-scholarships-by-race 16/19
- 16 -
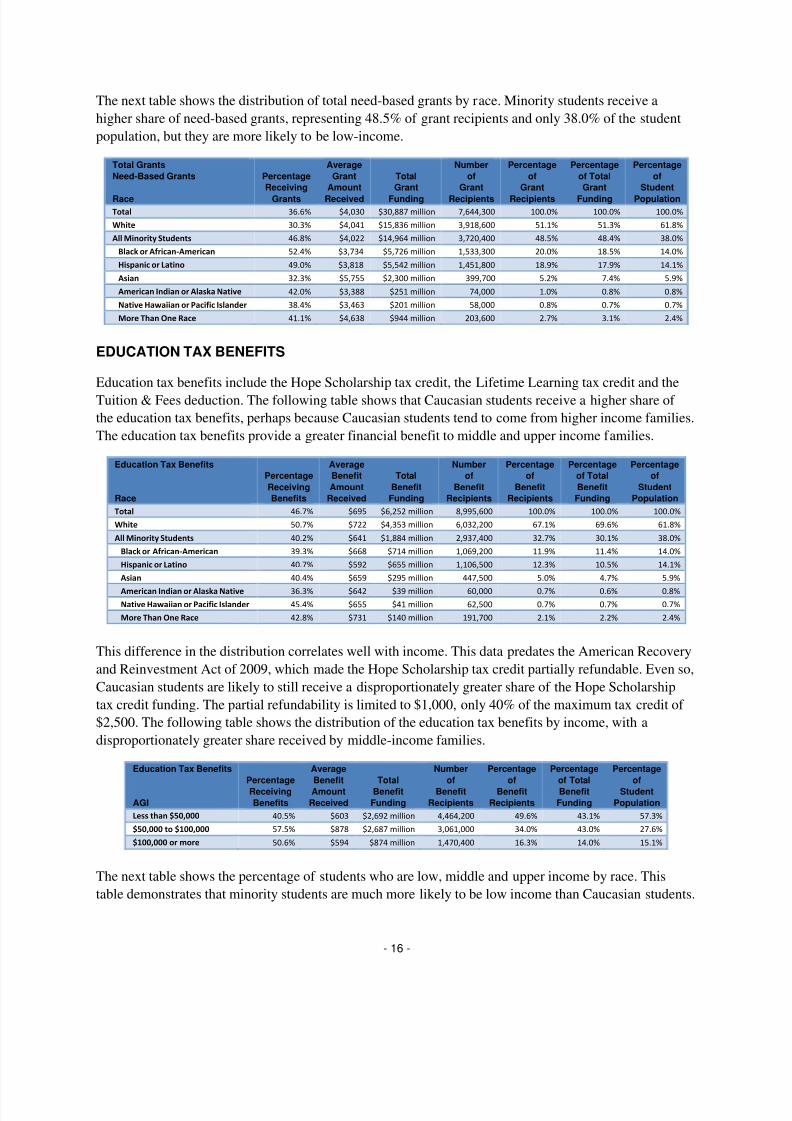
The next table shows the distribution of total need-based grants by race. Minority students receive a
higher share of need-based grants, representing 48.5% of grant recipients and only 38.0% of the student
population, but they are more likely to be low-income.
Total Grants
Need-Based Grants
Race
Percentage
Receiving
Grants
Average
Grant
Amount
Received
Total
Grant
Funding
Number
of
Grant
Recipients
Percentage
of
Grant
Recipients
Percentage
of Total
Grant
Funding
Percentage
of
Student
Population
Total 36.6% $4,030 $30,887 million 7,644,300 100.0% 100.0% 100.0%
White 30.3% $4,041 $15,836 million 3,918,600 51.1% 51.3% 61.8%
All Minority Students 46.8% $4,022 $14,964 million 3,720,400 48.5% 48.4% 38.0%
Black or African-American 52.4% $3,734 $5,726 million 1,533,300 20.0% 18.5% 14.0%
Hispanic or Latino 49.0% $3,818 $5,542 million 1,451,800 18.9% 17.9% 14.1%
Asian 32.3% $5,755 $2,300 million 399,700 5.2% 7.4% 5.9%
American Indian or Alaska Native 42.0% $3,388 $251 million 74,000 1.0% 0.8% 0.8%
Native Hawaiian or Pacific Islander 38.4% $3,463 $201 million 58,000 0.8% 0.7% 0.7%
More Than One Race 41.1% $4,638 $944 million 203,600 2.7% 3.1% 2.4%
EDUCATION TAX BENEFITS
Education tax benefits include the Hope Scholarship tax credit, the Lifetime Learning tax credit and the
Tuition & Fees deduction. The following table shows that Caucasian students receive a higher share of
the education tax benefits, perhaps because Caucasian students tend to come from higher income families.
The education tax benefits provide a greater financial benefit to middle and upper income families.
Education Tax Benefits
Race
Percentage
Receiving
Benefits
Average
Benefit
Amount
Received
Total
Benefit
Funding
Number
of
Benefit
Recipients
Percentage
of
Benefit
Recipients
Percentage
of Total
Benefit
Funding
Percentage
of
Student
Population
Total 46.7% $695 $6,252 million 8,995,600 100.0% 100.0% 100.0%
White 50.7% $722 $4,353 million 6,032,200 67.1% 69.6% 61.8%
All Minority Students 40.2% $641 $1,884 million 2,937,400 32.7% 30.1% 38.0%
Black or African-American 39.3% $668 $714 million 1,069,200 11.9% 11.4% 14.0%
Hispanic or Latino 40.7% $592 $655 million 1,106,500 12.3% 10.5% 14.1%
Asian 40.4% $659 $295 million 447,500 5.0% 4.7% 5.9%
American Indian or Alaska Native 36.3% $642 $39 million 60,000 0.7% 0.6% 0.8%
Native Hawaiian or Pacific Islander 45.4% $655 $41 million 62,500 0.7% 0.7% 0.7%
More Than One Race 42.8% $731 $140 million 191,700 2.1% 2.2% 2.4%
This difference in the distribution correlates well with income. This data predates the American Recovery
and Reinvestment Act of 2009, which made the Hope Scholarship tax credit partially refundable. Even so,
Caucasian students are likely to still receive a disproportionately greater share of the Hope Scholarship
tax credit funding. The partial refundability is limited to $1,000, only 40% of the maximum tax credit of
$2,500. The following table shows the distribution of the education tax benefits by income, with a
disproportionately greater share received by middle-income families.
Education Tax Benefits
AGI
Percentage
Receiving
Benefits
Average
Benefit
Amount
Received
Total
Benefit
Funding
Number
of
Benefit
Recipients
Percentage
of
Benefit
Recipients
Percentage
of Total
Benefit
Funding
Percentage
of
Student
Population
Less than $50,000 40.5% $603 $2,692 million 4,464,200 49.6% 43.1% 57.3%
$50,000 to $100,000 57.5% $878 $2,687 million 3,061,000 34.0% 43.0% 27.6%
$100,000 or more 50.6% $594 $874 million 1,470,400 16.3% 14.0% 15.1%
The next table shows the percentage of students who are low, middle and upper income by race. This
table demonstrates that minority students are much more likely to be low income than Caucasian students.

7/31/2019 2011 Scholarships by Race
http://slidepdf.com/reader/full/2011-scholarships-by-race 17/19
- 17 -
Distribution of Students
By Adjusted Gross Income
Race
Percentage
with AGI
Less than
$50,000
Percentage
with AGI
$50,000
to
$100,000
Percentage
with AGI
$100,000
or
More
Total 56.9% 27.7% 15.4%
White 48.2% 32.0% 19.9%
All Minority Students 71.2% 20.8% 8.0%
Black or African-American 77.4% 17.5% 5.2%
Hispanic or Latino 71.2% 20.9% 7.9%
Asian 61.3% 25.7% 12.9%
American Indian or Alaska Native 67.2% 24.4% 8.3%
Native Hawaiian or Pacific Islander 64.3% 25.0% 10.7%
More Than One Race 62.2% 25.0% 12.9%
GRADUATE AND PROFESSIONAL STUDENTS
Funding for graduate and professional students tends to be distributed in proportion to the student
population, in part because most graduate and professional students demonstrate financial need and in
part because graduate and professional students have also demonstrated academic merit to satisfy theadmissions criteria.
The first table shows the distribution of private fellowships to graduate and professional students by race.
Private Grants
Race
Percentage
Receiving
Grants
Average
Grant
Amount
Received
Total
Grant
Funding
Number
of
Grant
Recipients
Percentage
of
Grant
Recipients
Percentage
of Total
Grant
Funding
Percentage
of
Student
Population
Total 3.7% $5,797 $736 million 127,000 100.0% 100.0% 100.0%
White 3.3% $4,989 $382 million 76,600 60.3% 51.9% 66.6%
All Minority Students 4.4% $7,065 $353 million 49,900 39.3% 47.9% 33.1%
Black or African-American 4.0% $5,828 $96 million 16,400 12.9% 13.0% 11.7%
Hispanic or Latino 4.9% $7,601 $103 million 13,600 10.7% 14.0% 8.0%
Asian 3.9% $7,593 $112 million 14,700 11.6% 15.2% 10.8%
American Indian or Alaska Native 18.7% NA NA NA NA NA 0.3%
Native Hawaiian or Pacific Islander 1.2% NA NA NA NA NA 0.3%
More Than One Race 4.6% NA NA NA NA NA 2.1%
The next table shows the distribution of institutional grants to graduate and professional students by race.
Institutional Grants
Race
Percentage
Receiving
Grants
Average
Grant
Amount
Received
Total
Grant
Funding
Number
of
Grant
Recipients
Percentage
of
Grant
Recipients
Percentage
of Total
Grant
Funding
Percentage
of
Student
Population
Total 19.2% $8,835 $5,866 million 664,000 100.0% 100.0% 100.0%
White 18.5% $8,311 $3,537 million 425,600 64.1% 60.3% 66.6%
All Minority Students 20.7% $9,761 $2,312 million 236,900 35.7% 39.4% 33.1%
Black or African-American 12.8% $7,520 $389 million 51,700 7.8% 6.6% 11.7%
Hispanic or Latino 20.9% $10,528 $607 million 57,700 8.7% 10.4% 8.0%Asian 29.0% $10,502 $1,140 million 108,600 16.4% 19.4% 10.8%
American Indian or Alaska Native 22.9% NA NA NA NA NA 0.3%
Native Hawaiian or Pacific Islander 27.3% NA NA NA NA NA 0.3%
More Than One Race 20.1% $9,440 $136 million 14,400 2.2% 2.3% 2.1%

7/31/2019 2011 Scholarships by Race
http://slidepdf.com/reader/full/2011-scholarships-by-race 18/19
- 18 -
The next table shows the distribution of total grants to graduate and professional students by race.
Total Grants
Race
Percentage
Receiving
Grants
Average
Grant
Amount
Received
Total
Grant
Funding
Number
of
Grant
Recipients
Percentage
of
Grant
Recipients
Percentage
of Total
Grant
Funding
Percentage
of
Student
PopulationTotal 41.1% $7,518 $10,687 million 1,421,500 100.0% 100.0% 100.0%
White 41.4% $6,896 $6,580 million 954,100 67.1% 61.6% 66.6%
All Minority Students 40.6% $8,790 $4,085 million 464,700 32.7% 38.2% 33.1%
Black or African-American 32.8% $7,458 $991 million 132,900 9.3% 9.3% 11.7%
Hispanic or Latino 41.9% $8,577 $991 million 115,500 8.1% 9.3% 8.0%
Asian 47.9% $9,999 $1,796 million 179,600 12.6% 16.8% 10.8%
American Indian or Alaska Native 36.1% NA NA NA NA NA 0.3%
Native Hawaiian or Pacific Islander 52.2% NA NA NA NA NA 0.3%
More Than One Race 40.0% $7,917 $226 million 28,600 2.0% 2.1% 2.1%
Notice that in each of the three tables there was a close correlation between the distribution of grants and
the prevalence of each race in the student population.
GROWTH IN FUNDING BY RACE
The following table shows the growth in mean grants for private scholarships, institutional grants and
total grants by race from 2003-04 to 2007-08. Mean grants are the ratio of total grant funding divided by
the total student enrollments. There has been more growth in mean private scholarships among Caucasian
students than minority students during this four year period. Mean institutional grants have also grown
faster among minority students. However, mean total grants have grown faster among Caucasian students
than minority students, causing the disparity in grant funding by race to widen.
Growth in Mean Grants
2003-04 to 2007-08
Race
Private Scholarships Institutional Grants Total Grants
2003-04 2007-08 Change 2003-04 2007-08 Change 2003-04 2007-08 Change
Total $133 $139 4.6% $750 $989 31.8% $2,047 $2,516 22.9%
White $138 $146 6.0% $841 $1,106 31.4% $1,938 $2,416 24.7%
All Minority Students $124 $127 2.6% $596 $801 34.4% $2,238 $2,680 19.8%
Black or African-American $122 $118 -3.3% $596 $717 20.3% $2,478 $2,774 11.9%
Hispanic or Latino $101 $80 -20.8% $476 $683 43.5% $2,046 $2,508 22.6%
Asian $122 $150 23.5% $853 $1,185 38.9% $2,201 $2,776 26.1%
American Indian or Alaska Native $307 $317 3.2% $471 $513 8.9% $2,116 $2,615 23.6%
Native Hawaiian or Pacific Islander $77 $200 159.5% $527 $688 30.5% $1,541 $2,020 31.1%
More Than One Race $218 $315 44.6% $755 $1,190 57.8% $2,130 $3,138 47.3%
ANALYSIS
These statistics demonstrate that, as a whole, private sector scholarship programs tend to perpetuate
historical inequities in the distribution of scholarships according to race. This does not appear to be due to
deliberate discrimination, but rather as a natural result of the personal interests of the scholarshipsponsors. Scholarship sponsors tend to establish scholarships that select for characteristics, activities and
talents of interest to them. These factors, in turn, tend to resonate with students of the same racial
background as the sponsor. For example, African-American students are much less likely to participate in
equestrian sports (horseback riding, polo, rodeo), water sports (scuba diving, sailing, surfing, swimming,
crew, water polo) and winter sports (ice hockey, skiing, snowboarding, figure skating) than Caucasian
students. They are much more likely to pursue basketball, track & field, handball and football. The
sponsors of rodeo scholarships aren’t motivated by a desire to indirectly discriminate against minority

7/31/2019 2011 Scholarships by Race
http://slidepdf.com/reader/full/2011-scholarships-by-race 19/19
- 19 -
students; they just like to promote rodeo. But the net result is that private scholarships as a whole
disproportionately select for Caucasian students. Similarly, golf, archery, cycling, weight lifting and
wrestling scholarships tend to implicitly select for Caucasian students.
Other characteristics that tend to naturally differentiate students and available scholarships according to
race include the following.
• National Origin or Heritage. There are a variety of scholarships restricted to students of
particular ethnicities that are predominantly or exclusively Caucasian, such as students of
Croatian, Czech, Danish, Dutch, French Canadian, German, Greek, Hungarian, Irish, Italian,
Jewish, Lithuanian, Norwegian, Polish, Romanian, Russian, Scandinavian, Scottish, Serbian,
Slavic, Slovak, Swedish, Swiss, Ukrainian and Welsh heritage.
• Geography. The racial distribution varies by state. Students from Idaho, Iowa, Maine, New
Hampshire, North Dakota, Vermont, West Virginia and Wyoming are disproportionately likely to
be Caucasian while Caucasian students from California, Georgia, Hawaii, Maryland, New
Mexico, Texas and Washington DC are no longer in the majority. African-American students are
more likely to come from Washington DC, Georgia, Maryland, Mississippi, Louisiana, SouthCarolina, Alabama, North Carolina and Virginia, and less likely to come from Montana, Idaho,
South Dakota, Wyoming, Utah, North Dakota, Maine, New Hampshire, Vermont, Oregon, New
Mexico and Iowa.
• Field of Study. African-American students are more likely to pursue majors in black studies,
urban studies, petroleum engineering, cosmetology and public administration, and less likely to
pursue the physical sciences, economics, conservation, forestry, horticulture, gerontology and
education. The opposite is true of Caucasian students. Students majoring in Latin American
Studies, Hispanic Studies, and Spanish Language Teacher Education are more likely to be Latino
than Caucasian. Latino students also tend to major in Business, Architecture, Criminal Justice,
Fashion Modeling and Culinary Arts.
• Religion. African-American students are more likely to be Methodist, Episcopalian, Pentecostal,
Seventh-day Adventist, Baptist and Muslim and are less likely to be Presbyterian, Roman
Catholic, Wiccan, Lutheran, Jewish, Mormon or Hindu. Latino students are more likely to be
Roman Catholic. Religions where the majority of students are Caucasian include Lutheran,
Jewish, Greek Orthodox, Mennonite, Mormon, Methodist, Presbyterian, Episcopalian, Wiccan,
United Church of Christ and Quaker. Religions where the majority of students are not Caucasian
include Hindu, Methodist, Episcopalian, Muslim, Jehovah's Witness, Seventh-day Adventist,
Buddhist, Pentecostal, Church of God and Baha'i.
Overall, merit-based grants tend to disproportionately select for Caucasian students. This is compensated
somewhat by the distribution of need-based grants according to race, since minority students tend to beless affluent than Caucasian students. Shifting funding from merit-based grants to need-based grants will
yield more balance in the distribution of grants according to race, but it will not entirely compensate for
private scholarships that collectively demonstrate implicit preferences for Caucasian students.