2011-2040 Regional Transportation Plan - WordPress.com · 2011-2040 Regional Transportation Plan...
46
1 2011-2040 Regional Transportation Plan Dixie Metropolitan Planning Organization June 1, 2011 Prepared by: The Dixie Transportation Planning Office Five County Association of Governments 1070 West 1600 South, Building B St. George, UT 84770
Transcript of 2011-2040 Regional Transportation Plan - WordPress.com · 2011-2040 Regional Transportation Plan...
1
2011-2040
Regional Transportation Plan
Dixie Metropolitan Planning Organization June 1, 2011
Prepared by:
The Dixie Transportation Planning Office
Five County Association of Governments
1070 West 1600 South, Building B
St. George, UT 84770

2
TABLE OF CONTENTS
CHAPTER 1 – EXECUTIVE SUMMARY ............................................................................................................... 3
CHAPTER 2 – PURPOSE AND NEED .................................................................................................................... 4
CHAPTER 3 – VISION AND MISSION ................................................................................................................... 5
CHAPTER 4 – PROJECTED TRANSPORTATION DEMAND ........................................................................... 7
CHAPTER 5 – FINANCIAL PLAN .......................................................................................................................... 9
CHAPTER 6 – EXISTING AND PROPOSED TRANSPORTATION FACILITIES ......................................... 12
CHAPTER 7 – SAFETY MANAGEMENT (SECURITY) .................................................................................... 18
CHAPTER 8 – SECURITY ...................................................................................................................................... 23
CHAPTER 9 – CONGESTION MANAGEMENT ................................................................................................. 24
CHAPTER 10 – CORRIDOR PRESERVATION .................................................................................................. 27
CHAPTER 11 – ENVIRONMENTAL MITIGATION .......................................................................................... 28
CHAPTER 12 – PEDESTRIAN/BICYCLE FACILITIES .................................................................................... 35
CHAPTER 13 – TRANSIT ACTIVITIES ............................................................................................................... 37
CHAPTER 14 – PUBLIC INVOLVEMENT .......................................................................................................... 39
APPENDIX A – .......................................................................................................................................................... 43
APPENDIX B ............................................................................................................................................................. 45
MAPS .......................................................................................................................................................................... 46
Projects and Phasing
Generalized Land Use
Planning Boundary with Ownership Type
2040 Population Density
2010-2040 Population Change
2010-2040 Employment Change
2009 Traffic Crashes
Traffic Congestion 2040 No-Build
Traffic Congestion 2040 Build
Bicycle Trails
WCBAG Trails Request
Transit Service
Functional Classification

3
Chapter 1 – Executive Summary
This Regional Transportation Plan is the culmination of efforts undertaken by Dixie Metropolitan
Planning Organization (MPO) for the Census Bureaus‘ designated St. George Urbanized Area of
Washington County, Utah. – covering areas of Ivins, Santa Clara, St. George, and Washington
The plan is updated every four years in coordination with the
Utah Department of Transportation, three other MPOs in Utah,
and the government entities of Washington County, Ivins, Santa
Clara, St. George, and Washington City. Transportation planning
in Washington County intends to follow local visioning goals in
collaboration with other planning efforts such as Vision Dixie,
the Utah Strategic Highway Safety Plan, Homeland Security
plans, etc.
The cities of Hurricane, LaVerkin, and Toquerville anticipate an
urban designation near 2022, and are therefore included in the
planning boundary map on page 5.
This plan relies on principals defined in Vision Dixie, a
visioning effort undertaken in 2006-08 to document the vision of Dixie‘s desired future development as
defined by the public, elected officials, public service agencies, business interests, and other
socioeconomic forces. From a transportation perspective, Vision Dixie calls for a variety of roads, transit,
and pedestrian facilities, community connectivity and access to a greater variety of human services,
businesses, and residential units.
Projected transportation demand in the St. George area was modeled using the best available computer
programs and verifies the Vision Dixie call for a variety of future transportation facilities.
Limited amounts of federal, state, and local funds are available to accommodate these needs, and revenue
streams will need to be incrementally increased and changed over time to generate sufficient resources
and accommodate societal changes in fuel efficiencies and fuel type choices. The funding sources and
future funding assumptions are explained in Chapter 5.
A summary of proposed transportation facilities, including a comprehensive list of road improvements
over the next 30 years is noted and mapped out in Chapter 5. Exceptional evidence also points to the need
for expanded regional transit systems throughout the Urbanized Area.
Special attention must be given to safety, congestion, corridor preservation, and pedestrian facilities over
the next 30 years. And of utmost importance is affording appropriate environmental protections to the
varied ―threatened and endangered species‖ (plant and animal) present in southwestern Utah.
4
Chapter 2 – Purpose and Need
According to the 2010 U.S. Census, the Dixie MPO population is 104,414. According to the Utah
Governor‘s Office of Planning and Budget (GOPB), the Dixie MPO population is expected to grow to
over 170,000 by 2020; to over 250,000 by 2030; and to 400,000 by 2040.
This 2011-2040 Regional Long-Range Transportation Plan outlines how various jurisdictions within the
MPO intend to meet the area‘s transportation demands and needs over the next 30 years. The area is also
habitat to threatened and endangered plant and wildlife species and is governed by state and federal
regulations.
The Dixie MPO, as defined by the U.S. Census Bureau, consists of the urbanized areas of Ivins, Santa
Clara, St. George, and Washington cities and immediately adjacent sections of unincorporated
Washington County in southwestern Utah. An adjacent Rural Planning Organization (RPO) services the
transportation planning needs of Hurricane, La Verkin, Toquerville, and Leeds – in close coordination
with the MPO. These RPO cities anticipate an urban designation within the 30-year window of this plan
and are therefore included in the planning boundary map on the following page.
The Dixie MPO was designated by the Governor September 20, 2002, and is called the Dixie MPO. In
compliance with federal guidelines the MPO develops and approves processes and procedures for
conducting long range planning, identifying proposed transportation projects for consideration in the
Transportation Improvement Program (TIP) and social, economic and environmental implications of the
regional transportation system and the traffic growth being experienced and anticipated in the future.
On August 10, 2005, the President of the United States signed the Safe, Accountable, Flexible, Efficient
Transportation Equity Act—A Legacy for Users (SAFETEA-LU) into law. The $286.4 billion law
reauthorized federal surface transportation programs through 2009 – and persisted through 2011 through
continuing resolutions. Reauthorization of a similar transportation bill is anticipated soon, but not in time
for consideration in this plan.
SAFETEA-LU made a number of changes to the transportation planning process, including timetables for
updates to transportation improvement programs and long-range transportation plans with a special focus
on safety and security, and requirements for public participation. The law also includes important transit
and environmental elements, created four transit programs and sets provisions for air quality and the
protection of historic and natural resources.
Common to SAFETEA-LU and previous Acts, is the consideration in the planning process of broad based
requirements or issues. SAFETEA-LU identifies the following eight:
1. Supporting the economic vitality of the metropolitan area, especially by enabling global
competitiveness, productivity, and efficiency.
2. Increasing the safety of the transportation system for motorized and non-motorized users.
3. Increasing the security of the transportation system for motorized and non-motorized users.
4. Increasing the accessibility and mobility options available to people and for freight.
5. Protecting and enhancing the environment, promoting energy conservation, and improving the
quality of life.
6. Enhancing the integration and connectivity of the transportation system, across modes and
between modes, for people and freight.
7. Promoting efficient system management and operation.
8. Emphasizing the preservation of the existing transportation system.

5
Chapter 3 – Vision and Mission
The mission of transportation planning in Washington County
is to follow local visioning goals while collaborating with other
planning efforts such as the statewide Strategic Highway Safety
Plan as discussed in Chapter 7, and the Homeland Security
plans noted in Chapter 8.
Through ―Vision Dixie‖, over three thousand residents created
a framework in which future development and transportation
can work together to create communities, and a region that
reserves Southern Utah‘s quality of life. The ―Vision‖ looks
forward to an affordable, sustainable, and livable future.
The public preferences are summarized in a series of Vision
Dixie Principles and in a Vision scenario – a picture that
illustrates one way growth might occur if cooperative efforts
adopt the principles that were identified through the process. The Vision Dixie Principles provide a
framework for voluntary implementation. Local officials have committed to work with residents to
determine how these principles fit with local plans for the future.
The ―Vision‖ process was kicked off on October 18, 2006 when nearly 400 residents joined the
Washington County Commission in a county wide process of workshops, technical research and analysis.
Over 1,200 residents attended workshops in the fall of 2006 to voice their preferences for how the county
should grow. This input coupled with technical guidance from local planners, led to the creation of four
scenarios that were unveiled in May and June 2007 at nine ―Dixie Dialogue‖ meetings. More than 500
residents attended these meetings to identify which ideas, contained in the scenarios, they favor. An
additional 800 residents evaluated these scenarios on-line. Also in June 2007, an independent polling firm
contacted 400 representative county residents to ask their opinions on growth issues and strategies.
Based on these citizen input initiatives, a steering committee made up of mayors from throughout the
urbanizing area, established ten Vision Dixie Principles.
Principles 5-8 state:
Principle 5 – Build balanced transportation that includes a system of public transportation, connected
roads and meaningful opportunities to bike and walk.
Principle 6 – Get ―Centered‖ by focusing growth on walk-able, mixed-use centers.
Principle 7 – Direct growth inward.
Principle 8 – Provide a broad range of housing types to meet the needs of all income levels, family
types, and stages of life.
Because of (unique) geography, roads in Dixie have to accommodate more traffic and are susceptible to
congestion. Thus, while auto use will continue to be dominant, roads will not be able to meet all our
mobility needs decades into the future. Public transportation is especially important to keep us from being
overwhelmed by gridlock. Putting in place a transit backbone will help our downtowns, major centers,
and Dixie College flourish, keep our air clean, and help reduce household expenses associated with day-
to-day travel. (Vision Dixie 2035: Land-Use & Transportation Vision, p. 26)

6
A vibrant ―center‖ includes multiple ingredients: a mix of uses, pedestrian-oriented buildings, focused
density, connected streets, and context sensitive streets. (Vision Dixie 2035: Land-Use & Transportation
Vision, p. 31)
Vision Dixie calls for corridor preservation for roads and transit, street connectivity, and the creation of
community-friendly collector and arterial roads with the following long-term recommendations:
Work together to identify and preserve transit
corridors and potential station locations.
Explore the creation of a transit district and a
local option sales tax for transit.
Adopt the road corridors of Utah Department
of Transportation, DMPO, and Five County
Association of Governments into general plan
updates. Corridor preservation should address road needs, transit needs, utilities, bicycle
facilities and trails. Formalize local government ordinances and negotiation procedures to
preserve corridors as development happens.
Revise street connectivity standards in updated subdivision ordinances.
Coordinate local street plans in sub-area plans to assure optimum connectivity.
Coordinate local street plans between jurisdictions.
Amend local construction standards to comply with ―complete streets‖ criteria (that include
provision for pedestrians, bicycles and parking) consistent with street segments mapped in the
general plan.
Vision Dixie principles 6-8 encourage ―Walk-able, Mixed-Use Centers‖, ―Directing Growth Inward,‖ and
―Enabling the Housing Market to Meet Housing Wants and Needs,‖ with the following long-term
recommendations:
1. Approximate areas for future mixed-use centers, remove zoning and subdivision barriers to
mixed-use centers, and update community general plans to include these centers.
2. Include mapped priority land re-use areas in general plans to signify to developers and nearby
land owners that development in those areas helps fulfill city-wide goals (of inward growth
first).
3. Modify edge-of-town standards and annexation policies to encourage contiguous
development and discourage leap-frog development through market-based mechanisms that
charge leap-frog development consistent with its higher level of impacts (e.g., longer streets
per home).
4. Amend the zoning map and ordinances to allow a greater range of (housing) densities.
These visions are supported by the 2011-2040 Regional Transportation Plan.

7
Chapter 4 – Projected Transportation Demand
Prior to the MPO designation, the City of St. George put in place a regional traffic model using the QRS
II platform. In 2002, the MPO supported a contract to re-calibrate the model to Census 2000 data and
subsequently in 2004 another MPO contract generated year 2015 and 2035 traffic projections based on
updated population and employment data from the Governor‘s Office of Planning Budget. During 2005
and 2006, several corridor studies were undertaken using the model, including SR-9 in Hurricane where a
new model was created.
Because of new land use information and population
assumption changes identified, these corridor
―models‘ influenced the need to expand the regional
model and to re-calibrate. The model structure added
the cities of Hurricane/LaVerkin Urban Cluster,
Toquerville, Leeds Town, and the four cities in the
Dixie MPO Planning Boundary, Ivins, Santa Clara,
St. George and Washington along with Washington
County areas adjacent to the cities/towns.
A change in model platform (software) was
undertaken in 2010. This change came about as a
result of discussions addressing the effectiveness of
the expanded QRS II Dixie Model beginning as far back as 2007-2008. The QRS II model was migrated
to the CUBE model in late 2010. The change also included all of Washington County to better predict
traffic movements on a county-wide basis. A rigorous effort to update socio-economic data was
completed as a part of the process with input from Washington County and each of the cities/towns in the
County.
Model Structure
Travel demand models are computer-based mathematical models that use socioeconomic and roadway
network data to forecast traffic under various scenarios. To forecast traffic the Dixie Travel Demand
Model uses the traditional 4-step process. The four basic phases are:
1. Trip Generation – Trip generation determines how many trips are made in a region. To simplify
the process, large geographical areas are broken up into smaller areas called traffic analysis zones
(TAZ). Using information from sources like the Census Bureau and city land use plans, each
TAZ is given certain attributes such as the number of households, employees, and average
income levels. These attributes are then used to calculate the number of trip productions and
attractions for each TAZ.
2. Trip Distribution –Trip distribution determines where the trips are going. Trip productions and
attractions from different TAZ‘s are linked together using a gravity model to form origin-
destination patterns. The gravity model states that the trip attraction between two zones is
proportional to the size of the zones (number of households/employees) and the distance between
them.
3. Mode Choice –What modal method of reaching a trip‘s destination is determined in step 3.
Looking at factors such as cost, convenience and travel time it is determined if the trip will be
made by walking, transit or vehicle.

8
4. Trip Assignment – The route the trip will take to reach its destination is then determined. Link
attributes contained in the highway network such as capacity and travel speed are used to
determine the shortest travel path to a destination. The trips are then assigned to the roadway
network.
Each step of the process is calibrated to observed travel behavior. Base model forecasts are checked
against observed traffic counts to ensure reasonable accuracy. Once the model is developed so that it
replicates existing travel behavior, it is then used to evaluate future scenarios and alternatives.
Socio-Economic Characteristics
The characteristics of population distribution in the MPO area is vital to the development and degree of
transportation infrastructure that should be planned for over the life of the plan. Information gained from
work done over the last few years helps us to paint a picture of current and projected population growth.
Table ** includes population figures for towns/cities within the planning boundaries of the DMPO. The
unincorporated County-wide population is expected to increase from 7,673 to 60,438. The distribution of
the current population and projected growth are illustrated on the population change map following. The
mapping includes a 2010 population distribution as well as identifies projected areas of growth out to
2040 2010. Detailed information can be found in the appendix.
Table ** - Population Growth
Employment and Commuting
According to the Utah Department of Workforce Services there were approximately 4,316 employment
establishments operating in Washington County in 2010 (see Appendix for table of major employers). It
should be realized that companies come and go. In 2009, the number of employment centers in
Washington County with more than 100 employees was 51. As is the case with many businesses, there
are seasonal peaks in employment, such as the Christmas holiday season at retail establishments. The
largest employer in the urbanized area is the Washington County School District. Their employees,
however, and their work destinations, are spread throughout the urbanized area.
050,000
100,000150,000200,000250,000300,000350,000
2040
2010
0
100,000
200,000
300,000
400,000
500,000
600,000
Axis Title
Historic / Projected Population

9
Chapter 5 – Financial Plan
Current Funding Sources, Gas Taxes, Fees
Currently in the Washington County area, federal, state, and local governments
as well as private developers provide funds to pay for improvements.
Federal Funds:
The current federal highway and transit bill SAFETEA-LU (Safe,
Accountable, Flexible, and Efficient Transportation Equity Act: A
Legacy for Users) continues to fund federal transportation programs
under continuing resolutions. And a new federal highway bill is
anticipated within the next several months.
State Funds:
The Utah Department of Transportation receives state highway user revenues as well as state
general funds for highway construction and maintenance projects. The highway user revenues
sources include motor fuel taxes, special fuel taxes, vehicle registration fees, driver license fees,
and other fees. General funds include sales taxes and other taxes. In addition, the state has the
authority to issue bonds for specific highway projects.
A portion of the state highway user funds are made available to local governments for highway
construction. Seventy-five percent of these funds are kept by the UDOT for their construction and
maintenance program. The remaining 25 percent are made available to the cities and counties in
the state through the Class B and C Program.
Class B and C funds are allocated to each city and county by a formula based on population and
road mileage. These funds can be used for either maintenance or construction of highways,
although at least 30 percent of the funds must be used for construction projects or for
maintenance projects that cost over $40,000.
Safe Sidewalks Program has also been established by the
legislature to fund the construction of sidewalks on roads on the
state system. The money is distributed through a formula based
partially on miles of state road in each UDOT Region. Each city
and county located in the region submits projects to the UDOT
Region office, which then prioritizes them. A statewide
committee then makes the final project selection.
Local Funds:
Local government agencies have a variety of funding sources available to them for transportation
improvements. The primary source is from the general fund of the cities and counties. These
general funds can be used for construction of new roads or the upgrading or maintenance of
existing ones. Transportation projects, however, must compete with the other needs of the city or
county for the use of these funds.
Local governments have several other options for improving their transportation systems. Most of
these options involve some kind of bonding arrangement, either through the creation of a
redevelopment district, a more traditional special improvement district organized for a specific
project benefiting an identifiable group of properties, or through general obligation bonding
arrangements for projects felt to be beneficial to the entire entity issuing the bonds.

10
The Local Corridor Preservation Fund allows the Washington County AOG to collect vehicle
registration fees of $10 per vehicle for transportation corridor preservation. The Utah Department
of Transportation has responsibility for seeing that the major requirements of the legislation are
met, such as compliance with federal property acquisition procedures, and a locally adopted
access management plan, or ordinance.
Private Sources
Private interests often provide sources of funding for transportation improvements. Developers
construct the local streets within subdivisions and often dedicate right-of-way for and participate
in the construction of collector and arterial streets adjacent to their developments. Developers
should also be considered as a possible source of funds for projects needed because of the impacts
of the development, such as the need for traffic signals or arterial street widening.
Private sources also need to be considered for transit improvements which will provide benefits to
them. For example, businesses or developers may be willing to support either capital expenses or
operating costs for transit services which provide them with special benefits, such as a reduced
need for parking or increased accessibility to their development.
Following is a brief list of programs used to fund transportation projects within the Dixie MPO:
FEDERAL HIGHWAY
ADMINISTRATION
Surface Transportation Program
(STP)
o Dixie MPO cities
Congestion Mitigation / Air Quality
(CMAQ) (Available only after
DMPO reaches non-attainment
status)
Interstate Maintenance (IM)
National Highway System (NHS)
Surface Transportation Program
Urbanized Area
Small Urban
Flexible (Any-Area)
Transportation Enhancements
Highway Safety Improvement
Program (HSIP)
Hazard Elimination
Railroad Crossings
Safe Routes to School (SR2S)
Bridge Replacement
Off System - Local
Off System - Optional
Federal Lands Programs
High Priority Projects (HPP)
Transportation Improvement
Projects (TI)
Recreational Trails
FEDERAL TRANSIT
ADMINISTRATION
(5307) Block Grant Funds
(5309) Discretionary Funds
(5310) Services for elderly and
disabled
(5311) Grants for Outside Urban
Area
(5340) High Density States Program
(5316) Job Access and Reverse
Commute
(5317) New Freedom Program
STATE OF UTAH
State Construction
State General Funds
State Traffic
Corridor Preservation Funds
LOCAL
County (B Funds)
City (C Funds)
General Funds
Transit Sales Tax
Corridor Preservation Fund
PRIVATE
Donations / User Fee
Developer Funded Projects
Public/Private Partnerships
11
Unified Plan Process
To fiscally constrain the long range transportation plan, Dixie MPO joined with the Utah Department of
Transportation, Utah Transit Authority and Utah‘s other MPOs to make common financial assumptions.
This effort was accomplished by the Unified Plan Financial Working Group. It included developing
assumptions for projected revenues, inflation rates, estimated construction costs, and right-of-way costs.
The Dixie MPO Executive Committee also examined local funding options and passed a series of
additional future funding assumptions associated with transportation. Below is a discussion of these
assumptions, an outline of current funding sources, and a policy document supporting acquisition of
future federal funding.
State (Future) Funding Assumptions
The Unified Plan Financial Working Group agreed on the following state wide
revenue assumptions for the future:
100% Auto Related Sales Tax- 16.6% total by FY 2017
75% Auto Related Sales Tax- 12.5% total by FY 2015
$0.05 SW Fuel Tax or Equivalent, every 10 yrs starting in FY 2014
(30% to B & C Fund)
State Wide Vehicle Registration Fee- $10 increase in FY 2018
Local (Future) Funding Assumptions
The Dixie MPO Executive Committee agreed on the following local revenue assumptions:
¼ Cent Local Option Sales Tax by 2014
New $0.05 Local Option Fuel Tax or equivalent every 7 years starting in 2016*
New $5 Local Option Vehicle Registration Fee every 10 years starting in 2018*
*NOTE: Local revenue enhancements after 2020 require further analysis and comparison to needs list.
Fiscal constraints through 30-year planning phases
These ―future funding‖ assumptions, taken together with existing funding sources were calculated and
documented in a ―Regional Transportation Plan Financial Report‖ as agreed upon through the Unified
Plan Financial Working Group and endorsed by the Dixie MPO Transportation Executive Council.
The group projected a 4 percent annual inflation rate (a conservatively high estimate based on past
experience) on all cost projections. A conservatively low 1.96 percent inflation rate was projected on
revenue sources. Utah‘s shifting population was also figured into these assumptions based on projections
by the Governors‘ Office of Planning and Budget. Currently the Dixie MPO is home to 6.67 percent of
the state‘s population. GOPB projects the Dixie MPO population will reach 8.6 percent of state
population by 2021 and 10.2 percent in 2030.
Federal formula funds, which represent only a small portion of an MPOs annual budget, assist MPO
planning, environmental assessments and construction seed money for projects that move from the Plan to
the Transportation Improvement Program. These federal dollars come from FHWA‘s Surface
Transportation Program and FTA‘s Transit Programs with an approved 2% inflation rate.
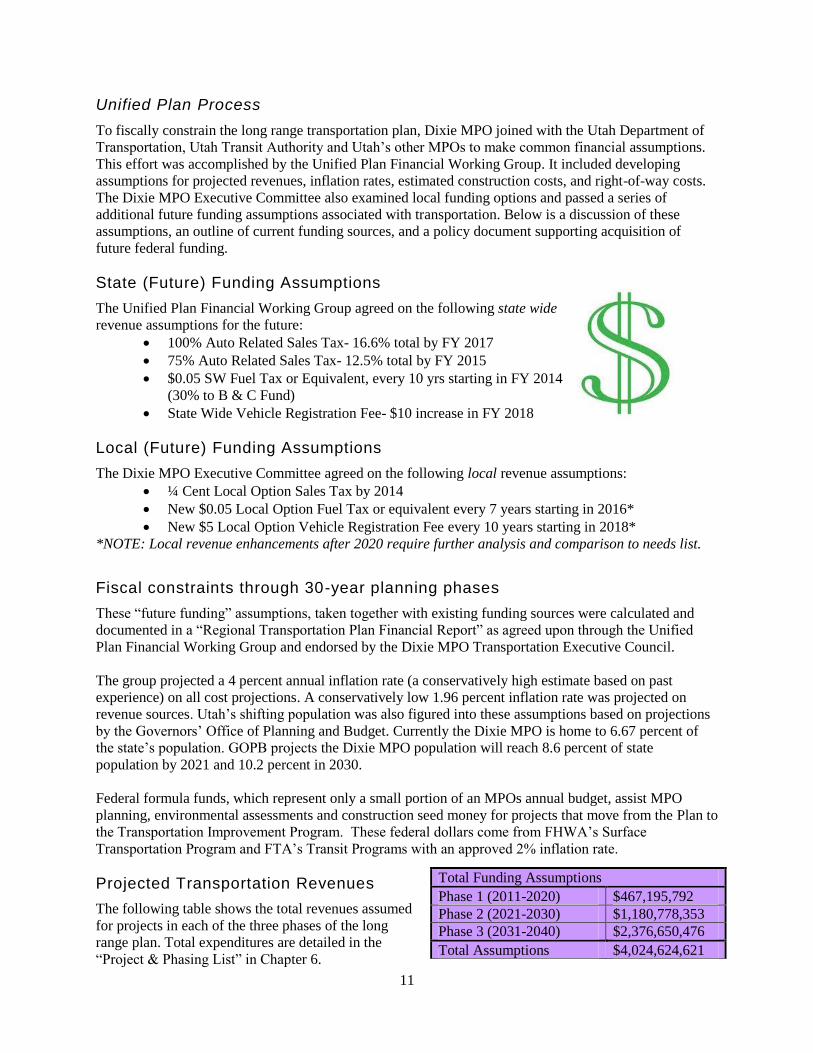
Projected Transportation Revenues
The following table shows the total revenues assumed
for projects in each of the three phases of the long
range plan. Total expenditures are detailed in the
―Project & Phasing List‖ in Chapter 6.
Total Funding Assumptions
Phase 1 (2011-2020) $467,195,792
Phase 2 (2021-2030) $1,180,778,353
Phase 3 (2031-2040) $2,376,650,476
Total Assumptions $4,024,624,621

12
When compared with the needs list and anticipated costs in Chapter 6, these funding assumptions seem
adequate in Phase 1 of the RTP. However, a re-evaluation of revenue needs may be appropriate in Phases
II and III – beyond year 2020.
Chapter 6 – Existing and Proposed Transportation Facilities
Methodology
As discussed in Chapter 4, the Dixie MPO‘s new computer-based transportation modeling tool was used
to analyze future traffic demand. The CUBE Model applied mathematical forecasting formulas to
population, land use, socio-economic, trip generation, trip distribution, and mode choice data.
These forecasts were then imposed
on the existing transportation
networks. Then projects were
conceptualized to relieve traffic
congestion ―hotspots‖ in each ten-
year phase of the 30-year plan.
Phase One includes the years 2011-
2020. The associated project list
was created to relieve the traffic
demands of 2020. Phase Two
includes 2021-2030 with a similar
project list to relieve congestion
under 2030 forecasts, and Phase
Three includes the projects needed
in 2031-2040.
Current Network
An inventory of the current MPO road network is best noted through use of the following map. The roads
noted in red and black indicate areas of concern or traffic congestion in 2020 if no additional projects are
built.
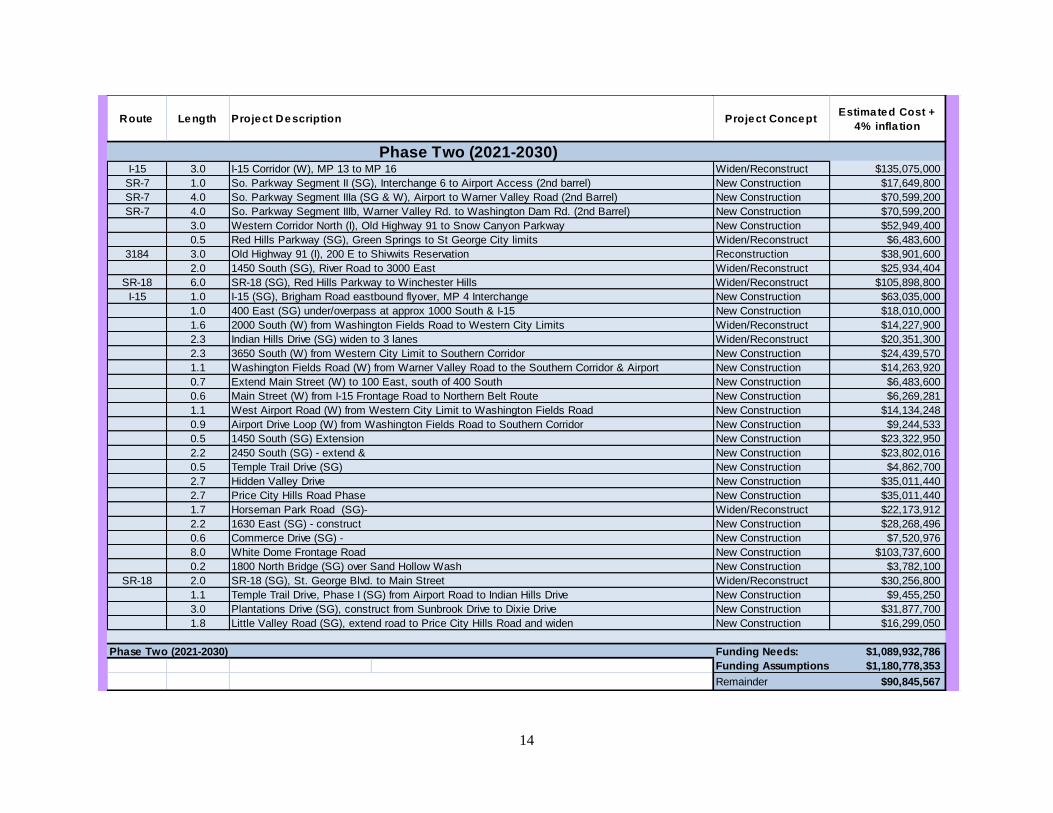
Projects and Phasing
The next several pages list a variety of transportation projects identified using the methodology outlined
in chapters 3, 4 and above. Projects range from highway widening to bridge and overpass construction, as
well as proposed new corridors. Additionally listed are UDOT and Eastern Washington County Rural
Planning Organization projects of interest that may lie outside the MPO boundaries, but are vital
connections in serving the overall traffic demand.
Project phasing maps also follow:

13
Route Length Project ConceptEstimated Cost +
4% annua l infla tion
SR-8 1.5 Sunset Blvd (SG), widen to 6 lanes Minor Widen/Reconstruct $110,000
0.5 Brigham Road Interchange (MP4) Phase II (SG) Minor Reconstruction $128,000
Northern Washington Parkway (SG) corridor study from MP 13 to SR-18 Study $200,000
1.3 Center Street (I) Streetscape Improvements New Construction $577,000
0.2 4200 South (W) from 20 East to West Airport Road New Construction $1,241,000
0.3 Airport Road (SG) from old airport to Blackridge Drive New Construction $1,551,250
0.3 1000 East (SG) from Red Hills Parkway to Industrial Road Widen/Reconstruct $1,861,500
0.2 1575 North Bridge (SG) over Sand Hollow Wash New Construction $2,171,750
1.5 200 East (I), Old Highway 91 to Center Street Reconstruction $2,300,000
0.5 400 South Trail & Underpass (SG), DSC 700 East to DSC Health Science Building New Construction $2,500,000
0.4 Center Street (I) and Snow Canyon Drive intersection improvements Reconstruction $2,928,760
0.6 840 South (W) from 859 North (SG) to 300 East New Construction $3,723,000
0.8 1450 South (SG), widen and improve to 5-lane section Widen/Reconstruct $5,491,425
1.6 Washington Dam Road (W), 1900 East to So. Parkway Interchange New Construction $5,700,000
1.0 Santa Clara Drive (SC), Swiss Village to 200 E (I) Reconstruction $7,321,900
1.0 Traffic Control Center (SG) ITS New Construction $7,446,000
Buena Vista/Red Hills Pkwy (W), Realign Buena Vista near Green Springs interchange Realignment/Reconstruct $7,630,000
1.3 River Road (SG), widen to 5-lane section from Painted Desert to Brigham Road Widen/Reconstruct $9,152,375
0.2 Red Hills Parkway & Red Cliffs Drive connection (SG) New Construction $14,197,040
2.0 Dixie Drive (SG), new bridge to Mathis Bridge Widen/Reconstruct $14,643,800
2.0 3000 East (SG) from 900 South to 2450 South Widen/Reconstruct $14,790,238
9.0 Washington Fields Road (W), 3650 South to Airport Access New Construction $17,600,000
SR-18 2.0 SR-18 (SG), St. George Blvd. to Red Hills Parkway Intersection Widen/Reconstruct $17,870,400
2.0 Washington Fields Road (W), Lost Ridge Dr. to 3650 South Widen/Reconstruct $17,870,400
2.5 Riverside Drive (SG), Convention Center Drive to 3050 East Widen/Reconstruct $18,304,750
I-15 1.0 I-15 (SG), Interchange reconstruction at MP 8 Reconstruction $18,615,000
SR-18 1.0 SR-18 (SG), grade separated interchange w/Red Hills Parkway New Interchange $18,615,000
1.0 Mall Drive (SG), bridge & legs New Construction $23,423,875
SR-18 1.0 SR-18 (SG), Southbound Flyover at Sunset Blvd. New Construction $24,820,000
SR-9 2.0 So. Parkway Segment VI (H), I-15 to Telegraph 2 Interchanges @ $37,230,000
SR-7 4.0 So. Parkway Segment IIIb, Warner Valley Road to Washington Dam Road (1st Barrel) New Construction $48,647,200
I-15 13.0 I-15 Corridor (W), MP 0 to MP 13 Widen/Reconstruct $58,078,800
8.0 Northern Washington Parkway Corridor (SG), Red Hills Parkway to MP 13 New Construction $97,294,400
Phase One (2011 to 2020) Total Funding Needs: $504,034,863Funding Assumptions: $467,195,792
Remainder / (Overage) ($36,839,071)
Regional Transportation Plan 5-13-11 Draft Projects & Phasing
2011- 2040
Phase One (2011-2020)
Project Description
14
Route Length Project ConceptEstimated Cost +
4% infla tion
I-15 3.0 I-15 Corridor (W), MP 13 to MP 16 Widen/Reconstruct $135,075,000
SR-7 1.0 So. Parkway Segment II (SG), Interchange 6 to Airport Access (2nd barrel) New Construction $17,649,800
SR-7 4.0 So. Parkway Segment IIIa (SG & W), Airport to Warner Valley Road (2nd Barrel) New Construction $70,599,200
SR-7 4.0 So. Parkway Segment IIIb, Warner Valley Rd. to Washington Dam Rd. (2nd Barrel) New Construction $70,599,200
3.0 Western Corridor North (I), Old Highway 91 to Snow Canyon Parkway New Construction $52,949,400
0.5 Red Hills Parkway (SG), Green Springs to St George City limits Widen/Reconstruct $6,483,600
3184 3.0 Old Highway 91 (I), 200 E to Shivwits Reservation Reconstruction $38,901,600
2.0 1450 South (SG), River Road to 3000 East Widen/Reconstruct $25,934,404
SR-18 6.0 SR-18 (SG), Red Hills Parkway to Winchester Hills Widen/Reconstruct $105,898,800
I-15 1.0 I-15 (SG), Brigham Road eastbound flyover, MP 4 Interchange New Construction $63,035,000
1.0 400 East (SG) under/overpass at approx 1000 South & I-15 New Construction $18,010,000
1.6 2000 South (W) from Washington Fields Road to Western City Limits Widen/Reconstruct $14,227,900
2.3 Indian Hills Drive (SG) widen to 3 lanes Widen/Reconstruct $20,351,300
2.3 3650 South (W) from Western City Limit to Southern Corridor New Construction $24,439,570
1.1 Washington Fields Road (W) from Warner Valley Road to the Southern Corridor & Airport New Construction $14,263,920
0.7 Extend Main Street (W) to 100 East, south of 400 South New Construction $6,483,600
0.6 Main Street (W) from I-15 Frontage Road to Northern Belt Route New Construction $6,269,281
1.1 West Airport Road (W) from Western City Limit to Washington Fields Road New Construction $14,134,248
0.9 Airport Drive Loop (W) from Washington Fields Road to Southern Corridor New Construction $9,244,533
0.5 1450 South (SG) Extension New Construction $23,322,950
2.2 2450 South (SG) - extend & New Construction $23,802,016
0.5 Temple Trail Drive (SG) New Construction $4,862,700
2.7 Hidden Valley Drive New Construction $35,011,440
2.7 Price City Hills Road Phase New Construction $35,011,440
1.7 Horseman Park Road (SG)- Widen/Reconstruct $22,173,912
2.2 1630 East (SG) - construct New Construction $28,268,496
0.6 Commerce Drive (SG) - New Construction $7,520,976
8.0 White Dome Frontage Road New Construction $103,737,600
0.2 1800 North Bridge (SG) over Sand Hollow Wash New Construction $3,782,100
SR-18 2.0 SR-18 (SG), St. George Blvd. to Main Street Widen/Reconstruct $30,256,800
1.1 Temple Trail Drive, Phase I (SG) from Airport Road to Indian Hills Drive New Construction $9,455,250
3.0 Plantations Drive (SG), construct from Sunbrook Drive to Dixie Drive New Construction $31,877,700
1.8 Little Valley Road (SG), extend road to Price City Hills Road and widen New Construction $16,299,050
Phase Two (2021-2030) Funding Needs: $1,089,932,786
Funding Assumptions: $1,180,778,353
Remainder $90,845,567
Phase Two (2021-2030)
Project Description
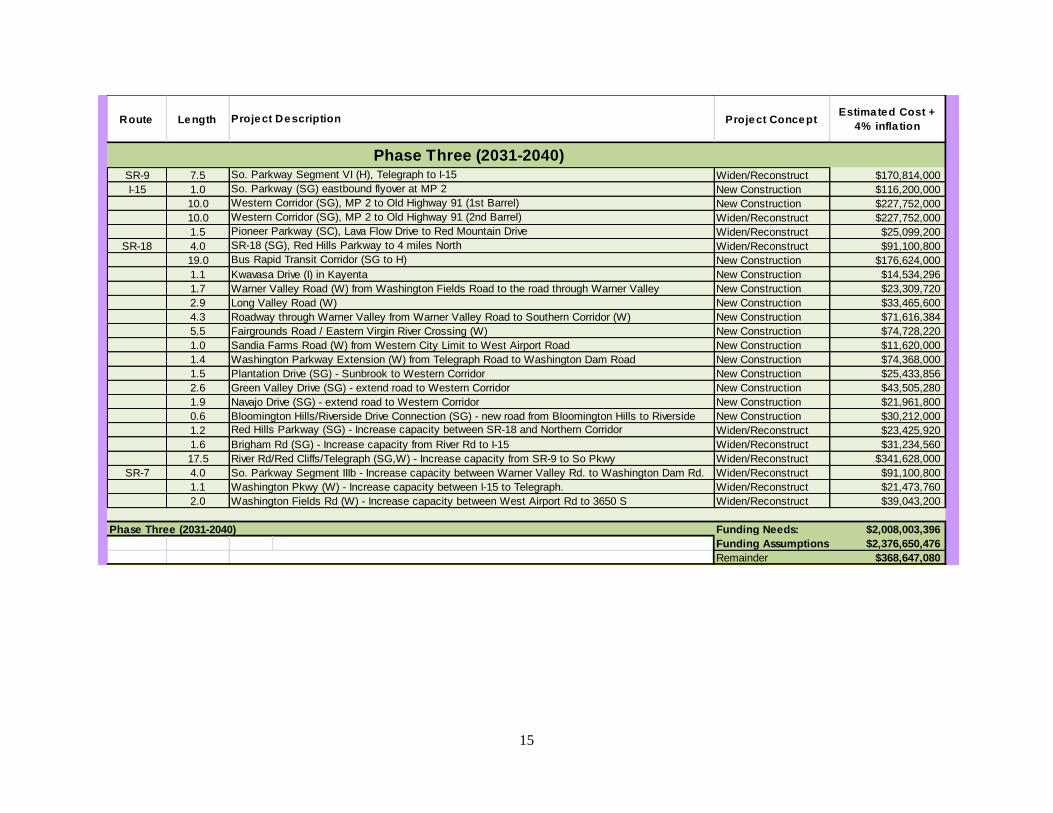
15
Route Length Project ConceptEstimated Cost +
4% infla tion
SR-9 7.5 Widen/Reconstruct $170,814,000
I-15 1.0 New Construction $116,200,000
10.0 New Construction $227,752,000
10.0 Widen/Reconstruct $227,752,000
1.5 Widen/Reconstruct $25,099,200
SR-18 4.0 Widen/Reconstruct $91,100,800
19.0 New Construction $176,624,000
1.1 Kwavasa Drive (I) in Kayenta New Construction $14,534,296
1.7 Warner Valley Road (W) from Washington Fields Road to the road through Warner Valley New Construction $23,309,720
2.9 Long Valley Road (W) New Construction $33,465,600
4.3 Roadway through Warner Valley from Warner Valley Road to Southern Corridor (W) New Construction $71,616,384
5.5 Fairgrounds Road / Eastern Virgin River Crossing (W) New Construction $74,728,220
1.0 Sandia Farms Road (W) from Western City Limit to West Airport Road New Construction $11,620,000
1.4 Washington Parkway Extension (W) from Telegraph Road to Washington Dam Road New Construction $74,368,000
1.5 New Construction $25,433,856
2.6 New Construction $43,505,280
1.9 New Construction $21,961,800
0.6 New Construction $30,212,000
1.2 Widen/Reconstruct $23,425,920
1.6 Brigham Rd (SG) - Increase capacity from River Rd to I-15 Widen/Reconstruct $31,234,560
17.5 River Rd/Red Cliffs/Telegraph (SG,W) - Increase capacity from SR-9 to So Pkwy Widen/Reconstruct $341,628,000
SR-7 4.0 So. Parkway Segment IIIb - Increase capacity between Warner Valley Rd. to Washington Dam Rd. Widen/Reconstruct $91,100,800
1.1 Washington Pkwy (W) - Increase capacity between I-15 to Telegraph. Widen/Reconstruct $21,473,760
2.0 Washington Fields Rd (W) - Increase capacity between West Airport Rd to 3650 S Widen/Reconstruct $39,043,200
Phase Three (2031-2040) Funding Needs: $2,008,003,396
Funding Assumptions: $2,376,650,476
Remainder $368,647,080
Project Description
Green Valley Drive (SG) - extend road to Western Corridor
Navajo Drive (SG) - extend road to Western Corridor
Western Corridor (SG), MP 2 to Old Highway 91 (2nd Barrel)
Pioneer Parkway (SC), Lava Flow Drive to Red Mountain Drive
So. Parkway Segment VI (H), Telegraph to I-15
SR-18 (SG), Red Hills Parkway to 4 miles North
So. Parkway (SG) eastbound flyover at MP 2
Bloomington Hills/Riverside Drive Connection (SG) - new road from Bloomington Hills to Riverside
Red Hills Parkway (SG) - Increase capacity between SR-18 and Northern Corridor
Western Corridor (SG), MP 2 to Old Highway 91 (1st Barrel)
Phase Three (2031-2040)
Plantation Drive (SG) - Sunbrook to Western Corridor
Bus Rapid Transit Corridor (SG to H)

16
Route Length Project ConceptEstimated Cost +
4% infla tion
SR-7 3.5 New Construction $28,406,490
SR-7 4.0 New Construction $62,818,880
SR-7 4.0 New Construction $62,818,880
2.0 Widen/Reconstruct $13,626,180
SR-212 1.0 Widen rd & bridge $6,813,000
0.5 Reconstruction $3,406,000
2.0 New Construction $13,626,000
SR-7 4.0 New Construction $27,252,360
I-15 1.0 New Construction $45,000,000
I-15 1.0 New Construction $30,000,000
2.0 Widen/Reconstruct $13,500,000
1.5 Widen/Reconstruct $15,000,000
4.0 Widen/Reconstruct $39,500,000
Total Funded $361,767,790
Project Description
I-15 (SG), Dixie Drive Split Interchange-C&D roads & Dixie Drive ext.
So. Parkway Segment IVa (H), Washington Dam Road to 4300 West (1st Barrel)
So. Parkway Segment IIIa (SG & W), Airport Access to Warner Valley Road (1st barrel)
So. Parkway Segment II (SG), River Road to Airport Access (1st barrel)
Buena Vista (W), Main Street to MP 13 (I-15)
Telegraph Road (W), 500 West to 300 East
300 East (W), Telegraph to Virgin River bridge
Airport Terminal Road (SG), Airport to So. Parkway
So. Parkway (SG), River Road to Airport Interchange
Brigham Road (SG), River Road to MP 4
Snow Canyon Parkway (SG), Tuweap to SR-18
Red Hills Parkway (SG), SR-18 to Industrial Road
I-15 (SG), Dixie Drive Split Interchange
Funded
Total Assumptions $4,024,624,621
Total Needs $3,601,971,045
Total Difference $422,653,576
Total All Phases
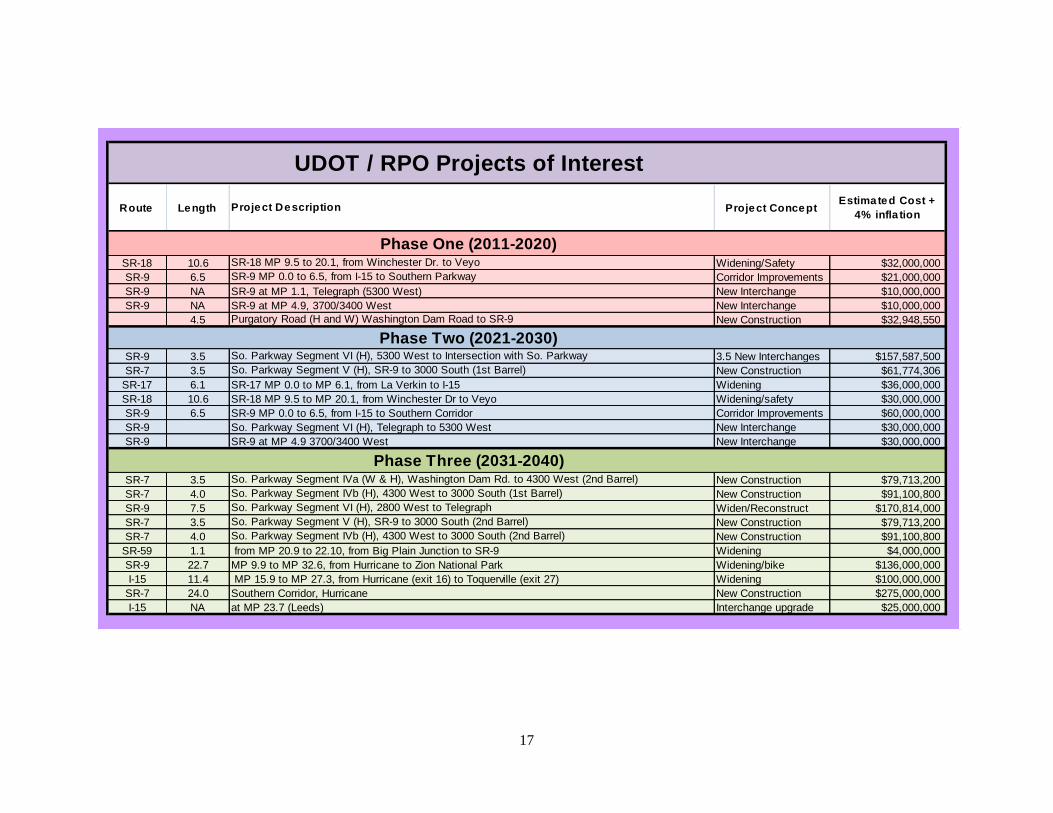
17
Route Length Project ConceptEstimated Cost +
4% infla tion
SR-18 10.6 Widening/Safety $32,000,000
SR-9 6.5 Corridor Improvements $21,000,000
SR-9 NA SR-9 at MP 1.1, Telegraph (5300 West) New Interchange $10,000,000
SR-9 NA SR-9 at MP 4.9, 3700/3400 West New Interchange $10,000,000
4.5 New Construction $32,948,550
SR-9 3.5 3.5 New Interchanges $157,587,500
SR-7 3.5 New Construction $61,774,306
SR-17 6.1 SR-17 MP 0.0 to MP 6.1, from La Verkin to I-15 Widening $36,000,000
SR-18 10.6 SR-18 MP 9.5 to MP 20.1, from Winchester Dr to Veyo Widening/safety $30,000,000
SR-9 6.5 SR-9 MP 0.0 to 6.5, from I-15 to Southern Corridor Corridor Improvements $60,000,000
SR-9 So. Parkway Segment VI (H), Telegraph to 5300 West New Interchange $30,000,000
SR-9 SR-9 at MP 4.9 3700/3400 West New Interchange $30,000,000
SR-7 3.5 New Construction $79,713,200
SR-7 4.0 New Construction $91,100,800
SR-9 7.5 Widen/Reconstruct $170,814,000
SR-7 3.5 New Construction $79,713,200
SR-7 4.0 New Construction $91,100,800
SR-59 1.1 from MP 20.9 to 22.10, from Big Plain Junction to SR-9 Widening $4,000,000
SR-9 22.7 MP 9.9 to MP 32.6, from Hurricane to Zion National Park Widening/bike $136,000,000
I-15 11.4 MP 15.9 to MP 27.3, from Hurricane (exit 16) to Toquerville (exit 27) Widening $100,000,000
SR-7 24.0 Southern Corridor, Hurricane New Construction $275,000,000
I-15 NA at MP 23.7 (Leeds) Interchange upgrade $25,000,000
SR-9 MP 0.0 to 6.5, from I-15 to Southern Parkway
Purgatory Road (H and W) Washington Dam Road to SR-9
So. Parkway Segment V (H), SR-9 to 3000 South (1st Barrel)
So. Parkway Segment VI (H), 5300 West to Intersection with So. Parkway
So. Parkway Segment IVb (H), 4300 West to 3000 South (2nd Barrel)
So. Parkway Segment V (H), SR-9 to 3000 South (2nd Barrel)
So. Parkway Segment VI (H), 2800 West to Telegraph
So. Parkway Segment IVb (H), 4300 West to 3000 South (1st Barrel)
So. Parkway Segment IVa (W & H), Washington Dam Rd. to 4300 West (2nd Barrel)
Project Description
UDOT / RPO Projects of Interest
Phase One (2011-2020)
Phase Two (2021-2030)
Phase Three (2031-2040)
SR-18 MP 9.5 to 20.1, from Winchester Dr. to Veyo

18
Chapter 7 – Safety Management (Security)
Introduction
The Dixie MPO is committed to excellence in transportation planning. One area of planning which has,
is, and will be given a lot of attention is ‗Safety Management‘. On the pages to follow, data and
information will be presented that illustrates issues related to ‗Safety and Security‘ as well as ‗Traffic
Safety‘. Some ways those issues can be mitigated through objective identification and specific strategies
or projects intended to lessen their impact are also presented.
The UDOT has put significant efforts into safety related data and campaigns. That information is used as
a part of the Dixie MPO planning effort. For more information on the UDOT campaign, please refer to
the UDOT web site at http://www.udot.utah.gov/main/f?p=100:pg:0::::T,V:2956,
State Safety Leadership Team
UDOT‘s Office of Traffic and Safety is facilitating an on-going
safety plan and strategy in cooperation with many local, regional,
state, and federal partners. Each MPO in Utah is a member of
this leadership team. This year the most visible project has been
the ―ZERO Fatalities: A Goal We Can All Live With‖ program.
The primary program goals and objectives endorsed by the team and MPO boards will rely on education,
outreach, and multi- agency partnering to accomplish them. Current Emphasis Areas include increasing
use of safety restraints, improving intersection safety, and reducing aggressive driving, distracted driving,
drowsy driving, and impaired driving.
Continuing Safety Areas include enhancement of child safety, railroad crossing safety, older driver safety
and transit system safety. Ongoing planning to improve pedestrian safety, motorcycle safety, younger
driver safety, and rural road safety will be coincided with increasing work zone safety and promoting
safer truck travel. Special areas that may be visited and promoted periodically include enhancement of
safety management systems, crash data systems, and emergency services capabilities.
MPO‘s dependency on road functionality and the continuity of the trucking industry to connect MPO
residents with life sources of freight, food, products, and services through Arizona and Northern Utah
Traffic Safety
As the fast growing area in and around the Dixie MPO develops, the frequency of traffic accidents will
likely increase. Information available to the MPO identifies location and the major contributing factor to
the accident as well as the severity of the accident and what injury resulted. Information is displayed in
the map and chart on pages below with additional information included in appendix **.
The UDOT has provided crash data by county which includes severity and contributing characteristics of
the crashes. The chart below illustrates the incidence of severe injury or fatal crashes in Washington
County between 2006 and 2008. Additionally all crashes and severe crash/fatalities locations are
included in the map on the following page.
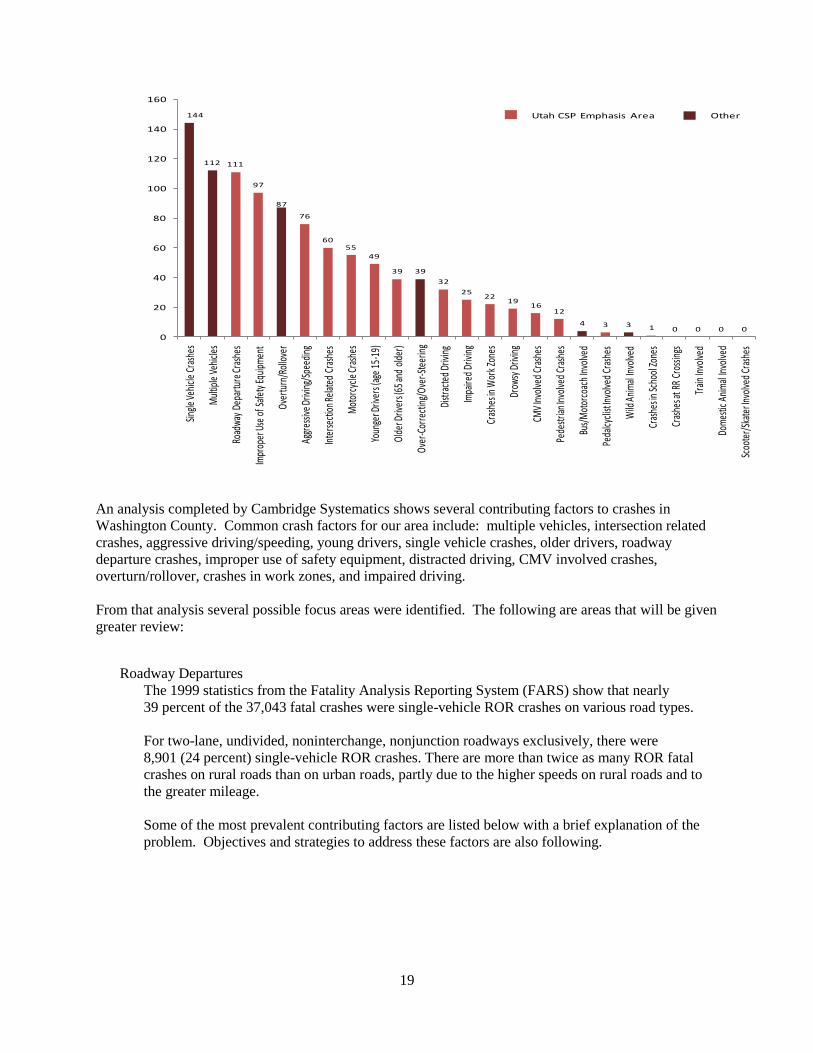
Washington County – Serious Injury and Fatal Crashes by Contributing Factor, 2006-2008
19
An analysis completed by Cambridge Systematics shows several contributing factors to crashes in
Washington County. Common crash factors for our area include: multiple vehicles, intersection related
crashes, aggressive driving/speeding, young drivers, single vehicle crashes, older drivers, roadway
departure crashes, improper use of safety equipment, distracted driving, CMV involved crashes,
overturn/rollover, crashes in work zones, and impaired driving.
From that analysis several possible focus areas were identified. The following are areas that will be given
greater review:
Roadway Departures
The 1999 statistics from the Fatality Analysis Reporting System (FARS) show that nearly
39 percent of the 37,043 fatal crashes were single-vehicle ROR crashes on various road types.
For two-lane, undivided, noninterchange, nonjunction roadways exclusively, there were
8,901 (24 percent) single-vehicle ROR crashes. There are more than twice as many ROR fatal
crashes on rural roads than on urban roads, partly due to the higher speeds on rural roads and to
the greater mileage.
Some of the most prevalent contributing factors are listed below with a brief explanation of the
problem. Objectives and strategies to address these factors are also following.
144
112 111
97
87
76
6055
49
39 39
32
2522
1916
12
4 3 3 1 0 0 0 00
20
40
60
80
100
120
140
160
Single
Vehi
cle C
rash
es
Mul
tiple
Veh
icles
Road
way
Depa
rture
Cras
hes
Impr
oper
Use
of S
afet
y Equ
ipm
ent
Over
turn
/Rol
love
r
Aggr
essiv
e Driv
ing/
Spee
ding
Inte
rsec
tion R
elat
ed C
rash
es
Mot
orcy
cle Cr
ashe
s
Youn
ger D
river
s (ag
e 15
-19)
Olde
r Driv
ers (
65 an
d ol
der)
Over
-Cor
rect
ing/
Over
-Ste
erin
g
Distr
acte
d Dr
iving
Impa
ired
Drivi
ng
Cras
hes i
n W
ork Z
ones
Drow
sy D
rivin
g
CMV
Invo
lved
Cras
hes
Pede
strian
Invo
lved
Cras
hes
Bus/
Mot
orco
ach
Invo
lved
Peda
lcycli
st In
volve
d Cr
ashe
s
Wild
Ani
mal
Invo
lved
Cras
hes i
n Sc
hool
Zone
s
Cras
hes a
t RR
Cros
sings
Train
Invo
lved
Dom
estic
Ani
mal
Invo
lved
Scoo
ter/
Skat
er In
volve
d Cr
ashe
s
Dixie MPO, Washington County
Serious Injury and Fatal Crashes by Type, 2006-2008
Utah CSP Emphasis Area Other
20
Intersection Accidents
Un-signalized
Intersections constitute only a small part of the overall highway system, yet intersection-related
crashes constitute more than 50 percent of all crashes within urban areas and over 30 percent in
rural areas (Kuciemba and Cirillo, 1992). Fatal intersection crashes are a smaller portion of the
total picture, suggesting that severity of crashes at intersections is lower than elsewhere.
It is not unusual that crashes are concentrated at intersections, because intersections are the point
on the roadway system where traffic movements most frequently conflict with one another. Good
geometric design combined with good traffic control can result in an efficient and safe
intersection.
Signalized
Intersections constitute only a small part of the overall highway system, yet intersection related
crashes constitute more than 20 percent of fatal crashes. It is not unusual that crashes are
concentrated at intersections, because intersections are the point on the roadway system where
traffic movements most frequently conflict with one another. Good geometric design combined
with good traffic control can result in an intersection that operates efficiently and safely.
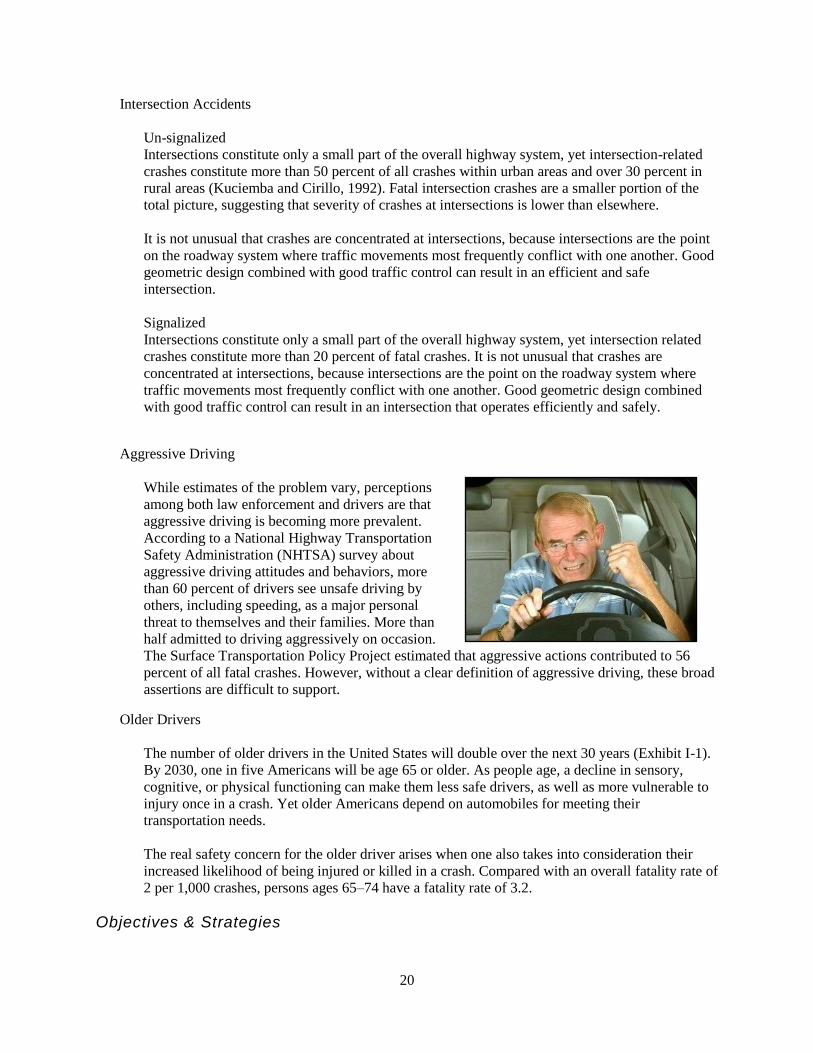
Aggressive Driving
While estimates of the problem vary, perceptions
among both law enforcement and drivers are that
aggressive driving is becoming more prevalent.
According to a National Highway Transportation
Safety Administration (NHTSA) survey about
aggressive driving attitudes and behaviors, more
than 60 percent of drivers see unsafe driving by
others, including speeding, as a major personal
threat to themselves and their families. More than
half admitted to driving aggressively on occasion.
The Surface Transportation Policy Project estimated that aggressive actions contributed to 56
percent of all fatal crashes. However, without a clear definition of aggressive driving, these broad
assertions are difficult to support.
Older Drivers
The number of older drivers in the United States will double over the next 30 years (Exhibit I-1).
By 2030, one in five Americans will be age 65 or older. As people age, a decline in sensory,
cognitive, or physical functioning can make them less safe drivers, as well as more vulnerable to
injury once in a crash. Yet older Americans depend on automobiles for meeting their
transportation needs.
The real safety concern for the older driver arises when one also takes into consideration their
increased likelihood of being injured or killed in a crash. Compared with an overall fatality rate of
2 per 1,000 crashes, persons ages 65–74 have a fatality rate of 3.2.
Objectives & Strategies

21
The Dixie MPO is focusing on the above contributing factors because of the impacts they pose in
our area. Although these factors pose significant concerns it is possible to help alleviate those
concerns through the adoption and implementation of objectives and strategies addressing each
area. The listing below includes strategies which if implemented will help the Dixie MPO to
address each focus area:
Roadway Departures
RD1 Keep vehicles from encroaching on the roadside
Install shoulder, edge-line, or mid-lane rumble strips where needed
Provide improved highway geometry for horizontal curves
Provide enhanced pavement markings
Provide skid-resistant pavement surfaces
Apply shoulder treatments
Eliminate shoulder drop-offs
Widen and/or pave shoulders
RD2 Minimize the likelihood of crashing into an object or overturning if the vehicle travels off
the shoulder
Design safer slopes and ditches to prevent rollovers
Remove/relocate objects in hazardous locations
Delineate trees or utility poles with retro-reflective tape
RD3 Reduce the severity of the crash
Improve design of roadside hardware
Improve design and application of barrier and attenuation
Intersections
Un-signalized
I.1 Management of access near un-signalized intersections
Implement driveway closures/relocations
Implement driveway turn restrictions
I.2 Reduce the frequency and severity of intersection conflicts through geometric design
improvements
Provide left-turn lanes at intersections
Provide bypass lanes on shoulders at T-intersections
Provide right-turn lanes at intersections
Provide right-turn acceleration lanes at intersections
Provide full-width paved shoulders in intersection areas
Restrict or eliminate turning maneuvers by signing
Restrict or eliminate turning maneuvers by providing channelization or closing median
openings
Close or relocate ―high-risk‖ intersections
Convert four-legged intersections to two T-intersections
Improve pedestrian and bicycle facilities to reduce conflicts between motorists and non-
motorists
I.2 Improve sight distance at un-signalized intersections
Clear sight triangles on stop- or yield-controlled approaches to intersections
Clear sight triangles in the medians of divided highways near intersections
Eliminate parking that restricts sight distance
I.3 Improve driver awareness of intersections as viewed from the intersection approach
Improve visibility of intersections by providing enhanced signing and delineation
Improve visibility of the intersection by providing lighting
22
Provide a stop bar on minor road approaches
Install larger regulatory and warning signs at intersections
I.4 Choose appropriate intersection traffic control to minimize crash frequency and severity
Provide all-way stop-control at appropriate intersections
Provide roundabouts at appropriate locations
I.5 Improve driver compliance with traffic control devices and traffic laws at intersections
Provide targeted public information and education on safety problems at specific
intersections
I.6 Reduce operating speeds on specific intersection approaches
Post appropriate speed limit on intersection approaches
I.7 Guide motorists more effectively through complex intersections
Provide turn path markings
Provide lane assignment signing or marking at complex intersections
Signalized intersection
I.8 Reduce frequency and severity of intersection conflicts through traffic control and
operational improvements
Restrict or eliminate turning maneuvers
Employ signal coordination
Improve operation of pedestrian and bicycle facilities at signalized intersections
Remove unwarranted signal
I.9 Reduce frequency and severity of intersection conflicts
through geometric improvements
Provide/improve left-turn channelization
Provide/improve right-turn channelization
Improve geometry of pedestrian and bicycle facilities
I.10 Improve sight distance at signalized intersections
Clear sight triangles
Aggressive Driving
AD.1 Deter aggressive driving in specific populations, including those with a history of such
behavior, and at specific locations
Conduct educational and public information campaigns
AD.2 Improve the driving environment to eliminate or minimize the external triggers of
aggressive drivers
Change or mitigate the effects of identified elements in the environment
Reduce nonrecurring delays and provide better information about these delays
Older Drivers
OD.1 Plan for an aging population
Establish a broad-based coalition to plan to address older adults‘ transportation
needs
OD.2 Improve the roadway and driving environment to better accommodate the special needs
of older drivers
Provide advance warning signs
Provide advance-guide and street name signs
Provide all-red clearance intervals at signalized intersections

23
Provide more protected left turn signal phases at high-
volume intersections
Provide offset left-turn lanes at intersections
Improve lighting at intersections, horizontal curves, and
railroad grade crossings
Improve roadway delineation
Replace painted channelization with raised
channelization
Reduce intersection skew angle
Improve traffic control at work zones
OD.3 Reduce the risk of injury and death to older drivers and passengers involved in crashes
Increase seatbelt use by older drivers and passengers through public education campaigns
Chapter 8 – Security
Washington County Emergency Management
The Washington County Emergency Management Office has developed an Emergency Management Plan
and is currently working on an update of that plan. The plan includes a County response to a variety of
emergency situations which may occur in and around our communities. An evacuation Annex portion of
the plan identifies procedures to coordinate evacuation needs during times of a natural, man-made,
technological, Homeland Security emergencies or disaster.
System Management (ITS)
Consideration of strategies to address Homeland Security for Utah‘s Dixie is limited for a relatively new
small-urbanized Metropolitan Planning area, but the benefits will provide a legacy and direction for future
RTP updates and system security. The Dixie Regional ITS Architectural Study and its implementation
strategies provide the foundation of policy and communications needs. The existence of the Washington
County Emergency Management Office for dealing with short and long-term events provides a central
place for coordination with local state and federal partners in the event of security, criminal or terrorist
acts or emergency events and natural or manmade catastrophes.
Regional ITS Architecture is required for the orderly and consistent deployment of ITS throughout the
Region. A plan was prepared by ITERIS, Inc. with a final draft submitted in April 2006. The Plan serves
as a master plan for ITS deployment for ten years and beyond. It defines roles and responsibilities of the
various ITS Stakeholders throughout the Region and establishes other technical goals to avoid duplication
of investments in infrastructure, provides the ability to share data among agencies, and brings the Dixie
Region into compliance with nationally established ITS Architecture standards.
A product of the ITS Architecture Plan was a listing of proposed projects based on short-tern, mid-term
and long-term timeframes. A brief listing of the projects is included below. A more detailed table with
description and progress is kept and updated by the City of St. George.
Projects recommended by the plan are listed below:

24
Short-Term Mid-Term Long-Term
Dixie Regional Traffic
Control Center (TCC)
CommuterLink Marketing Weather Warning
System
Communications Plan Computer Aided Dispatch
Integration with
CommuterLink
Northern Parkway
Corridor –Phase 2
Emergency Automated
Vehicle Location
Dixie Regional Emergency
Operations Center (EOC)
Regional Traveler
Information
Emergency Vehicle
Preemption
Incident Management
Strategies
Telegraph Street
Corridor
Trailblazers Incident Response Vehicles Transit Operations
Upgrade
100 South Corridor ITS Architecture Update
Bluff Street Corridor -
Phase 1
Maintenance Coordination
Bluff Street Corridor -
Phase 2
700 South Corridor
Southern Parkway
Corridor - Phase 1
I-15 ITS – Phase 1
Southern Parkway
Corridor – Phase 2
I-15 ITS – Phase 2
State Route 9 Corridor Northern Parkway Corridor –
Phase 1
Sunset Boulevard Corridor Red Hills Parkway
Red Cliffs Drive Corridor
River Road Corridor
Snow Canyon Parkway
Corridor
Western Parkway Corridor –
Phase 1
Western Parkway Corridor –
Phase 2
Chapter 9 – Congestion Management
As a small-urbanized area, the Dixie Metropolitan Planning Organization is not required to develop a
Congestion Management Plan. However, the DMPO recognizes the value in understanding how project
development impacts congestion/delay time. This brief analysis identifies some of the impacts associated
with congestion.
There are many ways to describe congestion on a transportation network. For this plan, the total vehicle
hours were compared on the entire transportation system in the model year 2040 in both the build and no-
build scenarios. A reduction in congestion is realized by building the projects shown in the ‗Projects &
Phasing list‘ as illustrated in the ―Network Travel Time‖ chart below.

25
The ―Network Travel Time‖ chart compares
total network travel time in year 2040 for the
build v. no-build alternatives. The red bar
represents 132.6 million vehicle hours traveled
in the no-build scenario where current
capacities are maintained but not expanded.
The blue bar represents 108.2 million vehicle
hours traveled if all the projects are built. Thus
the build scenario represents a total savings of
24.4 million vehicle hours per year leading up
to and beyond 2040.
The ―2040 Daily Travel Times ‗A‘‖ table
assumes a snapshot in time in 2040. It shows a No Build scenario resulting in 363,249 daily network
travel time hours, or a 23% increase in delay above the Build scenario of 296,380 hours of daily travel
time.
The ―2030 Daily Travel Times ‗B‘‖ table compares the No Build scenario, separately with 4 individual
projects taken from the phased list: Interstate 15 widening, the Dixie Drive Split Interchange between
Bluff and Dixie Drive, the Southern Parkway, and the Western Corridor. Of the four projects selected, the
I-15 project reduces the most delay (D) on the network by 76,000 hours, the Western Corridor 43,000
hours, the least, but each has a significant impact on delay reduction on the network.
The ―Travel Time Results ‗A‘‖ chart compares one additional project to the mix the Southern Parkway to
SR-9 in Hurricane, showing the build no build comparison and the cumulative delay per day in hours
from 2005 to 2025.
The ―Cost Benefit Analysis‖ table shows the time saved in hours
of the build scenario, (building all projects in the long range plan)
assuming two scenarios, hourly delay cost of $5 and of $10, both
showing a positive ratio over 1.0: 1.69 at $5 and 3.37 at $10
In summary, managing congestion on a network with limited
capacity growth due to topography constraints puts heavy pressure
on decision makers to make every attempt to implement the
projects in this plan to serve the population and travel demand expected in year 2030. The mix of
highway, public and private transit, and bicycle pedestrian facilities will help maintain the quality of life
and economic growth of Utah‘s Dixie.
Table 9 - Daily Travel Times ‘A’
Condition
2040 Daily Network
Travel Time (hours)
No Build
363,249
Build
296,380
0
50
100
150
No-build Build
132
Million
108
Million
Mil
lio
ns
2040 Build v. No-build
Network Travel Time(Annual Hours)

26
Chart 2 - Travel Time Results ‘A’
Table 11 - Cost Benefit Analysis
Time Saved (hrs)
Cost Benefit ($5/Hr)
Cost Benefit ($10/Hr)
Total Estimated Roadway Improvement Cost
Cost to Benefit Ratio ($5/hr)
Cost to Benefit Ratio ($10/hr)
483,625,000 $2,418,125,000 $4,836,250,000 $1,434,000,000 1.69 3.37
With these factors in mind, the Dixie MPO encourages the reduction and management of
congestion through the implementation of several transportation tools including ITS Message
Boards, TOC, Traffic Management, Ramp Metering, Reversible Lanes, Cross-over left turn lanes,
and transit projects including the implementation of a Bus Rapid Transit line. These congestion
reducing tools are further recommended for consideration in each new project.
0
50,000
100,000
150,000
200,000
250,000
300,000
350,000
2,005 2,010 2,015 2,020 2,025
Year
Netw
ork
Tra
vel T
ime P
er
Day (
Ho
urs
)
NO BUILD
BUILD
I-15 Widening
Split Interchange @ Bluff and Dixie
Western Corridor
Southern Parkw ay to Airport
Southern Parkw ay to SR 9

27
Chapter 10 – Corridor Preservation
The preservation of transportation corridors is important to consider in any community in order to manage
possible future congestion and to purchase needed right of way as inexpensively as possible. The degree
of importance increases in areas with high historical and projected population growth. Washington
County and the DMPO area have and will, according to projections, experience high growth. Some
estimates indicate that early purchase of transportation corridors can result in costs at one-fifth or one-
sixth of the amount needed if the purchase is put off. Of course it is difficult to tie down exact costs
especially in an unsure economy.
Because of the above factors and after much discussion, the Washington County Board of Commissioners
formed a county-wide Council of Governments (COG) to consider, among other things, projects which
may benefit from corridor preservation. The COG developed a list of projects and is collecting revenues
from vehicle registration fees to fund projects into the future.
The current list of prioritized projects is below.
Combined
RANKName of Roadway
1 Bluff Street - from SG Blvd to Sunset Blvd
2 The Southern Parkway
3 Indian Hills Drive
4 Snow Canyon Parkway / Snow Canyon Drive Roundabout
5 Extension of Washington Dam Road to Southern Parkway
6 Western Corridor (100' corridor from Ivins to Santa Clara)
7 Purgatory Road - from SR-9 to Washington Dam Rd
8 Western Corridor @ Sun River
9 400 South 200 East Roundabout
10 3000 South (between 1150 W & Sand Hollow Rd)
11 Toquerville to Leeds connection
12 Kolob Rd relocation / reconstruction at SR-9
13 1400 West (between 1300 S & 600 N)
14 Shoulder widening along SR-9 in various locations
15 Toquerville SR-17 Bypass
16 SR-9 to SR-59 connection thru Sheep Bridge or Rockville / Smithsonian Butte
17 900 East - Virgin River Crossing
18 SR-59 to SR-9 or Southern Parkway
19 Hurricane Valley to Leeds Connection

28
Chapter 11 – Environmental Mitigation
The Dixie MPO recognizes that transit, road, and
trail projects all bring positive and negative impacts
on physical and societal environments. Therefore the
MPO strives to establish steering and stakeholder
committees to guide early corridor planning studies.
Committees are comprised of resource agencies,
land managers, environmental groups, developers,
and others who consider impacts to air quality,
farmland, fish and wildlife, historical/archeological
resources, geologic hazards, floodplains, water
quality, and wetlands.
While corridor planning requires only a broad
consideration of potential environmental impacts – a
more detailed analysis is required as each project advances into the Environmental Assessment (EA) or
Environmental Impact Statement (EIS) phase prior to project construction. Following is a discussion of
potential environmental issues that require analysis of impact, concern, avoidance, or mitigation
remedies:
Impacts
Farmland Impacts
Preservation of farmland is increasingly difficult in the Dixie Region. The shrinking availability of land,
incentives to sell and give way to development, and the area‘s harsh desert environment are combining to
reduce the supply of farmable land in Dixie. Incentives for jurisdictions to protect and preserve farm
environments may not be strong enough to overcome these market forces that are driving a growth in
population and consuming once farmable land for commercial and residential use.
Fish and Wildlife Impacts
The following table presents federally threatened and endangered species, State sensitive species found
throughout the Dixie Region. Although these species are identified for long range planning purposes and
early corridor preservation studies, a more detailed investigation of
impacts, avoidance, or mitigation is required at the Environmental
Assessment or Environmental Impact Statement stages of
environmental analysis.

29
Washington County List of Utah's Federally Listed
Threatened(T), Endangered(E), and Candidate(C) Species
This list was compiled using known species occurrences and species observations from the Utah
Natural Heritage Program‘s Biodiversity Tracking and Conservation System (BIOTICS); other
federally listed species likely occur in Utah Counties. This list includes both current and historic
records. (Last updated on November 9, 2010)**.
Common Name Scientific Name Status
Plants
Siler Pincushion Cactus Pediocactus sileri Threatened
Shivwits or Shem Milkvetch Astragalus ampullarioides Endangered
Holmgren Milkvetch Astragalus holmgreniorum Endangered
Gierisch Mallow Sphaeralcea gierischii Species of Concern
Dwarf Bearclaw-poppy Arctomecon humilis Endangered
Reptiles/Amphibians/Fish
Virgin Chub Gila seminuda Endangered
Woundfin Plagopterus argentissimus Endangered
Relict Leopard Frog Rana onca Species of Concern
Desert Tortoise Gopherus agassizii Threatened
Birds
Greater Sage-grouse Centrocercus urophasianus Species of Concern
Yellow-billed Cuckoo Coccyzus americanus Species of Concern
Mexican Spotted Owl Strix occidentalis lucida Threatened
Southwestern Willow Flycatcher Empidonax traillii extimus Endangered
Mammals
Utah Prairie-dog Cynomys parvidens Threatened
Gray Wolf Canis lupus Endangered
Brown (Grizzly) Bear Ursus arctos Extirpated
** Created by the Utah Division of Wildlife Resources - November 9, 2010
Note: Please contact the U.S. Fish and Wildlife Service (801-975-3330) for the purpose of
consultation under the Endangered Species Act.

30
Historical/Archeological Impacts
Historical and archeological sites are another component that is hard to measure, but adds to the character
and quality of life in the Dixie Region. Avoidance, mitigation, and restorations are options to consider as
planned solutions reach the environmental analysis phase.
Although the Dixie Region has not been completely surveyed for archaeological resources, the MPO
boundary areas are likely to contain numerous archaeological sites.
The ancestral Southern Paiute are believed to have moved into this region sometime between AD 1000
and 1300. They were hunters and gatherers who practiced a seasonal round of resource collection and
processing over a broad and diverse landscape. In southern Utah, however, some Southern Paiute groups
became small-scale farmers and diverted water from the Virgin and Santa Clara Rivers and other smaller
streams to cultivate garden plots. Euro-American explorers to this region, including Dominquez and
Escalante in 1776 and Jedidiah Smith in the 1820s, reported seeing irrigation ditches and small check
dams constructed by the Southern Paiute to divert water from the rivers and streams onto their fields of
corn, beans, and squash. A Southern Paiute site, located on private land near the study area, was
excavated by archaeologists from Brigham Young University in the 1980s. This site contained evidence
of maize cultivation that dated to AD 1700 and 1830 (Allison 1988).
As part of the NEPA process, consultation will be required with Native American tribes that may have an
interest in the study area. Final determination of tribes to include in the consultation process will be made
during the NEPA process. The tribes with interest in the study area include the Hopi Tribe; the Navajo
Nation; the Paiute Indian Tribe of Utah and its Shivwits, Cedar, Indian Peak, and Kanosh Bands; the
Uintah/Ouray Ute; the Las Vegas Paiute; the Moapa Paiute; and the Kaibab Paiute.
Few surveys of historic resources have occurred within the study area. Historic resources in the study area
relate to the 18th and 19th century Euro-American explorations. In 1776, two Franciscan priests from
New Mexico, Dominquez and Escalante, traveled through southern Utah looking for an overland route to
the Spanish colonies in California. This travel route came to be known as the Old Spanish Trail. The main
branch of the Old Spanish Trail followed the Santa Clara River south from Mountain Meadows and then
veered to the west over the low pass of Utah Hill (old Highway 91). In 2001, the Old Spanish Trail was
designated as a National Historic Trail.
By the early 1850s, the first colonies were being established by members of the Church of Jesus Christ of
Latter-day Saints (Mormons) in southern Utah. Some of the structures built by these colonies may be
found in the study area; these structures include irrigation systems along the Santa Clara and Virgin
Rivers and sites associated with stock animals.
Geologic Hazards
The geologic diversity within the State of Utah is well known and much of that diversity and
topographical constraint exists in Dixie. The region is not immune to earthquakes, landslides or
volcanoes. The MPO encourages transportation solutions to take in to account the known geologic
hazards in plans, designs, and construction to prevent, avoid, or mitigate as much as possible current,
ongoing, and future geologic events.
Water-body and Floodplain Modification

31
Washington County in cooperation with FEMA and other agencies has produced an updated floodplain
plan to deal with the aftermath of the January 2005 Flood in Dixie and to prevent and control floodwaters
in future significant storm events. This plan is referenced in the Appendix of this document and is
available at the offices of Washington County. Transportation needs solutions/projects must be planned
designed and built with these requirements and conditions in mind.
Water Quality Impacts
Water quality can be greatly impacted by the amount of hard surfaces (including roadways) in a region.
Hard surfaces lead to polluted runoff instead of the water table‘s natural percolation cycle.
Wetland Impacts
Wetlands provide an invaluable resource to our ecosystem. Section 404 of the Clean Water Act protects
wetlands from development without a permit from the Army Corps of Engineers. Designing the
roadways to protect the wetlands in the Dixie Region is in accordance with the requirements of the Clean
Water Act and leads to a more sustainable community.
Climate Change
Local discussions of climate change effects are minimal within the Dixie MPO. However, MPO
executives and planners regularly discuss flood control plans and recognize the need to construct roads
and bridges to accommodate heavy runoff volumes. Flooding events in 2005 and 2011 stimulated local
awareness of potential hydrology concerns in a
changing environment and validated the need to over-
plan bridge facilities and other flood treatments within
the flood plains and waterways of Southwestern Utah.
Air Quality
Washington County, Utah, is currently considered an
attainment area as defined by the Clean Air Act and
therefore is not regulated by the EPA or the Utah
Division of Air Quality. However, proper planning will
be required if the region reaches non-attainment status
in the coming years or if EPA regulations are tightened.
In non-attainment status, plans to reduce personal automobile dependency would become vital. In the
interim ―attainment‖ years, the MPO has outlined the following proactive principles.
Although there are many sources of air pollution, including ambient air moving in from other parts of the
region, auto emissions, vapor gases, and dust are common contributors to air pollution locally. Mode/trip
decisions, reducing single occupancy vehicles, improving traffic flow and recovering gaseous vapors are
some of the ways to protect the quality of air. These and other strategies will be looked at and
recommended to local governments for their consideration and adoption. The Dixie area has been
growing rapidly for many years and will continue to grow to build out conditions, and should look
seriously at protecting its air shed quality.
The MPO anticipates continued growth in vehicle miles of travel, and the associated congestion and
traffic delays. Some societal tendencies are catching hold toward the use of energy efficient vehicles, but
the potential for air quality problems, especially for Ozone, is real for Utah's Dixie.
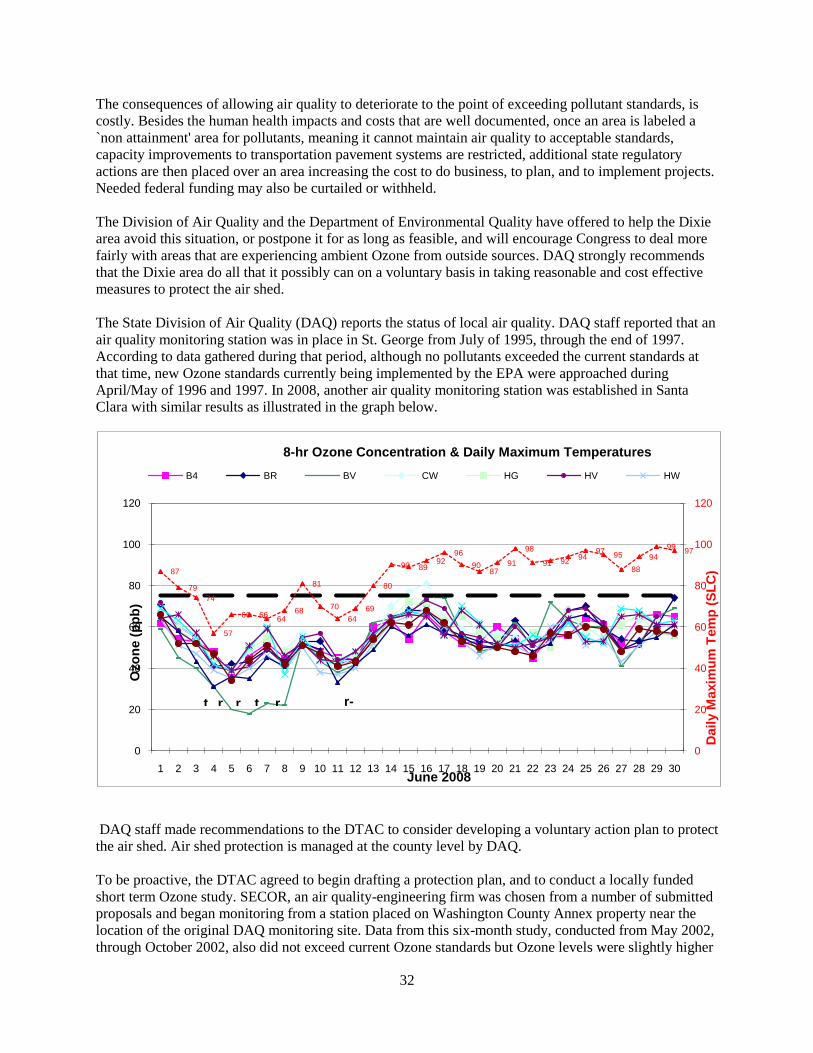
32
The consequences of allowing air quality to deteriorate to the point of exceeding pollutant standards, is
costly. Besides the human health impacts and costs that are well documented, once an area is labeled a
`non attainment' area for pollutants, meaning it cannot maintain air quality to acceptable standards,
capacity improvements to transportation pavement systems are restricted, additional state regulatory
actions are then placed over an area increasing the cost to do business, to plan, and to implement projects.
Needed federal funding may also be curtailed or withheld.
The Division of Air Quality and the Department of Environmental Quality have offered to help the Dixie
area avoid this situation, or postpone it for as long as feasible, and will encourage Congress to deal more
fairly with areas that are experiencing ambient Ozone from outside sources. DAQ strongly recommends
that the Dixie area do all that it possibly can on a voluntary basis in taking reasonable and cost effective
measures to protect the air shed.
The State Division of Air Quality (DAQ) reports the status of local air quality. DAQ staff reported that an
air quality monitoring station was in place in St. George from July of 1995, through the end of 1997.
According to data gathered during that period, although no pollutants exceeded the current standards at
that time, new Ozone standards currently being implemented by the EPA were approached during
April/May of 1996 and 1997. In 2008, another air quality monitoring station was established in Santa
Clara with similar results as illustrated in the graph below.
DAQ staff made recommendations to the DTAC to consider developing a voluntary action plan to protect
the air shed. Air shed protection is managed at the county level by DAQ.
To be proactive, the DTAC agreed to begin drafting a protection plan, and to conduct a locally funded
short term Ozone study. SECOR, an air quality-engineering firm was chosen from a number of submitted
proposals and began monitoring from a station placed on Washington County Annex property near the
location of the original DAQ monitoring site. Data from this six-month study, conducted from May 2002,
through October 2002, also did not exceed current Ozone standards but Ozone levels were slightly higher
87
79
74
57
66 6664
68
81
70
64
69
80
90 8992
96
9087
91
98
91 9294
9795
88
94
9997
0
20
40
60
80
100
120
0
20
40
60
80
100
120
1 2 3 4 5 6 7 8 9 10 11 12 13 14 15 16 17 18 19 20 21 22 23 24 25 26 27 28 29 30
Daily M
axim
um
Tem
p (
SL
C)
Ozo
ne (
pp
b)
June 2008
8-hr Ozone Concentration & Daily Maximum Temperatures
B4 BR BV CW HG HV HW
t r r t r r-

33
when compared to the 1995 97 DAQ data. Also, data available from a permanent monitoring site in
Mesquite, Nevada shows very similar Ozone concentrations to St. George, according to SECOR. These
studies, together with other data from the southwestern region of the US, show that Ozone levels
approaching .08 ppm are prevalent regardless of urbanized status. The results of the SECOR study is
available for review at the Dixie Transportation Planning Office, Five County Association of
Governments, 1070 W. 1600 S., St. George, UT 84770.
Ozone standards were changed in 2010, but subsequently stayed on appeal of a law suit:
―In January 2010 EPA proposed stricter standards for smog. As part of EPA's extensive review of
the science, Administrator Jackson will ask the Clean Air Scientific Advisory Committee
(CASAC) for further interpretation of the epidemiological and clinical studies they used to make
their recommendation. To ensure EPA's decision is grounded in the best science, EPA will review
the input CASAC provides before the new standard is selected. Given this ongoing scientific
review, EPA intends to set a final standard in the range recommended by the CASAC by the end
of July, 2011.‖
The standard levels of acceptable Ozone were .075 ppm prior to the 2010 proposal. The proposed change
would bring that level down to .065 ppm to .070 ppm. According to DAQ information, regional Ozone
levels close to the new standard are being seen at monitoring sites throughout the southern Utah region,
from Four Corners, into the Grand Canyon, Zion National Park, Dixie and southern Nevada. DAQ also
suggests that a local condition is occurring in springtime such that when vegetation begins to green up
and temperatures are rising, the combination of emissions of nitrogen oxides (N Ox) and volatile organic
compounds (VOC) contribute to ozone formation, and should be included in the scope of emissions
inventory and non regulatory monitoring efforts.
Action Plan
A multi agency team is being established to develop a scope of work for DAQ non regulatory air
pollution monitoring in Dixie with the intent of determining local pollution levels for several pollutants,
but to especially focus on Ozone. The geographic scope will be the entire County of Washington.
This plan describes existing conditions, with various options/solutions followed by some
recommendations.
More stringent guidelines are available under EPA's new Ozone Flex Program for areas concerned about
potential future non attainment of either the 1 hour or 8 hour ozone standards, to achieve emission
reductions, secure public health benefits, and accrue possible credits to future planning efforts, to the
extent allowed by the Clean Air Act and EPA guidance or rules (See Attachment A).
Existing Conditions
Prevailing Winds in Dixie tend to move from the southwest in a northeasterly direction, almost on a
daily basis. This air movement helps to change the air, to `refresh it', in a word, on a regular basis.
However, the same prevailing winds are likely to carry contaminated air from nearby urban areas like,
Las Vegas, or even from the Los Angeles Basin, into and through; Dixie. Truckers who drive the 1 15
Corridor on a regular basis are convinced of this relationship. Of course, anyone may have an opinion, but
empirical results would be needed to determine the relationship and to affect public policy. Postponing
empirical results may compromise community health standards, would be unprofessional, and against the
operating values agreed to by DMPO partners.

34
Cooperate and coordinate with DAQ and other local stakeholders in developing and
Implementing a regional scope of work for non regulatory monitoring in Utah's Dixie
Encourage use of mobile monitoring equipment to help determine local and regional Ambient
source contributions
Participate in pollutant source inventorying and sharing other data, as needed
(See Appendix B for typical pollution source list)
Traffic Congestion is a contributing factor to level of air quality due to increase in pollutants, as vehicles
are queued up at intersections. Vehicles that are idling emit more pollutants than when operating at
optimum speed, which is around 30mph. Delay time at specific intersections may be an indicator of
Congestion. Another indicator may be average road link speeds that fall below 15 mph. If feasible, speed
data may be available or determined that will be useful in making traffic flow impact decisions. The Dixie
MPO and its partners recommend the following strategies for local government consideration and action:
Encourage Intersection Flow improvements & Traffic Signal synchronization
Consider one way streets where feasible (cost of signage/stripping)
Maintain capacity, speed, and function of arterial /collector roads & corridors
Encourage business and industry to establish Flexible employee work hours
Encourage placement of fiber conduit in all new construction or rehabilitation projects for
future ITS strategies
Encourage municipal purchase of unused buried conduit
Municipal Corporation Policy varies throughout Dixie as to visible efforts to improve air quality. St.
George City for example, has executed resolutions such as tree planting, especially in parking lots, which
reduces vapor emissions from automobile gas tanks; encourages non polluting industry; supports and
operates public transit; and has had a goal of having a bicycle/pedestrian trail within 15 minutes of every
home. Communities in the region are all actively supporting paths and trails and their connectivity The
Dixie MPO encourages the following strategies for local government support and action:
Landscaping/tree planting strategies, especially for parking lots
Fleet Vehicle fueling in cool hours of the day
Covering all solvent tanks or open storage of vaporous gases/liquid
Encourage non polluting industry
Encourage any polluting industry to apply modern emissions technology
Encourage Volatile Organic Compounds (VOC) recovery at all fueling stations
Encourage fleet vehicle preventive care as recommended by manufacturers
Support van and car-pooling of employees (no interest loans available)
Support regional Public Transit when and feasible
Encourage fleets that use alternative fuels (incentives available)
Support Walk-able Communities and neighborhoods (land use, zoning, codes)
Support MPO Long Range Plans, Policy, and Standards in local development decisions
Private/Public Partnerships can go a long way in encouraging business and citizen contributions to air
quality protection. Encourage the Chambers of Commerce to partner with local business, colleges, and
industry to support similar protection measures as listed above.
Dixie MPO Work Plan:
1. Participate with DAQ and local partners in non regulatory monitoring
2. Create Public/Private Education Program

35
Distribute information to and through:
Chamber of Commerce members
Municipalities, County
Public Agencies
Schools, College
Neighborhood organizations
Coverage in local newspapers
Newsletters
3. Include Air Quality Protection strategies in the Long Range Transportation Plan
4. ITS technology should be reviewed and appropriate and effective tools implemented when
feasible and affordable.
5. Assist DAQ in conduct of emissions inventory of sources of potential pollutants
6. Seek voluntary action consistent with prevention or control of related emissions
7. Seek funding for local action planning from the Environmental Protection Agency
Integration of NEPA into the Planning Process
While the above elements are important components of the natural and built environment in the Dixie
Region, and each deserves their own thoughtful and comprehensive analysis. This plan does not attempt
to perform a comprehensive Environmental Analysis or Environmental Impact Statement as regulated by
National Environmental Policy Act (NEPA). At this point, projects included in this plan are for planning
and modeling purposes only. Some projects amount to little more than a proposed line on a map. It is not
intended to identify specific alignments for planned corridors. When a formal proposal is made, the
NEPA process will follow.
Unified and Cooperative Planning Processes
In 2009, public and private planners throughout Utah began creating the unified planning tool ―U-Plan‖ –
a web-based information platform designed to allow road and utility planners to jointly access
information on rights-of-way, infrastructure lines, environmental concern areas, habitat areas, and other
built and natural resources. The Dixie MPO views U-Plan as an integral tool within the transportation
planning process and encourages outside agencies to participate.
Chapter 12 – Pedestrian/Bicycle Facilities
As stated in the ―Vision‖ chapter above, pedestrian and bicycle facilities are an integral part of the area‘s
transportation system. Vision Dixie calls for the implementation of ―complete streets‖ criteria to ensure
streets and roads work for drivers, transit riders, pedestrians, and bicyclists, as well as for older people,
children, and people with disabilities. Complete Street designs are also intended to improve motorist
attitude and behavior toward other street users.
Previous MPO plans quote the efforts of the Dixie Bicycle and Pedestrian Committee involved in
recommending trail plans in 2007 through a document titled ―Bicycle and Pedestrian Facilities, A Guide
for Meeting the Needs of Bicyclists and Pedestrians.‖ The document was created for the Washington
County area. Although the original committee disbanded, a newly formed Washington County Bicycle
Advocacy Committee (WCBAC) subscribes to the ideals asserted in the original plan:
―Vision: The Dixie region will become a place where people can walk or bike as a part of their
everyday lives. Residents and visitors will be able to walk or ride with confidence, safety, and
security in every community. New and improved facilities and services will make bicycle and
pedestrian trips more pleasant, more convenient, without conflict with motorized vehicles, and

36
with minimal barriers to the mobility impaired.
Bicyclists and pedestrians will become an ordinary
and accepted part of the transportation system.‖
(Bicycle and Pedestrian Facilities, A Guide for
Meeting the Needs of Bicyclists and Pedestrians,
2007)
―Goals and Objectives:
Goal 1. Facilitate the appropriate design,
construction, and maintenance of bicycle and
pedestrian facilities.
Goal 2. Support a multimodal transportation
system for all new construction and
reconstruction projects.
Goal 3. Encourage education programs that improve bicycle and pedestrian safety.
Goal 4. Promote bicycling and walking.‖
The 2007 document also lists goals, design guidelines, amenity lists, maintenance standards, and
implementation strategies to enhance bicycle and pedestrian facilities. The newly formed Washington
County Bicycle Advocacy Committee subscribes to these guidelines, some of which have already become
official city standards. The WCBAC has also produced a map of hoped-for bicycle facilities throughout
the MPO area. The map and standards were presented to the Dixie MPO Technical Advisory Council on
February 2, 2011 and were received with interest. Members of the Advisory Council noted that official
adoption of WCBAC principles and plans is the individual responsibility of their respective city policy
boards and agreed to facilitate dialog between their policy boards and the WCBAC. However, the Council
stressed that city policy boards must be involved in the process of officially amending bike/ped plans.
The ―official‖ trails map, as formally adopted by city policy makers, is attached below as the ―MPO
Trails Map.‖ Also attached is the ―WCBAC Trail Request Map.‖ Moving forward, the MPO will promote
open dialog among bicycle advocacy groups and the MPO cities to further develop plans and policies
amenable to all stakeholders including the Eastern Washington County Trails Work Group, UDOT, etc.
Of interest, bicycle transportation advocates have identified the following needs within the MPO in
regards to this form of transportation:
Concurrent inclusion of cycling facilities in the planning and design efforts of vehicle facilities
Increased funding and priority to bike/ped facilities
Increased facilities to provide a comprehensive connected transportation network
Enhanced facility maintenance
Public education
Increased partnerships
Increased coordination between public agencies
Increased encouragement to walk or cycle.

37
Chapter 13 – Transit Activities
SunTran provides transit service for the City of St. George and currently operates fixed bus routes and
paratransit (ADA) service between 6:00 AM and 8:00 PM Monday through Friday and from 8:00 AM to
6:00 PM on Saturday. There is no service on Sundays or major holidays. The system consists of four
fixed bus routes currently carrying a total of 375,000 passengers per year. SunTran has experienced
significant growth, including 35 percent annual growth since 2003. The existing routes operate on 40-
minute headways and provide transit service to downtown St. George, Red Cliffs Mall, Dixie State
College, the Dixie Center, and several other commercial and residential areas within the St. George city
limits. The map on a following page shows the four existing fixed SunTran routes.
Yearly ridership figures by month and daily transit ridership (2010) for the four fixed routes as well as
corresponding population and person trips for the areas which are currently being served by transit are
presented in the two tables following.
The table also summarizes mode split estimates, which describe the share of total person trips captured by
transit (daily transit ridership/total number of person trips calculated by the model), for the existing
SunTran system.
Transit and Bus Rapid Transit (BRT)
Two studies, dealing with transit and BRT feasibility, have been completed in the recent past that indicate
the viability of increased transit services in the Washington County area. The studies are the ‗Dixie Bus
Rapid Transit feasibility Study‘ (including addendum) and the ‗Hurricane to Zion Canyon Transit Study‘.
The ‗Dixie Bus Rapid Transit feasibility Study ‘evaluated rapid transit service between the City of St.
George, Hurricane City, and the new St. George Airport. BRT service from St. George to Hurricane and
to the airport is a viable option for the future that should be preceded by conventional bus services along
the corridors. Transit ridership forecasts for this study were calculated based on population, employment,
and trip demand projections estimated by the most recent available version of the Dixie MPO regional
travel demand model. See table following.

38
The travel demand model, and consequently the transit ridership projections, provides expected growth
for long-range planning scenarios (year 2035 forecasts). Although BRT service to Hurricane and the
airport is not a viable transit service option in 2010, long-range growth projections for the Washington
County urban and urbanizing areas are expected to accommodate a viable BRT system that runs in mixed-
traffic when area populations and employment meet short-range growth levels. See tables following
Information gathered from operating transit lines associated with National Parks was utilized to determine
the feasibility of a transit line extending to Zion National Park. The range of local ridership information
is quite large, ranging from about 6,000 to about 75, 000. The annual local ridership in the market area of
the Hurricane to Zion Park line is about 47,000. The Hurricane to Zion Canyon Study also notes that the

39
viability of a transit line extending to Zion Park is dependent on a transit link from St. George City to
Hurricane City. The following table includes ridership estimates and forecasts for local and visitor (Zion
Park).
The implementation of conventional bus service to Hurricane and the airport is a very logical step toward
the future development of BRT service. Lower level transit investments can be gradually improved,
allowing BRT to be phased into operation as population and transit demand increase. BRT ridership
forecasts were presented in terms of future planning years as well as socio-economic growth conditions.
This allows forecasts to evaluate opportunities to phase in BRT service even if there are some changes to
the timing of growth projections assumed by the regional travel demand model. When a transit link is
completed to Hurricane, a line to Zion National Park should be considered. See the Transit Services Map
at the back of this document.
Chapter 14 – Public Involvement
Types of Public Involvement
The International Association of Public Participation defines five levels of public involvement in the
IAP2 Spectrum of Public Participation. These five levels are 1) Inform, 2) Consult, 3) Involve, 4)
Collaborate, and 5) Empower.
Public involvement at each of these levels is vital as the Dixie MPO strives to plan facilities to meet the
transportation needs through 2040. The MPO uses a web site, legal notices of meetings, news releases and
a variety of news letters to inform constituents of meetings, studies, plans, and opportunities to become
involved in the planning process. The web site typically experiences ____ hits per month, and news
releases are disseminated throughout the metropolitan area through a variety of news outlets to meet the
goal of informing the public of current and planned projects.
The MPO sponsors an annual ―Dixie Transportation Expo‖ to gather public comments and respond to
inquiries, consult with citizen groups, and collaborate with them to realize potential solutions. An
estimated 700 to 900 people attend the ―Expo‖ annually where they are asked to comment on individual
projects, plans, studies, environmental issues, future initiatives, etc. as transportation plans are laid and as
projects move forward through the process from concept to construction and maintenance. The 2011
―Expo‖ is planned for March 8.
In some areas, the MPO has also found ways to empower citizen committees to directly influence plans
for the future. The Vision Dixie process discussed earlier in this document was based on citizen input and
attempts to capture the public‘s vision for the metropolitan area of the future – and then plan to that
vision. The bicycle/pedestrian trail section of this plan was also reviewed and expanded through the
efforts of a citizen‘s bicycle committee. That committee not only reviewed individual master plans from
the respective cities of the MPO, but also recommended various changes and improvements to those plans
and is committed to work with various local governments to refine and implement them.

40
Moving forward, the MPO is committed to include public involvement initiatives its decision-making
efforts, to communicate public concerns to MPO voting members, and to educate the public on MPO
deliberation, options, strategies, and plans of regional significance.
Public Comments:
Public comments from the 2011 Transportation Expo and in the advertised public comment phase of this
plan are noted below with an MPO RESPONSE IN ALL CAPS:
Very well done and informative.
Nice to see each community addressing pending matters.
Nice to see biking and walking paths planned for pending projects.
Red Hills Desert Preserve Road – I am very much against this project. It is unnecessary,
extremely wasteful of limited federal, state & local funds and extremely damaging
environmentally. People don‘t need to get somewhere all the time within five minutes. Preserve
that area north of St. George City.
RESPONSE – THE PURPOSE OF THE LONG-RANGE PLAN IS TO USE A
SCIENTIFICALLY CONSTRUCTED TRAVEL DEMAND MODEL TO IDENTIFY
POTENTIAL TRANSPORTATION CORRIDORS AND ANTICIPATE THE NEED FOR
PROJECTS. ANY FUTURE ROAD PROJECTS THAT MOVE FROM THE LONG-RANGE-
PLAN TO CONSTRUCTION WILL NEED TO MEET NEPA REGULATIONS ON A
PROJECT BY PROJECT BASIS AND DEAL WITH ANY NATURAL RESOURCE OR
OTHER IMPACTS AT THE ENVIRONMENTAL STUDY PHASE OF PROJECT DESIGN.
THE TRAFFIC DEMAND MODEL, POPULATION GROWTH FORECASTS AND
MEASURED TRAFFIC TRENDS IDENTIFY A NEED FOR A NORTHERN
TRANSPORTATION CORRIDOR, IN CONJUNCTION WITH TRANSIT SERVICES, TO
AVOID UNACCEPTABLE LEVELS OF CONGESTION, AIR POLUTION, AND SAFETY
HAZARDS ON THE REGIONAL ROADWAY NETWORK.
It‘s about time someone had enough courage to put a road through the Red Hills Desert Preserve.
We have needed that for a very long time.
I have lived here for 20 years and am amazed at the foresight and planning of all these projects.
I am especially impressed with the Southern Parkway and new Dixie Drive Interchange.
We want trails for ATV‘s (motorized)
My residence is approximately one mile north of I-15 and Green Springs. The noise in the
evening hours is very loud. Have sound barriers in the future been thought of?
RESPONSE – NOISE IMPACTS ARE CONSIDERED ON A PROJECT BY PROJECT BASIS
AT THE INDIVIDUAL PROJECT DESIGN PHASE.
We would like to see Mall Drive Bridge as soon as possible. The sooner the better.
Please email a map of the long-range plan and schedule for countywide trails meetings.
Don‘t want parkway to go north of Green Springs and ruin our equestrian trails.
I commend you for moving forward with a parkway north of the City. That road should have
gone in years ago.
It is my understanding that Bluff Street is planned to be widened from 85 feet to 117 feet with an
additional lane being added in each direction.
What will it cost to acquire this additional 32 feet from adjacent business property owners? If the
land taken for the right-of-way removes their parking areas, will the business buildings be

41
purchased as well? Will any of these businesses be able to remain in business during
construction?
I understand that the 2030 traffic volume along Bluff Street between Sunset and the Boulevard is
anticipated to be 160% of the present 45,000 ADT. Is this correct?
That would mean that more than 70,000 ADT would be carried on Bluff Street. In reviewing the
2009 ADT volumes published by UDOT for the Salt Lake Urbanized Area, I cannot find any
surface streets with adjacent commercial land uses carrying 70,000 ADT. Only freeways carry
70,000 ADT.
Is it the Dixie MPO's intent to construct a freeway in this location?
RESPONSE – ACCORDING TO THE TRAVEL DEMAND MODEL, 2040 TRAFFIC
VOLUMES ON BLUFF STREET COULD BE REDUCED FROM 72,000 AADT TO 63,500
AADT WITH THE ADDITION OF A NORTH TRANSPORTATION FACILITY LIKE THE
WASHINGTON PARKWAY SHOWN IN THE LONG-RANGE-LAN.
We have reviewed the Dixie Metropolitan Planning Organization‘s (Dixie MPO) Draft Regional
Transportation Plan 2011 - 2040 (Plan), including the proposed phasing of future highway and
transit projects. Under recent transportation planning legislation (SAFETEA- LU), the resource
agencies and the Metropolitan Planning Organizations (MPO) are directed to coordinate on long-
range planning efforts; we believe that both transportation planning and Utah‘s natural resources
can benefit from these efforts. We attended the meeting of October 26, 2010, at which time the
MPOs, including the Dixie MPO, presented their preliminary draft long-range plans to State and
Federal resource agencies. We appreciate this opportunity to comment on your proposed Plan,
and also to comment more generally on landscape-scale planning opportunities.
General Comments
We support the Dixie MPO‘s involvement and leadership in the Vision Dixie process, a
landscape-scale effort intended to manage and direct urban growth in Washington County. We
encourage the Dixie MPO to incorporate ―green infrastructure‖ concepts within such landscape-
scale planning efforts, to identify priorities for land uses, opportunities for preservation and
restoration, and strategies for maintaining viable natural places and corridors within the
landscape. We believe the MPOs have a critical role in promoting landscape-scale green
infrastructure planning and encourage the Dixie MPO to take an active leadership role in this
area. We note that EPA and the Federal Highways Administration provide grants to support such
efforts, and believe numerous other State and Federal partners, including the Fish and Wildlife
Service, will be available to offer assistance.
At the October 26, 2010, meeting the Utah Department of Transportation (UDOT) provided an
introduction to uPlan, their recently-developed G1S-based transportation planning tool.
UDOT developed this tool to provide environmental data to inform the transportation planning
process, including the development of long-range plans. We support the use of a geographic
mapping tool that identifies environmentally-sensitive areas enabling transportation planners to
avoid red flag issues, use landscape-scale analysis for long-range planning, streamline project
development, and identify mitigation opportunities. The time is right to establish a GIS-based
application like uPlan; however, at this point we believe the ecological components of this tool
should be improved before its use. Improved ecological spatial data (e.g., high resolution wetland
and riparian data; sensitive fish and wildlife habitats; and priority areas for preservation,

42
restoration, and mitigation) are needed to make this a viable tool for planning, relative to
ecological resources. We believe sustained support and funding can translate into an improved
uPlan tool in the future. We encourage UDOT, MAG, and the other MPOs to support uPlan,
recognizing its current limitations as well as its future potential.
Specific Comments on the Draft Regional Transportation Plan 2011 - 2040
We provide the comments below to give the Dixie MPO and UDOT early feedback on the
proposed corridors. The comments include initial concerns relative to fish and wildlife resources,
including species listed under the Endangered Species Act (ESA). Because the corridors are
conceptual in nature, our comments are broad in scope and are not inclusive of all potential
concerns that could arise from a project-level analysis.
1. Great Northern – This corridor proposes to pass through the Red Cliffs Desert Reserve
(Reserve). The Reserve was established for the purpose of mitigating other development impacts
to the endangered desert tortoise in Washington County, in accordance with Section 10 of the
ESA. The land in the Reserve is designated Critical Habitat for desert tortoise and is conserved in
perpetuity under the Washington County Habitat Conservation Plan. Any transportation corridor
through the Reserve would greatly increase the risk to the desert tortoise population and
accelerate its decline by increasing fire frequency, noise disturbance, human access, and direct
mortality along the corridor. Construction of a new road through the Reserve conflicts the desert
tortoise recovery plan and is inconsistent with the terms of the County‘s Habitat Conservation
Plan. We highly recommend that this corridor be removed from the regional transportation plan.
2. Western Corridor – This corridor and its associated spurs could have potential impacts to plants
listed under the Endangered Species Act, including dwarf bear poppy and Holmgren milkvetch.
Some of the land within the area of the corridors is designated Critical Habitat. The extensive
induced urban growth accompanying these roads would substantially fragment habitat for these
endangered plants.
3. Virgin River Crossings – The ―Projects and Phasing‖ map and table in the draft Plan do not
identify each project by number making it difficult to determine where new crossings are
proposed. Any bridges over the Virgin River would impact designated Critical Habitat for
federally-listed fish and the Southwestern willow flycatcher. We recommend the number of
crossings over the Virgin River be minimized, and impacts to the river, floodplain, and riparian
habitats be avoided to the maximum extent possible.
We appreciate the opportunity to provide these comments.
RESPONSE – THE PURPOSE OF THE LONG-RANGE PLAN IS TO USE A
SCIENTIFICALLY CONSTRUCTED TRAVEL DEMAND MODEL TO IDENTIFY
POTENTIAL TRANSPORTATION CORRIDORS AND ANTICIPATE THE NEED FOR
PROJECTS. ANY FUTURE ROAD PROJECTS THAT MOVE FROM THE LONG-RANGE-
PLAN TO CONSTRUCTION WILL NEED TO MEET NEPA REGULATIONS ON A
PROJECT BY PROJECT BASIS AND DEAL WITH ANY NATURAL RESOURCE OR
OTHER IMPACTS AT THE ENVIRONMENTAL STUDY PHASE OF PROJECT DESIGN.
43
Appendix A –
POTENTIAL FUNDING SOURCES
Funding sources for transportation improvement projects are needed if the recommended projects
of the Transportation Plan are to be built. In the Washington County area, federal, state, and local
governments as well as private developers provide funds to pay for improvements.
Federal Funds:
The prior federal highway and transit bill SAFETEA-LU (Safe, Accountable, Flexible, and
Efficient Transportation Equity Act: A Legacy for Users) continues to fund federal transportation
programs under continuing resolutions. And a new federal highway bill is anticipated within the
next several months.
State Funds:
The Utah Department of Transportation receives state highway user revenues as well as state
general funds for highway construction and maintenance projects. The highway user revenues
sources include motor fuel taxes, special fuel taxes, vehicle registration fees, driver license fees,
and other fees. General funds include sales taxes and other taxes. In addition, the state has the
authority to issue bonds for specific highway projects.
A portion of the state highway user funds are made available to local governments for highway
construction. Seventy-five percent of these funds are kept by the UDOT for their construction and
maintenance program. The remaining 25 percent are made available to the cities and counties in
the state through the Class B and C Program.
Class B and C funds are allocated to each city and county by a formula based on population and
road mileage. These funds can be used for either maintenance or construction of highways,
although at least 30 percent of the funds must be used for construction projects or for
maintenance projects that cost over $40,000.
Safe Sidewalks Program has also been established by the legislature to fund the construction of
sidewalks on roads on the state system. The money is distributed through a formula based
partially on miles of state road in each UDOT Region. Each city and county located in the region
submits projects to the UDOT Region office, which then prioritizes them. A statewide committee
then makes the final project selection.
Local Funds:
Local government agencies have a variety of funding sources available to them for transportation
improvements. The primary source is from the general fund of the cities and counties. These
general funds can be used for construction of new roads or the upgrading or maintenance of
existing ones. Transportation projects, however, must compete with the other needs of the city or
county for the use of these funds.
Local governments have several other options for improving their transportation systems. Most of
these options involve some kind of bonding arrangement, either through the creation of a
redevelopment district, a more traditional special improvement district organized for a specific

44
project benefiting an identifiable group of properties, or through general obligation bonding
arrangements for projects felt to be beneficial to the entire entity issuing the bonds.
The Local Corridor Preservation Fund allows the Washington County AOG to collect vehicle
registration fees of $10 per vehicle for transportation corridor preservation. The Utah Department
of Transportation has responsibility for seeing that the major requirements of the legislation are
met, such as compliance with federal property acquisition procedures, and a locally adopted
access management plan, or ordinance.
Private Sources
Private interests often provide sources of funding for transportation improvements. Developers
construct the local streets within subdivisions and often dedicate right-of-way for and participate
in the construction of collector and arterial streets adjacent to their developments. Developers
should also be considered as a possible source of funds for projects needed because of the impacts
of the development, such as the need for traffic signals or arterial street widening.
Private sources also need to be considered for transit improvements which will provide benefits to
them. For example, businesses or developers may be willing to support either capital expenses or
operating costs for transit services which provide them with special benefits, such as a reduced
need for parking or increased accessibility to their development.
Following is a brief list of programs used to fund transportation projects within the Dixie MPO:
FEDERAL HIGHWAY ADMINISTRATION
Surface Transportation Program (STP)
o Dixie MPO cities
Congestion Mitigation / Air Quality (CMAQ)
Available only after DMPO reaches non-attainment status
Interstate Maintenance (IM)
National Highway System (NHS)
Surface Transportation Program
Urbanized Area
Small Urban
Flexible (Any-Area)
Transportation Enhancements
Highway Safety Improvement Program (HSIP)
Hazard Elimination
Railroad Crossings
Safe Routes to School (SR2S)
Bridge Replacement
Off System - Local
Off System - Optional
Federal Lands Programs
High Priority Projects (HPP)
Transportation Improvement Projects (TI)
Recreational Trails
45
FEDERAL TRANSIT ADMINISTRATION
(5307) Block Grant Funds
(5309) Discretionary Funds
(5310) Services for elderly and disabled
(5311) Grants for Outside Urban Area
(5340) High Density States Program
(5316) Job Access and Reverse Commute
(5317) New Freedom Program
STATE OF UTAH
State Construction
State General Funds
State Traffic
Corridor Preservation Funds
LOCAL
County (B Funds)
City (C Funds)
General Funds
Transit Sales Tax
Corridor Preservation Fund
PRIVATE
Donations / User Fee
Developer Funded Projects
Public/Private Partnerships
Appendix B
Typical Sources of N Ox and VOC:
Aircraft Purge Systems
Chemical Milling
Cold Solvents
Construction Equipment
Boiler Systems
Dip Tanks
Fueled Engines, mobile and stationary
Engine Test Facilities
Fueling Stations
Fueling Equipment
Fuel Tanks, mobile and stationary
Generators
Landscaping Equipment, engines
Paint Strippers

46
Painting Operations
Wastewater Treatment Plants
Sources of Air Quality Programs, Regulations, and Information:
Department of Environmental Quality, State of Utah
Division of Air Quality, DEQ, State of Utah
Environmental Protection Agency
The Ozone Flex Program: Voluntary Strategies to Reduce Smog (June 21, 2001)
Maps
The maps referenced throughout this document follow: