2010:123 CIV MASTER'S THESIS Benefit Realisation from Lean1018735/FULLTEXT01.pdf · the thesis is...
63
2010:123 CIV MASTER'S THESIS Benefit Realisation from Lean A case study approach to seizing the benefits André Wiinberg Luleå University of Technology MSc Programmes in Engineering Industrial Business Administration Department of Business Administration and Social Sciences Division of Industrial Organization 2010:123 CIV - ISSN: 1402-1617 - ISRN: LTU-EX--10/123--SE
Transcript of 2010:123 CIV MASTER'S THESIS Benefit Realisation from Lean1018735/FULLTEXT01.pdf · the thesis is...

2010:123 CIV
M A S T E R ' S T H E S I S
Benefit Realisation from LeanA case study approach to seizing the benefits
André Wiinberg
Luleå University of Technology
MSc Programmes in Engineering Industrial Business Administration
Department of Business Administration and Social SciencesDivision of Industrial Organization
2010:123 CIV - ISSN: 1402-1617 - ISRN: LTU-EX--10/123--SE
Benefit realisation from Lean
- A case study approach to seizing the benefits
André Wiinberg
Mentor: TorBjörn Nilsson
Luleå University of Technology
Master-thesis
Strategic Management and Business Development
Institution for Industrial Economics and Social Science
Preface
I would like to give a big and sincere thank you to all the people at Lundbeck. You have
sacrificed time and energy to respond my questions. Without your sacrifices this study
had not been able to be completed.
Particular would I like to thank Christian Houborg who has assisted me with guidance,
advices and access to interesting respondents. I especially want to thank you for being a
great mentor. Additionally I thank the subject experts Brian Maskell and professor Law-
rence Grasso for the given guidance.
My tutor TorBjörn Nilsson at Luleå Technical University has been particular helpful
and flexible during the most difficult period of the study.
Most importantly I would like to thank my family and relatives. I would not be writing
this preface if I had not been given your love and support.
Yours sincerely,
André Wiinberg
Hong Kong, S.A.R. China, 15 of July 2010

i
Sammanfattning
Organisationer använder sig av lean för att förbättra verksamheten. Målet är att leverera
kundvärde utan slöseri, där slöseri syftar på de aktiviteter som kunden ej är villig att
betala för. Ledningen måste dock förstå att för att verksamheten skall förbättras måste
de ekonomiska och konkurrenskraftiga fördelarna från lean realiseras och att detta inte
sker automatiskt. Syftet med uppsatsen är att förbättra ledningens förmåga att fånga de
finansiella och konkurrenskraftiga fördelarna av lean. Uppsatsen fokuserar på att för-
bättra ledningens förmåga att hitta potentiella lean förbättringar samt att säkerställa att
hela potentialen av förbättringen har blivit skördad genom att använda läkemedelsföre-
tagets H. Lundbeck A/S produktion som fallstudie. Uppsatsen baseras på en omfattande
litteraturstudie, e-mejl diskussioner med ämnesexperterna Brian Maskell och professor
Lawrence Grasso samt 13 semistrukturerade intervjuer med respondenter som arbetar på
olika nivåer inom Lundbecks produktion. Resultaten från fallstudien visar på att det är
den specifika organisationens behov som bestämmer hur ledningens skall arbeta för att
fånga fördelarna från lean. Ledningens förmåga att hitta potentiella lean förbättringar
kan förbättras genom att implementera en organisation styrd av värdeflödet, tillhanda-
hålla kostnadsrapporter över värdeflödet samt genom att sätta upp guidelinjer för data
som skall användas vid beslutsfattande inom organisationen. Dessa förbättringar hjälper
även ledningen att säkerställa att hela potentialen av en lean förbättring har blivit skör-
dad. Vidare visar resultaten att en tydligt strukturerad lean databas samt en utvidga
genomgång av lean processen hjälper ledningen att säkerställa att hela potentialen av en
lean förbättring har blivit skördad.
ii
Abstract
Businesses adopt lean to maximise its business; resulting in competitive and financial
benefits. The goal is to deliver customer value without waste. This will not be achieved
unless the management understand that lean benefits do not just happen. The purpose of
the thesis is to improve the management’s ability to seize the financial and competitive
benefits of lean by examining the pharmaceutical company H. Lundbeck A/S supply
operations and engineering function. The case study approach focuses on improving the
management’s ability to find potential lean improvements; and ensuring that entire po-
tential of the improvements has been harvested. The thesis is based on a comprehensive
literature review, e-mail discussions with the subject experts Brian Maskell and profes-
sor Lawrence Grasso and 13 semi-structured interviews with respondents working on
different levels within the organisation. The result from the case study shows that it is
the specific organisations needs that determine how the management’s ability to seize
the financial and competitive benefits of lean should be improved. The management’s
ability to find potential lean improvements can be improved by; implementing value
stream management, produce value stream costs reports and setting up ground data
guidelines. The improvements would also help the management to ensure that the entire
potential of the lean improvement has been harvested. Additionally a clear structured
tracking database, reviews of each lean initiative and aggregated lean effect on the value
stream performance would help the management to ensure that the entire potential of
the lean improvement has been harvested.

iii
Table of Contents
1 THEORETICAL FRAMEWORK ......................................................................................................... 1
1.1 BENEFIT REALISATION OF LEAN............................................................................................................... 1
1.2 PROBLEMATIC TO REALISE THE BENEFITS OF LEAN ....................................................................................... 2
1.3 FINDING POTENTIAL LEAN IMPROVEMENTS ............................................................................................... 4
1.3.1 Value stream analysis ........................................................................................................... 5
1.3.2 Value Streamed organisation ............................................................................................... 6
1.4 HARVESTING THE POTENTIAL OF LEAN IMPROVEMENTS ............................................................................... 7
1.4.1 Benefit realisation framework .............................................................................................. 7
1.4.2 Operational key performance focus ..................................................................................... 8
1.4.3 Value stream focus ............................................................................................................. 11
1.4.4 Lean Accounting ................................................................................................................. 14
2 PROBLEM DISCUSSION AND PURPOSE ........................................................................................ 16
2.1 PROBLEM DISCUSSION ........................................................................................................................ 17
2.2 PURPOSE ......................................................................................................................................... 18
Research question 1: ......................................................................................................................... 18
Research question 2: ......................................................................................................................... 18
2.3 CONTINUED DISPOSITION .................................................................................................................... 19
3 METHOD ..................................................................................................................................... 20
3.1 RESEARCH APPROACH ........................................................................................................................ 20
3.2 RESEARCH METHOD ........................................................................................................................... 21
3.2.1 The case – H. Lundbeck A/S ................................................................................................ 21
3.3 LITTERATEUR REVIEW......................................................................................................................... 22
3.4 METHODOLOGICAL APPROACH ............................................................................................................. 23
3.5 DATA COLLECTION METHOD ................................................................................................................ 24
3.6 METHODOLOGICAL PROBLEMS ............................................................................................................. 25
3.6.1 Validity ................................................................................................................................ 25
3.6.2 Reliability ............................................................................................................................ 26
4 EMPIRIC ...................................................................................................................................... 27
4.1 VALUE STREAM ANALYSIS .................................................................................................................... 27
4.1.1 Value stream analysis - Lundbeck SOE ............................................................................... 27
4.1.2 Value stream analysis – Operational value streams ........................................................... 27
4.1.3 Action plan .......................................................................................................................... 29
4.2 BENEFIT TRACKING OF LEAN ................................................................................................................. 30
4.2.1 Review of lean progress ...................................................................................................... 33
4.3 FINANCIAL CONTROL .......................................................................................................................... 33
4.3.1 Financial budget ................................................................................................................. 33
4.3.2 Production report................................................................................................................ 35
4.4 LEAN ACCOUNTING ............................................................................................................................ 36
4.5 ORGANISATIONAL STRUCTURE ............................................................................................................. 36
5 ANALYSIS .................................................................................................................................... 38
5.1 BENEFIT CLASSIFICATION ..................................................................................................................... 38
5.2 ESTIMATING THE POTENTIAL ................................................................................................................ 39
5.2.1 Ground data ........................................................................................................................ 39
5.2.2 Estimation method ............................................................................................................. 41

iv
5.3 A VALUE STREAMED ORGANISATION ...................................................................................................... 42
5.4 LEAN IS NOT A COST REDUCTION PROGRAM ............................................................................................ 42
5.5 LAY-OFF POLICY ................................................................................................................................ 43
5.6 FINANCIAL BUDGET ............................................................................................................................ 43
5.7 BENEFIT TRACKING SYSTEM ................................................................................................................. 44
5.8 REVIEW OF LEAN PROGRESS ................................................................................................................. 44
5.9 LEADERSHIP PARTICIPATION ................................................................................................................. 45
6 CONCLUSIONS AND DISCUSSION ................................................................................................ 47
6.1 RESEARCH QUESTION 1 ...................................................................................................................... 47
6.2 RESERACH QUESTION 2 ...................................................................................................................... 48
6.3 DISCUSSION ..................................................................................................................................... 49
6.4 SUGGESTIONS FOR FURTHER RESEARCH .................................................................................................. 50
REFERENCE LIST ................................................................................................................................... 51
Appendix 1: Interview guide
Appendix 2: Respondents
Chapter 1
1
1 Theoretical framework
The purpose of the thesis is to improve the management’s ability to seize the financial
and competitive benefits of lean. In particular the thesis attempts to improve the man-
agement’s ability to find potential lean improvements and ensure that the entire poten-
tial of the lean improvement has been harvested. The theoretical framework is presented
before the introduction to help the reader to understand the problem area of the thesis.
The theoretical framework presents theories relevant for the problem area. Initially the
section presents theories regarding benefit realisation of lean. The section then contin-
ues by describing the problem to realise benefits from lean. After this it is presented
how a business can find potential lean improvements. The section ends with describing
how a business can ensure that the entire potential of a lean improvement has been har-
vested.
1.1 Benefit realisation of Lean
Businesses adopt lean to maximise its business; resulting in competitive and financial
benefits (Ruffa, 2008). A benefit is defined by Glynne (2007) as an outcome whose na-
ture and value are considered advantageous by an organisation. Ward et al (2006) and
Sapountzis et al (2009) prefer to define a benefit as an advantage on a behalf of a par-
ticular stakeholder or group of stakeholders. The important point in the later definition
is that a benefit is owned by individuals or groups who want to obtain value from an
investment such as a lean initiative (ibid).
The process to achieve competitive and financial benefits is called benefit realisation
management. Benefit realisation management is the process that realises the benefits
that are achieved and manages the unexpected ones (Farbey et al, 1999). In lean benefit
realisation management is about finding potential lean improvements; and making sure
that the entire potential of the improvement has been harvested. Sapountzis et al (2009)
has compiled a list of five different types of benefits that a business has to manage to
realise the benefits from lean. These are tangible, intangible, by organisational or busi-
ness impact, by stakeholder or actor-oriented and unplanned/emergent benefits. A tan-
gible benefit is hard and direct; and is judges objectively in quantitative measures. The
tangible benefits can often been measured financially. An intangible benefit is soft and
indirect; it is judged subjectively and often measured in qualitative measures. An intan-
gible benefit is often difficult to measure and almost always difficult to convert to
monetary values. A benefit that is defined as by organisational or business impact can
come in five different streams; strategic; management; operational; functional and sup-
port. A benefit by stakeholder or actor-oriented is a classification of benefits according
to a specific stakeholder or group; who will feel or experience the impact of the lean
initiative. The last benefit classification group is the unplanned or emergent benefits;
these benefits are often a consequence of a change or another benefit gained. The un-
planned or emergent benefits are documented in a business as a result of a change from

Chapter 1
2
a lean improvement. It should be noted that a lean improvement could also result in a
disbenefit according to the above five categories. A disbenefit is something disadvanta-
geous or objectionable; something that makes a situation disadvantageous or unfavour-
able; and in financial terms as the undesirable effects of an investment such as a lean
initiative (Merriam-Webster, 2005).
Sapountzis et al (2009) argues that businesses have a need of a classification of benefit
in terms of value, internal and external organisational impact, planned and unplanned. It
is highly important for the businesses to understand the differences between tangible
and intangible benefits and how those may be managed and realised. Muir (2005) adds
that when lean initiative reports fluffy benefits; then the entire lean program loses its
legitimacy. It is highly important that the business assign financial benefits to a specific
category (ibid; Basu, 2009; Bhasin; 2008). Reiss et al (2006) agrees with the above
statements and add that businesses must understand that lean benefits do not just hap-
pen. Lean initiatives must be supported by mechanism to measure the specific benefit
type; and with procedures for monitoring, reporting and responding to their achieve-
ment or non-achievement (ibid). Before it is described how the management can find
potential lean improvements and ensuring the entire potential of the improvement has
been harvested are presented, the problems connected to realising the benefits from lean
will be discussed.
1.2 Problematic to realise the benefits of lean
Lean initiatives are implemented in a business to improve the operative performance; it
is how ever problematic to realise the financial benefits from lean. According to Bag-
galey and Maskall (2004, p. XIV) businesses that are looking for operational improve-
ments in a cell to be reflected in financial or bottom-line benefits will most likely be
disappointed. It is important to understand that lean does not inevitably result in im-
proved financial performance (Lewis, 2000). Many of the benefits of lean improve-
ments do not provide short-term financial improvements (Baggaley & Maskall, 2004, p.
XIV). Executives who stress short-term cost reduction and emphasise quarterly earnings
and stock price inevitably undermine the company’s ability to make the transformation
to a lean business (Stenzel et al, 2007, p. 168).
“Lean is not a cost reduction program; it’s a business strategy.”
Stenzel et al, 2007, p. 168
An example on a company that the uses the above lean statement is the General Electric
Company (GE) who defines lean as “the way we work – in everything we do and in
every product and design. It is not a program; it is within the core values of how GE
conducts its business” (Burton et al, 2003).

Chapter 1
3
Businesses has problem to measure and translate lean improvements into a financial
result on the organisational bottom-line. The operational people claims that achieving
reduced lead time, improved quality, on time delivery, reduced floor space and in-
creased inventory turns enables the company to satisfy customers better and thereby
achieve increased growth and profitability (Baggagley & Maskell, 2004, p. 51). Simul-
taneously the financial people claim that lean provides a potential for financial im-
provement, but unless cost are reduced and revenue are increased the financial picture
will not change (ibid, p. 52). This statements are supported by Womach (2004) who
states that managers become interested in adopting lean because its result in many bene-
fits including: higher quality products and services, increased market share, margin ex-
pansion, revenue growth, higher productivity, better customer focus, faster response to
changing market conditions, and higher asset efficiency. However, while thousands of
businesses worldwide have been engaged in a lean transformation, most have achieved
only modest levels of financial improvements (ibid).
The primary financial benefits of lean transformation is not cost cutting but creating the
capacity to allow the company to grow the line without comparable increases in costs
(Stenzel et al, 2007, p. 168). To actualise a profitability gain from lean initiatives a
business needs to either sell more products without adding people or reduce the use of
resources such as overtime work (ibid). This is supported by Baggaley and Maskell
(2004) who states that many of the lean improvements are more associated with cost
avoidance rather than cost reduction. A natural tendency when cost savings are gained
during a lean incentive is to use the savings to boost sagging performance in other part
of the company. But these funds should instead be immediately reinvested in increasing
the amount of customer value created (Stenzel et al, 2007, p. 152).
Businesses often choose to lay-off people to realise the financial benefit from a lean
initiative. Downsizing almost always leaves the remaining employees burdened with
additional responsibilities (ibid). The environment after a lay-off is demoralising since
extra work is unwanted. It is okay to fire low performance workers but not to fire due to
productivity gains from lean (ibid). According to professor Lawrence Grasso (e-mail,
2009-07-14) at Central Connecticut State University the employees should be seen as
the source of continuing improvement and customer value. By laying-off employees
through lean initiatives a business undermines the whole lean strategy (ibid). It is the
employees who create the productivity gains; but it’s up to the management to convert it
into improved profit (Stenzel et al, 2007).
Several studies reports that adopting lean does not improve profitability (Basin, 2008).
However, other research finds support for a positive association between lean and a
business competitive and financial performance (ibid). One reason why business fails to
realise the financial benefits of lean is because of the used business metrics (Emiliani et
al, 2003). Financial and non-financial metrics usually remain rooted in the traditional
accounting; which conflict with the efforts to implement lean principles and practices
(ibid). This discussion is briefly presented and discussed in the end of the theory sec-

Chapter 1
4
tion; with a focus on how traditional accounting can discourages the financial harvest of
the lean improvement and how the use of lean accounting can support the benefit reali-
sation of lean initiatives.
The above discussion could make the reader believe that lean does not lead to an im-
proved financial performance; this is not the case. Lean induces excellent examples of
operational improvements leading to an improved financial performance (Baggaley and
Maskell, 2004).
Another aspect regarding the financial benefits from lean regards a business ability to
estimate the value generated by any savings the organisation makes from a lean initia-
tive (Lewis, 2000). Womack et al (2005) highlights that the benefit of lean do exists; but
they are difficult to quantify. Standard and Davis (2000) claims that this problem is
connected to the different categories of benefits; where the intangible benefits of lean
are difficult to quantify. Research conducted by Burton (2003) estimates that the poten-
tial benefits of lean equal to a three to seven percent of revenues annually, depending on
the business starting point. Large businesses tend to achieve benefits a higher percent-
age of benefits because their value streams are come complex and contains more waste
(ibid). Noteworthy is that Burton is not suggesting that smaller organisations are more
efficient then larger organisations. Larger organisation only tends to have more links in
their customer and supply chains and therefore more layers of lean opportunities across
the entire value stream (ibid).
To conclude it is problematic to transfer an operative improvement from lean to a finan-
cial improvement. The financial benefits of lean transformation is not cost cutting but
creating the capacity to allow the company to grow its business. Lean should not be
seen as a cost reduction program; it’s a business strategy. Additional the financial im-
provements are difficult to quantify due to both the intangible nature of lean and the use
of traditional business metrics which conflicts with lean.
1.3 Finding potential lean improvements
The first step when seizing the financial and competitive benefits of lean is to find po-
tential lean improvements. The theory proposes that a lean business should use value
stream mapping and analysis to find and determine the potential of a lean improvement.
Additionally a lean business should be organised and managed after its value streams;
resulting in an increased communication and visualisation along the value steam which
improves the management’s ability to find suitable improvement areas and determine
their potential.

Chapter 1
5
1.3.1 Value stream analysis
Lean businesses use a value stream mapping and analysis to find and determine the po-
tential of a lean improvement. Womack et al (2003) states that value stream mapping
are the language of lean; making it possible to find suitable areas for lean improvements
and determine their potential.
Mapping the value stream is a critical step for a lean business. A lean business should
map the value streams for each product group. A lean business uses two different kinds
of maps; the first map shows the current state and the second map shows the requested
future state. (ibid)
Value stream mapping identifies both value adding- and wasteful activities; making it
possible to build a complete value stream according to the lean principles and proce-
dures. The map makes it possible to identify different areas suitable for lean improve-
ments and to determine the potential (ibid; Dennis, 2007; Rother et al, 2004). According
to Rother et al (2004) the potential of a lean improvement can be described by using
value stream mapping. The potential of a lean initiative is the differences between the
present and the future state (ibid). To estimate the potential of a lean initiative it is im-
portant that the lean business calculate the current and future state using correct ground
data with the right detail level (ibid).
The normal procedure for a value stream analysis is to construct the current and future
state maps in the same time. This is because when ground data and information about
the current situation is gathered potential future improvements will be arising; making it
possible to draw a future state map. In the same way, when gathering ground data and
information about the future state map a better understanding of the current state will be
developed. The outcome of the value stream analysis is a map of the current- and future
state and most importantly an action plan for how to move the business from the current
state to the future state. The action plan should show exactly what and when something
should be done; together with measurable goals and timelines for follow- ups. It is
highly important that the goals and timelines for their achievements are based on an
accurate estimation of the current state (Womack et al, 2003; Rother et al, 2004).
It is important to determine the requested detail level of the value stream analysis. The
level of detail is decided by the scope of the analysis. Additionally the business needs to
specify the specific product group that will be mapped. The value stream map enhances
four sections; customer; processes; material- and information flow. The analysis starts
with the customers; and a specification of the customer’s requirements. The next step is
to draw the manufacturing processes and to gather information about for example lead
time, set up time, resources used etc. After that the material flow is mapped; using ar-
rows from and to suppliers, production and customers. Additional the map show if the
material flow is push or pull at a specific process. The last step is to map the informa-
tion flow; showing how different processes communicates to each other. The value

Chapter 1
6
stream is summarised using a timeline with the average lead time for a specific product
through the whole flow; value added- and other time is shown separated. (Womack et
al, 2003)
To conclude, lean businesses uses value stream mapping to draw the businesses value
streams; resulting in a current and future state map. The value stream analysis audit the
differences in the maps; resulting in an action plan. The differences between the maps
shows the potential of lean improvements and the action plan determine the specific
lean initiative to be conducted to realise the potential of lean improvements.
1.3.2 Value Streamed organisation
A traditional business organisational chart is often arranged after the business different
kinds of functions. Example on different function can be research, production, logistic
operation and sales. A functional organisational structure creates sub optimisation and
counteracts to the business value stream (Baggaley and Maskell, 2004). A lean business
should be organised after its value streams. Increasing the communication and visualisa-
tion along the value stream improves the lean business ability to find suitable areas for
lean initiative (ibid). Additionally it will improve the harvest of the potential of lean
initiatives since the focus will be on the value stream; not on the functional division
(Stenzel et al, 2007).
It’s not necessary to redraw the company’s organisational chart in the short term; but in
the long run it is necessary to manage a lean business by value streams (Baggaley and
Maskell, 2004). Ideally this would involve not only production people but all other peo-
ple involved in the value stream (ibid, p. 101). All lean businesses should be managed
by value streams (ibid, p. 110). The value stream manager should have profit and loss
responsibility for the value stream (ibid). The value stream manager must be knowl-
edgeable, have respect within the organisation and good facilitating and coaching skills.
One problem that frequent occurs is when management assigns an employee to be a part
time value stream manager, while the person still reports to the divisional director
(Keyte and Locher, 2004, p. 12). In other words, it may be necessary to change report-
ing relationships to give the value stream managers the resources and authority neces-
sary to implement the future state successfully (ibid). Emiliani and Stec (2005) high-
lights that it’s not only the organisation and reporting system that has to change. A
common problem for a business attempting to be lean is that senior mangers says they
support lean but in reality they believe they are too busy to be involved with continuous
improvements activities (Emiliani and Stec, 2005). It is important that the top manage-
ment shows dedication for the execution and realisation of lean (Baggaley and Maskell,
2004). The chances for a successful transformation are much greater if top management
understands lean as a management system and support the transformation (Stenzel et al,
2007, p. 20).
Assigning people to value streams are a difficult task. Example on people that is hard to
assign is people who has a supporting function to the business operation. In short term,

Chapter 1
7
people can work in more than one value stream but in the long term, use cross-training
to bridge the gaps between the value streams.
A matrix between functional department and value streams are often the most conven-
ient way to start the process. Many of the most successful lean companies establish their
organisations chart around the value streams; others retain their functional structure and
create the value stream management through a matrix-management approach. But com-
panies that do quick and radical changes are often rewarded by fast and radical im-
provements (p. 102). Once everything is in place it’s easier to focus on making money.
Stenzel et al (2007) states that a parallel conversion path, leaving the old measures and
reports in place leaves the old “security blankets” in place; people will not use the new
information. Managers resisting the lean transformation will keep managing with old
measure (ibid, p. 205). Further it creates waste (double production of financial reports)
which contradicts lean management.
To conclude a lean business should be organised and managed by its value streams;
resulting in an increased communication and visualisation along the value steam which
improves the management’s ability to find suitable improvement areas. The managers
should have profit and loss responsibility and be given the needed resources and author-
ity to implement the lean future state. Additional literature suggests that a value stream
organisation would not only improve the business ability to find potential lean im-
provement but also improve the business ability to harvest the potential. Further ways
for harvesting the potential of lean improvements will be discussed in next section.
1.4 Harvesting the potential of lean improvements
As stated above by Reiss et al (2006) the key for harvesting the financial and competi-
tive benefits from lean is to understand that these benefits does not just happened to a
business. Lean initiatives must be supported by mechanism to measure the benefits; and
with procedures for monitoring, reporting and responding to their achievement or non-
achievement.
The academic world does not agree on how a lean business should conduct proper track-
ing of a lean initiative to ensure that the entire potential has been harvested. Below some
different authors ideas and opinions for how a business should ensure that the potential
of a lean improvement has been harvested will be presented. Additional the section will
briefly present how the use of lean accounting can improve the management’s ability to
seize the financial and competitive benefits of lean.
1.4.1 Benefit realisation framework
Sapountzis et al (2009) states that to harvest the potential of a lean initiative a lean busi-
ness needs to set up their own benefit realisation mechanics suited after its specific or-
ganisational needs. Sapountzis et al research has been developed in the healthcare sector

Chapter 1
8
through a literature review and interviews and workshops with professionals and practi-
tioners. The result of the research is a presentation of a benefits realisation (BeReal)
framework.
For successful benefit realisation businesses needs to create a link between continuous
improvements and benefit realisation management. Sapountzis et al insists that the
measurement, monitoring and reviewing of benefits to maintain a continuous improve-
ment momentum is essential. Benefits should be financially evaluated in terms of value,
internal and external organisational impact, planned and unplanned. Furthermore the
business needs to understand the differentiation between tangible and intangible bene-
fits and how those may be managed and realised. Additional the businesses need to de-
fine clear roles and responsibilities for successful benefits management and establish a
robust method of governance. The performance management system should be seen as a
route for better management and accountability; providing the required information for
process control, enabling the establishment of real but challenging target that could be
translated into financial benefits. Management needs to set up clear links between bene-
fits relations plan and outcomes. The benefit realisation work also needs to share its
knowledge over the organisation and process its activities in a continuing manner.
Sapountzis et al end the framework by emphasising on that knowledge continuity
should be share between all interested parties.
On the basis of the framework Sapountzis et al suggest that a lean business use the fol-
lowing four phases to realise the benefits from lean.
The first phase concerns the identification of desired top benefits; developing a benefit
management strategy. The strategy should form the base of the benefit realisation activi-
ties and communicate the business needs to all stakeholders. In the second phase the
business moves over to mapping the benefit and creating benefit profiles through pro-
ject groups and mapping workshops. In phase three the business through its project
groups and workshops establish a benefit realisation plan. The plan consists of measur-
ing and tracking the benefits identified and emerging benefits through data collection
and other measurements. The fourth and final phase is the evaluation and review of the
business realisation performance. In this phase the business should evaluate the benefits
that has been identified or emerged; and take actions. It should be noted that the above
“BeReal framework” is based on the lean Plan – Do – Check – Act (PDCA) procedure.
1.4.2 Operational key performance focus
Traditional performance measurements systems measures revenue, growth, cost reduc-
tion and return on investment (Stenzel, 2007, p. 71). Stenzel (2007), Lawrence Grasso
(e-mail, 2009-07-14) and Baggaley & Maskell (2004) disaffirm to the use of traditional
performance measurements by stating that traditional performance measurements fo-
cuses on shareholder values instead of customer values. Additional these traditional
measurements is out dated and wrong type of data for decision making in a lean busi-

Chapter 1
9
ness (Stenzel, 2007; Baggaley & Maskell, 2004). A lean business should measure per-
formance factors that lead to the results (Stenzel, 2007, p. 74). Business needs to under-
stand that a lean management primarily relies on operational measures rather than fi-
nancial measures for operational control and to support continuous improvements
(Stenzel et al, 2007, p. 188). A lean business should have key performance goals for the
lean initiative (Lawrence Grasso, e-mail, 2009-07-14).
The common way to measure the benefits and set up mechanism for monitoring, report-
ing and responding to lean initiatives achievement or non-achievement is by using a
benefit tracking sheet as tool.
A benefit tracking sheet tracks in a relative simple way all the lean initiatives on the
action plan. An action plan has been setup during the value stream analysis, which has
been described above. The stand point when using a benefit tracking sheet is that each
lean initiative should be tracked from primarily a financial perspective but that the sheet
also should contain information regarding the operational performance.
The article Kaizen 13 (2006) highlights the use of governing committee together with a
lean benefit tracking worksheet to monitor and respond to lean initiatives progress. A
governing committee is responsible for ensuring the success of the lean initiatives and
clearing any obstacles or constraints that would impede improvement efforts. The gov-
erning committee meets once a month and use the time on the meeting to discuss and
respond to lean initiatives achievement or non-achievement (Chaneski, 2007). Notewor-
thy is that the governing committee should be well aware of the lean initiatives progress
before the meeting; the meetings time should only be used to discuss and take actions
not to learn about the development (ibid). The committee needs easy access to all lean
action plans, preferably electronically via a central management information system
(ibid). Kagioulou et al (2000) agrees and adds that the success of a lean initiative often
relies on the right people having the right information at right time.
A lean tracking worksheet is used by the governing committee to monitor and track lean
initiatives (Kaizen 13, 2006). The lean tracking worksheet is a tool for keeping up on all
lean initiatives and helping teams complete their objectives. The benefit tracking sheet
should according to the article have 13 categories. The first category is named “lean
initiative” and is used to select area for the lean initiative. Areas for the lean initiative
must warrant the need. The second and third category presents the team leader and team
members of the lean initiative. The governing committee should select team members
two weeks prior to the initiative. The forth category shows date and length of the lean
initiative. All lean initiatives should be scheduled one month in advance. Lean initia-
tives should be held on the same week of the month every month. The fifth category
presents the strategic purpose of the initiative. Each initiative should be selected based
on its contribution to the key business metrics. The metrics are productivity improve-
ment, floor space reduction, station reduction, travel distance reduction, quality, work in
progress or inventory reduction. The sixth category displays the anticipated results. The

Chapter 1
10
governing committee needs to come up with what the percentage change will be for the
seven metrics after the initiative is complete. This is estimation and should be seen as a
target for the initiative. Category seven displays material and worked to be accom-
plished before the lean initiative. Estimated cost of the initiative is displayed in category
eight. One fundamental aspect of lean is the belief that improvements can be made with
little or no money. However, the initiative needs however a budget. In category nine the
actual result of the lean initiative is documented. During the lean initiative each team
leader should put together an action list from the initiative which should be displayed in
category ten. All action items from the initiative must be complete within 30 days of the
completion of the initiative and the due date for each action items are displayed in cate-
gory eleven. The responsibility and status of action item is displayed in categories
twelve and thirteen.
To conclude, according to Kaizen 13 a benefit tracking sheet monitors the progress of a
lean initiative and governing committee ensures that actions is taken if the entire poten-
tial of an initiative isn’t harvested. Muir (2005) states that using a simple tracking sheet,
as the article Kaizen 13 proposes is not enough; instead lean business needs to establish
a database to track all lean initiatives.
Muir believes it is much more complex to manage a set of lean initiatives than manag-
ing a single initiative. Business needs to track the projects progress and analyse its his-
toric data; based on facts. To do so the data needs to be kept in standardised forms.
When the number of completed initiatives grows; then the data base becomes a great
resource for all new lean initiatives. For example the database can be used to search for
example of different lean initiatives similar to the initiative to be started. The database
should keep track of potentially hundreds of lean initiatives, each with their own differ-
ent types of financial benefits, cycle times for completed phases, and team members and
roles. Because of this the database requires a well designed system with ties to the busi-
ness’s financial reporting and human resource (HR) system. The details of the imple-
mentation of the tracking system depends on the existing financial reporting, project
management, document management, HR, and process management systems. Accord-
ing to Muir many businesses underestimate the effort required in sustaining the lean
effort by relying on Excel spreadsheets and collections of PowerPoint presentations.
Common mistakes are to underestimate the amount of work required to properly docu-
ment their projects, and to wait until the end of the project to assemble the important
information.
Nygaard (2008) states that lean initiatives should be monitored using key performance
indicators. The performance measurement system should be focused on lean issues,
which usually are in operational terms, and should have very few measurements. Ny-
gaard states that to measure the effects from a lean initiative; the whole impact of the
improvements must be measured. Measures should be made on the complete unit to
avoid moving costs from inside project areas to outside project areas. To achieve this it
is important that there is a relevant reference for productivity, the actual values, as well
Chapter 1
11
as a target for the improvement. Nygaard especially emphasises that it is important that
all areas of the units measures relevant key performance indicators. According to Ny-
gaard are good key performance indicators essential for tracking the result of a lean ini-
tiative. Womack et al (2005) supports Nygaard and states that businesses needs to un-
derstand how key performance indicators can guide and focus a lean business towards
excellent result in a chosen area. Businesses should install a performance measurement
system that provides an early warning detection; indicating what has happened; diag-
nose reasons for the current situation; proceed to indicate what remedial action should
be taken and monitor the result of the action conducted (ibid).
Nygaards (2008) adds that parameters for measuring the effect of lean in terms of finan-
cial result on the bottom line must be established (ibid). Money saved should be accu-
mulated for the different part of the company to a total effect on the bottom line. To
have good ground data all hours spend in the unit has to be reported (ibid). Calculations
of improvements should be based on the assumption that the volume do not change after
the lean event (ibid). Productivity should be converted to money at the level of depart-
ment or value stream (ibid). Key performance indicators targets have to be coordinated
with the budget; it is therefore preferable that project targets are lower and part of the
budget (ibid). Key performance indicators metrics should be chosen to create a link be-
tween target, performance and effort (ibid).
Professor Lawrence Grasso (e-mail, 2009-07-14) do not agree with Nygaard (2008)
regarding measuring a lean initiatives result on the bottom-line. The key performance
goals are usually in operational terms such as time, quality, space and manpower (Law-
rence Grasso,). If these goals are met, then surely the lean initiative has been cost effec-
tive (ibid).
In the academic world there is discussion whether or not an organisation should conduct
tracking of each lean initiative as Kaizen 13, Muir (2005), Sapountzis et al (2009) and
Nygaard (2008) propose. In a e-mail (2009-07-14) professor Lawrence Grasso states
that from his experience, most businesses that are thoroughly committed to lean, have a
continuous improvement culture, and are using lean as a management system rather
than as a cost reduction tool kit, would consider the effort to track the cost and payback
from a particular initiative a waste of time and effort. According to Lawrence Grasso
there are businesses that do, or at least attempt to do this type of wasteful benefit track-
ing. He believes that usually they are large publicly held firms whose top management
likes the idea of lean improving performance and saving them money, but don’t really
understand lean and haven’t adopted it as a management system at the corporate level,
or they are divisions that have adopted lean within a parent company that has not.
1.4.3 Value stream focus
Lawrence Grasso (e-mail, 2009-07-14) and Baggaley & Maskell (2004) proposes that
businesses should use current state and future state value stream boxes to document the

Chapter 1
12
aggregate effect on overall value stream performance. Hence, a lean business should not
conduct tracking of each lean initiative; instead it should track the performance of the
whole value stream.
The box score provides a three-dimensional perspective of key operations, financial
result and how value streams resources are used for the whole value stream. The data
that is tracked by the value stream box is everything a lean business needs to ensure that
the competitive and financial benefits of lean initiatives have been harvested (ibid). The
measurements used in the box score are not pre-fixed; instead the organisation should
select the measures they intend to use in evaluating the effectiveness of their value
streams (ibid, p. 149). Table 1 displays an example of the box score; and also presents
most frequent used measurement of each perspective.
Table 1 - The value stream box (Baggaley & Maskell, 2004)
Before Lean Current Long term
Operational FTE (full time employees)
Lead time (time)
Floor space (m3)
…
Resource
Capacity
Productive (%)
Non-productive (%)
Available (%)
Financial Inventory value ($)
Revenue ($)
Material cost ($)
Conversion cost ($)
Value Stream profit ($)
The box score focuses on the key operations; financial result and statement of how
value streams resources are used for the whole value stream. Key operations refer to the
key performance indicators established for each value stream. Resource capacity shows
in percentage how much of the value stream resources that is productive, non-
productive or available. A lean business should focus on transferring non-productive
resources to productive resources; and to either use available resources to produce for
example more products or if not needed then removing the available capacity. The fi-
nancial result statement is used by the management to actually see the financial per-
formance of the value stream. This is the data that a value stream manager needs to au-
dit the effect of lean and value streams performance. (Baggaley & Maskell, 2004)
The left side of the box score, called “before lean” shows the current state of the items
measured prior to completion of any planned lean initiatives. The right side shows the
Chapter 1
13
future state status; the status of measured items if the planned initiatives provide the
expected benefits (three to six months ahead). The right side, “long term”, is the goal
that the value stream has set for each of the measurements and is established from the
value stream analysis. The long term column is also used to document the expected
benefits of major lean initiatives. Noteworthy is that three column “before lean,” “cur-
rent” and “long term” makes it possible for a lean business to monitor and document the
aggregate effect of the lean initiatives overall value stream performance. Additional the
financial statement makes it possible to estimate the lean initiatives aggregates financial
effects. (ibid)
The challenge for a lean company is to plan for its capacity use at the planning phase of
lean (at the same time as the value stream analysis). The management needs to decide
whether to use the new free capacity from lean initiatives to grow business or eliminate
free resources (ibid, p. 68). It’s of high concern for the company to know how much a
resource is used for production, non-production and how much time is available (ibid).
To analyse where the department have free capacity the value stream box score tool is
not enough.
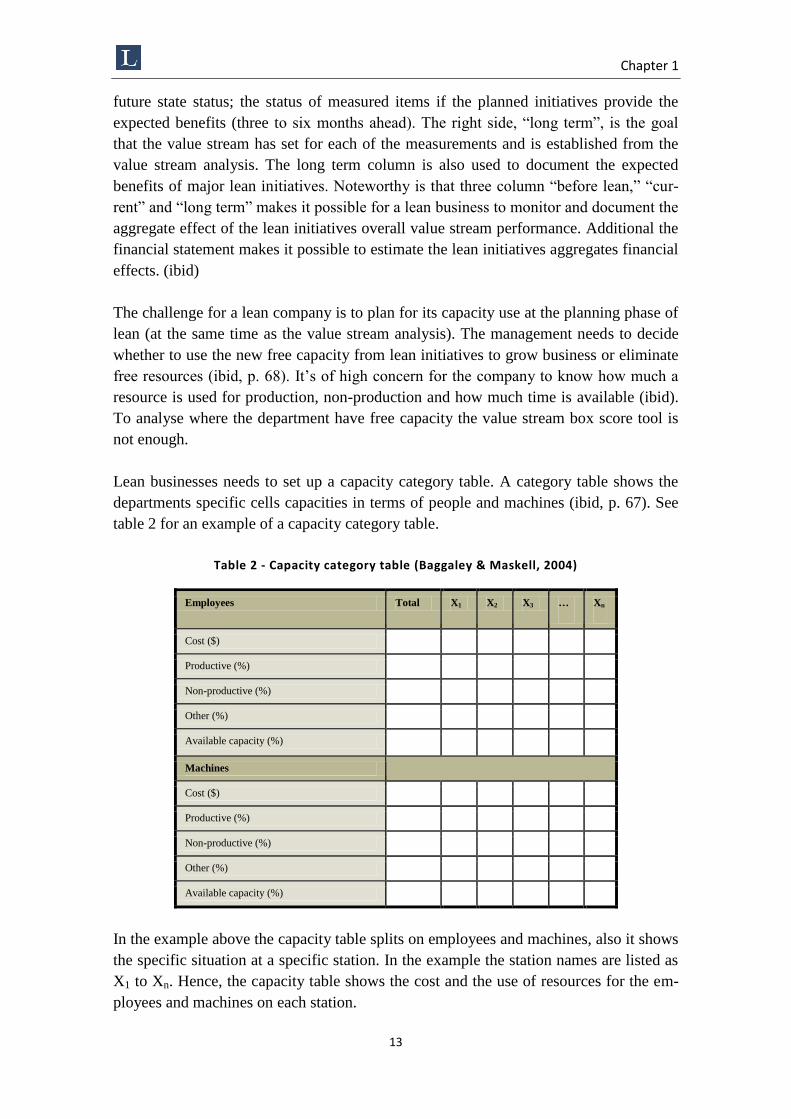
Lean businesses needs to set up a capacity category table. A category table shows the
departments specific cells capacities in terms of people and machines (ibid, p. 67). See
table 2 for an example of a capacity category table.
Table 2 - Capacity category table (Baggaley & Maskell, 2004)
Employees Total X1 X2 X3 … Xn
Cost ($)
Productive (%)
Non-productive (%)
Other (%)
Available capacity (%)
Machines
Cost ($)
Productive (%)
Non-productive (%)
Other (%)
Available capacity (%)
In the example above the capacity table splits on employees and machines, also it shows
the specific situation at a specific station. In the example the station names are listed as
X1 to Xn. Hence, the capacity table shows the cost and the use of resources for the em-
ployees and machines on each station.

Chapter 1
14
The flow of a value stream is determined by amount of available capacity within the
value stream and how the capacity is used. The value stream manager’s should have a
good understanding of how capacity is used, where the bottleneck is in the flow, and
how the capacity can be used to provide maximum financial benefits (ibid, p. 315). To
provide maximum financial benefits the rule is rather produce more than eliminate the
resource. This is because the labour work already has been paid for while producing the
existing business. If the business produces more then only the costs of material the vari-
able costs should be added. It is seldom more beneficial to reduce the resources that are
freed by the lean initiatives (ibid, p. 69).
Professor Lawrence Grasso (e-mail, 2009-07-14) insists that the value stream box score
together with the capacity table is the best way to measure, monitor the benefits of lean
initiatives; making it possible for the management to respond to the lean initiatives
achievement or non-achievement. The box score is the vehicle for tracking the impacts
on financial, operations and capacity level (ibid). Hypothesis testing is used to predict
the outcomes of lean initiatives from a financial, operating and capacity perspective and
then to monitor the actual impacts (ibid). It is the perfect tool for a value stream man-
ager when auditing the effect of lean and the performance value streams performance
(ibid).
Professor Lawrence Grasso highlights that financial statement in the value stream box
score needs a different kind of information then traditional accounting. Accounting for
bottom line impact is particularly problematic in the initial stages of lean, when current
production may actually drop even as capacity is being created as excess inventory is
worked down. With traditional absorption costing for financial reporting the cost of the
excess inventory (which includes past production costs) becomes an expense of the cur-
rent period, along with all the current production expenses (inventories are not being
rebuilt pushing the current production costs into future periods). The bottom line takes a
hit even as operations and cash flow are improving. In the long term the organisation
therefore needs to transfer from traditional accounting to lean accounting to fully realise
the benefits from lean. One of the two creators of the box score, Brian Maskell, states in
an e-mail (2009-07-22) that lean accounting replaces traditional accounting, and pro-
vides valid and accurate information for decision-making and such issues as lean events
financial impact.
1.4.4 Lean Accounting
Lean accounting seeks to move from the features of traditional accounting to a system
that measures and motivates good business practices in a lean business. Traditional ac-
counting on the other hand exists to create value for shareholders, not customers. The
traditional accounting system uses standard cost to establish budgets and estimates cost
of operations, processes, departments or product and the analysis of variances, profit-
ability or social use of funds (Stenzel, 2007). The problem with standard cost is that it
reinforces the assumption that profit is a function of high resource utilisation by absorb-
Chapter 1
15
ing labour and overhead costs for inventory valuation purpose (Stenzel, 2007, p. 155). It
does this since high resource utilisation leads to high overhead absorption which trans-
fer manufacturing costs to the balance sheet; improving the profit of the organisation
(ibid). Furthermore the organisations environment and need has changed by implement-
ing lean. Lean companies cannot be managed by looking in the rear view mirror. Man-
agement instead needs the kind of measurement that helps them manage the changing
cause of desired results (ibid, p. 82).
The primary goal of lean accounting is according to Stenzel (2007, p. 210) to add value
to the company bottom line for all activities. According to Baggaley and Maskell (2004)
Lean Accounting;
1. Provides accurate, timely, and understandable information to motivate the lean
transformation throughout the organisation, and for decision-making leading to
increased customer value, growth, profitability, and cash flow.
2. Use lean tools to eliminate waste from the accounting processes while maintain-
ing thorough financial control.
3. Fully comply with generally accepted accounting principles (GAAP), external
reporting regulations, and internal reporting requirements.
4. Support the lean culture by motivating investment in people, providing informa-
tion that is relevant and actionable, and empowering continuous improvement at
every level of the organisation.
The center in lean accounting is value stream costing. The value stream costing provides
the real value of the value stream and us is one of the primary value stream performance
measurements and is used to drive improvement in the value stream (Baggaley & Mas-
kell, 2004, p. 133). Value streams are the main organisational requirement for a lean
enterprise, a natural development is that the company’s income and cost statement
should be organised in the same manner. Value stream costing is the process of assign-
ing the actual expenses of an enterprise to value streams rather than departments
(Stenzel, 2007, p. 158). According to an e-mail conversation with Brian Maskell (2009-
07-22) he agrees with Stenzel, and states that value stream costing provides valid and
accurate information for decision-making and such issues as lean initiatives financial
impact.
Chapter 2
16
2 Problem discussion and purpose
This section intends to highlight the selected problem area; with the aim to create a
better understanding. The section begins with a comprehensive background about the
problem. After that the problem issue will be presented and clarified; resulting in a
statement of the thesis purpose and research questions. Finally the outline of the thesis
will be presented.
Businesses are always on the lookout for ways to improve their bottom line (Bhasin,
2008). Different kind of approaches to improve the business comes and goes but im-
proving the bottom line never goes out of style (ibid). Improvement approaches are
steps in the evolution of the business improvement methodology and lean is the latest
generation of improvement approaches (ibid). Lean has become the byword for effi-
ciency across industry and like many other cliché management techniques it has come
to mean different things to different people (Colin, 2007; Womack, 2007).
In 1990 Womack et al describes the fundamentals of the Toyota production system as
“lean production”. Businesses use lean production to identify and apply the best produc-
tion practice to eliminate waste and variation (Colin, 2007). Waste is an activity that the
customers are not willing to pay for (Pascal, 2007). Lean production is a way of maxi-
mising business results by optimising the build up of customer value from its basic ele-
ments to customer delivery (Ruffa, 2008). Womack et al (1990) states that lean produc-
tion can enable companies to produce a greater and growing variety of products in the
same time as it uses less of everything compared with mass production (ibid). Lean pro-
duction can result in half the manufacturing space, half the engineering hours to develop
a new product in time, half the investment in tools and far less than half of the needed
inventory on site resulting in very few defects (ibid). Lean production enhances tools
such as just-in-time, 5S, PDCA, kanban, Jidoka and kaizen event; all used to continu-
ously improve the business.
Lean production heritages from Toytota production system but its essence can be used
not only in manufacturing but in all kind of industries (Womack et al, 2003). Womack
and Jones (2003) present the essence of the lean philosophy by using five principles
guiding a company in lean implementation. These principles are;
1. Precisely specify value in terms of a specific products
2. Identify the value stream of each product
3. Make flow without interruptions
4. Let the customers pull value from the products
5. Pursue perfection
Pascal (2007) agrees with Womack et al and adds that that although the lean principles
are rooted in manufacturing they can be applied universally. The broaden application of
lean was launched in 1996 under the terms “lean thinking” or “lean solution” (Womack
et al, 2003). Lean thinking is about how to translate, tailor and apply lean to a particular
situation (Pascal, 2007).

Chapter 2
17
The development of lean thinking has often referred to the use of specific tools used to
continuously improve the business (Womack, 2007). Business must make lean deliver
its full benefits and move into “lean management” by for example use lean thinking to
chase waste in the financial function (Womack, 2007; Coote, 2006). The term “lean
management” referees to the use of lean in all functions and contextual situations. The
goal is to deliver customer value without waste (Womack, 2007). In this thesis the term
lean referees to lean management; the essence of lean used in all contextual situations.
2.1 Problem discussion
Businesses adopt lean to maximise its business; resulting in competitive and financial
benefits (Ruffa, 2008). A benefit is an advantage on a behalf of a particular stakeholder
or group of stakeholder (Ward et al, 2006; Sapountzis et al, 2009). The benefit is owned
by an individual or group who wants to obtain value from an investment such as a lean
initiative (ibid). The process of organising and managing so that potential benefits aris-
ing from investment in change are actually achieved is named benefit realisation man-
agement (Sapountzis et al, 2009).
Lean induces excellent examples of operational improvements leading to an improved
financial performance (Bhasin, 2008; Baggaley and Maskell, 2004; Muir 2005; Stenzel
et al, 2007). But several studies also reports that the adoption of lean do not improve the
business profitability; businesses has problem to realise the benefits of lean (ibid). A
business does not inevitable seize the financial and competitive benefits of lean (ibid).
“The management needs to understand that benefits from lean do not just happen.”
Reis et al (2006)
Authors propose different realisation mechanics to improve the management’s ability to
seize the financial and competitive benefits of lean; mechanics that in some cases con-
tradicts each other (Womach et al, 2003; Sapountzis et al, 2009; Kaizen 13; Muir, 2005;
Stenzel et al, 2007; Nygaard, 2008, Baggaley and Maskell, 2004).
To seize the benefits of lean it is essential that the management’s improves the ability to
find potential lean improvements. Lean business should use value stream mapping to
show the current- and requested future state. A value stream analysis makes it possible
to identify different areas suitable for lean improvements and determine their potential
(Womach et al, 2003; Dennis, 2007; Rother et al, 2004). Additional Baggaley and Mas-
kell (2004) and Stenzel et al (2007) states that to find potential lean improvements the
lean business needs to improve the communication and visualisation of the performance
along the value stream; and that this can be achieved by implementing a value streamed
organisation and management.
To seize the benefit of lean it additionally is essential that the management improves the
ability to ensure that the entire potential of an improvement has been harvested. The
Chapter 2
18
academic world does not agree on how the benefit mechanism to ensure that an entire
potential is harvested should be set up.
Reis et al (2006) states that the management needs to supported lean improvements with
mechanism to measure the benefits; and with procedures for monitoring, reporting and
responding to their achievement or non-achievement. Sapountzis et al (2009) proposes
the use of a benefit realisation framework, Kaizen 13 propose the use of a benefit track-
ing sheet and Muir (2005) proposes the use of a benefit tracking database. Professor
Lawrence Grasso (e-mail, 2009-07-14) does not agree with the above authors; a lean
business should not track the performance of a single lean initiative. Instead Professor
Lawrence Grasso states that the management should use the value stream box score
constructed by Baggaley and Maskell (2004) to track the aggregated effect of lean. Ad-
ditional Baggaley and Maskell (2004) and Stenzel et al (2007) states that the manage-
ment of a lean business should replaces traditional accounting with lean accounting to
provide valid and accurate information for estimating the potential of lean; and ensuring
that the potential has been harvested.
The academic world proposes different realisation mechanics to improve the manage-
ment’s ability to seize the financial and compatible benefits of lean because organisa-
tions have different needs. The management of a lean business needs to set up their own
benefit realisation mechanics suited after its specific organisational needs (Sapountzis et
al, 2009). For successful benefit realisation businesses needs to create a link between
continuous improvements and benefit realisation management (ibid). The fact that some
lean business manage to successfully realise the benefits of lean, while other fails, indi-
cates that the link between continues improvements, organisational needs and benefit
mechanics is not fully understood. Brian Maskell (e-mail, 2009-07-22) and Professor
Lawrence Grasso (e-mail, 2009-07-14) states that both the academic and professional
world needs to extend its knowledge about how to realise the potential of lean. Busi-
nesses needs to understand what benefit realisation mechanics that the specific organisa-
tion should use to seize the benefits of lean; to finding potential lean improvements and
ensure that the entire potential of the improvements has been harvested.
2.2 Purpose
The purpose of the thesis is to improve the management’s ability to seize the financial
and competitive benefits of lean. In particular the thesis focuses on improving the man-
agement’s ability to find potential lean improvements; and to ensure that entire potential
of the improvements has been harvested.
Research question 1: How to improve management’s ability to find potential lean im-
provements?
Research question 2: How can the management ensure that the entire potential of the
lean improvement has been harvested?

Chapter 2
19
2.3 Continued disposition
Below the outline of the thesis is presented together with a short explanatory text to
each section.
Chapter 1 Theoretical framework: The theoretical framework presents theories
relevant for the problem area. Initially the section presents theories regard-
ing benefit realisation of lean. The section then continues by describing
the problem to realise benefits from lean. After this it is presented how a
business can find potential lean improvements. The section ends with de-
scribing how a business can ensure that the entire potential of a lean im-
provement has been harvested. The theoretical framework is presented be-
fore the introduction to help the reader to understand the problem area of
the thesis.
Chapter 2 Introduction: This chapter intends to highlight this thesis selected prob-
lem area; with the aim to create a better understanding of the problem. The
section begins with a comprehensive background about the problem. After
that the problem issue will be presented and clarified resulting in the
statement of the thesis purpose and research questions. Finally the outline
of the thesis will be presented.
Chapter 3 Method: This chapter sets out, discuss and motivate the method used. The
method is the tool used to in a scientifically sound manner fulfil the pur-
pose by an empirical study.
Chapter 4 Empiric: This chapter describes the essence of the empiric data collected
from 13 semi-structured interviews. The views and opinions of the re-
spondents have been grouped after the specific topic.
Chapter 5 Analysis: In this section the empiric data is analysed from the perspective
of the theoretical framework.
Chapter 6 Conclusions: In this chapter the conclusions of the study is presented by
answering the research questions. Further the result and the relevance of
the study is discussed. The section ends with some suggestions for further
research.
Chapter 3
20
3 Method
This section sets out, discuss and motivate the method used. The method is the tool
used to in a scientifically sound manner to fulfil the purpose by an empirical study.
3.1 Research approach
The research approach concerns the individual researcher’s scientific stance (Nilsson,
1997). There are generally three different research methodological approaches within
business administration; analytical-, system- and operator approach (Arbnor et al,
1994). This thesis is based on an operator approach, with influence of a system ap-
proach. In an operator approach individual dependent knowledge is evolved by refer-
ring to how different actors experience, interpret and acts in a reality that is created by
them self (ibid). This approach is supported by the topic of the study; it is the individ-
ual business or managements views, behaviours and acts that determine how the bene-
fits from lean can be seized. The study also have a systematically approach; where the
components of a system has a mutual dependents of each other. The individual is part
of a system that mutually affects the other parts of the system. Lean benefit realisation
is constantly evolving in a system where actors both learn and develop from each oth-
ers.
The research approach also relates to the relationship between theory and empirics;
using either an inductive, deductive or abductive approach. When using an inductive
approach the reality is observed without establishing the study in previous recognised
theories (Patel & Davidson, 1994). A deductive research approach is the opposite;
from the theory hypothesis is formed, tested and verified against the reality (Zikmund,
2000). This study has used a mix of the above approaches; an abductive approach. An
abdictive approach is known as “the golden mean” (Patel & Davidson, 1994). In this
thesis theory and empirical evidence has been mixed alternately based on the specific
problem. Findings from individual phenomena, not based on theoretic data, have been
drawn; in the same time as individual theories suited for the specific problem has been
applied. Patel & Davidson (1994) states that its common that studies like this one, that
aims to develop a business, relates to a mix of inductive and deductive approaches.
Due to the problem statement of his this thesis a qualitative research approach is
needed. A qualitative research approaches tend to have a relative limited scale and
involves relative few people or situations (Denscombe, 2000). It is common that when
using a qualitative research approach efforts are concentrated on a limited area to get
deeper insights (ibid). Additional the studies purpose, to investigate how the man-
agement’s ability to seize the benefits of lean can be improved, supports a qualitative
approach that tends to provide a detailed description of events, people or processes.

Chapter 3
21
3.2 Research method
In this thesis a case study has been used to gather the empirical material. Stake (1995)
defines a case study as a study in which the depth of a program, event, activity, proc-
ess or one or more individuals are explored. The case under the study is bounded by a
limit of time or activity (ibid). A case study makes it possible to examine an individ-
ual case on higher level; obtaining a detailed and deeper understanding of the empir-
ics (Denscombe, 2000).
According to Eriksson and Wiedersheim-Paul (1997) case study is a particularly use-
ful approach if the objects to examine are few, complex or too complicated to study
with another method. Benefit realisation of lean is carried out in many businesses all
over the world; however the complexity and complication of the process requires that
only a single case can be examined to get deep insights that may have wider implica-
tions. This is supported by Denscombe (2000) who states that a case study should be
used when efforts must be concentrated on a single case to get deep insights, which
may have wider implications. The goal is to illuminate the general by looking at a
single case (ibid).
Additional this thesis is based on a single case due to the need of getting access to true
information. In many businesses benefit realisation of lean can is a sensitive issue
since the business wants to increase the realisation from lean to gain advantage on its
competitors. Through personal contacts this study has been given full access to a
business that is aiming for improving the benefit realisation from lean.
3.2.1 The case – H. Lundbeck A/S
H. Lundbeck A/S is a Danish international pharmaceutical company engaged in re-
search and development, production, marketing and sales of drugs for the treatment of
psychiatric and neurological disorders, particular fast-working, non-addictive anti-
depressants for people who need to function while medicated. The company is the
second largest pharmaceutical company in Denmark and employs around 5500 people
around the world. In 2009 Lundbeck’s revenue was 13.75 billion Danish crones; re-
sulting in a 2.007 billion profit.
In 2007 Lundbeck decided to implement lean production principles and procedures in
the Supply Operations and Engineering (SOE) function through Lundbeck LEAN.
Lundbeck LEAN’s ambition is to build a corporate culture in which everyone creates
improvements. Lundbeck LEAN consists of four components of improvements; cul-
ture, problem solving, processes and people (ibid). Together the components provides
dynamic through continual improvements and innovation, motivation through more
influence, responsibility and personal development and results to increase Lundbeck’s
competitive power.

Chapter 3
22
Lundbeck aspiration for SOE is to create the best supply chain in the pharmaceutical
industry where success should be achieved through Lundbeck’s people, outstanding
reliability and reduced costs. To ensure the ambition Lundbeck attempts to harvest the
financial and competitive results of Lundbeck LEAN and move towards a value
streamed business with focus on continuous improvements. (Lundbeck LEAN – the
handbook, 2007)
Lundbeck has with the help of lean initiatives increased its competiveness with aspect
to its yearly number of stock outs, delivery on time, stock turns and production cost as
percent of revenue (Lean benefit history, 2006-2008). A lean event is at Lundbeck
held by a selected team of people to optimise a specific process. In the period of
2006-2008 166 lean events was held resulting in an estimated value of 68 million
Danish crones in benefits to Lundbeck financial bottom-line (ibid). In Lundbeck the
benefit tracking is a quantification of the results from lean with Danish crones as
common denominator and is used to secure that Lundbeck maximises the value cre-
ated by chasing waste and eliminates cost (ibid). At the current moment benefit reali-
sation of lean is not fulfilling in aspects of translating the improvements to its com-
mercial effect, reap the benefits of the improvements and ensuring that leaders chase
waste to realise the aspiration to create the best supply chain in the pharmaceutical
industry (ibid).
3.3 Litterateur Review
This study began with a comprehensive literature review of lean and the benefits re-
alisation process of lean. This approach is supported by Denscombe (2000) who ar-
gues that any investigation carried out for research purpose should start with a litera-
ture review to identify the knowledge that already exists in the subject. This mini-
mises the risk of study something that has previously been investigated (ibid). Since
the research approach for this study is an abductive approach, litterateur reviews and
empirical examination has been mixed alternately during the whole research process.
The subject experts Brian Maskell, author of the book Practical Lean Accounting: a
proven system for measuring and managing the lean enterprise (2004), and professor
Lawrence Grasso at Central Connecticut State University, has been contact through e-
mail to obtain their views on the problem area. The contact resulted in a deeper under-
standing of benefit realisation management of lean; it made it possible to get access of
the newest result within the research area; and confirm that essence of theories had
been understood correctly. Furthermore, the author believes that the contacts signifi-
cantly increase the credibility of the study.
Previous studies in the research area have been reviewed through Luleå Technical
University library databases. Databases used in the literature review is Business
Source Elite (Ebsco), Emerald Insight and Google Scholar. Additional, the library
catalogues Lucia and Libris have been used. Subject terms that have been searched

Chapter 3
23
are; Lean production, lean thinking, lean management, value stream, benefit realisa-
tion, harvest, change management, performance management and lean accounting.
The above terms has been searched both individually and in combination with each
other. The databases have also been searched using authors who are authorities in the
field, such as Womack, Stenzel , Baggaley and Maskell. Chain-search has also been
conducted from these authors. Good research should be critical to its sources (Holme
& Solvang, 1997). Studies that have been peer reviewed and published in reputable
journals have been given a major influence on this thesis.
3.4 Methodological approach
The selection methodology used to identify respondents has been based on a hybrid of
subjective selection and snowball sampling. The subjective selection “hand picks”
people or phenomena that is likely to be crucial for the study (Denscombe, 2000). The
efforts can through a subjective selection be concentrated on devices that exhibit a
wider variation in order to highlight the current study issue (ibid). In this study this
can be seen since respondents have been chosen who work with or have a close con-
tact to lean initiatives and benefit realisation at Lundbeck. Denscombe (2000) states
that the selection methodology can be more economically and informative than con-
ventional probability methods. Additional, probability methods or system sampling
wouldn’t fit the subject of the thesis or the case study approach; since respondents
needed to have some knowledge and experience of Lundbeck LEAN to give valuable
information for how to improve the management’s ability to seize the financial and
competitive benefits of lean.
Snowball sampling refers to a sample determined by a process in which a person re-
fers to the next person that may be of interest to the investigation (ibid). Snowball
sampling is an effective method to build a reasonably wide range of small scale re-
search projects (ibid). The interviewer can also use the proponent as a reference to
enhance its reputation and credibility (ibid). Furthermore, snowball sampling makes it
possible to for the thesis to find empirical hidden populations. The hybrid of subjec-
tive selection and snowball sampling resulted in respondents on different level and
functions in the organisation that all had been in contact with lean and benefit realisa-
tion.
The subjective selection in this thesis refers to the respondents that Lundbeck Lean-
director Christian Houborg has suggested based on his knowledge about Lundbeck,
benefit realisation and lean. The people who have been interviewed have referred to
other respondents that could be of interest for the study which shows the methodo-
logical approach of snowball sample.
Chapter 3
24
3.5 Data collection method
The primary data collection method has been personal interviews. Personal interviews
are most likely the best choice if the study wants to gather insights about people’s
views, opinions and experiences (Denscombe, 2000). It is an especially useful method
when the study needs to examine sensitive issues or privileged information (ibid). In
this case personal interviews also are a time and cost effective data collection method
since all the respondents’ works at the same company.
The hybrid of subjective selection and snowball sampling resulted in respondents 13
respondents. Three interview objects had top management position as divisional di-
rectors; three held the position as heads of departments; five worked as Lundbeck
LEAN coaches; one worked on the financial department with production cost control-
ling; and one interview was held with the assistance to the director of supply, engi-
neering and operations. To conclude, 13 interviews where held with people on differ-
ent levels at different department within the case Lundbeck’s organisation, all respon-
dents having contact to benefit realisation of lean in their daily work. The length of
each interview has varied; but in average each interview has taken one hour to com-
plete.
The personal interviews were conducted using semi-structured questionnaires. A
semi-structured questionnaire implies that there are a number of basic questions or
subjects that serves as the guidelines for the interview that can be discussed in a free
form (ibid). Semi-structured interviews have provided the flexibility that has been
required to capture the respondents view and knowledge about specific issues con-
nected to lean and benefit realisation. It should be noted that since this study uses an
abductive approach and snowball sample to find respondents, the questions or sub-
jects at the semi-structured interviews has been developed and changed depending on
the interviews expected knowledge and experiences of lean and benefit realisation.
The interviewer has recorded the interviews conversations on an mp3 player. Inter-
view notes have also been written during the interviews. Immediately after the inter-
view the notes and the recording have been compared and compiled in a written for-
mat. The author choose not to send back the compiled summary of the interview to
the respondents since the mp3 recording together with the notes was estimated to give
a true picture of the respondents views on specific phenomenon’s. In one case a text
was sent back for correction of the respondent. At that time the respondent on its own
requested to see the record of the interview due to the sensitivity of the lean realisa-
tion issue. Noteworthy, the respondent agreed with the record from the interview and
only wanted to particular emphasis his stand point on a specific issue.
The respondents have been notified in good time through e-mail and telephone re-
garding place, time, length and topic of the interview. This is supported by Den-

Chapter 3
25
scombe (2000) who states that it is recommended to contact the respondent before the
interview to avoid interruptions during the interview.
The empirical data have been analysed by gathering the opinions, views and experi-
ences of the respondents to specific fields or theories. Respondent’s answers have
been compared to certify that the answers confirms and match with each other. The
comparisons were also made with the purpose get a deeper understanding of the bene-
fit realisation of lean at Lundbeck. During the whole study the result has then been
compared with the lean- and benefit realisation theory.
3.6 Methodological problems
3.6.1 Validity
Validity can be divided into internal- and external validity (Eriksson and Widersheim-
Paul, 1997). Internal validity regards if the study measures what it is supposed to
measure (ibid). In this study, which has a case study approach, the internal validity is
high if the study captures and describes the selected phenomenon in an accurate way
(Nilsson, 1997). In this study particular emphasis has been given to phenomenon that
has been described in a matching way from different sources. Additional the study has
tried to establish as logic and solid evidence chains as possible to increase the internal
validity. According to Denscombe (2000) the validity in a study becomes lower if a
strong interviewer effect occurs during the interviews. The interviewer effect occurs
when the interviewer affect the respondent, with the consequence that the respondent
gives misleading answers (ibid). The interviewer effect may have influenced the re-
spondent’s answers since some respondents may have seen the topic as frightening.
Respondents may have been thinking that their benefit realisation performance is be-
ing audit and that they have to defend their own work. The interviewer has tried to
avoid this by explaining the purpose with the interview and that no person will be
accountable for the current lean realisation system at Lundbeck. Noteworthy is that
since this study has an actor approach (with influence of a system approach) some
interviewer effect can be positive since it means that both the respondent and the in-
terviewer express their interpretation of the reality.
According to Eriksson and Widersheim-Paul (1997) a study has good external validity
if the results can be generalised and true in other contexts. Since this study has a case
study as research method approach the generalisation possibility can be discussed.
This thesis emphasises, through its case study approach, on capturing and describing a
complex phenomenon resulting in deep insights rather than generalisation of the re-
sults. The author do however believe that to a certain extend the results should be ap-
plicable also in other contexts.

Chapter 3
26
3.6.2 Reliability
With reliability means a measuring instrument’s ability to provide a stable and reli-
able response (Eriksson and Widersheim-Paul, 1997). A study has high reliability of
the measurements if its results could be replicated by other researchers (ibid). Nilsson
(1997) argues however that when a study has a qualitative research approach it cannot
be demanded that the result should be able to be replicated by other researchers. The
qualitative research methodology with a case study approach gives that both the re-
spondent and the interviewer express their interpretation of the reality (ibid).
The reliability is supported by data collection method. As stated above the interviewer
has been taking notes during the interview and the conversations have been recorded
on tape. After every interview the notes and the tapes have been compared and com-
piled in written form. It is thereby possible for other researchers to investigate and
replicate the study according to the procedures used in this study.

Chapter 4
27
4 Empiric
This chapter describes the essence of the empiric data collected from 13 semi-
structured interviews. The views and opinions of the respondents have been grouped
after the specific topic; on the basis of the Lundbeck’s benefit realisation procedures
and theoretical framework.
4.1 Value stream analysis
At Lundbeck two different types of value stream analysis are conducted; an overall
value stream analysis on Lundbeck Supply, Engineering and Operations (SOE) and a
specific and more detailed value stream analysis on each operational value stream.
4.1.1 Value stream analysis - Lundbeck SOE
A value stream analysis at Lundbeck SOE is used once every year to identify the
overall value streams, focus areas, specific ambitious targets for improvements and
prepare the action plan according which the improvements will be implemented. The
ambition is to improve Lundbeck competiveness according to the 2012 aspiration.
The 2012 aspiration includes targets, profit-levels, divisions and value streams de-
signs. According to respondent 3 the value stream analysis on Lundbeck SOE can be
seen as a “financial budget” for how much savings each department should make with
the help of lean initiatives in a specific area. Respondent 6 states that a more detailed
description will be gathered from each division after the summer. In the fall of 2010
division, department and team should know what should be done to reach the aspira-
tion 2012. The respondent’s opinions regarding the value stream analysis is presented
together with the operational value stream in the next section (4.1.2).
4.1.2 Value stream analysis – Operational value streams
Lundbeck LEAN conducts a value stream analysis for each operational stream each
year. The normal procedure is to conduct the value stream analysis during an event
week with maximum ten people from different levels of Lundbeck. The general
schedule is to audit the flow on the first day. The second day the value stream analysis
team looks two years into the future. The purpose is to get a view of the future and
determine what development that is needed to get there. Day three and four a plan is
established over suitable areas for lean initiatives. At the value stream analysis a
number of key performance indicators are established for each area; and the lean ini-
tiatives should focus on improving these indicators. At the fifth and last day a list of
all lean initiatives are compiled (including things to be fixed right away, minileans
and lean events). After the value stream analysis the lean coaches fixes and gather
further information regarding each potential lean event. The information is compiled
into a specific document called the A3 document. A list of all lean events is compiled

Chapter 4
28
to an action plan. It should be noted that the above procedure differ between divisions
and value stream; depending on the specific needs of each value steam. For example
some divisions with diffuse processes use a SIPOC (Supplier, input, process, output
and customer) tool to map the main process.
A common statement among the respondents is that the ground data used at the value
stream analysis has to be significantly improved (Respondent 1; 4; 5; 7; 8; 9; 10; 13).
Good ground data is essential for finding potential lean initiatives; and ensuring that
lean improvements has been harvested (Respondent 4; 5; 8). The management needs
to sharpen if Lundbeck wants to achieve the objectives with the value stream analysis
(Respondent 8). The decision making at the value stream analysis must be based on
facts; not assumptions (Respondent 4; 5; 8). At the value stream analysis we need to
have correct information about the key performance indicators current and historical
performance (ibid). Most of the information regarding key performance indicators
exists within the organisation; but is not used during the value stream analysis (Re-
spondent 5). Respondent 1, 3 4, 5 and 7 emphasises that the problem that the right
people should have the right information at the right time; this does not work satisfac-
torily at the present.
Respondent 8 and 9 highlights that a key to achieve improved ground data is the use
of resource utilisation control system. A resource budget tells exactly how much each
resource at the department should be used; and the control system monitor the actual
state (ibid). At Lundbeck all divisions uses different methods to audit their resource
capacity utilisation (Respondent 8; 11). Divisions and departments needs to use dif-
ferent methods to audit their resource utilisation basted on the function provided (Re-
spondent 13). The Quality Production-division uses the most advanced resource utili-
sation control system at Lundbeck (Respondent 4; 8; 9). It exists of a “Ferrari”- and
“Jaguar” model that plans and monitors all resources, both employees and machines,
on cell-level (Respondent 8; 9). The other divisions at most track their resource utili-
sation on a general level (ibid; 4; 11; 12; 13). The divisions are today afraid of the
costs and effort needed to conduct a comprehensive assessment of their resources per-
formance (Respondent 8).
Guidelines for ground data needed at the value stream analysis, regarding for example
key performance indicators and resource capacity utilisation, could be a solution to
improve Lundbeck LEAN’s ability to find potential lean initiatives; and harvest their
entire potential (Respondent 10; 13).
The respondent highlights that the participants at the value stream analysis, and lean
events, at Lundbeck consist of both top managers and operators from all parts of the
value stream (Respondent 1; 3; 4; 5 and 8). This has a positive effect on lean since it
shows the improvement is important for Lundbeck (ibid).
Chapter 4
29
4.1.3 Action plan
At Lundbeck the lean events found during the value stream analysis are complied into
an action plan (at Lundbeck called an event plan). The action plan includes all the
lean events to be conducted during the year; including information such as type of
event, event leader, lean-coach connected to the event and how much the lean event
should financially harvest. As stated in section 3.2.1, a lean event is at Lundbeck held
by a selected team of people to optimise a specific process. The normal length of a
lean event is a week; if the event can be hold in less than two days it’s called a
minilean. Minileans are not listed in the action plan.
The action plan works as a financial budget for the potential of each lean event. The
rule is that to withdraw a lean event from the action plan the event leader must show
for the person in charge of the specific value stream (normally the lean coach) that the
problem has been fixed or that lean improvements already has been financially har-
vested. If no proofs of this can be shown the lean event still will be hold. According to
respondent 3 the reason for this is because the action plan should “force” the lean
event to be conducted; even if people claim they don’t have time to hold the event etc.
Respondent 8 state that lean events and minileans results in changes that modifies the
tracking data of a specific resource. The ground data used to find potential lean initia-
tives and harvesting their potential could be improved by avoiding spreading out all
initiatives at a cell during the year (ibid). Holding all lean events and minileans at one
specific period would create a better understanding of the cells normal periods (ibid).
Respondent 7 agrees and states that especially minilean modifies a cell; making it
hard for the process owner to understand the cells performance. Additional, conduct-
ing all initiatives at once would contribute to a more common target between the ini-
tiatives; instead of just moving things back and forth (Respondent 8). Respondent 4
and 5 disagree; the lean strategy is to create a continuous improvement (ibid). Lund-
beck LEAN should move towards hosting lean initiatives in the daily activities in the
cell; not restricting lean initiatives to a specific period of the year (ibid). To realise the
financial and competitive benefits of lean a continuous improvement culture is essen-
tial (ibid).
A lean event needs to have a financial potential exceeding 250.000 Danish crones
(Respondent 1; 3; 4; 5). The limit is based on the cost of holding a lean event which is
calculated to in average cost 125.000 Danish crones; the amount is doubled to ensure
that Lundbeck do not lose money by hosting a lean event (ibid). Respondent 3 and 7
states that if a department wants to host a lean event, but the estimated potential are
less than the limit of 250.000 Danish crones, the department will hold the event as a
minilean instead. Minileans is less controlled then lean event; and can be conducted
by each department at any time. The limit can sometimes give a negative affect; since
the department will not be allowed to hold events that can improve Lundbeck’s com-
petiveness (Respondent 4; 5; 7). A problem with this system is that it makes it hard to
understand the ground data for each value streams performance (ibid).
Chapter 4
30
Additional respondent 3 and 10 recommends that the action plan and benefit tracking
sheet should be integrated. It would visualise the harvest of the lean event leading to
an improved benefit realisation and save some double work for the lean coaches
(ibid).
4.2 Benefit tracking of lean
Lundbeck focuses on tracking lean events; minileans and other lean initiatives are not
being tracked at the moment. At the value stream analysis a budget, estimation how
much a lean event will financially generate on the bottom-line, is settled. If the single
lean events budget exceeds the 250.000 Danish crones limit; the lean event will be
listed on the action plan and conducted during the year. After the value stream analy-
sis the lean-coaches goes through the lean events making sure that the estimated
budgets is credible. During the lean event week a new, and more precise potential of
the bottom-line saving will be calculated by the lean event team. This value is at
Lundbeck named as the potential of a lean event. Three months after the implantation
of the lean event an actual value of the bottom-line savings will be measured. The
estimated budget, potential and actual value of the bottom-line savings is registered
on each value streams benefit tracking sheet. The lean events financial benefit are
categories according to six annual benefit categories; sales growth, scrap/yield, man-
power, productivity, capacity costs and impact on stock and investment. Additionally
the lean events impact on the business cash flow is notated. The lean-coaches for each
value steam are responsible for updating the benefit tracking sheets. Additional Lund-
beck uses an document and visualise each lean event. The document shows what key
performance indicators that each lean event attends to improve.
Three months after the lean event has been implemented the key performance indica-
tors are measured. Lundbeck assumes that the actual bottom-line saving is the differ-
ence of the key performance indicators values before and after hosting the lean event.
It should be noted that all departments uses the same benefit tracking sheet; but some
departments has modified. For example has the Engineering of Technical Operations
department list the estimated number of man hour saved, reduction of number alarms
and energy saving from each lean event.
A problem at Lundbeck is that the registered actual harvested bottom-line saving does
not correspond to the reality (Respondent 2: 4; 5; 6; 8; 10). At Lundbeck the actual
bottom-line saving is the difference of the key performance indicators values before
and after hosting the lean event; but this assumption is not true (ibid). An improved
key performance indicator does not directly lead to an actual bottom-line saving
(ibid). It is only an actual bottom-line saving if the lean improvement is used to pro-
duce more customer value or if the lean improvement reduces the resources used (Re-
spondent 2; 4; 5). The benefit tracking system at Lundbeck does not measure the ac-
tual financial bottom-line savings (ibid). Respondent 2, 4 and 5 state that the lean-
Chapter 4
31
event teams needs more financial knowledge about how to calculate the actual bot-
tom-line saving.
Because of this reason the Engineering of Technical Operations (ETO) department
has decided not to register any actual bottom-line savings from each event (Respon-
dent 10). Additional respondent 10 adds that there are too many factors influencing
the key performance indicators; making it impossible to determine the lean events
influence on the key performance indicators actual performance.
The registered actual value of a lean event may not be the true saving; but it shows if
the lean event has lead to a beneficial improvement of the key performance indicators
and gives a rough estimation of the harvested value (Respondent 4). Respondent 1
propose that it is maybe more important that all lean initiatives are tracked using the
same calculation method; rather than using different calculations to improve the accu-
racy of the value. Using the same calculation method makes it easier to compare the
harvest of different lean initiatives (ibid).
Respondent 2, 4, 5, 8 and 11 highlights that to learn from the lean initiatives Lund-
beck should conduct tracking of each lean event. By only conduct tracking of the
overall value stream performance Lundbeck would decrease the benefit realisation
from lean. Lundbeck must estimate the potential; and monitor its performance until
the potential has been harvested (ibid).
Respondent 1, 2, 4, 5, 7 and 11 highlights the need of educating the employees about
how to realise a benefit from lean. Lundbeck has for example a no-lay-off policy;
stating that lean improvements are not allowed be realised by reducing number of
employees (ibid). Employees may however be transferred to another working station
(ibid).
Respondent 2, who works at the financial department at Lundbeck SOE, has devel-
oped eight questions for evaluating the potential of a lean initiative. The idea is that
the eight questions should help people to determine how to realise the potential of the
improvement and if financial potential of a lean initiative will be seen direct on the
bottom-line (ibid). The eight benefit realisation questions are;
1. What capacities affect the event?
2. What cost drivers affect the event?
3. Can the released capacity be used direct or indirect?
4. Can the event postpone investments?
5. Can the event be seen isolated?
6. Will the standard cost decrease?
7. What is the direct and indirect potential of the event?
8. How can I as process owner secure that we harvest the gain – either by reduc-
ing cost or increase the volume?

Chapter 4
32
The plan is to integrate the eight questions into all lean events in the future (Respon-
dent 2: 4). Respondents 5 and 6 states that the use of the eight questions would in-
crease Lundbeck benefit realisation from lean. The eight questions could also be re-
viewed after the implementation of the lean event; to review the result of the realisa-
tion from the specific lean initiative (Respondent 2; 4).
An important notice is that eight questions makes it legal to host lean initiatives that
do not financially affect the bottom-line; but that still can significantly improve Lund-
beck’s competitiveness (ibid).
The lean people have the responsibility to update the action plan, document of each
lean event and benefit tracking sheet and a visual wall in the lean office. Because of
this all documents are often not updated regularly (Respondent 1; 3; 4; 5; 8; 10).
Lundbeck needs a more clear structured lean system (ibid). Respondent 10 claims that
Lundbeck should develop a method that can be used by the people of each department
to show their own lean results. Additional the documents should be added with more
information regarding how the lean event affects the cells full-time employees (FTE);
resource capacity; key performance indicators; people in charge and other key data for
the lean event (Respondent 10). Respondent 8 propose that the benefit tracking sheet
could be directly linked to the production report, key performance indicators or re-
source utilisation control system to create incentives for realising the full potential of
each lean event. This is something that cannot be done with the current system (Re-
spondent 4, 5). A benefit tracking sheet cannot contain all the information that people
want to track; and especially not visualise and make the data useful (ibid).
The lean-departments information regarding the actual performance and harvest of a
lean event must be more visualised and shared to interested parties (Respondent 5; 7;
11).
Respondent 7 uses a “talking paper” as a simple but good method to visualise the
meaning of harvesting the financial benefits of lean. In the daily operations the em-
ployees always have questions about lean initiatives and their own works financial
value (ibid). Respondent 7 writes down all questions and then reply a qualified answer
using a paper on the scoreboard (called by respondent 7 the “talking paper). In this
way all the employees, even people who don’t ask questions, can see that their own
performance through lean initiatives affects H. Lundbecks A/S financial bottom-line
(ibid).
Respondent 2 states that benefit realisation from lean would be improved by including
participants from different departments along the value stream. It would create a bet-
ter understanding of each other’s needs and improving the value stream thinking at
Lundbeck (ibid). To a certain extent the lean team includes different people from parts
of the value stream already; from top managers to operators along the value stream
(Respondent 1, 3, 5 and 8).

Chapter 4
33
4.2.1 Review of lean progress
The review of the lean progress at Lundbeck is limited (Respondent 4; 5; 7; 8; 10;
11). The lean-coaches have a monthly meeting with the people involved with the lean
events at each department; reviewing the document for each lean event (Respondent
7). At this meeting the performance of each lean event is discussed and action is taken
(ibid). Additionally the lean-department constantly reviews the documents for each
lean event and benefit tracking sheet for each value stream (Respondent 4). This re-
view is conducted within the lean-department and not together with the involved de-
partments (ibid).
Additional a normal procedure is that a number of lean initiatives are implemented to
improve a specific key performance indicator (Respondent 1). The key performance
indicators are then evaluated by the department weekly during the whole year (ibid).
Realisation of lean is only to a limited extent part of this discussion (ibid).
Respondent 1, 10 states that there is a need of a benefit realisation evaluation meeting
for each value stream at the end of the year. Respondent 11 recommends the evalua-
tion meeting to be hold more often; four times a year could be appropriate. The most
important is that a review meeting should be held before next year’s value stream
analysis (Respondent 1, 10). The meeting should work as a platform for discussing
and visualising the performance of lean (Respondent ibid; 1; 10). Today there is no
discussion regarding the definite closer of lean events and underperforming lean reali-
sations (Respondent 1; 5; 10). It must lead to consequences if benefit realisation from
lean initiatives fails (ibid; 8).
The review of the lean process especially needs to move closer to the value streams
performance (Respondent 1; 4; 5; 11). We need to capture the aggregated effect of
lean on the specific value streams performance (ibid).
4.3 Financial control
Lundbeck SOE primarily uses two tools for financially controlling its business; a fi-
nancial budget and a production report.
4.3.1 Financial budget
Lundbeck uses a yearly budget (and two half year budgets called estimations one and
two). The head of each department is responsible for their budget. The budget consists
of a template with different fields that are listed to be filled in with cost elements.
Additional a second template should be filled in with a written text; presenting cost
drivers and the outlook for the production forecast etc. Basically the second temple
explains what will happen and how the costs should be interpreted in the first tem-
plate. To make sure that everybody follow the correct procedure there also is a docu-
Chapter 4
34
ment with guidelines; stating for example how lean improvements should be included.
Regarding lean the guidelines only states that lean initiatives and other improvements
that can affect the business for next year should be explained under the chapter “busi-
ness improvements and lean initiatives”.
Respondent 2 and 6 states that the guidelines regarding lean initiatives may be not
enough. The financial department tries to force the departments to include benefit
realisation data into the budget; but it doesn’t work well (ibid). Respondent 8 and 11
states that they include general estimations and lean trends; but they do not include
figures for each lean initiative in their financial budget.
Respondent 2 and 6 states that the problem is that there is no direct link between lean
and the financial budget. A link could be made by including either the budget, poten-
tial or actual value of each lean event (ibid).
Respondent 2 state that including the budget or the potential of an event would make
it possible for the department to have a budget that more corresponds to the reality;
and improve the financial harvest of each lean initiative. It would force the process
owner to harvest the improvements full potential (ibid). A direct link between the po-
tential of the events and the financial budget would be fantastic; but is at the present
situation not realistic (Respondent 4; 5; 8). The estimations of lean events potential
and the data the decision is based on needs to increase its validity before a link can be
made (ibid; 6).
Respondent 2 states that by including the actual values from each lean event in the
budget a more precise and correct number of the department performance would be
achieved. A solution could be to have a soft link between the harvest of each lean
initiatives actual values and the financial budget; include the figures but if the figure
is not harvested then the process owner only needs to write a comment (Respondent
6). This would start a dialog around the lean initiatives financial performance; a dia-
log that does not really exist today (ibid). To make a direct link between the financial
budget and the actual value the precision needs to be relative high (ibid; 8). This is not
the case today; Lundbeck estimations of the actual values is not a precise estimation
of the real financial bottom-line impact (ibid; 4; 5).
The respondents are concerned regarding making a link between lean and the finan-
cial budget (Respondent 4; 5; 6; 9; 10). It is already a problem at the value stream
analysis to make people estimate the potential of a lean initiative; since they are afraid
they will be forced to harvest the full potential financial saving (Respondent 4; 5).
Additional it will make people avoid finding new areas for lean initiatives (ibid). Re-
spondent 5 and 8 states that Lundbeck needs to create a situation where both the com-
pany and the employees benefits from finding and harvesting lean initiatives. If the
lean targets are accomplished the company could give bonus in terms of education,
money or by letting the employees use the time to conduct own projects that could
benefit Lundbeck in the long run (ibid).

Chapter 4
35
Respondent 4 states that Lundbeck is not ready for a stronger link between lean and
the financial budget. Lundbeck should keep the current budged procedure and focus
on improving the ground data and estimation of the lean initiatives potential (ibid).
First when the estimations correspond to reality a link to the financial budget can be
discussed (ibid).
4.3.2 Production report
The production report is a relative new instrument used by the management to get an
overall picture of Lundbeck SOE performance; it also gives the possibility to look
into details. It basically is a cost- and variance tool that tracks cost of departments,
employees, stock-level, standard costs etc. The report is updated every month. Addi-
tional the managers have a meeting every month with the financial department where
the material in the production report is discussed to get a better understanding of the
situation.
The production report establishes a contact between the finance department and the
production (Respondent 2; 3; 8; 9). It provides fresh, valid and accurate data that
helps the management to evaluate the performance of the specific department (ibid).
Lundbeck should implement a similar platform for discussing the realisation of lean
(Respondent 2; 8). A platform could be attained by introducing a lean section in the
production report (ibid). Lundbeck should be aware that creating and updating a link
in the production report costs money and time (Respondent 11). Only if the section
can lead to an improved lean realisation a link should be constricted (ibid). Lundbeck
must evaluate and determine the purpose of the lean section before introducing lean
into the production report (ibid).
Respondent 2 and 4 propose that the potential and the actual realisation from lean
should be mapped in the production report using few lists and key figures for each
department. A curve of the actual value in respect to the potential of the lean im-
provement could be used to start a dialog (Respondent 8).
Another alternative is to add lean improvements to existing graphs in the production
report (Respondent 2). For example, if a lean initiative attends to decrease in lead
time; then the departments output should increase. The target for the improvement
could be visualised in the production reports graphs; forcing the department to harvest
the full potential of the improvement.
Respondent 8 adds that it could be interesting to evaluate if a resource utilisation sec-
tion in the report could be added; to start a dialog around each department’s resource
utilisation. In the long run this would help Lundbeck to find potential lean initiatives
and harvest their full potentials. Respondent 2 claims that everything cannot be added
to the production report.

Chapter 4
36
Each functional division has its own section in the production report. Respondent 2
and 4 states that the benefit realisation of lean would be improved by adding a section
for each value stream. This would increase the communication along the value
stream; leading to an increase benefit realisation in the long run (ibid). A value stream
section would be the perfect tool for a value stream manager (ibid).
4.4 Lean accounting
Most of the respondents don’t want to express an opinion regarding a transfer from
traditional accounting methods to lean accounting. The respondent states that the ac-
counting system does not affect their work; or that they have too little knowledge to
make a statement.
Respondent 8 states however that Lundbeck would benefit from a value stream cost-
ing development. Costs should belong to value stream rather than functional depart-
ments; and value stream managers should be responsible of the costs of the value
streams (ibid). The accuracy of the value stream analysis would improve by this de-
velopment leading to an improved benefit realisation from lean (ibid). At present the
functional department don’t know how much they actually contribute to the value
streams (ibid). Lundbeck should look into the accounting issue further (ibid).
Respondent 11 states that the new production report helps Lundbeck to understand the
reason behind the financial figures. Additional the production report binds the de-
partment’s achievements together (ibid).
Respondent 4 states that Lundbeck may need to transfer to lean accounting principles
in the future; but that other issues like moving to a value streamed organisation needs
to be solved first.
4.5 Organisational structure
Lundbeck has been and in many ways still are a traditional company with a functional
organisational structure. The organisation has a hieratic but relative flat structure
where the head of Supply, Operations and Engineering; leading a number of func-
tional production divisions. The divisional directors are in charge over the heads of
departments who is in charge over team leaders and operators. The company’s main
production unit is located in Valby, Copenhagen (Denmark); but production units do
also exists in Lumsås (Denmark), Italy and Mexico. At Lumsås the organisational
structure is less traditional; the unit has recently implemented two value stream lead-
ers. The value stream leaders works with improving the performance of each value
stream. Noteworthy is that directors of each functional department is superior to the
value stream leaders. In Valby, Italy and Mexico the implementation of Lundbeck
LEAN is not fully implemented yet. Lundbeck has ongoing discussion of piloting

Chapter 4
37
value stream leaders in Valby on the ampoules and drops value stream. The argument
is that this department is less critical for Lundbeck main business. (Respondent 4; 5)
As stated before the leaders of Lundbeck have set up an aspiration for 2012 regarding
targets, profit, divisions and value streams. The 2012 Lundbeck aspiration gives an
overall picture of the vision for the value streams in the production. Production Valby
uses for example three value streams: high volume-, low volume-, and ampoules and
drops products. Other divisions at Lundbeck SOE also uses value streams; but they
are not as clear structured as Production Valby. (Respondent 10)
The management group has agreed on that Lundbeck should move towards a value
streamed organisation (Respondent 6). All of the respondents agree that Lundbeck
would benefit by this development (Respondent 5; 6; 7; 8; 11). The next step is to
decide how to approach a value streamed organisation (Respondent 6).
Respondent 8 propose that Lundbeck don’t have to change structure; preferable is to
add the value stream as a matrix organisation. People should be dedicated to a specific
value stream; but still belong to a functional area (ibid). A matrix organisation would
make it possible to evaluate if Lundbeck competitively and financially benefits from a
value streamed organisational structure (ibid). Respondent 11 oppose to this devel-
opment claiming that it would lead to double work and unused capacities. Instead
respondent 11 proposes that Lundbeck should implement value stream coordinators.
A value stream coordinator is a person who has an overview of the value streams;
given the influence to coordinate activities between the functional departments (ibid).
A value stream coordinator should have a cooperative and not controlling role (ibid).
Respondent 8 claims that the development towards a value streamed organisation will
take a lot of effort and hard work; but Lundbeck will gain from it in the long run and
improve its ability to seize the benefits from Lundbeck LEAN. Respondent 5 states
that the movement towards a value streamed organisational goes slow since the func-
tional leaders are afraid of losing power the value stream managers. Respondent 11
claims that implementation of value stream coordinators rather than value stream
managers are the quickest and most beneficial lean approach for Lundbeck. Notewor-
thy is that most of the respondent had no opinions regarding how Lundbeck should
approach a value steamed organisation.

Chapter 5
38
5 Analysis
The empiric data is in this section analysed from the perspective of the theoretical
framework. Conclusions from the analysis are presented in the end of each topic.
5.1 Benefit classification
To determine their potential a business needs understand the difference between reali-
sation of tangible and intangible benefits and classify them in terms of value, internal
and external organisational impact, planned and unplanned (Muir, 2005; Sapountzis et
al, 2009). Lundbeck is aware of the need of a distinct classification and has choose to
classify the lean event benefits according to six annual benefit categories and affect
on cash flow; matching the criteria’s given by the literature. The employees at Lund-
beck have however problem to understand how to manage and realise the different
types of benefits (Respondent 2, 4; 5 and 11). Respondent 2 has developed eight bene-
fit realisation questions to be asked during the value stream analysis and lean events
to help people determine the potential of a lean event. The eight benefit realisation
questions are;
1. What capacities affect the event?
2. What cost drivers affect the event?
3. Can the released capacity be used direct or indirect?
4. Can the event postpone investments?
5. Can the event be seen isolated?
6. Will the standard cost decrease?
7. What is the direct and indirect potential of the event?
8. How can I as process owner secure that we harvest the gain – either by reduc-
ing cost or increase the volume?
Respondent 2, 4, 5 and 6 believes that the use of the eight questions will improve
Lundbeck ability to find areas for lean initiatives and determine their potential by
helping them the type of benefits and how those can be realised. Lundbeck focus on
categorising the benefits from lean is supported by Muir (2005) who states that if lean
initiatives reports fluffy benefits the entire lean program loses its legitimacy.
The conclusion from the analysis of the benefit classification is that the management’s
ability to seize the benefits of lean cannot be improved by implementing a different
classification system of the benefits from lean. This is because the management in the
case is already using a distinct classification method. Noteworthy is that the employ-
ees has problem to understand how to manage and realise the different types of bene-
fits; and that this can be improved by using the eight benefit realisation questions.

Chapter 5
39
5.2 Estimating the potential
Business has problem to estimate the value generated from a lean initiative; making it
hard to find, determine and harvest the potential of suitable lean initiatives (Lewis,
2000; Standard and David, 2000). The intangible benefits of lean are difficult to quan-
tify; and unplanned and emergent benefits affect the measured value (Standard and
Davidm 2000; Sapountzis et al, 2009). Lundbeck are experiencing this problem (Re-
spondent 1; 7; 8; 9; 11; 13). Respondent 10 agrees with the literature by stating that
there are too many factors influencing the key performance indicators actual perform-
ance. But in particular the respondents emphasise on two problems regarding estimate
the value generated from a lean initiative; the need of good ground data and Lund-
beck’s estimation method.
5.2.1 Ground data
The potential of the improvements is the differences between the current and future
state (Rother et al, 2004). It is important that the current and future state is determined
using correct data with right detail level (ibid). The ground data used at Lundbeck’s
value stream analysis has to be significantly improved (Respondent 1; 4; 5; 7; 8; 9;
10; 13). Kagiloulou et al (2009) states that the success of lean initiatives often relies
on the right people having the right information at the right time. The decision making
must be based on facts; not assumptions (Respondent 4; 5; 8).
Professor Lawrence Grasso (e-mail, 2009-07-17) and Baggaley & Maskell (2004)
propose that a lean business should use a value stream box to measure and monitor
the ground data of the value streams performance. The value stream box score tracks
the operational-, capacity- and financial level of the value stream (ibid).
The ground data of the operational level should be tracked using key performance
indicators for each value stream (ibid). This is supported by Womack et al (2005) and
Nyggard (2008) who states that key performance can guide and focus a lean business
towards excellent results. Lundbeck’s management already uses key performance
indicators to improve its operations; the data is just not fully used during the value
stream analysis (Respondent 5).
The ground data of the capacity level should be tracked using a capacity category ta-
ble (Baggaley & Maskell, 2004; Lawrence Grasso, e-mail, 2009-07-17). A category
table shows the departments specific cells capacity in terms of people and machines
(ibid). Respondent 8 and 9 agrees by stating that Lundbeck benefit realisation would
improve by implementing a resource capacity budget that tells exactly how much each
resource of the department should be used; and having a control system to monitor the
actual state. At current most departments at Lundbeck only track their resource utili-
sation on a general level; only the Quality Production department uses the resource
utilisation control system described above (Respondent 4; 8; 9; 11; 12; 13).

Chapter 5
40
The ground data of the financial level tracks the financial performance of the value
stream; using value stream costing principles (Baggaley & Maskell, 2004; Lawrence
Grasso, e-mail, 2009-07-17). Value stream costing provides valid and accurate infor-
mation for decision making and such issues as lean initiatives actual impact (Brian
Maskell, e-mail, 2009-07-22; Stenzel et al, 2007). Respondent 4 states that a value
streamed financial statement may be useful for Lundbeck’s benefit realisation; but
that other urgent realisation issues, like moving to a value streamed organisation, must
be solved first. Instead of tracking the financial performance of the value stream using
value stream costing; the production report could be used.
Lundbeck uses a production report to create a link between the financial department
and the production (Respondent 2; 3; 4; 8; 9). It could work as a lean plat form; to
find suitable areas for lean improvements, estimate their potential and to ensure that
the full potential is being harvested (Respondent 2; 4; 8). A platform could be attained
by introducing a lean section in the production report or by adding a section for each
value stream (ibid). A value stream section would increase the communication along
the value stream; and be the perfect tool for a value stream manager (Respondent 2;
4). Respondent 11 highlights that it cost money and time to create and update a link in
the production report; Lundbeck must evaluate and determine the purpose of the sec-
tion before implementing any big changes.
In order to improve the decision making, by ensuring that the right people having the
right information at the right time, Lundbeck should set up guidelines for the measur-
ing, monitoring and reporting of ground data (Respondent 10; 13). Guidelines would
improve the management’s ability to find suitable lean areas and harvest their entire
potential; by basing the decision on facts and not assumptions (Respondent ibid; 4; 5;
8). Lundbeck’s guidelines chould enhance key performance indicators, resource utili-
sation and financial information from the value stream’s cost reports (ibid).
The conclusion from the analysis of the ground data is that the management’s ability
to find potential lean improvements can be improved by setting up ground data guide-
lines and producing a value stream cost report. Ground data guidelines for measuring,
controlling and reporting of ground data would make sure that the right people have
the right information at the right time; and ensure that the decision making of lean is
be based on facts and not assumptions. A cost report for each value stream would in-
crease the understanding and communication of the value streams financial perform-
ance; and provide valid and accurate information for the decision making. Addition-
ally by setting up ground data guidelines and producing value stream cost reports the
management’s ability to harvest the entire potential of the lean improvement would be
improved.
Chapter 5
41
5.2.2 Estimation method
A lean initiative potential is determined by its contribution to the key business met-
rics; focusing on producing customer values rather than shareholder values (Kaizen
13; Nygaard , 2008; Stenzel et al, 2007; Baggaley and Maskall, 2004; Lawrence
Grasso, e-mail, 2009-07-14). The estimations should be based on the performance
factors that lead to the result (ibid).
Lundbeck binds all lean initiative to one or a few key performance indicators; and
estimates the bottom-line impact as the difference between the key performance indi-
cators values before and after hosting a lean initiative. Nygaard (2008) agrees with the
use of this method and highlights that the improved productivity should be converted
to money on the bottom-line (ibid). Sapountzis et al (2009) agrees by stating that the
benefits from a lean initiative should be financially evaluated. The literature (Bag-
galey and Maskell, 2004; Stenzel et al, 2007; Lawrence Grasso, e-mail, 2009-07-14)
and the respondents (2; 4; 5) emphasise that it is problematic to determine a lean ini-
tiatives financial potential. An improved key performance indicator does not directly
lead to a bottom-line saving; to actualise a profitability gain a business use the im-
proved operative performance to allow the business to grow or eliminate the free re-
sources. Hence, the benefit tracking system at Lundbeck does not estimate the true
financial impact.
Professor Lawrence Grasso (e-mail, 2009-07-14) states that a lean business should
consider the effort to track the cost and payback from a particular initiative a waste of
time and effort. A lean business should focus on track the performance of the whole
value stream (ibid; Baggaley and Maskall, 2005; Stenzsel et al, 2007). Respondents 2,
4, 5, 8 and 11 believe that a lean business should track the performance on the whole
value stream; but to learn from the lean event and improve the benefit realisation,
Lundbeck must also conduct tracking of each lean event.
Lundbeck should focus on gradually improving the estimation method (Respondent 2;
4; 5; 6). The benefit realisation mechanics needs to be suited after Lundbecks specific
organisational needs (Sapountzis et al, 2009). It can for example be improved by link-
ing the eight benefit realisation questions (see section 5.1) to the value stream analy-
sis, lean event and review of the event (ibid).
The conclusion from the analysis of the estimation method is that it is not possible to
estimate the potential of a single lean improvement. The management can only at-
tempt to ensure that the entire potential of the lean improvement has been harvested.
To find potential lean improvements and harvest their potential the management
needs to conduct tracking of the performance of a single lean event; and gradually
improve the estimation method and suit it after the suited the specific organisational
needs.

Chapter 5
42
5.3 A value streamed organisation
A lean organisation should be organised and managed after its value streams (Bag-
galey and Maskall, 2004). People and resources should be assigned to a specific value
stream (ibid). The value stream should be managed by a value stream leader; with
profit and loss responsibilities (ibid). It will improve the communication along the
value stream and visualise the value streams performance; resulting in improved abil-
ity to find suitable lean areas and harvesting their potential (ibid; Stenzel et al, 2007).
Lundbeck SOE’s management group has decided that Lundbeck should move towards
a value streamed organisation; the next step is to decide how to approach it (Respon-
dent 5; 6; 7; 8; 11). Lundbeck needs to evaluate if a value streamed organisation re-
quires a different organisational- and management structure (Respondent 4; 5). Re-
spondent 4 and 5 propose that a suitable first step could be to implement value stream
management on the ampoules and drops value stream.
The conclusion from the analysis of a value streamed organisation is that the man-
agement’s ability to find potential lean improvements, and ensuring that the entire
potential has been harvest, can be improved by implementing value stream manage-
ment. People and resources should be assigned to a specific value stream; managed by
a value stream leader with profit and loss responsibilities. From the analysis above
together with the analysis of the ground data (see 5.2.1) it is shown that a value stream
cost report is the perfect tool for a value stream manger. A value stream manager can
use the value stream cost report to seize the benefits of lean and ensure that the entire
potential has been harvested by auditing the overall financial performance of the value
stream.
5.4 Lean is not a cost reduction program
The literature highlights that business who adopts lean with the purpose to improve
the financial bottom-line will be disappointed (Basu, 2005; Baggaley and Maskall,
2004; Lewis, 2000; Stenzel et al, 2007; Emiliani and Stec, 2005). If the business fo-
cuses on cost-reduction it will undermine the business ability to make a transforma-
tion to a lean business (Stenzel et al, 2007, p. 168). Lean is not a cost reduction pro-
gram; it’s a business strategy. Lundbeck 2012 aspiration focuses on cost reduction;
reflecting on the business lean implementation. To be allowed to perform a lean event
at Lundbeck the events financial potential needs exceed 250.000 Danish crones. The
financial limit leads to a benefit realisation culture with a focus on the financial poten-
tial of an improvement rather than how it can increase Lundbeck’s overall competi-
tiveness (Respondent 2; 4; 5; 7). In the long run this can damage the whole lean trans-
formation of Lundbeck (ibid). Lundbeck is aware of this problem (Respondent 4).
Respondent 2 states that by using the eight questions (see section 5.1) to evaluate a
lean event potential Lundbeck makes it legal to host lean initiatives that do not finan-

Chapter 5
43
cially affect the bottom-line; but that can significantly improve Lundbeck’s com-
petiveness.
The conclusion from the analysis of lean is not a cost reduction program is that the
management is aware that a focus on cost-reduction will undermine the lean transfor-
mation. To improve the situation and make it legal to host lean event that can signifi-
cantly improve the business competitiveness, and not only reduce the cost of the busi-
ness, the management should use the eight benefit realisation questions to evaluate the
potential of a single lean event.
5.5 Lay-off policy
The literature recommends lean businesses not to realise lean benefits by laying-off
people (Emiliani and Stec, 2005; Stenzel et al, 2007; Lawrence Grass, e-mail, 2009-
07-14). By laying-off employees through lean initiatives a business undermines the
whole lean strategy (ibid). Lundbeck LEAN follows the litterateurs advice; and has
since the implementation of lean instituted a no lay-off policy (Respondent 4).
The conclusion from the analysis of the lay-off policy is that a no-lay-off policy
would not improve the management’s ability to seize benefits of lean. This is because
the management is already aware, and using, a no lay-off policy to support the lean
strategy.
5.6 Financial budget
The literature does not discuss the financial budget issue; only Nygaard (2008) states
that the targets of the key performance indicators have to be coordinated with the fi-
nancial budget. The literature do however emphasises that manager who stress on
short-term cost reductions undermines company’s ability to transform to a lean busi-
ness (Baggaley and Maskell, 2004; Stenzel et al, 2007). This could be interpreted as a
recommendation not to make a direct link to the financial budget. Lundbeck attempts
to include general lean trends and targets in the financial budget (Respondent 2; 6; 8;
11). Due to the relative low precision of the current estimated potential a direct link to
the financial budget is not suitable (Respondent 4; 5; 6; 8). Additionally a direct link
between a lean initiative and the financial budget increases the cost reduction stress;
undermining Lundbeck’s lean transformation (Respondent 4; 5).
The conclusion from the analysis of the financial budget is that a link between lean
and the financial budget would not improve the management’s ability to seize the
benefits of lean. This is because the precision of the estimated potential of lean is rela-
tive low and since a link to the financial budget could undermine the lean transforma-
tion of the business.

Chapter 5
44
5.7 Benefit tracking system
Measuring, monitoring and reviewing of benefits to maintain a continuous improve-
ment momentum is essential (Sapountzis et al, 2009; Reiss et al, 2006). The most tra-
ditional way is to use a benefit tracking sheet to monitor lean initiatives achievement
or non-achievement (Kaizen 13, 2006). Lundbeck uses a benefit tracking sheet to-
gether with an document to monitor and review the achievement of each lean event
(see section 4.2). Muir (2005) emphasises that underestimates the efforts required to
sustain the lean effort by relying on a simple spreadsheet. A lean business should
track lean initiatives using a well designed data base system with ties to the business
financial reporting- and human resource system (ibid). Businesses should use the sys-
tem to track lean initiatives and analyse the historic data based on fact in a standard-
ised form (ibid). A more clear structured lean system would improve the benefit reali-
sation of lean at Lundbeck (Respondent 1; 3; 4; 5; 8; 10). The system should contain
more information in a structured way and be linked to other Lundbeck systems (Re-
spondent 5; 8; 10). For example it could be linked directly to the production cost re-
port, the key performance indicators or resource utilisation control system (Respon-
dent 8).
The conclusion from the analysis of the benefit tracking system is that a tracking data
base would help the management to ensure that the entire potential of the lean im-
provement has been harvested. The tracking data base should be clear structured and
containing extensive tracking information with ties to the value streams key perform-
ance indicators, resource utilisation control system and production cost report.
5.8 Review of lean progress
Sapountzis et al (2009) suggest that a lean business use the following four phases to
realise the benefits from lean; develop a benefit management strategy, map the bene-
fits and create benefits profiles, create a benefit realisation plan and evaluate the bene-
fits and take actions. The evaluation phase is supported by Reiss et al (2006) who
state that management needs to monitor, reports and responds to lean initiatives
achievement or non achievement. The respondent’s highlights that the review and
evaluation of the lean progress at Lundbeck is limited (Respondent 4; 5; 7; 8; 10; 11).
Womack et al (2005) and Reiss et al (2006) state that it’s important that a lean busi-
ness should install a review system that provides an early warning detection; indicat-
ing and diagnosing the reasons for the current situation; give suggestions on remedial
actions; and monitor the result of those actions.
The lean review at Lundbeck consists of; a monthly meeting between the people in-
volved with the lean events and; a weekly evolution of key performance indicators
performance and the lean-departments review of each lean initiatives performance
(Respondent 1; 4; 7). The monthly review meeting between the people involved is
supported by Chanski (2007) who suggests that a governing committee should meets
Chapter 5
45
once a month to discuss and if needed take actions. The article Kaizen 13 (2006) adds
that a governing committee should be responsible for monitoring, reviewing and re-
sponding to a lean initiatives performance. The governing committee should be re-
sponsible for ensuring the success of a lean initiative and clearing any obstacles and
constrains that could impede improvements efforts. Respondent 1, 5, 8 and 10 state
that Lundbeck lack a discussion regarding underperforming realisation; it must lead to
consequences if the lean benefit realisation fails.
The review of the lean process especially needs to move closer to the value streams
performance (Respondent 1; 4; 5; 11). This is supported by Lawrence Grasso (e-mail,
2009-07-14) who believes it’s more important to evaluate leans aggregated effect on
the value streams operative and financial performance. Respondent 11 propose a quar-
terly review meeting.
Additionally respondent 2, 4 and 6 believes that the realisation review of each value
stream needs to be improved. By reviewing a lean initiatives performance using the
eight questions (see section 5.1) as a definite closer of an event could be a solution.
This is supported by respondent 1, 5 and 10 who state that Lundbeck is missing a
definite closer of each event.
Womack et al (2004) and Rother et al (2004) recommends use the action plan to set
timelines for follow- ups. Respondent 3 states that Lundbeck uses the action plan to
coordinate and define when something should be done.
The conclusion from the review of the lean progress is that an expanded review would
help the management to ensure that the entire potential of a lean improvement has
been harvested. The review should be expanded by quarterly reviews of the aggre-
gated benefit realisation from lean for each value stream. Additional the above analy-
sis together with the analysis of the benefit classification (see 5.1), the estimation
method (see 5.2.2) and lean is not a cost reduction program (see 5.4) shows that the
business should review the benefit realisation using the eight benefit realisation ques-
tions (see section 4.2) at the value stream analysis, during the lean event and three
months after implementation.
5.9 Leadership participation
A common error that significantly affects a business ability to perform and seize the
benefits of lean is the lack of leadership participation in the lean transformation
(Emiliani and Stec, 2005; Baggaley and Maskall, 2004; Stenzel et al, 2007). Top
managers needs to be dedicated to the execution and realisation of lean (Baggaley and
Maskell, 2004). Respondent 2 agrees that this is a problem; while most of the other
respondents states that at the teams at the value stream analysis and lean events con-
sists of both top managers and operators from all parts of the value stream; people
who are motivated to realise the potential of lean (Respondent 1; 3; 4; 5; 8).

Chapter 5
46
The conclusion from the analysis of the leadership participation is the managers of the
business are already dedicated to the execution and realisation of lean; further leader-
ship participation would not improve the manager’s ability to seize the benefits of
lean.

Chapter 6
47
6 Conclusions and discussion
In this section the conclusions of the study is presented by answering the research
questions. Further the result and the relevance of the study is discussed. Additional
the section proposes suitable areas for further research.
The purpose of the thesis was to improve the management’s ability to seize the finan-
cial and competitive benefits of lean by improving the management’s ability to find
potential lean improvements; and ensuring that entire potential of the improvements
has been harvested has been investigated.
6.1 Research question 1
How to improve management’s ability to find potential lean improvements?
A lean business uses maps of the current- and future state of the business’ value
streams to find suitable areas for lean initiatives. It is the specific organisations needs
that determine how the management’s ability to find potential lean improvements that
can be improved. At Lundbeck the management’s ability to find potential lean im-
provements can be improved by;
- Implementing value stream management. A lean business should be organ-
ised and managed after its value streams. People and resources should be as-
signed to a specific value stream; managed by a value stream leader with
profit and loss responsibilities. It would improve the understanding, visualisa-
tion and sharing of the value streams performance; and avoid that lean im-
provements leads to sub optimisation.
- Produce value stream cost reports. A cost report for each value stream
would increase the understanding and communication of the value streams fi-
nancial performance. It would provide valid and accurate information for the
decision making; improving the management’s ability to find potential lean
improvements. It is a good and necessary tool for a value stream manager
when auditing the value streams overall financial performance.
- Setting up ground data guidelines. Guidelines for the measuring, controlling
and reporting of ground data would improve the management’s ability to find
potential lean improvements. The decision making of lean should be based on
facts; not assumptions. Guidelines make sure that the right people have the
right information at the right time. Lundbeck’s guidelines should enhance key
performance indicators, resource utilisation and financial information from the
value stream’s cost reports.
Chapter 6
48
6.2 Reserach question 2
How can the management ensure that the entire potential of the lean improvement has
been harvested?
The value stream map of the future state displays when the entire potential of lean has
been harvested; and the gap between the current- and future state defines the lean ini-
tiatives aggregated potential. The subject expert’s claims that managements focus
should be on continuously improving the value streams performance; not on harvest-
ing the entire potential of each lean improvement. This is true for lean businesses that
have continuous improvements integrated into daily work activities. For businesses
that attempts to be lean, but have not integrate continuous improvements into the daily
work activities, it still is important to ensure that entire potential of a lean improve-
ment is harvested. But the fact is that this is not possible. A business can only attempt
to ensure that the entire potential of the lean improvement has been harvested.
It is the specific organisations needs that determine how the management can attempt
to ensure that the entire potential of the lean improvement has been harvested. Lund-
beck LEAN uses week-long lean events to improve its business and move closer to
the future state. The current realisation method consist of a benefit tracking sheet
tracking all lean events, a document tracking each lean event and a monthly review of
the lean events with the specific department. Additionally the lean coach of each lean
event continuously reviews the realisation together with the lean-department. The
following improvements would help the management to ensure that the entire poten-
tial of the lean improvement has been harvested by;
- Develop a tracking data base. Lundbeck should track all lean events using a
clear structured data base system containing extensive tracking information
with ties to the value streams key performance indicators, resource utilisation
control and cost reports. An improved benefit tracking system would base the
decisions on facts; not assumptions.
- Expand the review of the lean progress. Lundbeck should review the reali-
sation using the eight questions (see section 4.2) at the value stream analysis,
during the lean event and three months after implementation. Additionally
quarterly reviews of the aggregated benefit realisation from lean for each
value streams performance should be hold. The expanded review system
would establish platforms that would support the management to ensure that
the entire potential of the lean improvement has been harvested.
Furthermore implementing a value stream management, value steam cost reports and
ground data guidelines would additionally help the management to ensure that the
entire potential of the lean improvement has been harvested.
Chapter 6
49
6.3 Discussion
The study clearly supports that it is the specific organisational needs that determines
how the management’s ability to seize the financial and competitive benefits of lean
should be improved. Due to this is it important to highlight that the result of the study
may not support the needs of other lean organisations.
The study for example claims that Lundbeck’s ability to find potential lean improve-
ments; and ensuring that the potential has been harvested would be improved by de-
veloping value stream cost reports. A value stream cost report should be used by the
value stream manager to audit, understand and communicate the performance of the
value stream. But for a business that has adopt lean accounting a value stream cost
report would probably already have better financial information about the value
streams performance; and the cost reports would be seen as waste that should be
eliminated. This makes it difficult to transfer the result of the study to other environ-
ments with other organisational needs. The study does however provide new knowl-
edge regarding how the management of an organisation with Lundbeck’s needs can
improve its ability to seize the financial and competitive benefits of lean.
Additionally Lundbeck has not been able to integrate continuous improvements into
daily work activities. However most of the business adopting lean is however in the
same situation as Lundbeck; it is problematic to become a lean business. The man-
agement of these businesses needs to know how to improve the ability to seize the
financial and competitive benefits of lean without a strong continuous improvement
culture. For these businesses the most difficult aspect often is to ensure that the entire
potential of the lean improvement has been harvested. The management has to gradu-
ally, step by step, improve the realisation of lean by continuously improving the bene-
fit realisation system by suiting it after the current business needs.
From the result of this study I would like to highlight the need of setting up guidelines
for the ground data. To improve the management’s ability to seize the financial and
competitive benefits of lean all the decision must be based on facts; not assumptions.
An interesting discovery regarding the ground data was the resource utilisation con-
trol system used by the quality-production division. The system is consistent with the
resource capacity category table proposed by the literature and subject experts. Inter-
esting is that the management had not developed the system with the purpose to sup-
port lean; instead it was developed to improve the ground data used to track the per-
formance of the operations within the division. This indicates that the business needs
goes hand in hand with improvements attended to improve the lean realisation.
I would also like to emphasise on that the result of this study do not provide the defi-
nite way of how the management of Lundbeck should improve the ability to seize the
benefits of lean. The result only shows improvement’s that are supported by either the
thesis theoretical framework or the empiric data. Further studies to improve the man-

Chapter 6
50
agement’s of Lundbeck’s ability to seize the benefits of lean would probably be able
to find additional improvements.
At last I would like to recommend the management of Lundbeck to make a strong
effort to integrate continuous improvement effort into the daily work activities; result-
ing in a decreased length of the lean events. This would make Lundbeck LEAN move
closer to the true essence of lean.
6.4 Suggestions for further research
The literature review and the contact with subject experts Briand Maskell and Law-
rence Grasso indicate that there is much to explore and confirm within benefit realisa-
tion of lean. The subject experts highlight the need of a more extensive knowledge
regarding increasing the benefit realisation of lean by implementing lean accounting
principles; implementing value stream costing and eliminating standard- and variance
costs.
Additionally I propose that the result of this study should be further explored by in-
vestigating the most suitable path to a value streamed organisation; the knowledge
within the academic and professional world seems to be limited.
I also perceive that most of the lean business finds it’s problematic to ensure that the
entire potential of a lean improvement has been harvested. The literature of this area
is to say the least inadequate.
Another research field I myself would like to propose is to further investigate how a
lean business should actualise a profitability gain from lean on a declining market. To
actualise profitability gain a lean business must grow its business or eliminate the free
resources; this issue especially becomes problematic for a lean business having a no-
lay-off policy.
51
Reference list Abnor, I., & Bjerke, B. (1994). Företagsekonomisk metodlära. Lund: Studentlittera-
tur, 65-77.
Bhasin, S. (2008). Lean and performance measurement. Journal of manufacturing
atechnology management, 19(5), 670-684.
Basu, R. (2009). Implementing Six Sigma and Lean: a practical guide to tools and
techniques. London: Elsevier Butterworth-Heinemann.
Burton, R., Terence, T., & Boeder, S.M. (2003). Lean extended enterprise: moving
beyond the four walls to value stream excellence. Boca Ration, USA: Ross Publish-
ing.
Colin, H. (2007). Lean or flabby? Manufacturing, 86(5), 36-39.
Dennis, P. (2007). Lean production simplified – a plain language guide to the world’s
most powerful production system. New York: Productivity press.
Denscombe, M. (2000). Forskningshandboken. Lund: Studentlitteratur.
Emiliani, M.L., Stec, D., Grasso, L., & Stodder, J. (2003). Better Thinking, Better
Results. Kensington, CT: The Center for Lean Business Management.
Emiliani, M.L., Stec, D., & Grasso, L. (2005). Unintended responses to a traditional
purchasing performance metric, Supply Chain Management: An International Jour-
nal, 10 (3).
Emiliani, M.L., & Stec, D. (2005). Leaders lost in transformation, Leadership & Or-
ganisation Development Journal, 26(5), 370-387.
Eriksson, L.T., & Wiedersheim-Paul, F. (1997). Att utreda, forska och rapportera.
Malmö: Liber Ekonomi.
Farbey, B., Land, F., & Targett, D. (1999). The moving staircase: problems of ap-
praisal and evaluation in a turbulent environment, Information Technology and Peo-
ple Journal, 12, 238-52.
Glynne, P. (2007), Benefits management – changing the focus of deliv-
ery", Association for Progress Management Yearbook, 45-9.
Holme, I.M., & Solvang, B.K. (1991). Forskningsmetodik. Lund: Studentlitteratur.
52
Lewis, J. (2001). Set the stage for success, Upholstery Design & Management, 14(9),
1-4.
Liker, J. (2004). The Toyota Way: 14 Management Principles from the World’s
Greatest Manufacturer. New York: McGraw-Hill.
Kagioglou, M., Cooper, R., Aouad, G., & Sexton, M. (2000). Rethinking construc-
tion: the generic design and construction process protocol, Engineering, Construction
and Architectural Management Journal, 7(2) , 141-53.
Keyte, B., & Locher, D. (2004). The Complete Lean Enterprise: Value Stream Map-
ping for Administrative and Office Processes. New York: Productive press.
Malone, T., & Sinnett, W. (2005). Performance management, Financial Executive,
21, 60-3.
Maskell, B., & Baggaley, B. (2004). Practical Lean Accounting: a proven system for
measuring and managing the lean enterprise. New York: Productivity press.
Muir, A. (2005). Lean Six Sigma statistics: calculating process efficiencies in transca-
tional projects. New York: McGraw-Hill.
Nilsson, T. (1997). Kundageranden I små tillverkande företag: fallstudier av tre före-
tag. Doktorsavhandling vid Luleå Tekniska Universitet.
Reiss, G., Anthony, M., Chapman, J., Leigh, G., Pine, A., & Rayners, P.
(2006). Gower Handbook of Programme Management. Aldershot: Gower Publishing.
Rother, M. & Shook, J. (2004). Learning to see – value stream mapping to create
value and eliminate waste. Brrokline, US: The lean enterprise institute.
Ruffa, S. (2008). Going Lean: how the best companies apply lean manufacturing
principles to shatter uncertainty, drive innovation and maximise profits. New York:
Amacom.
Sapountzis, S., Yates, K., Kagioglou, M., & Aouad, G. (2009). Realising benefits in
primary healthcare infrastructures, Facilities, 27 (3/4), 74-87.
Standard, C., Davis, D. (2000). Lean thinking for competitive advantage, Automotive
Manufacturing and Production, 1-3.
Stenzel. J. (2007). Lean Accounting: Best practises for sustainable integration. Hobo-
ken, New Jersey: John Wiley & Sons Inc.

53
Ward, J., & Daniel, E. (2006). Benefits Management: Delivering Value from IS & IT
Investments. Chichester: Wiley.
Womack, J. (2004). Lean beyond the factory. Brookline, M.A.: Lean Enterprise Insti-
tute.
Womack, J., Jones, D., & Roos, D. (1990). The Machine that Changed the World.
New York: Simon & Schuster Inc.
Womack, J., Jones, D. (2005). Lean Solutions. London: Simon & Schuster.
Womack, J. and Jones, D. (2003). Lean Thinking: Banish Waste and Create Wealth in
your Corporation. London: Simon & Schuster.
Zikmund, W.G. (2000). Business research metods. Forth Worth: Dryden Press
Appendix 1: Interview guide The interview questions have been alternated depending on the respondent and the
specific issue of interest. The frame work below is an example of how an interview
guide has been looking like.
Benefit realisation from LEAN initiatives
a. How good is Quality production at benefit realisation from lean?
- Give examples of good and bad aspects
b. What problems does Quality production have with benefit realisation?
- Give examples of improvements that are hard to realise
c. Does Quality production need more support to improve realisation of lean
and other improvements
- Ex. Finance and accounting department
d. What methods do you use to improve the realisation of benefits from lean
and other improvements?
- Who is (and should be) responsible?
e. What improvements can be made to address these benefit realisation prob-
lems?
Tracking procedures of LEAN
a. Does the tracking system satisfy Quality production’s needs?
- What is good and bad with current procedures?
b. What problems are there to measure the performance of an improvement
on the financial bottom line? Give examples
c. What can be improved with the current procedure?
- Estimations of potential and actual value
- Structure of procedure
d. How is the benefit realisation from lean initiatives reviewed?
- Do you follow up on low realisation rates etc?
e. Can the review procedure be improved?
f. Do you believe tracking of lean initiatives helps Quality productions work
and Lundbeck in achieving its ambitions?
- Budget, potential and even actual does not show the true value of the
lean initiatives
- Tracking the value streams shows the true value of lean (see Box
Score)
-
Improvements and financial estimations
a. How does Quality production link improvements to financial estimations?
- Budget, E1, E2, Production report
b. Do you use any specific information from the benefit tracking sheet of lean?
c. How can the link between benefit tracking of lean and financial estimations be
improved?

d. What do you think of making a direct link between LEAN initiatives and
budget estimations?
- Potential value, actual value
Production report
a. How do you use the production report in your daily work?
b. Would a link between production report and LEAN initiatives improve the re-
alisation of LEAN?
c. How can a link be made?
- Benefit tracking of FTE (and other capabilities)
Anything else you would like to add regarding benefit realisation from LEAN?
Value stream
a. What do you think about moving Lundbeck towards a value streamed organ-
ised organisation?
b. What problems are there with this development?
c. Should Lundbecks financial controlling move towards value stream costing
instead of functional controlling?
d. What do you think about the current procedures of using standard cost to esti-
mate Quality production’s financial status?
Anything else you would like to add regarding value streams?

Appendix 2: Respondents
Respondent 1, lean coach, 26 of June 2009
Respondent 2, production cost controller, 29 of June 2009
Respondent 3, lean coach, 1 of July 2009
Respondent 4, divisional director, 2 of July 2009
Respondent 5, lean coach, 3 of July 200
Respondent 6, assistant to functional director, 8 of July2009
Respondent 7, head of department, 13 of July 2009
Respondent 8, divisional director, 15 of July 2009
Respondent 9, head of department, 17 of July 2009
Respondent 10, lean coach, 20 of July 2009
Respondnt 11, divisional director, 28 of July 2009
Respondent 12, head of department, 3 of August 2009
Respondent 13, lean coach, 23 of August 2009