20101011 for 20101006 Econ 1
22
Economics 1: Fall 2010 J. Bradford DeLong, Michael Urbancic, and a cast of thousands... hAp://delong.typepad.com/econ_1_fall_2010/
-
Upload
james-delong -
Category
Documents
-
view
214 -
download
0
description
hAp://delong.typepad.com/econ_1_fall_2010/
J.
Bradford
DeLong,
Michael
Urbancic,
and
a
cast
of
thousands...
• Were
Chinese
living
standards
on
average?
Transcript of 20101011 for 20101006 Econ 1

Economics 1: Fall 2010
J. Bradford DeLong, Michael Urbancic, and a cast of thousands...
hAp://delong.typepad.com/econ_1_fall_2010/

Ladies and Gentlemen, to Your i>Clickers...
• Were Chinese living standards on average? – A. Higher in 1820 than in 1968, and higher today than in 1968.
– B. Higher in 1820 than in 1968, and higher in 1968 than today.
– C. Lower in 1820 than in 1968, and higher in 1968 today?
– D. Lower in 1820 than in 1968, and higher today than in 1968?

Administrivia • PresentaUon arUcles
– SecUon 13 (October 11-‐13) • People making choices under constraints • “Box-‐office revenue up for 2009: It's not just higher Ucket prices: More people
are going to the movies, even as the recession has depressed consumer spending in nearly every other category,” by Ben Fritz. Los Angeles Times (December 14, 2009) hAp://laUmes.com/business/la-‐fi-‐ct-‐boxoffice14-‐2009dec14,0,5678666.story
– SecUon 14 (October 13-‐18) • A complex division of labor coordinated by a market: • Leonard Read (1958), "I, Pencil" <hAp://www.econlib.org/library/Essays/
rdPncl1.html> (ac. June 7, 2010) – SecUon 15 (October 18-‐20)
• Supply and demand • “Food Prices Are Rising Worldwide: Weather, Oil Costs among Factors,” by
Katherine Corcoran, Boston Globe, (March 30, 2008) hAp://Unyurl.com/8qkgnb
– SecUon 16 (October 20-‐25) • IncenUves and rewards • “In Praise of Price Gouging,” by John Stossel. Posted at Townhall.com,
September 7, 2005. hAp://www.townhall.com/columnists/JohnStossel/2005/09/07/in_praise_of_price_gouging

Administrivia • By now you have read the first 264 pages of Seabright, The Company of Strangers... – What do you think of the argument that large-‐scale human socio-‐economic cooperaUon is an interesUng puzzle that needs to be explained? And what do you think of Seabright’s aAempted answers?
– By the start of lecture on October 13, write a short two-‐page essay intended to explain what Seabright’s central argument is to somebody who has not read the book, and giving your evaluaUon of his central argument.

Economics 1: Fall 2010: Economic Growth II
J. Bradford DeLong
October 4, 2010, 12-‐1 Wheeler Auditorium, U.C. Berkeley

Guessing at Some Numbers • Growth rates of populaUon
– HG: 0.01%/year – AS: 0.05%/year – EM: 0.2%/year – >1800: 1.0%/year
• Growth rates of technological and organizaUonal knowledge – HG: ???? – AS: 0.01%/year – EM: 0.09%/year – IS: 2%/year
• Growth rates of global GDP – AS: 0.05%/year – EM: 0.2%/year – EIS: 1.4%/year – IS: 3.4%/year

Convergence to 2009

Why Divergence to 1968?
• The agrarian legacy – China’s populaUon has grown by a factor of 7 since 1800 – Egypt’s by a factor of 30 – If most of your people are sUll unmechanized farmers, that is a
huge set of headwinds • The infrastructural task
– Even if most of your people aren’t unmechanized farmers and live in ciUes, a rapid populaUon growth rate means a large investment burden
• DifficulUes of technology transfer • DifficulUes of government
– Communism – CorrupUon

Why Convergence Aqer 1968?
• End of High Communism • Expansion of world trade • Technology transfer • But if you look at it, the big difference between before 1968 and aqer 1968 is the different desUnies of two countries – China – India – If you count one-‐country-‐as-‐one, rather than one-‐person-‐as-‐one, it is hard to see a paAern

Ladies and Gentlemen, to Your i>Clickers...
• What number should you have in your head for global living standards before 1500? – A. $100 per capita per year – B. $500 per capita per year – C. $1000 per capita per year – D. $7000 per capita per year – E. $55000 per capita per year

Factors of ProducUon and Economic Growth
• Physical capital and resources (K) • Labor (L) • Human skills, acquired via educaUon and experience (H) • Factor income version of the circular flow:
– Y = rK + wL + sH • Difference it:
– ΔY = r(ΔK) + w(ΔL) + s(ΔH) – What would you expect an extra lathe to be worth? Well, about
what the average lathe is worth. – Thus this equaUon tells you what you would expect the rate of
economic growth to be as a result of factor accumulaUon

Factors of ProducUon and Economic IncenUves
• A growth equaUon: – ΔY = r(ΔK) + w(ΔL) + s(ΔH)
• IncenUves – Capital: incenUves to save and invest – Skills: incenUves to go to school, and to pay aAenUon on the job
• Benefits of a private market system: – Pushes the decisions about factor accumulaUon out to the periphery
– Gives people at the periphery the right incenUves

The Solow Residual
• A growth equaUon: – ΔY = r(ΔK) + w(ΔL) + s(ΔH)
• Plug in numbers for the U.S. today in an average year – ΔY = rK(ΔK/K) + wL(ΔL/L) + sH(ΔH/H) – ΔY = (0.3)(3%/year) + (0.3)(0.7%/year) +(0.4)(1%/year) – 3%/year ΔY ≠ r(ΔK) + w(ΔL) + s(ΔH) = 1.5%/year
• Half of all economic growth—2/3 of all growth in output per capita—does not come from factor accumulaUon, but from something else
• This is why Bob Solow won the Nobel Memorial Prize in Economic Sciences

Total Factor ProducUvity
• Sources of the Solow Residual – Technology – Business organizaUon – Market organizaUon
• And here we have a big incenUve problem – Those who invent and innovate new technologies, new organizaUons, and new markets are enormous public benefactors
– But they don’t get the rewards of what they do—the rewards spillover
– Patents and copyrights • In the U.S. ConsUtuUon • Resolve the problem • But at the cost of creaUng another problem...
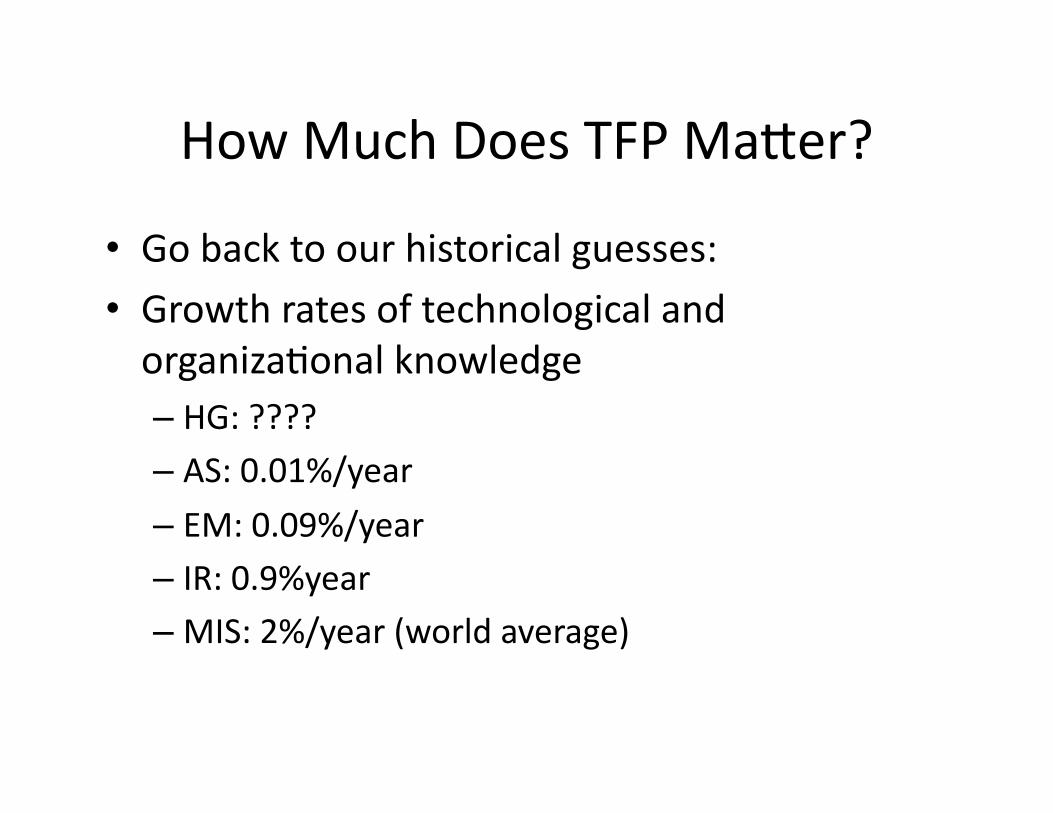
How Much Does TFP MaAer?
• Go back to our historical guesses: • Growth rates of technological and organizaUonal knowledge – HG: ???? – AS: 0.01%/year – EM: 0.09%/year – IR: 0.9%year – MIS: 2%/year (world average)

Market OrganizaUon
• We have a “natural experiment” • High Stalinist central planning
– Marxian suspicion of markets – Hence we won’t have any
• Reproduce the Rathenau-‐Ludendorff World War I Imperial German war economy – Communes, economies of scale, GOSPLAN, etc. – Overall producUvity? 20% of market economies
• Military producUvity is another story—at least during WWII
• You throw away a five-‐fold amplificaUon of producUvity by eschewing the market – SUll, we have a 18-‐fold worldwide TFP gain since 1800 – A 72-‐fold worldwide TFP gain since 8000 BC

Business OrganizaUon and Technology
• So mixed together that they are very hard to separate • We have a 18-‐fold worldwide TFP gain since 1800.
– If one doubling of that is due to “extent of the market,” then we have a 9-‐fold worldwide TFP gain from business organizaUon and technology
• A 72-‐fold worldwide TFP gain since 8000 BC – If markets are responsible for a 5-‐fold increase, that gives us a 14-‐fold worldwide TFP gain from business organizaUon and technology
• And if we could get everyone up to San Francisco Bay standards – That would be a further 7-‐fold amplificaUon

Followership: The Importance of InsUtuUons

Leadership: A Much Lower Speed Limit
• Silicon Valley • Not just technologies, but technologies people would like to use
• Not just technologies people would like to use, but delivered at an affordable price
• Plus the innovators have to be able to make a profit – Without imposing very large restricUons on the social uUlity we derive from their innovaUons
– Google Books...

Ladies and Gentlemen, to Your i>Clickers...
• What share of U.S. growth in an average year is due to total factor producUvity improvement? – A. 1/10 – B. 1/3 – C. 2/3 – D. 3/4 – E. All

Ladies and Gentlemen, to Your i>Clickers...
• What share of Chinese growth since 1975 is due to total factor producUvity improvement? – A. 1/10 – B. 1/3 – C. 2/3 – D. 3/4 – E. All

Test Your Knowledge
• What is the average rate of worldwide improvement in TFP over the past century?
• Why do we fear that the market economy is not a good social calculaUng machine for producing the “right” amount of TFP growth?
• How much damage does High Stalinist aboliUon of markets do to an economy?
• About how much beAer is our technology here in San Francisco Bay today than technology in Gilgamesh’s Uruk back in the early days of agriculture?


![Economics (ECON) ECON 1402 [0.5 credit] Also listed as ...](https://static.fdocuments.us/doc/165x107/6157d782ce5a9d02d46fb3da/economics-econ-econ-1402-05-credit-also-listed-as-.jpg)