
189 ' # '6& *#1 & 7cdn.intechopen.com/pdfs-wm/13169.pdf13 Data Retrieval and Visualization for...
22
3,350+ OPEN ACCESS BOOKS 108,000+ INTERNATIONAL AUTHORS AND EDITORS 115+ MILLION DOWNLOADS BOOKS DELIVERED TO 151 COUNTRIES AUTHORS AMONG TOP 1% MOST CITED SCIENTIST 12.2% AUTHORS AND EDITORS FROM TOP 500 UNIVERSITIES Selection of our books indexed in the Book Citation Index in Web of Science™ Core Collection (BKCI) Chapter from the book Knowledge-Oriented Applications in Data Mining Downloaded from: http://www.intechopen.com/books/knowledge-oriented- applications-in-data-mining PUBLISHED BY World's largest Science, Technology & Medicine Open Access book publisher Interested in publishing with IntechOpen? Contact us at [email protected]
Transcript of 189 ' # '6& *#1 & 7cdn.intechopen.com/pdfs-wm/13169.pdf13 Data Retrieval and Visualization for...

3,350+OPEN ACCESS BOOKS
108,000+INTERNATIONAL
AUTHORS AND EDITORS115+ MILLION
DOWNLOADS
BOOKSDELIVERED TO
151 COUNTRIES
AUTHORS AMONG
TOP 1%MOST CITED SCIENTIST
12.2%AUTHORS AND EDITORS
FROM TOP 500 UNIVERSITIES
Selection of our books indexed in theBook Citation Index in Web of Science™
Core Collection (BKCI)
Chapter from the book Knowledge-Oriented Applications in Data MiningDownloaded from: http://www.intechopen.com/books/knowledge-oriented-applications-in-data-mining
PUBLISHED BY
World's largest Science,Technology & Medicine
Open Access book publisher
Interested in publishing with IntechOpen?Contact us at [email protected]
13
Data Retrieval and Visualization for Setting Research Priorities in Biomedical Research
Hailin Chen and Vincent VanBuren Texas A&M Health Science Center,
United States of America
1. Introduction
Over the past two decades, particularly after the completion of the human genome project, biomedical research has produced a huge amount of data. With the expansion of information technology, investigators have gained basic competency with integrating different resource data sets into unions. The basic principle of this integration is to use the co-occurrence of the same or similar (orthologous) elements in different data sets as links between those data sets. Increasingly more experiment-based databases have been established, which facilitates this integration of data sets. During this blooming period of biomedical research, high-throughput experimental data is fuelling systems biology research. In the pre-genomic era, researchers were only capable of conducting experiments with a single gene or a single protein at a time, which could not provide a global perspective on the molecular interactions that bridge the gap between external signal and internal response. Within the past two decades, several high-throughput technologies have been developed to address this difficulty. Expression microarrays detect the relative abundance of gene transcripts by comparing two or more biological conditions, and have become a common tool for screening thousands of genes for expression changes in response to a perturbation, or to track transcriptional changes in developmental processes. As a way of visualizing and interpreting the flood of data in recent years, the creation of biological networks from data became a prevalent target in biomedical research recently, including the construction of protein-protein interaction networks (PPN), gene regulatory networks (GRN), and metabolic and signaling networks and pathways, as well as disease-related or cell function-related networks. The integrative strategy of combining different data sets is a natural way of setting up networks. Also, based on the data obtained from high-throughput experiments, networks may be created by modeling the internal relationships of these data. Several popular analytical approaches are being utilized to model networks (Gebert, et. al., 2007; de Jong, 2002). Boolean networks describe each element as a variable with the value 0 or 1 to represent the state of the element as ‘off’ or ‘on’, respectively. Modeling networks by means of Boolean network became popular in the wake of a groundbreaking study by Kauffman. Kauffman employed Boolean networks to model the global properties of large-scale regulatory systems, which is called Kauffman’s NK Boolean networks. An NK automaton is an autonomous random network of N Boolean logic elements with each element having K inputs and one output, all taking binary (0 or 1) values. If K is large, like K=N, the network
www.intechopen.com

Knowledge-Oriented Applications in Data Mining
210
behavior is essentially stochastic. However, when K~2, the network behaves with a high degree of observed order. NK automata were thus condidered as a model of gene regulaory network. Kauffman noted that the case of K~2 was appropriate for modelling gene regulatory networks, especially in an evolutionary context (Kauffman, 1969). A Boolean network G(V,F) is defined by a set of nodes corresponding to genes V = {x1,…,xn} and a list of Boolean functions F = (f1,…,fn). The future state of an element is completely determined by the values of the states of other elements (regulators) by means of underlying logical Boolean functions that are defined as part of the model.
Bayesian networks model the biological network with a directed acyclic graph. For each
element, a conditional distribution p( vx | parents( vx )) is defined, where parents( vx )
denotes the variables corresponding to the direct regulators of the element. Together
defining the Bayesian network, this conditional distribution for each element uniquely
specifies a joint probability distribution p( x ).
( )( ) ( | )v pa vv V
p x p x x∈
=∏ (1)
Bayesian network modeling equation
Differential equations extract the network from high-throughput experimental data by considering the instantaneous concentration of each element. The instantaneous
concentration of each element is completely determined by the concentration ( nx ) of other
elements providing a regulation function.
1( ,..., , )ii n
dxf x x t
dt= (2)
Differential equation modeling
Co-expression models networks from statistical analysis, and may be based on a large number of data sets collected from public repositories. Co-expression is often based on co-variance analysis. However, comparison between the co-variances among data sets having different scales would be difficult. The Pearson correlation coefficient addresses this difficulty. It measures the co-expression between every two elements with the value in the range from -1 to 1, which allows networks to be established based on some threshold value for the magnitude of the correlation.
cov( , ) [( )( )]
( , ) X Y
X Y X Y
X Y E X Ycorr X Y
μ μσ σ σ σ
− −= = (3)
Pearson correlation coefficient equation
Combining prior knowledge into the process of network inference is often accomplished with supervised learning algorithms. The basic principle is to use natural inductive reasoning for prediction of new regulations based on the similarity of their experimental profiles to that of known regulatory elements. Knowledge-based simulation is also called rule-based simulation in the field of artificial intelligenece. Rule-based simulations contain two parts, the set of facts and the set of rules. Facts offer knowledge of each object in the network, while rules including a condition component and an action component make judgment on objects according to the conditions and operate upon the objects’ behavior via
www.intechopen.com

Data Retrieval and Visualization for Setting Research Priorities in Biomedical Research
211
actions once the conditions are satisfied. This simulation algorithm repeats the process of matching the facts in the knowledgebase against the conditions in the rule part and executes actions when the approriate conditions are satisfied (de Jong, 2002). A variety of analytical approaches are being used to construct networks from either established databases or from high-throughput experimental data. This has led to a need for tools to visualize and analyze these networks. This need stimulated the ongoing creation of numerous algorithms and software applications for constructing, manipulating and analyzing networks. Many of those are general-purpose programs with applications to most of the commonly employed types of complex networks, including social, transportation, communication, and financial networks. Typically, transcriptional regulatory models are constructed for a particular cellular process or physiological/disease pathway of interest. The construction of networks from established databases or from high-throughput experimental data offers a visual tool for developing new hypotheses regarding underlying molecular interactions. These new well-informed hypotheses will serve as the basis for conceiving new biomedical experiments to confirm or reject these predicted interactions, and thus serve an important role in setting research priorities. In this chapter, we are going to focus our attention on selected examples of data retrieval and visualization tools, including the STRING database and Cytoscape, and compare these popular tools with with our new web based software, StarNet and Cognoscente, for use in setting research priorities for biomedical studies.
2. Data retrieval
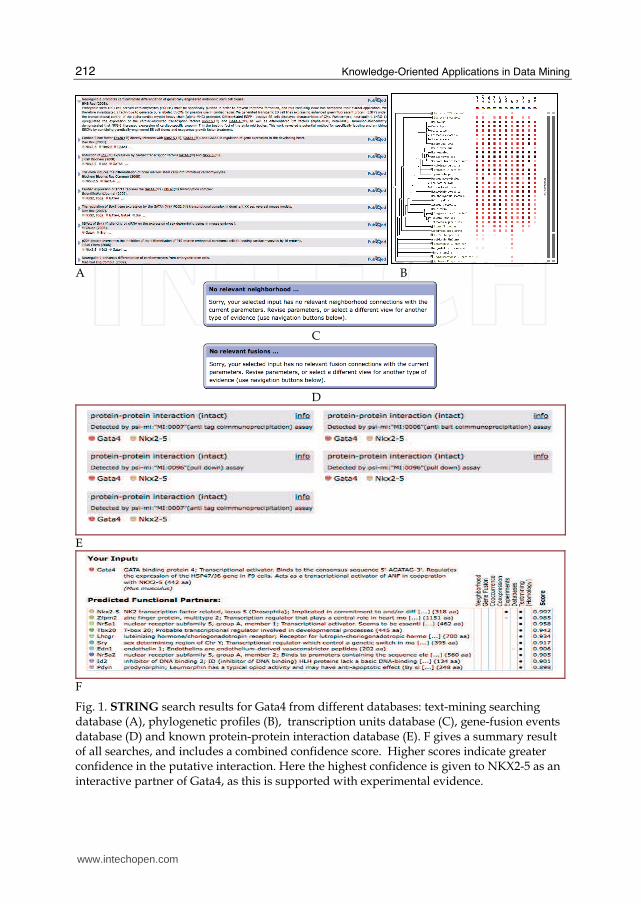
The STRING database was primarily constructed from the integration of phylogenetic profiles, a database of transcription units and a database of gene-fusion events by the Bork and Snel groups (Snel et al., 2000; von Mering et al., 2003; von Mering et al., 2005; von Mering et al., 2007, Jensen, et al., 2009). Users may infer putative protein-protein interactions with a confidence score based on the constituent relationships in this integrative database. Phylogenetic profiles are derived from an evolutionary tree. During evolution, functionally linked proteins tend to be either preserved or eliminated in new species simultaneously. This property of correlated evolution is characterized for each protein by its phylogenetic profile, and STRING encodes the presence or absence of an orthologous protein in every known genome. Those proteins having matching or similar profiles have a strong tendency to be functionally linked. Transcriptional units (operons) are extracted from a number of genomes by identifying the conserved gene clusters. Genes in a transcriptional unit are hypothesized to be functionally linked. Gene-fusion events can be understood by the following example. The interacting proteins GyrA and GyrB subunits of E.coli DNA gyrase are orthologs of a single fused chain (topoisomerase II) in yeast. Thus, the similarities of GyrA and GyrB to some segment of topoisomerase II might be used to predict their functional interaction in E. coli. STRING is being developed as a multi-dimensional database by combining its three original database components (phylogentics profiles, transcription units, and and gene fusions) together with known protein-protein interactions, an expression database and a database of putative protein-protein interactions found via a text-mining search in Pubmed. Below we show an example of a STRING query (http://STRING-db.org/) of the protein-protein interactions seeded by Gata4, a well-known transcription factor in cardiac development (Figure 1).
www.intechopen.com
Knowledge-Oriented Applications in Data Mining
212
A B
C
D
E
F
Fig. 1. STRING search results for Gata4 from different databases: text-mining searching database (A), phylogenetic profiles (B), transcription units database (C), gene-fusion events database (D) and known protein-protein interaction database (E). F gives a summary result of all searches, and includes a combined confidence score. Higher scores indicate greater confidence in the putative interaction. Here the highest confidence is given to NKX2-5 as an interactive partner of Gata4, as this is supported with experimental evidence.
www.intechopen.com

Data Retrieval and Visualization for Setting Research Priorities in Biomedical Research
213
Fig. 2. Workflow of establishing the MySQL database for StarNet.
StarNet is a web-based interface for creating coexpression networks from correlated microarray expression profiles, where the networks radiate from a selected seed gene (Jupiter & VanBuren, 2008; Jupiter et al., 2009). To build this tool, we collected microarray data for several species from NCBI’s Gene Expression Omnibus (GEO), which contains thousands of array experiments. Data was normalized and scaled using the justRMALite (Robust Multichip Analysis) package within the BioConductor suite of tools on the R statistical computing platform. Based on this normalized data, Pearson correlation coefficients were computed for all pairwise comparisons of genes to populate a MySQL database (Figure 2). The current version of StarNet, StarNet 2, expands the coverage from mouse to ten different species (human, rat, mouse, chicken, zebrafish, Drosophila, C. elegans, S. cerevisiae, Arabidopsis and rice) and offers two alternate data sets (Full data cohort & Development data cohort) for some of these species (human, rat, mouse and Drosophila). For each organism represented, data was collected from between 148 (rice) and 3,763 (human) Affymetrix microarray samples (Table 1). In total, 12,762 arrays were used to build our database, which is approximately 2.7% of the samples in GEO (as of August 2010). StarNet allows cross-species comparisons by automatically doing gene lookups across known orthologs. StarNet identifies gene pairs with high magnitude correlations across a large number of experiments to offer strong statistical results that include confidence intervals. To support an interpretation of the generated coexpression networks, StarNet offers a database search of known interactions involving genes and gene products from the prescribed networks. Thus, while tools such as STRING provide a data integration strategy to retrieve likely functional protein-protein interactions, StarNet better facilitates
www.intechopen.com

Knowledge-Oriented Applications in Data Mining
214
exploratory analysis of selected data. In comparison, StarNet retrieves high-ranking correlations between gene expression profiles constructed from a large collection of microarray data to iteratively build star networks around a gene of interest, while STRING retrieves putative relationships between elements via co-occurrence of the elements across a number of already established databases. STRING makes explicit predictions from multiple data sources, whereas StarNet provides multiple types of data that support the user’s ability to make their own inferences. StarNet additionally supports the user’s judgment by allowing greater flexibility in prescribing the relative size and topology of the networks created.
Table 1. Expression microarray data represented in StarNet. The second column is the number of arrays used in the full condition, and the third is the number of arrays used in the development condition. This open-access table was reproduced from Jupiter et al., 2009.
The sets of correlation coefficients calculated as described above for the MySQL database have a relatively large memory footprint and contain a large amount of data that is of little interest from our perspective (i.e. low magnitude correlations). Thus, this collection was trimmed by selecting the 100,000 highest magnitude positive and negative correlations for each cohort. As highly correlated groups of genes in a correlation network exhibit a high amount of interconnectedness, this distribution doesn’t include all genes on an array. To guarantee complete coverage for all genes on each respective platform, we constructed another sub-distribution through gene-by-gene extraction of the ten highest magnitude positive and negative correlations for the gene. Below we used the gene Gata4, the same example used above in a STRING query, as our seed gene in a StarNet query (http://vanburenlab.medicine.tamhsc.edu/StarNet2.html). On the StarNet query page (Figure 3), the user selects a data set cohort, which is correlation data for a collection of microarrays for a particular array platform (i.e. a particular organism), with options for ten species. There are two alternate data sets, a Full data set cohort and a Development data set cohort, available for rat, mouse, human and Drosophila. The Development data set is a subset of the Full data set, where the array data used in the Development cohort was derived from selected samples representing early embryos, embryonic heart, and adult heart. The Full data cohort was dervied from a heterogeneous
www.intechopen.com
Data Retrieval and Visualization for Setting Research Priorities in Biomedical Research
215
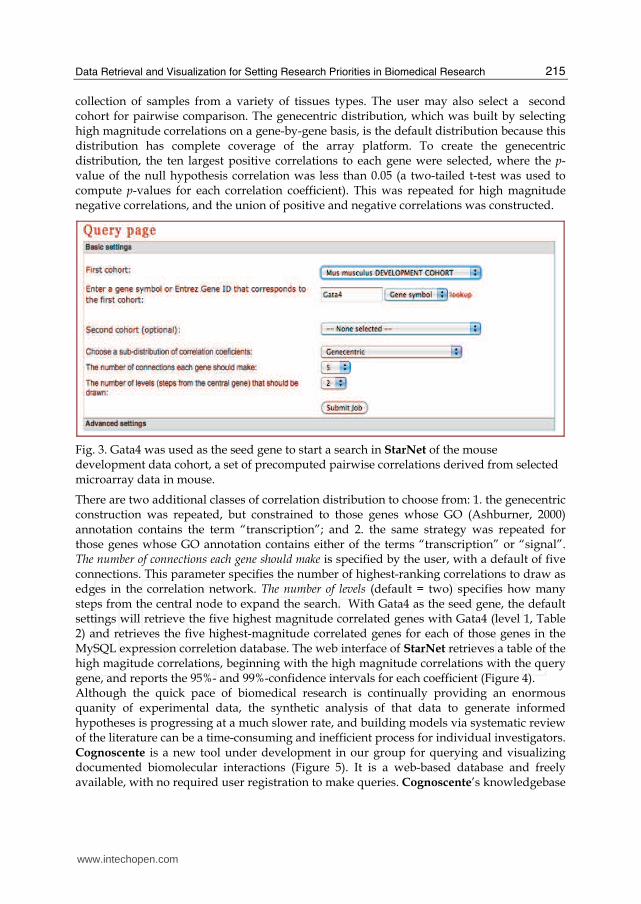
collection of samples from a variety of tissues types. The user may also select a second cohort for pairwise comparison. The genecentric distribution, which was built by selecting high magnitude correlations on a gene-by-gene basis, is the default distribution because this distribution has complete coverage of the array platform. To create the genecentric distribution, the ten largest positive correlations to each gene were selected, where the p-value of the null hypothesis correlation was less than 0.05 (a two-tailed t-test was used to compute p-values for each correlation coefficient). This was repeated for high magnitude negative correlations, and the union of positive and negative correlations was constructed.
Fig. 3. Gata4 was used as the seed gene to start a search in StarNet of the mouse development data cohort, a set of precomputed pairwise correlations derived from selected microarray data in mouse.
There are two additional classes of correlation distribution to choose from: 1. the genecentric construction was repeated, but constrained to those genes whose GO (Ashburner, 2000) annotation contains the term “transcription”; and 2. the same strategy was repeated for those genes whose GO annotation contains either of the terms “transcription” or “signal”. The number of connections each gene should make is specified by the user, with a default of five connections. This parameter specifies the number of highest-ranking correlations to draw as edges in the correlation network. The number of levels (default = two) specifies how many steps from the central node to expand the search. With Gata4 as the seed gene, the default settings will retrieve the five highest magnitude correlated genes with Gata4 (level 1, Table 2) and retrieves the five highest-magnitude correlated genes for each of those genes in the MySQL expression correletion database. The web interface of StarNet retrieves a table of the high magitude correlations, beginning with the high magnitude correlations with the query gene, and reports the 95%- and 99%-confidence intervals for each coefficient (Figure 4). Although the quick pace of biomedical research is continually providing an enormous quanity of experimental data, the synthetic analysis of that data to generate informed hypotheses is progressing at a much slower rate, and building models via systematic review of the literature can be a time-consuming and inefficient process for individual investigators. Cognoscente is a new tool under development in our group for querying and visualizing documented biomolecular interactions (Figure 5). It is a web-based database and freely available, with no required user registration to make queries. Cognoscente’s knowledgebase
www.intechopen.com

Knowledge-Oriented Applications in Data Mining
216
can be utilized as a convenient tool for collecting prior knowledge to generate new hypotheses and refine established networks using supervised learning algorithms. Moreover, it offers users the ability to directly submit new interactions so that community support can drive the completeness of the knowledgebase. For quality assurance and attribution, registration is required to make new submissions to the database.
Gene ID 1 Gene ID 2 Pearson Correlation P-Value Number Of Arrays
14463 14465 0.7902 ~0 239
12406 14463 0.7759 ~0 239
14463 241556 0.7757 ~0 239
11975 14463 0.7565 ~0 239
14463 23871 0.7544 ~0 239
14463 21412 0.7493 ~0 239
14362 14463 0.7484 ~0 239
11749 14463 0.7481 ~0 239
14463 54195 0.7447 ~0 239
Table 2. High ranking set of correlation coefficients for GeneID 11463 (Gata4). In the coefficient database, all the genes are indexed by the Entrez GeneID. The five highest-magnitude correlated genes with 11463 (Gata4) are: 14465 (Gata6), 12406 (Serpinh1), 241556 (Tspan18), 11975 (Atp6vDa1), and 23871 (Ets1). The five top-ranking correlations are outlined by the dashed box.
3. Data visualization and analysis
Appropriate visualization of biological data can be a very powerful tool for drawing new inferences from data. When used for the standard comparison of data from two samples, visualizations showing clear differences can often obviate the need for statistical analysis. Drawing graphs or networks is a powerful way to visualize a list of documented biomolecular interactions, or for associations that are imputed from similarity metrics. These types of visualizations can offer insights and understanding of complex relationships that cannot be obtained as easily by reflecting on a pairwise list of interactions or associations. In the previous section, we discussed how StarNet retrieves correlations based on a query gene of interest, and compared this functionality with how STRING retrieves predicted functional interactions. In this section, we focus on how StarNet, Cognoscente and Cytoscape may be used to powerfully visualize biological data and knowledge. We discuss how StarNet creates visualizations of the correlative network topologically, as well as other visualizations provided by StarNet that support user interpretation of the biological relevance of the correlation networks. StarNet allows user control over the general size and topology of the networks produced, and performs a test of GO term enrichment for those networks. The new HeatSeeker module in StarNet 2 draws false color maps comparing two selected networks from different species or conditions. HeatSeeker makes an unbiased comparison by combining the lists from both networks and then comparing only those genes that share orthologs on both platforms. HeatSeeker thus offers insight into the differential wiring of gene regulatory networks among different species or conditions (Jupiter & VanBuren, 2008; Jupiter et al., 2009).
www.intechopen.com

Data Retrieval and Visualization for Setting Research Priorities in Biomedical Research
217
Fig. 4. Query results for the star network of correlations seeded by Gata4.
Fig. 5. Screen capture of an excerpt of the documented interactions involving Gata4 reported by Cognoscente.
www.intechopen.com
Knowledge-Oriented Applications in Data Mining
218
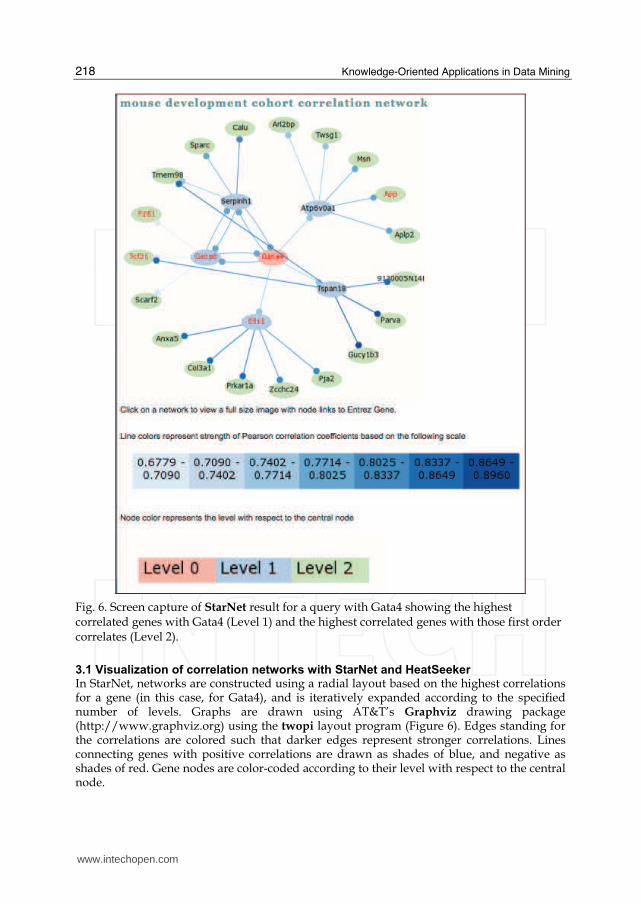
Fig. 6. Screen capture of StarNet result for a query with Gata4 showing the highest correlated genes with Gata4 (Level 1) and the highest correlated genes with those first order correlates (Level 2).
3.1 Visualization of correlation networks with StarNet and HeatSeeker In StarNet, networks are constructed using a radial layout based on the highest correlations for a gene (in this case, for Gata4), and is iteratively expanded according to the specified number of levels. Graphs are drawn using AT&T’s Graphviz drawing package (http://www.graphviz.org) using the twopi layout program (Figure 6). Edges standing for the correlations are colored such that darker edges represent stronger correlations. Lines connecting genes with positive correlations are drawn as shades of blue, and negative as shades of red. Gene nodes are color-coded according to their level with respect to the central node.
www.intechopen.com

Data Retrieval and Visualization for Setting Research Priorities in Biomedical Research
219
Fig. 7. Screen capture of StarNet Gene Ontology analysis. The first table shows genes retrieved by StarNet as part of the correlation network, where the gene is annotated with a Gene Ontology (GO) term that contains the word “transcription.“ This default behavior alerts the user to potential directionality of regulatory influences, where such genes are typically transcription factors, and thus may have some regultory influence over genes that they are highly correlated with. The second table shows part of the GO enrichment list, which provides tentative annotation for network function as a whole. For example, the GO term protein binding is one of the significantly enriched terms for the Gata4 correlation network.
During the process of defining the topology of the network, two types of supporting analyses of this network are also performed. Enrichment of GO terms, which allows tentative annotation of the biological function of this network, is evaluated using the hypergeometric test (Figure 7). Orthologous genes that are on both array platforms (data cohorts) are identified for cross-cohorts analysis, then when the user clicks the ‘HeatSeeker’ button on the StarNet result page, HeatSeeker will draw false color maps arranged with complete-linkage hierarchical clustering of correlation distance between genes in the super-network for each cohort (Figure 8).
www.intechopen.com

Knowledge-Oriented Applications in Data Mining
220
Fig. 8. Screen capture of HeatSeeker results for the cross-species analysis between mouse and human for the Development data cohort of each species. The network was seeded with Gata4 as the query gene for StarNet analysis and visualization. Heatseeker makes an unbiased comparison between correlation networks by combining the gene lists of both networks and only displaying data for genes where orthologs exist for each organism, and the gene is surveyed on both array platforms. The third column of false color maps shows the differences in correlations between the two data sets. Each of the two rows of false color maps gives an alternative clustering of the data.
3.2 Visualization of biomolecular interactions with cognoscente
Cognoscente is a querying and visualization tool for drawing biomolecular interaction networks from documented interaction knowledge, and currently holds over 300,000 unique interactions. Cognoscente supports any organism supported by NCBI’s Entrez Gene catalog. We built Cognoscente as a MySQL database with a web-based front end. An example query with Gata4 returns all first order interactions across all known orthologs (Figure 9). Cognoscente addresses several specific visualization tasks for understanding and appropriatly interpreting interaction data. One of the visualization tasks that Cognoscente addresses is the sorting of interaction knowledge by species. Nodes in networks created by Cognoscente are partitioned according to the species corresponding to an ortholog for a given gene, and these partitions are color-coded by organism. Each partition is actually a hyper-node that may represent the gene, transcript, and protein corresponding to the gene symbol. These different forms are distinguished by the type of edge drawn to the node partition, which explicitly indicates protein-protein, protein-DNA, and other types of interactions (see the EDGE KEY in Figure 9). Cognoscente supports multiple simultaneous queries (Figure 10), multiple groups of simulataneous queries (up to three, where each group has a different color-coded box around nodes), and zeroth, first, and second order networks. Figures 9 and 10 show first order networks, where all direct interactions are identified. Zeroth order interactions are just those interactions between members of a query group, which may be useful for analyzing gene lists generated by identifying differentially
www.intechopen.com

Data Retrieval and Visualization for Setting Research Priorities in Biomedical Research
221
expressed genes from a microarray experiment, or from gene clustering analysis. A second order network shows all direct interactions with query genes and all interactions with the first order interactants. Second order networks are often very large. As more biomedical knowledge is acquired from experimentation, the inclusion of prior knowledge in the process of network inference plays an increasingly crucial role. Using correlation networks from StarNet and documented interaction networks from Cognoscente, we plan to utilize known interaction networks to trim and refine predicted network influences that arise from the correlation network, and thus provide an algorithm for defining provisional developmental and regulatory pathways by inference.
3.3 General network visualization with cytoscape
Cytoscape is a powerful, general-purposed, open-source network visualization tool that offers assistance in analyzing the networks it builds (Shannon et al., 2003; Maere et al., 2005). It was initially developed in 2001 by a small group of researchers and software engineers at the Institute for Systems Biology and has since grown into a worldwide community project. The Cytoscape Core handles basic features like network layout and mapping of data attributes to visual display properties. It is also designed to allow users to create plugin modules that undertake customized network analysis. Here we show an example network of yeast proteins from the galactose pathway (http://www.Cytoscape.org) (Figure 11).
Fig. 9. Literature-based network for known biomolecular interactions, seeded by Gata4 and built with Cognoscente. The Gata4 gene, mRNA, and protein are all considered in this query, and different types of interactions are displayed with different types of edges. Interaction lookups are automatically performed across all known orthologs of Gata4, and the species corresponding to each documented is indicated by the node color.
www.intechopen.com

Knowledge-Oriented Applications in Data Mining
222
Fig. 10. Cognoscente has several useful capabilities, including support for multiple simultaneous queries. Here some well known transcription factors involved in cardiac development were queried as a group (red boxes) to examine documented interactions between these genes and gene products, as well all other first-order interactions with the query set.
Further analysis of this visualized network may be performed with a myriad of available plugins that provide numerous options for analytical functionality. As discussed regarding StarNet analysis, tests for GO term enrichment are also available in Cytoscape. One popular plugin, BiNGO (Maere et al., 2005), can be used to map functional themes of a set of elements in a network on the GO hierarchy (Figure 12). Networks built by Cytoscape may be partitioned into several sub-networks based on the clustering of the network elements using known functional or expressional data.
www.intechopen.com

Data Retrieval and Visualization for Setting Research Priorities in Biomedical Research
223
Fig. 11. A Cytoscape example. A known tabular network (an excerpt is shown on the left) was loaded into Cytoscape. Next, the topological network was generated by the software automatically (shown right). Cytoscape offers more than 20 layout algorithms, including standard layout algorithms such as hierarchical, edge-weighted, and spring-embedded methods. Here we used was the spring-embedded layout.
Cytoscape offers very diverse and flexible tools for network visualization and analysis. In comparison, StarNet has much more specific functionality. Except for a sample network of yeast galactose metabolism, Cytoscape doesn’t offer precomputed networks. Cytoscape instead relies on the user to provide a network. So, while StarNet offers a mechanism for specifying and creating networks from precomputed correlation data, Cytoscape offers an open, flexible environment for drawing and analyzing networks created outside of Cytoscape.
4. Conclusion & discussion
Computational network analysis is increasingly used to set biomedical research priorities. In particular, functional networks of genes may incorporate literally millions of experimental observations into probabilistic networks that identify genes likely to have interactive relationships in cells. Let’s look at an example to illustrate the feasibility of this strategy. The biogenesis of ribosomes is an essential cellular process conserved across all eukaryotes and is known to require >170 genes for the assembly, modification, and trafficking of ribosome components through multiple cellular compartments. Li and colleauges employed
www.intechopen.com

Knowledge-Oriented Applications in Data Mining
224
Fig. 12. The upper two panels shows the generation of the sub-network from the network of galatose pathway seeded by Gal4. In the lower two panels, the plugin BiNGO is used to assess GO term enrichment and build a hierarchical GO network. The lower right panel is an enlarged excerpt of the left panel (red box). The BiNGO network is visualized with a range of colors expressing the overrepresentation significance of the GO category represented by a node (darker nodes are more overrepresented).
network-guided genetics to set their research priorities (Li et al., 2009). They constructed computational predictor of ribosome biogenesis genes based on functional genomics and proteomics analysis, including mRNA-expression data across different conditions, protein-protein interaction datasets derived from literature, high-throughput yeast two-hybrid assays, affinity purification coupled with mass spectrometry, genetic interaction data, and in silico interaction datasets, along with analysis of comparative genomics datasets, covering 95% of yeast proteome (Figure 13). Next they calculated the naïve Bayesian probability that each yeast gene belongs to the ribosome biogenesis pathway based on gene connectivity information in the established gene networks. From the top-scoring genes, 212 candidates were manually selected based on expert knowledge for experimental validation (Table 3).
www.intechopen.com

Data Retrieval and Visualization for Setting Research Priorities in Biomedical Research
225
Fig. 13. Predicted ribosome biogenesis genes are labeled as red nodes. Green nodes are known ribosome biogenesis genes, and yellow nodes are genes that are not related to ribosome biogenesis. Edge color indicates how an association was established: co-expression (light blue), affinity purification (red), yeast two-hybrid assay (green), genetic interaction (yellow), co-citation (gray), and literature curation (black). This open-access figure was reproduced from Li et al., 2009.
After obtaining the 212 candidates by computational analysis, they employed different
experimental methods to trim this gene group by experimental validation.
Finally, they computationally predicted and experimentally validated at least 15 previously
unreported ribosome biogenesis genes (TIF4631, SUN66, YDL063C, JIL5, TOP1, SGD1,
BCP1, YOR287C, BUD22, YIL091C, YOR006C/TSR3, YOL022C/TSR4, SAC3, NEW1,
FUN12) which can be found in Table 3. Most of these genes have human orthologs and thus
represent evolutionarily conserved components of this essential process in cells.
This is an excellent example of the integration between computational network retrieval and
experimental validation to set research priorites and efficiently determine gene functions. A
current goal for our group is to leverage the tools we have built to automate the prediction
of functional networks, and to impute directionality of regulatory influences in these
networks. Correlation doesn’t imply causality, although it suggests a close relationship.
Thus, the networks built by StarNet do not indicate that a given gene in the graph has a
direct influence on any other. Moreover, edges in a StarNet network do not even imply a
direct association between a given gene pair. High ranking correlates, however, can be
judged to have a higher probability of a direct interaction than low-ranking correlates, so
ranking the correlation of expression from numerous experimental samples remains a
simple yet powerful predictive tool. Recent work has emphasized the utility of correlation as
a measurement of gene co-expression relationships. For example, Reiss and colleagues
(Reiss et al., 2006) discussed co-expression, noting that correlative relationships changed
depending on the milieu and the similar phenomenon has also been identified by other
groups. This idea provides a basis for comparing different data sets to assess differential
wiring, as we have shown above with HeatSeeker.
Our current aim is to leverage StarNet data together with prior knowledge contained in Cognoscente as the basis for inferring complete transcriptional regulatory networks using Bayesian inference or other machine learning approaches. Although a high magnitude correlation does not imply a direct regulatory relationship, we may suspect that genes with
www.intechopen.com

Knowledge-Oriented Applications in Data Mining
226
highly correlated (or highly anti-correlated) expression have a higher probability of having a regulatory relationship than genes with lower magnitude correlations, and that ranking the magnitude of correlations will uncover gene pairs with the highest likelihood of having a regulatory relationship. Assuming that for a given gene x, that high ranking correlates have a higher probability of having a direct association than low-ranking correlates, we can begin to infer a network of the most likely direct associations. For example, where x and y are any two genes with a high correlation, potential intermediates between x and y might be identified by finding genes that have a higher magnitude correlation with x and y than x and y have with each other. Thus, for the expression profile of a given gene, a high-ranking correlation coefficient with another gene in our database may be interpreted as an assertion that the association has a relatively high likelihood of being proximal, given the available data.
Table 3. Some of the 212 top-scoring candidate genes for a functional role in ribosome biogenesis. This open-access table is reproduced from Li et al., 2009.
www.intechopen.com

Data Retrieval and Visualization for Setting Research Priorities in Biomedical Research
227
StarNet’s usefulness for inference of regulatory influences is mainly limited to the domain of transcriptional regulation where the abundance of the transcript of a transcription factor is closely related to the activity of the transcription factor protein. This will be true sometimes, as indicated by a high-magnitude correlation of coexpression between a transcription factor and its target. In such cases the predictive power of StarNet should be good. As there are many other forms of regulation, StarNet will not capture all regulatory influences via co-expression correlations. For example, the activity of the transcription factor NF-kB requires the activity of IkB kinase (IKK) to phosphorylate IkB, which activates NF-kB by disassociation of IkB from NF-kB. This means that we should not expect a high-magnitude correlation between the NF-kB expression and the expression of its targets (Brasier, 2006; Gilmore, 1999; Gilmore, 2006; Perkins, 2007). Thus, incorporating proteomics data and and other types of data will be important for the inferring a complete regulatory network. One important computational approach is to discover transcription factor binding site (TFBS) by clustering genes based on their expression profiles, then search for conserved motifs in the DNA sequence upstream of these tightly clustered genes, which are then inferred to be the TFBS (Bortoluzzi et al., 2005; Pavesi et al., 2004; Roth et al., 1998). Directionality of regultory influences could be provisionally annotated using this strategy. The most important ingredient in the process of inferring transcriptional regulatory programs and setting research priorities is the judgment of experts. That judgment is greatly enhanced by the development of effective data retrieval and visualization tools. We believe that the best tools will augment the expert’s ability to make inferences and judgments, rather than attempt to replace that expert judgement. What this implies is that all predictions that are made by software should be easy to interpret, easy to trace back to the orginal data, and that the overall methodology employed in making a prediction is transparent to the expert. These principles will foster synergistic progress in biomedical research via improved communication and understanding between experimental biologists and computational biologists.
5. References
Ashburner, M., C. A. Ball, et al. (2000). "Gene ontology: tool for the unification of biology. The Gene Ontology Consortium." Nat Genet 25(1): 25-29.
Bortoluzzi, S., A. Coppe, et al. (2005). "A multistep bioinformatic approach detects putative regulatory elements in gene promoters." BMC Bioinformatics 6: 121.
Brasier, A. R. (2006). "The NF-kappaB regulatory network." Cardiovasc Toxicol 6(2): 111-130. de Jong, H. (2002). "Modeling and simulation of genetic regulatory systems: a literature
review." J Comput Biol 9(1): 67-103. Gebert, J., Radde, N., Weber, G.W. (2007). "Modeling Gene Regulatory Networks with
Piecewise Linear Differential Equations. " European Journal of Operational Research, volume 181, Issue 3, 16 September 2007.
Gilmore, T. D. (1999). "The Rel/NF-kappaB signal transduction pathway: introduction." Oncogene 18(49): 6842-6844.
Gilmore, T. D. (2006). "Introduction to NF-kappaB: players, pathways, perspectives." Oncogene 25(51): 6680-6684.
Janikow, C. Z. (1993). "A knowledge-intensive genetic algorithm for supervised learning. " Machine Learning, 13, 189-228(1993).
www.intechopen.com
Knowledge-Oriented Applications in Data Mining
228
Jensen, L. J., M. Kuhn, et al. (2009). "STRING 8--a global view on proteins and their functional interactions in 630 organisms." Nucleic Acids Res 37(Database issue): D412-416.
Jupiter, D. C. and V. VanBuren (2008). "A visual data mining tool that facilitates reconstruction of transcription regulatory networks." PLoS One 3(3): e1717.
Jupiter, D., H. Chen, et al. (2009). "STARNET 2: a web-based tool for accelerating discovery of gene regulatory networks using microarray co-expression data." BMC Bioinformatics 10: 332.
Kauffman, S. (1969). "Homeostasis and differentiation in random genetic control networks." Nature 224(5215): 177-178.
Li, Z., I. Lee, et al. (2009). "Rational extension of the ribosome biogenesis pathway using network-guided genetics." PLoS Biol 7(10): e1000213.
Maere, S., K. Heymans, et al. (2005). "BiNGO: a Cytoscape plugin to assess overrepresentation of gene ontology categories in biological networks." Bioinformatics 21(16): 3448-3449.
Pavesi, G., P. Mereghetti, et al. (2004). "Weeder Web: discovery of transcription factor binding sites in a set of sequences from co-regulated genes." Nucleic Acids Res 32(Web Server issue): W199-203.
Perkins, N. D. (2007). "Integrating cell-signalling pathways with NF-kappaB and IKK function." Nat Rev Mol Cell Biol 8(1): 49-62
Reiss, D. J., N. S. Baliga, et al. (2006). "Integrated biclustering of heterogeneous genome-wide datasets for the inference of global regulatory networks." BMC Bioinformatics 7: 280.
Roth, F. P., J. D. Hughes, et al. (1998). "Finding DNA regulatory motifs within unaligned noncoding sequences clustered by whole-genome mRNA quantitation." Nat Biotechnol 16(10): 939-945
Shannon, P., A. Markiel, et al. (2003). "Cytoscape: a software environment for integrated models of biomolecular interaction networks." Genome Res 13(11): 2498-2504.
Snel, B., G. Lehmann, et al. (2000). "STRING: a web-server to retrieve and display the repeatedly occurring neighbourhood of a gene." Nucleic Acids Res 28(18): 3442-3444.
von Mering, C., M. Huynen, et al. (2003). "STRING: a database of predicted functional associations between proteins." Nucleic Acids Res 31(1): 258-261.
von Mering, C., L. J. Jensen, et al. (2005). "STRING: known and predicted protein-protein associations, integrated and transferred across organisms." Nucleic Acids Res 33(Database issue): D433-437.
von Mering, C., L. J. Jensen, et al. (2007). "STRING 7--recent developments in the integration and prediction of protein interactions." Nucleic Acids Res 35(Database issue): D358-362.
5.1 Websites
STRING database: http://STRING-db.org/ StarNet database: http://vanburenlab.medicine.tamhsc.edu/StarNet2.html Graphviz graph drawing software: http://www.graphviz.org/ Cytoscape graph drawing and analysis platform: http://www.Cytoscape.org/
www.intechopen.com

Knowledge-Oriented Applications in Data MiningEdited by Prof. Kimito Funatsu
ISBN 978-953-307-154-1Hard cover, 442 pagesPublisher InTechPublished online 21, January, 2011Published in print edition January, 2011
InTech EuropeUniversity Campus STeP Ri Slavka Krautzeka 83/A 51000 Rijeka, Croatia Phone: +385 (51) 770 447 Fax: +385 (51) 686 166www.intechopen.com
InTech ChinaUnit 405, Office Block, Hotel Equatorial Shanghai No.65, Yan An Road (West), Shanghai, 200040, China
Phone: +86-21-62489820 Fax: +86-21-62489821
The progress of data mining technology and large public popularity establish a need for a comprehensive texton the subject. The series of books entitled by 'Data Mining' address the need by presenting in-depthdescription of novel mining algorithms and many useful applications. In addition to understanding each sectiondeeply, the two books present useful hints and strategies to solving problems in the following chapters. Thecontributing authors have highlighted many future research directions that will foster multi-disciplinarycollaborations and hence will lead to significant development in the field of data mining.
How to referenceIn order to correctly reference this scholarly work, feel free to copy and paste the following:
Hailin Chen and Vincent VanBuren (2011). Data Retrieval and Visualization for Setting Research Priorities inBiomedical Research, Knowledge-Oriented Applications in Data Mining, Prof. Kimito Funatsu (Ed.), ISBN: 978-953-307-154-1, InTech, Available from: http://www.intechopen.com/books/knowledge-oriented-applications-in-data-mining/data-retrieval-and-visualization-for-setting-research-priorities-in-biomedical-research