
180 Capital Corp Investor Presentation - Q2 2018 · • Joined 180 as Board Member in 2016 and...
32
Value Creation Through Constructive Activism Investor Presentation 1
Transcript of 180 Capital Corp Investor Presentation - Q2 2018 · • Joined 180 as Board Member in 2016 and...

Value Creation Through Constructive Activism
Investor Presentation
1

Certain Notices, Disclaimers and Safe Harbor Statement
2
This presentation (“Presentation”) contains certain forward-looking statements relating to the investment objectives, strategy, andapproach of 180 Degree Capital Corp. (“180”). Forward looking statements are intended to be made pursuant to the Safe HarborProvisions of the Private Securities Litigation Reform Act of 1995 and generally can be identified by the use of forward-looking words orphrases such as “believe,” “expect,” “anticipate,” “may,” “could,” “intend,” “intent,” “belief,” “estimate,” “project,” “plan,” “likely,” “will,”“should” or similar words or phrases. Forward-looking statements are inherently subject to risks and uncertainties and actual results andoutcomes may differ materially from the results and outcomes discussed in or anticipated by the forward-looking statements. 180 may notbe successful in executing and implementing their investment strategies and reaching their investment objectives. Prospective investorsare urged not to place undue reliance on these forward-looking statements. Any performance data set forth herein represents pastperformance. Past performance does not guarantee future results. Prospective investors should see 180’s filings with the Securities andExchange Commission (the “SEC”) for a more detailed discussion of the risks and uncertainties associated with 180’s business, includingbut not limited to the risks and uncertainties associated with investing in privately held and publicly traded companies and othersignificant factors that could affect 180’s actual results. Please also refer to 180’s public filings filings with the SEC for a complete list ofportfolio companies, financials and other relevant information about 180’s business and investments.
This Presentation is provided for informational purposes only and does not constitute an offer to sell or a solicitation of an offer to buy anysecurity. Any such offering will be made only by means of a registration statement, private placement memorandum, subscriptionagreement, or other documents as permitted by law. This Presentation does not purport to be complete and is for discussion purposesonly. Except as otherwise required by Federal securities laws, 180 Degree Capital Corp. undertakes no obligation to update or revise anyforward-looking statements included in this presentation to reflect new events or uncertainties.
All examples of investments provided are for illustrative purposes only and were selected because they demonstrate some of the analysisand tactical decisions that are involved in our decision making process. The examples were not chosen based on their performance andare not intended to suggest the performance of the 180.

Firm Overview
3
• Established 1981; IPO in 1983
• Structure: Business Development Company
• Investment Focus: Venture Capital
Prior Entity/Business• Changes Effective in March 2017
• New Structure: Registered Closed-End Fund§ Reduced operating costs and regulatory burden§ Resources focused on value creation/investments
• New Investment Focus: § Public Microcap Companies§ Deep Value§ Constructive Activism
• New Leadership:§ Kevin Rendino joined as CEO
Current Entity/Business

Presentation Overview
• Differentiated Investment Strategy
• Experienced Management Team
• Rigorous, Analytical Investment Process
• Constructive Activism
• Managed Funds and Special Purpose Vehicles4

180’s Philosophy and Core Beliefs
• The price we pay relative to the business we buy is the most important driver of investment returns.
• Markets overreact to near-term internal or environmental challenges creating attractive valuations.
• Out-of-favor companies and industries create opportunities to identify investments that offer asymmetric return-to-risk potential.
• Companies with strong franchises, managements, and balance sheets are the best positioned to turnaround, gain market share, and improve profitability in an industry recovery.
5
A portfolio of strong business franchises, purchased at the right price, outperforms over a market cycle.
We are Graham and Dodd Investors

Differentiated Investment Strategy
• We focus on investments in <$250 million market capitalization (microcap) public companies where we:
• Believe many companies are deeply undervalued and under researched• Understand the markets that these companies target • Can purchase meaningful ownership and exact some measure of control• Believe we can add value through active, hands-on constructive activism• Invest at valuations that provide significant margin of safety• Identify catalysts/changes that we believe can unlock value• Believe we can generate attractive risk-adjusted returns in 1-3 years
6

Differentiated Investment Strategy
• Opportunity for value creation in US micro-capitalization publicly traded stocks exists because management and boards often:
• Prioritize growth over cash flows• Overvalue market perception of story versus certainty• Favor status quo rather than change• Lack intimate knowledge of desires of ”buy side” investors and the workings of the public markets
in general• Mischaracterize “short-term viability” as detractor of “long-term growth” • Manage for quarterly results• Entrench themselves to protect their jobs and positions
• Few investors are willing/able to spend the time and energy identifying, conducting diligence and actively engaging with such companies.
7

Differentiated Investment Strategy
8Source: FactSet via Grant Wasylik, Uncommon Wisdom Daily.
• Minimal Analyst Coverage
2.2%
7.0%
12.0%
16.5%
22.5%
<=$300M $300M-$3B $3B-$6B $6B-$12B >$12B0
5
10
15
20
25
• Low correlations to other asset classes
Source: Furey Research Partners, March 2016 via Grant Wasylik, Uncommon Wisdom Daily.
Source: Furey Research Partners, March 2016 via Grant Wasylik, Uncommon Wisdom Daily.
Source: Ibbotson Classic Yearbook, 2015 via Grant Wasylik, Uncommon Wisdom Daily.
• High relative returns
• High frequency of takeovers
10%
20%
30%
40%
50%
60%
70%
<=$300M $300M-$3B $3B-$6B $6B-$12B >$12B0%
60.2%
30.4%
4.7% 2.4% 2.3%

Differentiated Investment Strategy
9
Traditional, Long-Only Micro-Capitalization Funds
(Passive Investing)
180 Degree Capital Corp(Constructive Activism)1
Wait passively for identified catalysts to realize value Active engagement with management of investee companies to impact timing of catalysts
Generally not able to hold board seats on portfolio companies Able to hold board seats at portfolio companies
Concentrated portfolios available, butnot often single-position focused funds
Able to offer co-investment opportunities on a single-company basis through special purpose vehicles
Not often willing to run proxy campaigns Willing to run proxy campaigns, if required
(1) Subject to applicable laws and regulations.

Experienced Management Team
• Joined 180 as Board Member in 2016 and Chief Executive Officer and Portfolio Manager in March 2017.
• 25+ year career in deep value investing at BlackRock / Merrill Lynch• Value team leader managing $13B in assets over 11 funds.
• Member of BlackRock’s leadership committee.• Frequent contributor to financial focused television and media outlets.
• Since 2012, served as Chief Executive Officer of RGJ Capital, LLC, a firm focused on deep value investing in micro-capitalization publicly traded companies.
10
Kevin M. Rendino
Daniel B. Wolfe
• Joined 180’s predecessor company in 2004; now serves as President and Portfolio Manager.
• 13+ year career managing the investments and operations of a publicly traded investment company• Sourced, executed and managed investments across multiple asset classes including private and public equities and debt.
• Actively led and participated in multiple capital formation efforts at 180 and its portfolio companies.• Responsible for day-to-day operations, finance, legal and compliance functions of the firm in addition to portfolio management.
• Current and past member of the board of multiple privately held and publicly traded portfolio companies.
• Joined 180 in October 2017 as Vice President, Head of Fund Development.
• 25+ year career in investment management and raising capital for managed funds.• Founder of Blue River Asset Management (BRAM); at peak managed $1.7B in capital.
• Responsible for raising substantial portion of the capital managed by BRAM.• Developed the proprietary trading strategies and techniques used by the fund.• Previously held senior positions at Bear Sterns and Credit Suisse.
Robert E. Bigelow III

Rigorous, Analytical Investment Process
Exit
• Sell liquid securities:
• at increased valuation following successful execution of plan;• if risk thresholds are
tripped;
• if investment thesis ceases to hold;
• If alternative investment opportunity presents better return profile.
• Collect cash flows from income-producing investments.
Plan Development
• Assemble components for strategy to improve financial performance of the target company such as:
• Identify needed changes in business with support
• Identify director/management candidates
• Identify path to obtain and maintain control
• Company visits
• Customer calls
30-40 Companies
Execution
• Establish initial position
• Attempt to work with management/board to affect change
• Form SPVs and solicit investors to co-invest with 180 to increase ownership position through open-market or privately negotiated transactions.
• Join boards of investee companies (if applicable)
• Actively monitor risks
• If required, issue private/public letters, proxy contests, etc….
10-15 Companies
Screening
>250k Companies
• Fundamental value and financial screens• 1/2 market price to
book• 2/3 market price to
earnings• 2/3 market price to
cash flows/EBITDA• Above average
dividend yield
• Initially <$250mm market cap companies
• US-Based and Exchanged Traded
~2800 Companies
Fundamental Research
300-600 Companies
• Secondary financial screens/financial health
• Low inside ownership
• Quality of management
• Evaluate franchise within industry
• Deep industry and financial modeling
• Catalyst identification and validation
• Management, board, investor conversations
100-125 Companies
11

Constructive Activism
• We are not corporate raiders. Our ultimate goal is to engage constructively with existing boards and management teams to unlock value through:• Resolution of capital structure or other overhangs that inhibit growth of shareholder value• Realignment of financial performance to achieve growth of cash flows not just revenues• Improving investor relations strategies and outreach• Evaluation of strategic options including mergers, acquisitions, sales, and divestitures• Identification of complementary talent and expertise• Introductions to value-add resources and capabilities• Alignment of interests with and support from large shareholders
• We are not adverse, however, to pursuing change through other routes including:• Private and public shareholder communications• Proxy solicitations
• All efforts will be grounded by and based on our fundamental research and diligence.
12

Our engagements often begin as Level 1 and may progress to Levels 2 and 3 as we get more involved with our portfolio companies and/or identify opportunities to unlock shareholder value.
Level 3 Engagement:
Longer-term projects where we lead financings, join boards, or otherwise become deeply involved in helping to build shareholder value.
Approach: Identify opportunities where our capital and involvement result in immediate and long-term value appreciation.
Constructive Activism (Levels 1 and 2+):
• Work directly with managements / boards to remove value overhangs and evaluate strategic options
• Take seat(s) on boards• Leverage ownership/control to drive
increases in shareholder value.
Our Levels of Constructive Activism
13
Level 1 Engagement:
Near-term potential winners that do not require substantial time/involvement
Approach: Identify quality, deeply undervalued companies with strong management teams in the process of executing a turnaround.
Constructive Activism:
• Introductions to our institutional investors and/or individual investors that own or have owned our stock.
• Leverage our general knowledge of the public markets gained over our collective 40+ years of experience for advice and value-add introductions.
Level 2 Engagement:
Near-term potential winners that may require a bit of time/involvement, but not substantial allocations of time.
Approach: Identify quality, deeply undervalued companies with strong management teams but where we believe small changes can result in increased value and management is interested in engaging constructively.
Constructive Activism (Level 1+):
• Actively suggest changes to IR strategy and/or messaging.
• Actively suggest changes in business related primarily to financial performance improvements.

Level 3 Engagement:
Current Investments:
TheStreet, Inc. (TST)
Prior Investments:
Turtle Beach Corporation (HEAR)*
Our Current and Historical Public Portfolio by Level
14
Level 1 Engagement:
Current Investments:
Mersana, Inc. (MRSN)Undisclosed Public Company #1Undisclosed Public Company #2
Prior Investments:USA Truck, Inc. (USAK)
Undisclosed Public Company #3Enumeral Biomedical Holdings (ENUM)
Level 2 Engagement:
Current Investments:
Adesto Technologies Corporation (IOTS)Synacor, Inc. (SYNC)
Prior Investments:
None
Note: The publicly traded investments listed above are those that were and are currently managed by the existing management team subsequent to the transition of the Company’s business model and investment focus in 2018 and are provided solely for the purpose of illustrating the Company’s investment approach and strategy. Please see the Company’s SEC filings for a complete list of its investments and returns on investment.
*Investment was purchased and sold during the second quarter of 2018.

$0.00
$5.00
$10.00
$15.00
$20.00
$25.00
$30.00
$35.00
6/30/
16
9/30/
16
12/3
1/16
3/31/
17
6/30/
17
9/30/
17
12/3
1/17
Level 1 Engagement Example: USA Truck, Inc. (USAK)
15
Company Profile
• USA Truck provides a broad range of truckload and logistics services to customers in a variety of industries.
• New CEO and management team joined in
Q4 2016-Q1 2017.
• Implementing turnaround plan to drive profitable
revenue growth and improve operational execution.
180 Investment and Level 1 Engagement
• Introduced in Q1 2017 through internal screen; began diligence including meeting with management team.
• Invested $1.75 million @ avg. PPS of $6.68 in open
market purchases.
• Had active dialogue with management while monitoring execution of turnaround plan.
• Sold position in Oct 2017 to fund TST investment.
Initial Investment Valuation Analysis ($ million)1
2016(Actual)
2017 (Modeled)1
2018 (Modeled)1
2019 (Modeled)2
EBITDA $30.3 $25.9 $39.8 $50.5
Growth Rate (YoY) (55%) (14.5%) 53.7% 26.8%
EBITDA/Rev. Multiple N/A 7.6x3 6.2x4 5.4x4
Stock Price @ EBITDA/Rev. Multiple5 N/A $8.663 $14.53 $17.59
Modeled Change from 180 Avg. Purchase Price N/A 31% 121% 167%
Introduced to USAK
180 Invests $1.75m @
avg. $6.68/share
Value Appreciation Catalysts: Improving Demand and PricingIncreased Operating Efficiency, Anticipation of ELD Mandate
1. Models based on analyst estimates as listed on Bloomberg while 180 had a position in the company. Actual results may be
materially different than those modeled.2. Estimated using half of 2017 to 2018 growth rate. Actual results may be materially different than those estimated.
3. Multiple and stock price as of June 30, 2017, when we first reported the position publicly.4. 2019 multiple is based on median EV/EBITDA multiple 2009-2016. 2018 multiple is average of June 30, 2017 and 2019 multiples.
5. Calculations based on cash of $0.1 million and outstanding debt of $129.3 million.
Note: Return information on USAK is provided solely in the context of the sale of
the investment for the TST transaction and example of a Level 1 Engagement.
This information is not meant for marketing or other purposes and is solely
informational. Please refer to 180’s filings with the SEC for full information on
its investments and historical performance.
180 Sells Position @ avg. $14.13/share
USA
K St
ock
Clos
ing
Pric
e

Level 2 Engagement Example: Synacor, Inc. (SYNC)
16
Company Profile• Synacor delivers modern, multiscreen experiences and multiplatform services to partners that require scale, actionable
data and sophisticated implementation.• New CEO and management team joined in August 2014.• Won AT&T portal in 2016; launched in Q2 2017; material contribution to revenues expected in 2018.
180 Investment and Initial Level 1 Engagement• Introduced in Q1 2017 by analyst; began diligence including meeting with management team.• Invested $2.25 million in registered offering in Q2 2017.
Transition to Level 2 Engagement• Transition resulted from reduced guidance in Aug. 2017 and poor communication around AT&T revenues.• Increased investment based on belief that original investment thesis remains intact and company remains undervalued.• Working with management of SYNC to improve clarity of financial projections and communication with investors to
position for 2018 and beyond.

Synacor, Inc. (NASDAQ: SYNC) Company Profile
17
• Synacor is a provider of white-label internet portal, email, authentication, advertising and video technology platforms to a diverse set of corporate and government customers globally.• Synacor’s platforms reach 120 million monthly visitors, 120 service providers, 3500 enterprises, 500 million email boxes and more
than 1000 web publishers.• Company’s original internet portal and internally developed authentication businesses complemented by acquisitions of Zimbra
(email platform) and Nimble TV (video platform) in 2015 and Technorati (advertising platform) in 2016.
• Most notable new customer was AT&T in 2016.• Synacor replaced Yahoo! as AT&T’s portal provider and invested ~$13 million in development that should be able to be leveraged for
other portal customers, particularly for mobile interfaces.• AT&T site launched and began contributing to revenues in Q2 2017.
• Strong balance sheet and improving financial performance• $15.0 million in cash; $4.5 million in debt.• Revenue growth:
• $26.5 million in Q1 2017 -> $32.9 million in Q1 2018 (+24.2%); $31.2 million in Q2 2017 -> $35.9 million in Q2 2018 (+15.1%) • $127.4 million in 2016 -> $140.0 million in 2017 (+9.9%) -> 154.2 million in 2018 (+10.1%)*.
• Adj. EBITDA (margin) improvement : $0.4 million (0.3%) in 2016 -> $2.3 million (1.6%) 2017 -> $7.9 million (5.1%) in 2018*
* As of June 30, 2018 * Source: Bloomberg average analyst estimates as updated in August 2018. Actual results may be materially different.

$1.00
$1.50
$2.00
$2.50
$3.00
$3.50
$4.00
$4.50
12/31/
14
3/31/1
5
6/30/1
5
9/30/1
5
12/31/
15
3/31/1
6
6/30/1
6
9/30/1
6
12/31/
16
3/31/1
7
6/30/1
7
9/30/1
7
12/31/
17
3/31/1
8
6/30/1
8
9/30/1
8
12/31/
18
3/31/1
9
6/30/1
9
9/30/1
9
12/31/
19
SYN
C St
ock
Clos
ing
Pric
e
180 Adds to Position @
$1.50-1.75/share
180 Introduced to SYNC
180 Invests $2.25m @ $3.50/share
180 Adds to Position @
$2.50/share
180 Adds to Position @
$2.00/share
SYNC Trading History and Key Events
18
Announcement of AT&T contract with $100
million/year estimated revenue contribution and
3-year target for $300 million in revenue and $30 million in EBITDA
AT&T Site Deployed
2017 and Ramp in AT&T Revenue Guidance
RevisedLower
SYNC admits 3/30/300 likely not attainable
SYNC guides weaker than
analyst expectations for
2018
2018/9 Catalysts: Reset Expectations
Sizable Customer Wins
Growth in Recurring Businesses
180 Raises SPV and Builds
Position
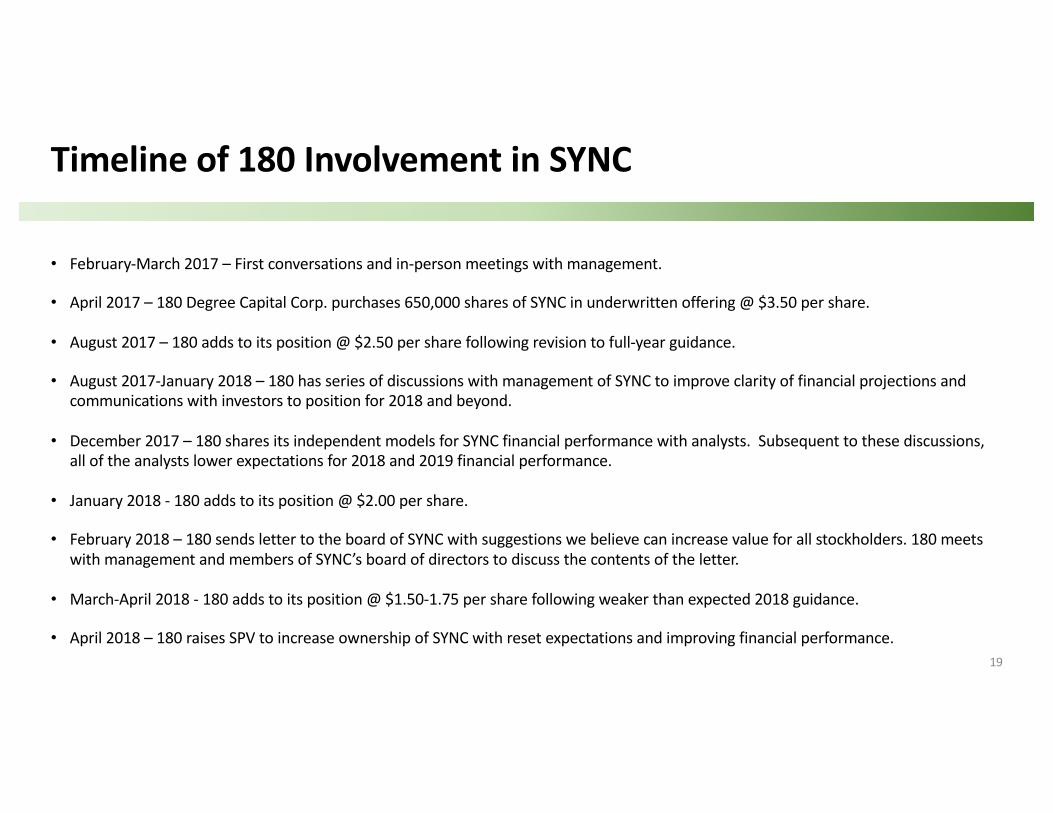
Timeline of 180 Involvement in SYNC
• February-March 2017 – First conversations and in-person meetings with management.
• April 2017 – 180 Degree Capital Corp. purchases 650,000 shares of SYNC in underwritten offering @ $3.50 per share.
• August 2017 – 180 adds to its position @ $2.50 per share following revision to full-year guidance.
• August 2017-January 2018 – 180 has series of discussions with management of SYNC to improve clarity of financial projections and communications with investors to position for 2018 and beyond.
• December 2017 – 180 shares its independent models for SYNC financial performance with analysts. Subsequent to these discussions, all of the analysts lower expectations for 2018 and 2019 financial performance.
• January 2018 - 180 adds to its position @ $2.00 per share.
• February 2018 – 180 sends letter to the board of SYNC with suggestions we believe can increase value for all stockholders. 180 meets with management and members of SYNC’s board of directors to discuss the contents of the letter.
• March-April 2018 - 180 adds to its position @ $1.50-1.75 per share following weaker than expected 2018 guidance.
• April 2018 – 180 raises SPV to increase ownership of SYNC with reset expectations and improving financial performance. 19

Modeled SYNC Stock Price at Various Multiples of Revenue
201 Ranges of multiples and price targets from analysts are included for illustrative purposes only. Actual results may be materially different than those modeled/shown. 2 Calculated based on 38.8 million shares outstanding. 3 Source: Bloomberg as of August 2, 2018
EV/SYNC Estimated 2019 Recurring Revenue Multiple1,2
0.0x 0.25x 0.50x 0.75x 1.00x 1.25x 1.50x 1.75x 2.00x
EV/S
YNC
Estim
ates
of 2
019
Non-
Recu
rrin
g Re
venu
e M
ultip
le1,
2 0.0x $0.27 $0.58 $0.89 $1.20 $1.52 $1.83 $2.14 $2.45 $2.760.1x $0.58 $0.89 $1.20 $1.51 $1.82 $2.13 $2.45 $2.76 $3.070.2x $0.88 $1.19 $1.50 $1.82 $2.13 $2.44 $2.75 $3.06 $3.370.3x $1.19 $1.50 $1.81 $2.12 $2.43 $2.74 $3.06 $3.37 $3.680.4x $1.49 $1.80 $2.12 $2.43 $2.74 $3.05 $3.36 $3.67 $3.990.5x $1.80 $2.11 $2.42 $2.73 $3.04 $3.36 $3.67 $3.98 $4.290.6x $2.10 $2.41 $2.73 $3.04 $3.35 $3.66 $3.97 $4.28 $4.600.7x $2.41 $2.72 $3.03 $3.34 $3.65 $3.97 $4.28 $4.59 $4.900.8x $2.71 $3.03 $3.34 $3.65 $3.96 $4.27 $4.58 $4.90 $5.210.9x $3.02 $3.33 $3.64 $3.95 $4.27 $4.58 $4.89 $5.20 $5.51
1.0x $3.32 $3.64 $3.95 $4.26 $4.57 $4.88 $5.19 $5.51 $5.82
• Recurring revenue businesses commonly trade at multiples to revenue > 1x revenues.1,2
• Advertising/non-recurring-based revenue businesses commonly trade at multiples > 0.5x revenues.1,2
• Consensus analyst estimates for 2019 revenue of $167 million.3 If annualized 2018 recurring revenues continue to grow at 10% in 2019, then $48.4 million of 2019 total revenues would be recurring.
• SYNC currently trades at combinations of multiples of its businesses that are materially below those of comparable businesses.
• SYNC currently has net cash of $0.27 per share.
• With execution and a return of credibility, 180 believes SYNC can trade at multiples and prices per share that more accurately reflect the value of its businesses.1
SYNC stock price as of August 2, 2018: $2.00
Firm / Analyst Price Target1,3
Canaccord Genuity / Austin Moldow $3.00
Rosenblatt Securities / Marshall Senk $4.75
Lake Street Capital Markets / Mark Argento $3.00
Ladenburg Thalmann / Glenn Mattson $5.00
Craig Hallum Capital Group / George Sutton $2.00

$0.60
$0.80
$1.00
$1.20
$1.40
$1.60
$1.80
$2.00
$2.20
12/31/1
6
3/31/17
6/30/17
9/30/17
12/31/1
7
3/31/18
6/30/18
9/30/18
12/31/1
8
Introduced to TST
180 Invests $890k @ avg. $0.89/share
Level 3 Engagement Example: TheStreet, Inc. (TST)
21
Company Profile• TheStreet is is a financial news and information
provider to consumers and businesses.• New CEO and management team joined in 2016.• Senior management and executive chairman
historically built and sold MarketWatch and completed a successful turnaround of USA Today.
180 Investment and Level 1 Engagement• Introduced in Q2 2017 by analyst; began diligence
including meeting with management team.• Invested $890,000 in open market purchases.
Transition to Level 3 Engagement• Led financing that enabled removal of preferred
stock overhang.• 180 owns 16.6% of TST and is largest shareholder.• Kevin Rendino joined TST’s Board of Directors.
2018 Catalysts: Continued
profitabilityRevenue growth
Flexibility of running business without preferred stock
overhang and with Cramer’s contract
renewed for additional four years.
180 leads $7.85mm financing @ $1.10/share
TST
Stoc
k Cl
osin
g Pr
ice

Detail of Level 3 Engagement With TST
22
Company Profile• TheStreet is a financial news and information provider to consumers and businesses through four brands.
• TheStreet.com – ~$30 million B2C business that generates revenue through subscriptions and advertising.• The Deal, RateWatch*, and BoardEx – ~$30 million B2B business that generates revenues through events and
subscriptions.
• New CEO and management team joined in 2016.• Senior management and executive chairman built and sold MarketWatch and completed a successful turnaround
of USA Today.
• Strong balance sheet and improving financial performance• $25.6 million in cash and equivalents; no debt, but prior to Nov 2017, had $55 million preferred stock overhang• 6% revenue decline 2015 to 2016 -> 2% revenue decline Q1-Q3 2016 to Q1-Q3 2017 -> +0.3% Q3 2016 to Q3 2017• $11.5 million negative EBITDA in 2016** -> $3.7 million positive EBITDA through Q3 2017• $17.5 million loss in 2016** -> $530,000 net income in Q2+Q3 2017
* RateWatch was sold in June 2018.** Includes $11.6 million in goodwill impairment.
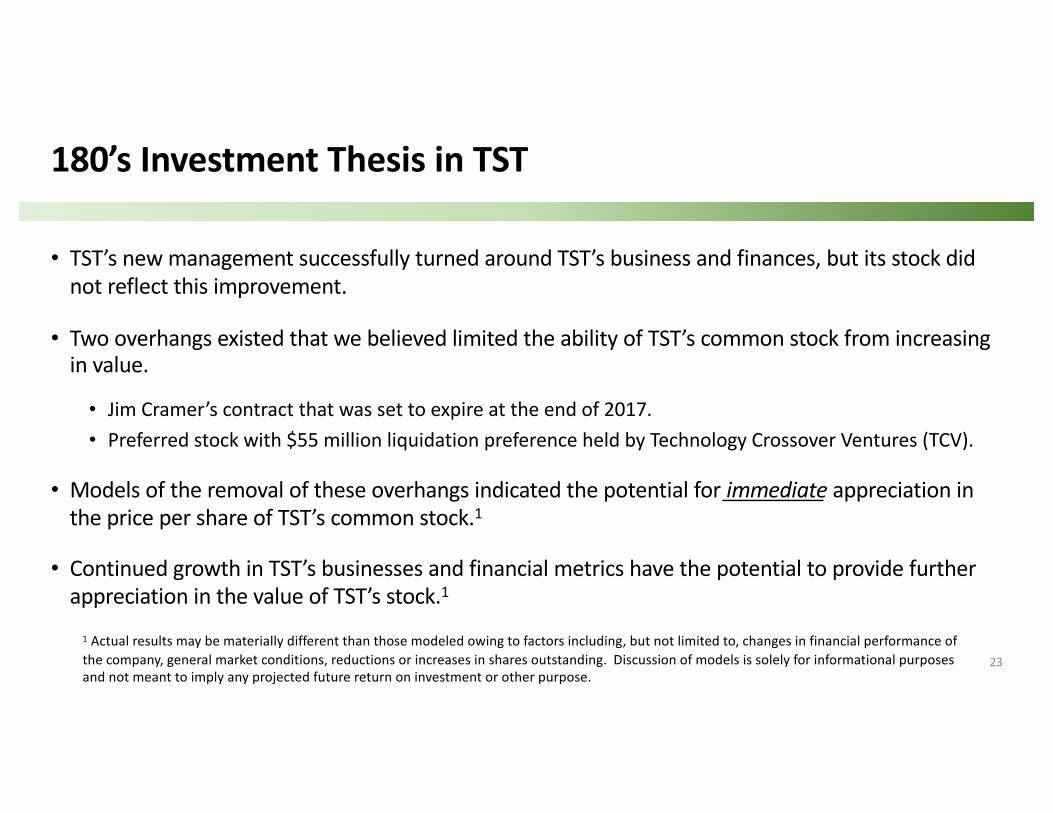
180’s Investment Thesis in TST
• TST’s new management successfully turned around TST’s business and finances, but its stock did not reflect this improvement.
• Two overhangs existed that we believed limited the ability of TST’s common stock from increasing in value.
• Jim Cramer’s contract that was set to expire at the end of 2017.• Preferred stock with $55 million liquidation preference held by Technology Crossover Ventures (TCV).
• Models of the removal of these overhangs indicated the potential for immediate appreciation in the price per share of TST’s common stock.1
• Continued growth in TST’s businesses and financial metrics have the potential to provide further appreciation in the value of TST’s stock.1
23
1 Actual results may be materially different than those modeled owing to factors including, but not limited to, changes in financial performance of the company, general market conditions, reductions or increases in shares outstanding. Discussion of models is solely for informational purposes and not meant to imply any projected future return on investment or other purpose.

Timeline of 180 Involvement in TST
• April 2017 – First conversations and in-person meetings with management.
• April-July 2017 – 180 purchases 1 million shares of TST in open market transactions.
• May-July 2017 – 180 provides TST’s management with ideas on potential paths to resolve the preferred stock overhang, including financial modeling and structure assessment.
• August 2017 – Initial term sheet and supporting information provided to TST.
• September-November 2017 – TST and its lead financial advisor, Lake Street Capital, worked exclusively with 180 to negotiate with TCV and structure the buyout of the preferred stock overhang.
• November 10, 2017 – Transaction closed and Kevin Rendino joins TST’s Board of Directors.24

TST Transaction Summary
• Total investment of $7.85 million purchased ~7.14 million unregistered shares of TST common stock at $1.10 per share.• $4 million from 180 Degree Capital Corp.• $3.85 million from TheStreet SPV Series – a series of 180 Degree Capital Management, LLC (the “TST SPV”)
• $55 million in TST preferred stock retired for $20 million in cash and 6 million unregistered shares of TST’s common stock.
• 180 received registration rights that requires TST to file a registration statement for 180 and TST SPV’s respective stock ownership within 90 days of the close of the transaction.
• 180 has the right to appoint a director to TST’s board as long as it holds all TST shares purchased.
25

Modeled Change in Value of TST StockFollowing Removal of Preferred Overhang
26
Model of price per share of TST based on fully diluted sharesfollowing $7.85 million financing transaction @ $1.10 per share1,2
B2B Recurring Revenue Multiple 0.75x 1.00x 1.25x 1.50x 1.75x 2.00x 2.25x
Mul
tiple
of B
2C
Recu
rrin
g Re
venu
e 0.75x $1.14 $1.28 $1.42 $1.57 $1.71 $1.86 $2.001.00x $1.24 $1.38 $1.52 $1.67 $1.81 $1.96 $2.101.25x $1.34 $1.48 $1.62 $1.77 $1.91 $2.06 $2.201.50x $1.44 $1.58 $1.73 $1.87 $2.01 $2.16 $2.301.75x $1.54 $1.68 $1.83 $1.97 $2.11 $2.26 $2.402.00x $1.64 $1.78 $1.93 $2.07 $2.21 $2.36 $2.502.25x $1.74 $1.88 $2.03 $2.17 $2.31 $2.46 $2.60
180’s models indicated that TST’s common stock could trade higher immediately following transaction without multiple expansion, and significantly higher with multiple expansion.2
1 Modeled price per share on an outstanding basis for highlighted cells are $1.56 and $2.20, respectively.2 Actual results may be materially different than those modeled owing to factors including, but not limited to, changes in financial performance of the company, general market conditions, reductions or increases in shares outstanding. Model is solely for informational purposes and not meant to imply any projected future return on investment or other purpose.
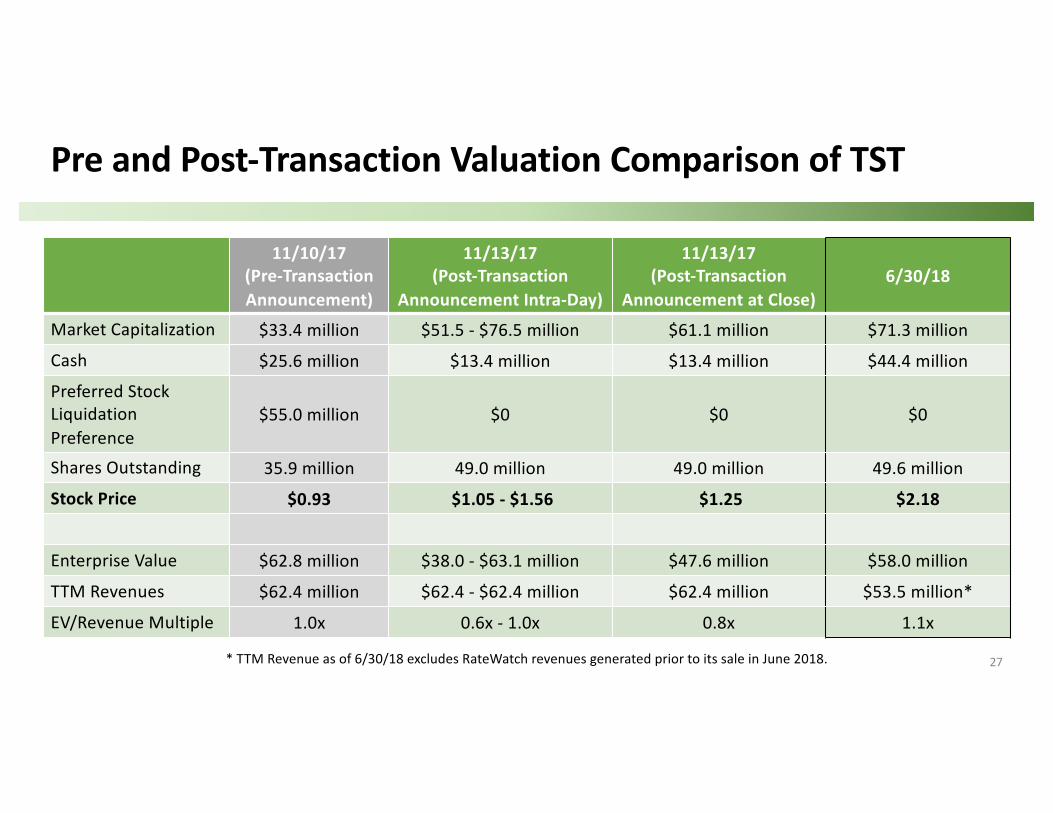
Pre and Post-Transaction Valuation Comparison of TST
27
11/10/17(Pre-Transaction Announcement)
11/13/17(Post-Transaction
Announcement Intra-Day)
11/13/17(Post-Transaction
Announcement at Close)6/30/18
Market Capitalization $33.4 million $51.5 - $76.5 million $61.1 million $71.3 millionCash $25.6 million $13.4 million $13.4 million $44.4 millionPreferred Stock Liquidation Preference
$55.0 million $0 $0 $0
Shares Outstanding 35.9 million 49.0 million 49.0 million 49.6 millionStock Price $0.93 $1.05 - $1.56 $1.25 $2.18
Enterprise Value $62.8 million $38.0 - $63.1 million $47.6 million $58.0 millionTTM Revenues $62.4 million $62.4 - $62.4 million $62.4 million $53.5 million*EV/Revenue Multiple 1.0x 0.6x - 1.0x 0.8x 1.1x
* TTM Revenue as of 6/30/18 excludes RateWatch revenues generated prior to its sale in June 2018.
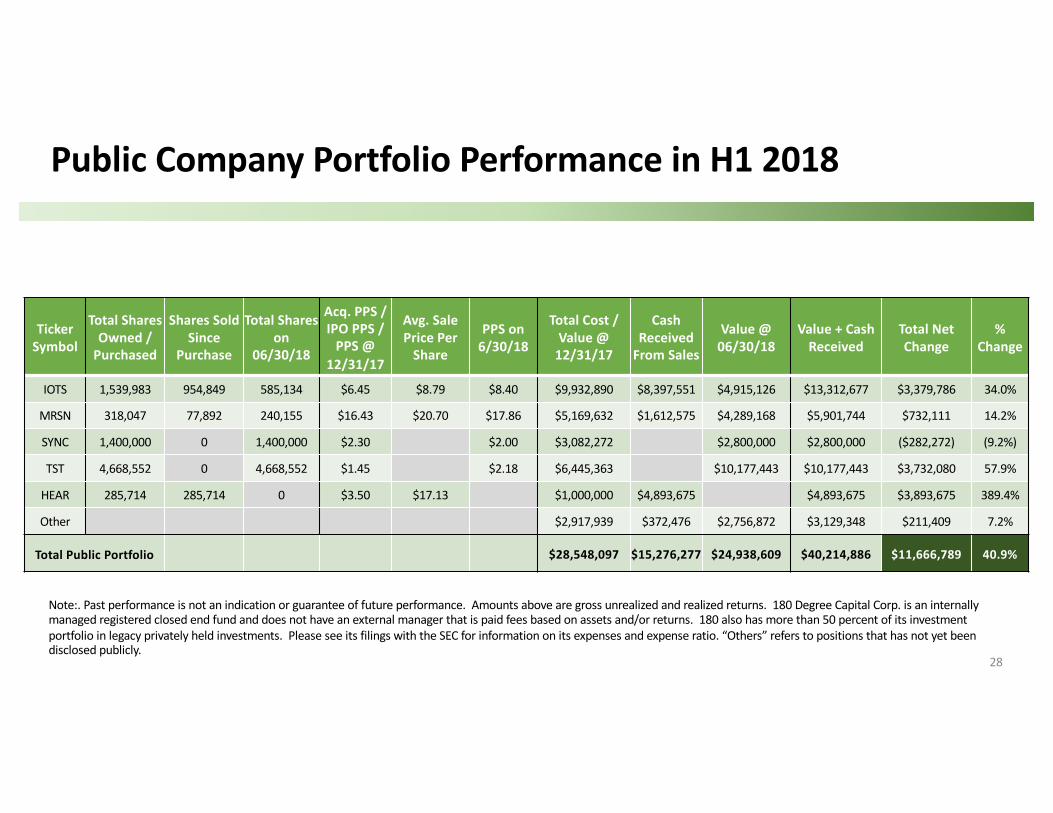
Public Company Portfolio Performance in H1 2018
28
Ticker Symbol
Total Shares Owned /
Purchased
Shares Sold Since
Purchase
Total Shares on
06/30/18
Acq. PPS / IPO PPS /
PPS @ 12/31/17
Avg. Sale Price Per
Share
PPS on 6/30/18
Total Cost / Value @
12/31/17
Cash Received
From Sales
Value @ 06/30/18
Value + Cash Received
Total Net Change
% Change
IOTS 1,539,983 954,849 585,134 $6.45 $8.79 $8.40 $9,932,890 $8,397,551 $4,915,126 $13,312,677 $3,379,786 34.0%
MRSN 318,047 77,892 240,155 $16.43 $20.70 $17.86 $5,169,632 $1,612,575 $4,289,168 $5,901,744 $732,111 14.2%
SYNC 1,400,000 0 1,400,000 $2.30 $2.00 $3,082,272 $2,800,000 $2,800,000 ($282,272) (9.2%)
TST 4,668,552 0 4,668,552 $1.45 $2.18 $6,445,363 $10,177,443 $10,177,443 $3,732,080 57.9%
HEAR 285,714 285,714 0 $3.50 $17.13 $1,000,000 $4,893,675 $4,893,675 $3,893,675 389.4%
Other $2,917,939 $372,476 $2,756,872 $3,129,348 $211,409 7.2%
Total Public Portfolio $28,548,097 $15,276,277 $24,938,609 $40,214,886 $11,666,789 40.9%
Note:. Past performance is not an indication or guarantee of future performance. Amounts above are gross unrealized and realized returns. 180 Degree Capital Corp. is an internally managed registered closed end fund and does not have an external manager that is paid fees based on assets and/or returns. 180 also has more than 50 percent of its investment portfolio in legacy privately held investments. Please see its filings with the SEC for information on its expenses and expense ratio. “Others” refers to positions that has not yet been disclosed publicly.

Public Company Portfolio Performance 2017-Q2 2018
29
Ticker Symbol
Total Shares Owned /
Purchased
Shares Sold Since
Purchase
Total Shares on 6/30/18
Acq. PPS / IPO PPS /
PPS @ 12/31/16
Avg. Sale Price Per
Share
PPS on 6/30/18
Total Cost / Value @
12/31/16
Cash Received
From Sales
Value @ 6/30/18
Value + Cash Received
Total Net Change
% Change
IOTS 1,769,868 1,184,734 585,134 $1.85 $8.55 $8.40 $3,274,256 $10,128,427 $4,915,126 $15,043,553 $11,769,297 359.4%
MRSN 318,050 77,892 240,158 $15.00 $20.70 $17.86 $4,748,465 $1,612,575 $4,289,222 $5,901,797 $1,153,332 24.3%
SYNC 1,400,000 1,400,000 $2.89 $2.00 $4,040,458 $2,800,000 $2,800,000 ($1,240,458) (30.7%)
TST 4,668,552 4,668,552 $1.06 $2.18 $4,949,734 $10,177,443 $10,177,443 $5,227,710 105.6%
ENUM 7,966,368 7,966,368 $0.13 $0.01 $1,035,628 $86,991 $86,991 ($948,637) (91.6%)
HEAR 285,714 285,714 $3.50 $17.13 $1,000,000 $4,893,675 $4,893,675 $3,893,675 389.4%
USAK 262,165 262,165 $6.68 $14.13 $1,749,985 $3,705,597 $3,705,597 $1,955,612 111.8%
Others $2,905,505 $372,476 $2,756,872 $3,129,348 $223,843 7.7%
Total Public Portfolio $23,704,031 $20,799,740 $24,938,663 $45,738,403 $22,034,372 93.0%
Note:. MRSN completed an IPO on 6/27/17. Past performance is not an indication or guarantee of future performance. Amounts above are gross unrealized and realized returns. 180 Degree Capital Corp. is an internally managed registered closed end fund and does not have an external manager that is paid fees based on assets and/or returns. 180 also has more than 50 percent of its investment portfolio in legacy privately held investments. Please see its filings with the SEC for information on its expenses and expense ratio. “Others” refers to positions that has not yet been disclosed publicly.

Managed Funds and Special Purpose Vehicles
• The opportunities afforded from our value and constructive activist investment
approach exceeds our current investable capital.
• We formed 180 Degree Capital Management, LLC (“180CM”) to facilitate
investment of managed capital alongside our permanent capital.
• Managed funds operate as separate series interests of 180CM.
• 180 Degree Capital Corp. is the managing member and investment manager of all
managed funds.
• Can be formed as special purpose vehicles (SPVs) for specific investment opportunities on
a deal-by-deal basis or as a fund that invests in multiple opportunities.
• $7.2 million raised in two SPVs through April 2018.
30

Summary
31
• Differentiated Investment Strategy• Experienced Management Team• Rigorous, Analytical Investment Process• Constructive Activism• Managed Funds and Special Purpose Vehicles
We are actively seeking opportunities to partner with others seeking similar strategies and to manage capital alongside our permanent capital.