109 Nielsen Jesper - Coastal Dynamics...
11
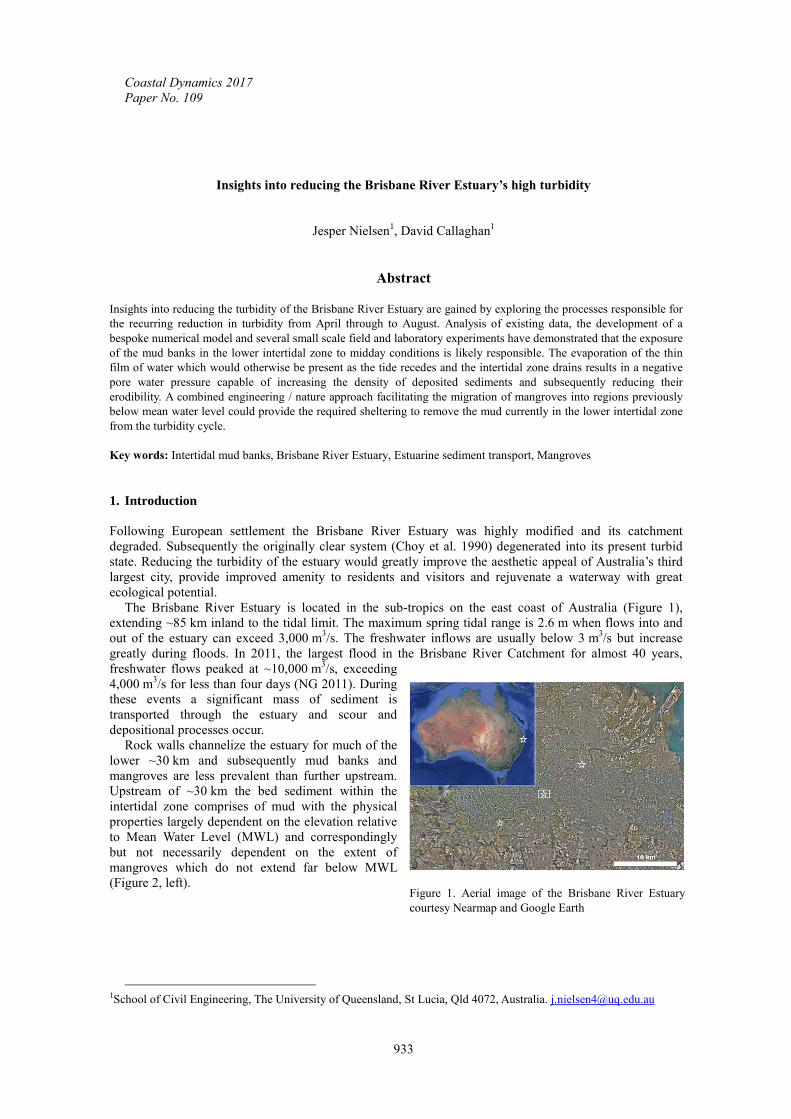
Coastal Dynamics 2017 Paper No. 109 933 Insights into reducing the Brisbane River Estuary’s high turbidity Jesper Nielsen 1 , David Callaghan 1 Abstract Insights into reducing the turbidity of the Brisbane River Estuary are gained by exploring the processes responsible for the recurring reduction in turbidity from April through to August. Analysis of existing data, the development of a bespoke numerical model and several small scale field and laboratory experiments have demonstrated that the exposure of the mud banks in the lower intertidal zone to midday conditions is likely responsible. The evaporation of the thin film of water which would otherwise be present as the tide recedes and the intertidal zone drains results in a negative pore water pressure capable of increasing the density of deposited sediments and subsequently reducing their erodibility. A combined engineering / nature approach facilitating the migration of mangroves into regions previously below mean water level could provide the required sheltering to remove the mud currently in the lower intertidal zone from the turbidity cycle. Key words: Intertidal mud banks, Brisbane River Estuary, Estuarine sediment transport, Mangroves 1. Introduction Following European settlement the Brisbane River Estuary was highly modified and its catchment degraded. Subsequently the originally clear system (Choy et al. 1990) degenerated into its present turbid state. Reducing the turbidity of the estuary would greatly improve the aesthetic appeal of Australia’s third largest city, provide improved amenity to residents and visitors and rejuvenate a waterway with great ecological potential. The Brisbane River Estuary is located in the sub-tropics on the east coast of Australia (Figure 1), extending ~85 km inland to the tidal limit. The maximum spring tidal range is 2.6 m when flows into and out of the estuary can exceed 3,000 m 3 /s. The freshwater inflows are usually below 3 m 3 /s but increase greatly during floods. In 2011, the largest flood in the Brisbane River Catchment for almost 40 years, freshwater flows peaked at ~10,000 m 3 /s, exceeding 4,000 m 3 /s for less than four days (NG 2011). During these events a significant mass of sediment is transported through the estuary and scour and depositional processes occur. Rock walls channelize the estuary for much of the lower ~30 km and subsequently mud banks and mangroves are less prevalent than further upstream. Upstream of ~30 km the bed sediment within the intertidal zone comprises of mud with the physical properties largely dependent on the elevation relative to Mean Water Level (MWL) and correspondingly but not necessarily dependent on the extent of mangroves which do not extend far below MWL (Figure 2, left). 1 School of Civil Engineering, The University of Queensland, St Lucia, Qld 4072, Australia. [email protected] Figure 1. Aerial image of the Brisbane River Estuary courtesy Nearmap and Google Earth
Transcript of 109 Nielsen Jesper - Coastal Dynamics...
Coastal Dynamics 2017 Paper No. 109
933
Insights into reducing the Brisbane River Estuary’s high turbidity
Jesper Nielsen1, David Callaghan
1
Abstract
Insights into reducing the turbidity of the Brisbane River Estuary are gained by exploring the processes responsible for
the recurring reduction in turbidity from April through to August. Analysis of existing data, the development of a
bespoke numerical model and several small scale field and laboratory experiments have demonstrated that the exposure
of the mud banks in the lower intertidal zone to midday conditions is likely responsible. The evaporation of the thin
film of water which would otherwise be present as the tide recedes and the intertidal zone drains results in a negative
pore water pressure capable of increasing the density of deposited sediments and subsequently reducing their
erodibility. A combined engineering / nature approach facilitating the migration of mangroves into regions previously
below mean water level could provide the required sheltering to remove the mud currently in the lower intertidal zone
from the turbidity cycle. Key words: Intertidal mud banks, Brisbane River Estuary, Estuarine sediment transport, Mangroves 1. Introduction Following European settlement the Brisbane River Estuary was highly modified and its catchment
degraded. Subsequently the originally clear system (Choy et al. 1990) degenerated into its present turbid
state. Reducing the turbidity of the estuary would greatly improve the aesthetic appeal of Australia’s third
largest city, provide improved amenity to residents and visitors and rejuvenate a waterway with great
ecological potential. The Brisbane River Estuary is located in the sub-tropics on the east coast of Australia (Figure 1),
extending ~85 km inland to the tidal limit. The maximum spring tidal range is 2.6 m when flows into and
out of the estuary can exceed 3,000 m3/s. The freshwater inflows are usually below 3 m3
/s but increase
greatly during floods. In 2011, the largest flood in the Brisbane River Catchment for almost 40 years,
freshwater flows peaked at ~10,000 m3/s, exceeding
4,000 m3/s for less than four days (NG 2011). During
these events a significant mass of sediment is
transported through the estuary and scour and
depositional processes occur. Rock walls channelize the estuary for much of the
lower ~30 km and subsequently mud banks and
mangroves are less prevalent than further upstream.
Upstream of ~30 km the bed sediment within the
intertidal zone comprises of mud with the physical
properties largely dependent on the elevation relative
to Mean Water Level (MWL) and correspondingly
but not necessarily dependent on the extent of
mangroves which do not extend far below MWL
(Figure 2, left).
1School of Civil Engineering, The University of Queensland, St Lucia, Qld 4072, Australia. [email protected]
Figure 1. Aerial image of the Brisbane River Estuary
courtesy Nearmap and Google Earth
Coastal Dynamics 2017 Paper No. 109
934
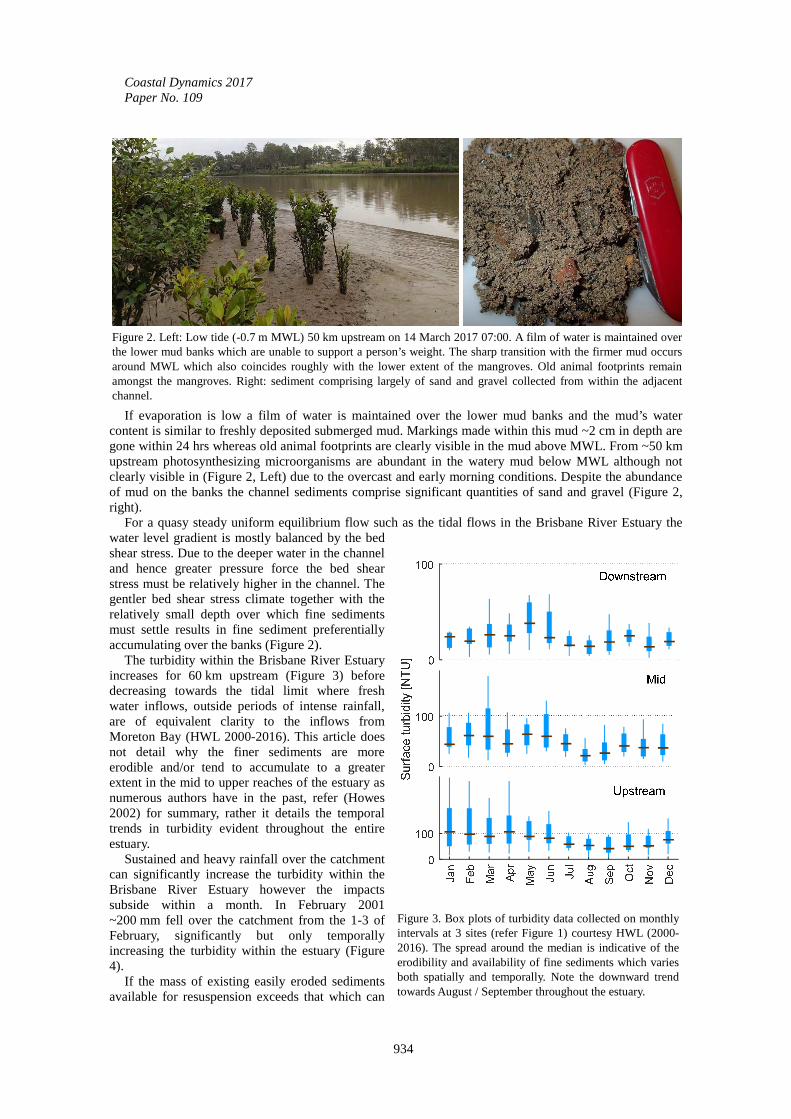
If evaporation is low a film of water is maintained over the lower mud banks and the mud’s water content is similar to freshly deposited submerged mud. Markings made within this mud ~2 cm in depth are gone within 24 hrs whereas old animal footprints are clearly visible in the mud above MWL. From ~50 km upstream photosynthesizing microorganisms are abundant in the watery mud below MWL although not clearly visible in (Figure 2, Left) due to the overcast and early morning conditions. Despite the abundance of mud on the banks the channel sediments comprise significant quantities of sand and gravel (Figure 2, right).
For a quasy steady uniform equilibrium flow such as the tidal flows in the Brisbane River Estuary the water level gradient is mostly balanced by the bed shear stress. Due to the deeper water in the channel and hence greater pressure force the bed shear stress must be relatively higher in the channel. The gentler bed shear stress climate together with the relatively small depth over which fine sediments must settle results in fine sediment preferentially accumulating over the banks (Figure 2).
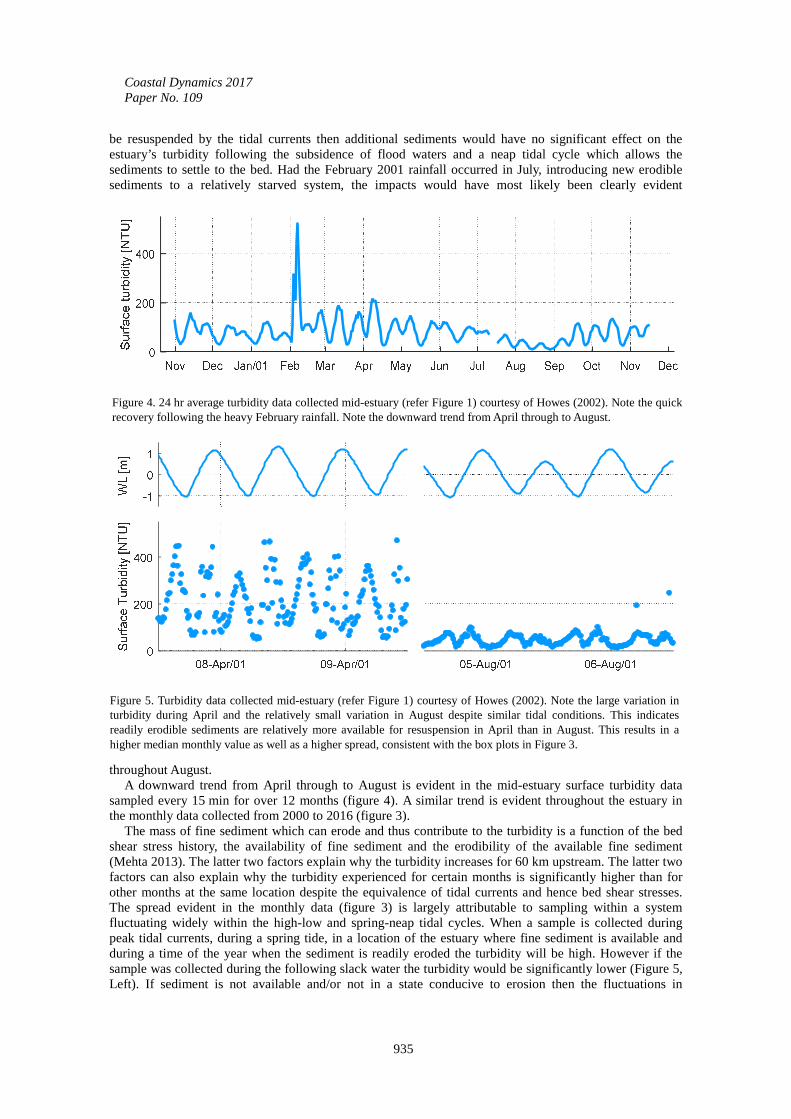
The turbidity within the Brisbane River Estuary increases for 60 km upstream (Figure 3) before decreasing towards the tidal limit where fresh water inflows, outside periods of intense rainfall, are of equivalent clarity to the inflows from Moreton Bay (HWL 2000-2016). This article does not detail why the finer sediments are more erodible and/or tend to accumulate to a greater extent in the mid to upper reaches of the estuary as numerous authors have in the past, refer (Howes 2002) for summary, rather it details the temporal trends in turbidity evident throughout the entire estuary.
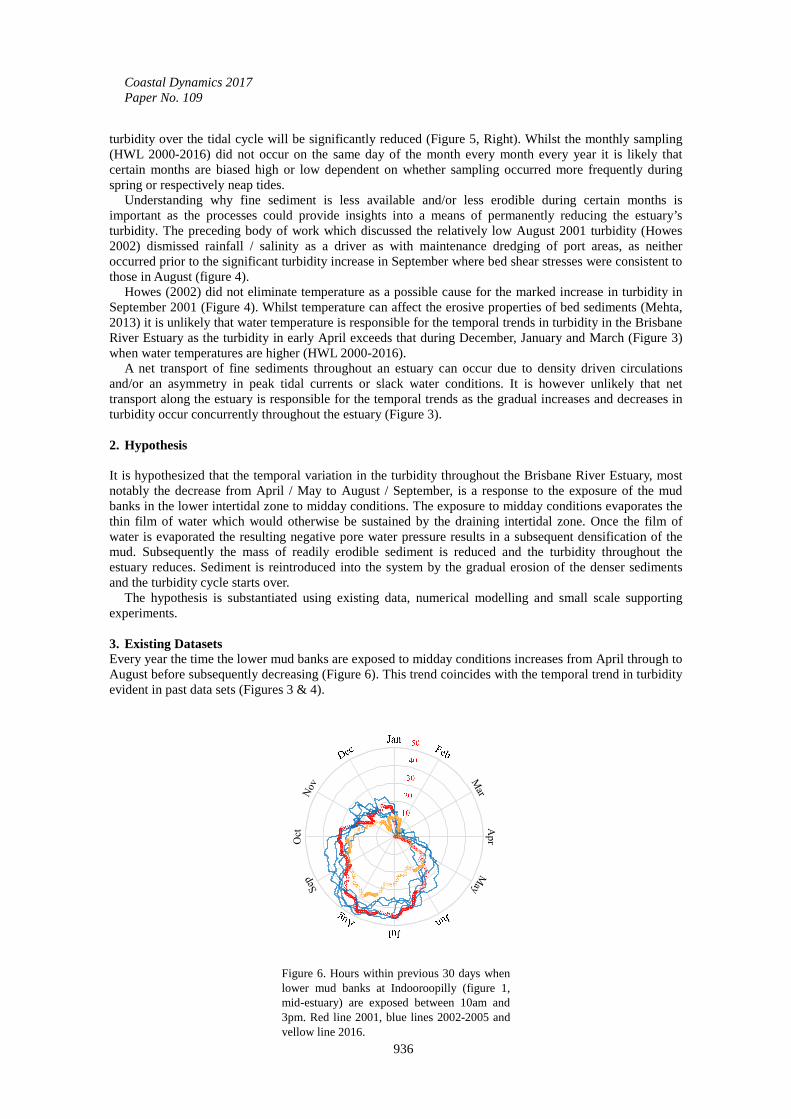
Sustained and heavy rainfall over the catchment can significantly increase the turbidity within the Brisbane River Estuary however the impacts subside within a month. In February 2001 ~200 mm fell over the catchment from the 1-3 of February, significantly but only temporally increasing the turbidity within the estuary (Figure 4).
If the mass of existing easily eroded sediments available for resuspension exceeds that which can
Figure 2. Left: Low tide (-0.7 m MWL) 50 km upstream on 14 March 2017 07:00. A film of water is maintained over the lower mud banks which are unable to support a person’s weight. The sharp transition with the firmer mud occurs around MWL which also coincides roughly with the lower extent of the mangroves. Old animal footprints remain amongst the mangroves. Right: sediment comprising largely of sand and gravel collected from within the adjacent channel.
Figure 3. Box plots of turbidity data collected on monthly intervals at 3 sites (refer Figure 1) courtesy HWL (2000-2016). The spread around the median is indicative of the erodibility and availability of fine sediments which varies both spatially and temporally. Note the downward trend towards August / September throughout the estuary.
Coastal Dynamics 2017 Paper No. 109
935
be resuspended by the tidal currents then additional sediments would have no significant effect on the estuary’s turbidity following the subsidence of flood waters and a neap tidal cycle which allows the sediments to settle to the bed. Had the February 2001 rainfall occurred in July, introducing new erodible sediments to a relatively starved system, the impacts would have most likely been clearly evident
throughout August. A downward trend from April through to August is evident in the mid-estuary surface turbidity data
sampled every 15 min for over 12 months (figure 4). A similar trend is evident throughout the estuary in the monthly data collected from 2000 to 2016 (figure 3).
The mass of fine sediment which can erode and thus contribute to the turbidity is a function of the bed shear stress history, the availability of fine sediment and the erodibility of the available fine sediment (Mehta 2013). The latter two factors explain why the turbidity increases for 60 km upstream. The latter two factors can also explain why the turbidity experienced for certain months is significantly higher than for other months at the same location despite the equivalence of tidal currents and hence bed shear stresses. The spread evident in the monthly data (figure 3) is largely attributable to sampling within a system fluctuating widely within the high-low and spring-neap tidal cycles. When a sample is collected during peak tidal currents, during a spring tide, in a location of the estuary where fine sediment is available and during a time of the year when the sediment is readily eroded the turbidity will be high. However if the sample was collected during the following slack water the turbidity would be significantly lower (Figure 5, Left). If sediment is not available and/or not in a state conducive to erosion then the fluctuations in
Figure 4. 24 hr average turbidity data collected mid-estuary (refer Figure 1) courtesy of Howes (2002). Note the quick recovery following the heavy February rainfall. Note the downward trend from April through to August.
Figure 5. Turbidity data collected mid-estuary (refer Figure 1) courtesy of Howes (2002). Note the large variation in turbidity during April and the relatively small variation in August despite similar tidal conditions. This indicatesreadily erodible sediments are relatively more available for resuspension in April than in August. This results in a higher median monthly value as well as a higher spread, consistent with the box plots in Figure 3.
Coastal Dynamics 2017 Paper No. 109
936
turbidity over the tidal cycle will be significantly reduced (Figure 5, Right). Whilst the monthly sampling (HWL 2000-2016) did not occur on the same day of the month every month every year it is likely that certain months are biased high or low dependent on whether sampling occurred more frequently during spring or respectively neap tides.
Understanding why fine sediment is less available and/or less erodible during certain months is important as the processes could provide insights into a means of permanently reducing the estuary’s turbidity. The preceding body of work which discussed the relatively low August 2001 turbidity (Howes 2002) dismissed rainfall / salinity as a driver as with maintenance dredging of port areas, as neither occurred prior to the significant turbidity increase in September where bed shear stresses were consistent to those in August (figure 4).
Howes (2002) did not eliminate temperature as a possible cause for the marked increase in turbidity in September 2001 (Figure 4). Whilst temperature can affect the erosive properties of bed sediments (Mehta, 2013) it is unlikely that water temperature is responsible for the temporal trends in turbidity in the Brisbane River Estuary as the turbidity in early April exceeds that during December, January and March (Figure 3) when water temperatures are higher (HWL 2000-2016).
A net transport of fine sediments throughout an estuary can occur due to density driven circulations and/or an asymmetry in peak tidal currents or slack water conditions. It is however unlikely that net transport along the estuary is responsible for the temporal trends as the gradual increases and decreases in turbidity occur concurrently throughout the estuary (Figure 3).
2. Hypothesis It is hypothesized that the temporal variation in the turbidity throughout the Brisbane River Estuary, most notably the decrease from April / May to August / September, is a response to the exposure of the mud banks in the lower intertidal zone to midday conditions. The exposure to midday conditions evaporates the thin film of water which would otherwise be sustained by the draining intertidal zone. Once the film of water is evaporated the resulting negative pore water pressure results in a subsequent densification of the mud. Subsequently the mass of readily erodible sediment is reduced and the turbidity throughout the estuary reduces. Sediment is reintroduced into the system by the gradual erosion of the denser sediments and the turbidity cycle starts over.
The hypothesis is substantiated using existing data, numerical modelling and small scale supporting experiments.
3. Existing Datasets Every year the time the lower mud banks are exposed to midday conditions increases from April through to August before subsequently decreasing (Figure 6). This trend coincides with the temporal trend in turbidity evident in past data sets (Figures 3 & 4).
Figure 6. Hours within previous 30 days when lower mud banks at Indooroopilly (figure 1, mid-estuary) are exposed between 10am and 3pm. Red line 2001, blue lines 2002-2005 and yellow line 2016.
Mar
Ap
rM
aySep
Oct
Nov
Coastal Dynamics 2017 Paper No. 109
937
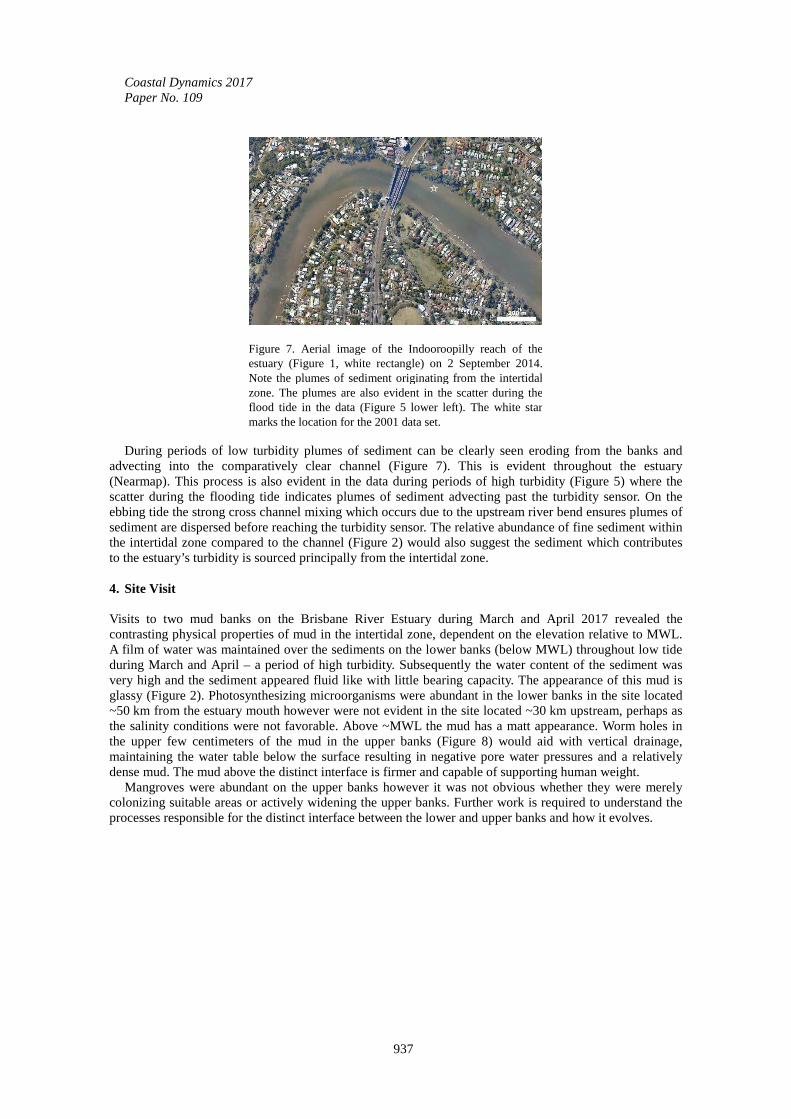
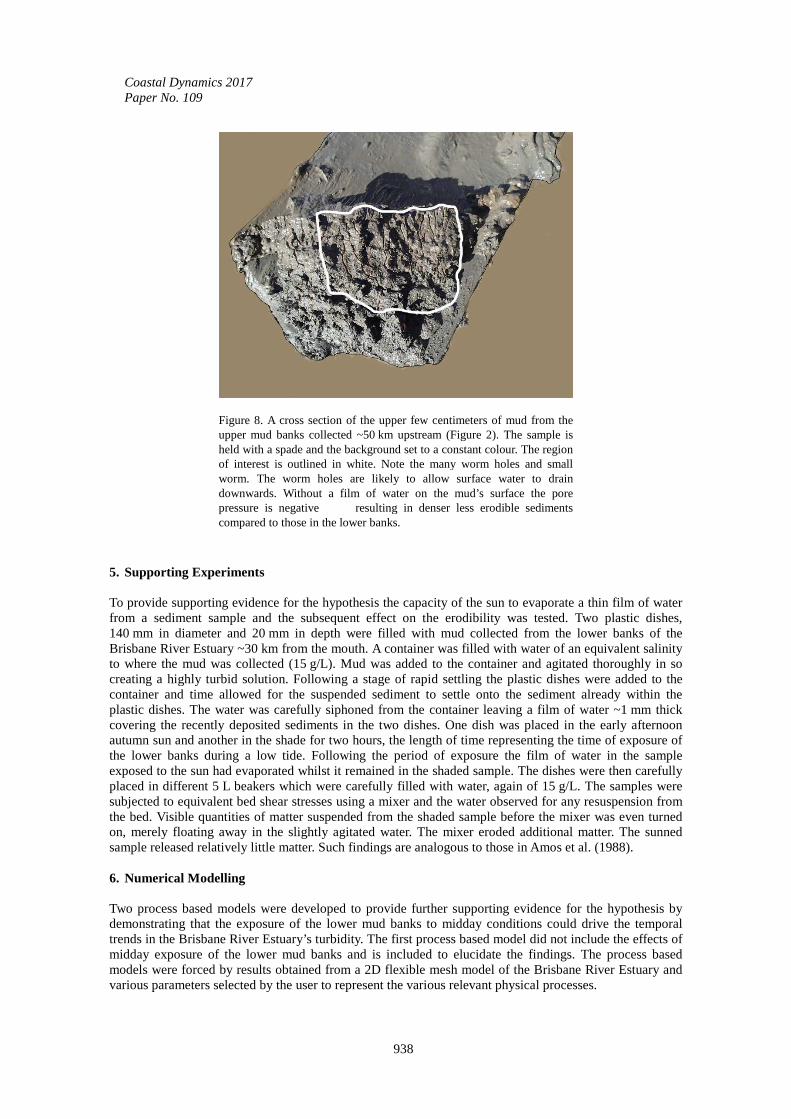
During periods of low turbidity plumes of sediment can be clearly seen eroding from the banks and advecting into the comparatively clear channel (Figure 7). This is evident throughout the estuary (Nearmap). This process is also evident in the data during periods of high turbidity (Figure 5) where the scatter during the flooding tide indicates plumes of sediment advecting past the turbidity sensor. On the ebbing tide the strong cross channel mixing which occurs due to the upstream river bend ensures plumes of sediment are dispersed before reaching the turbidity sensor. The relative abundance of fine sediment within the intertidal zone compared to the channel (Figure 2) would also suggest the sediment which contributes to the estuary’s turbidity is sourced principally from the intertidal zone. 4. Site Visit Visits to two mud banks on the Brisbane River Estuary during March and April 2017 revealed the contrasting physical properties of mud in the intertidal zone, dependent on the elevation relative to MWL. A film of water was maintained over the sediments on the lower banks (below MWL) throughout low tide during March and April – a period of high turbidity. Subsequently the water content of the sediment was very high and the sediment appeared fluid like with little bearing capacity. The appearance of this mud is glassy (Figure 2). Photosynthesizing microorganisms were abundant in the lower banks in the site located ~50 km from the estuary mouth however were not evident in the site located ~30 km upstream, perhaps as the salinity conditions were not favorable. Above ~MWL the mud has a matt appearance. Worm holes in the upper few centimeters of the mud in the upper banks (Figure 8) would aid with vertical drainage, maintaining the water table below the surface resulting in negative pore water pressures and a relatively dense mud. The mud above the distinct interface is firmer and capable of supporting human weight.
Mangroves were abundant on the upper banks however it was not obvious whether they were merely colonizing suitable areas or actively widening the upper banks. Further work is required to understand the processes responsible for the distinct interface between the lower and upper banks and how it evolves.
Figure 7. Aerial image of the Indooroopilly reach of the estuary (Figure 1, white rectangle) on 2 September 2014. Note the plumes of sediment originating from the intertidal zone. The plumes are also evident in the scatter during the flood tide in the data (Figure 5 lower left). The white star marks the location for the 2001 data set.
Coastal Dynamics 2017 Paper No. 109
938
5. Supporting Experiments To provide supporting evidence for the hypothesis the capacity of the sun to evaporate a thin film of water from a sediment sample and the subsequent effect on the erodibility was tested. Two plastic dishes, 140 mm in diameter and 20 mm in depth were filled with mud collected from the lower banks of the Brisbane River Estuary ~30 km from the mouth. A container was filled with water of an equivalent salinity to where the mud was collected (15 g/L). Mud was added to the container and agitated thoroughly in so creating a highly turbid solution. Following a stage of rapid settling the plastic dishes were added to the container and time allowed for the suspended sediment to settle onto the sediment already within the plastic dishes. The water was carefully siphoned from the container leaving a film of water ~1 mm thick covering the recently deposited sediments in the two dishes. One dish was placed in the early afternoon autumn sun and another in the shade for two hours, the length of time representing the time of exposure of the lower banks during a low tide. Following the period of exposure the film of water in the sample exposed to the sun had evaporated whilst it remained in the shaded sample. The dishes were then carefully placed in different 5 L beakers which were carefully filled with water, again of 15 g/L. The samples were subjected to equivalent bed shear stresses using a mixer and the water observed for any resuspension from the bed. Visible quantities of matter suspended from the shaded sample before the mixer was even turned on, merely floating away in the slightly agitated water. The mixer eroded additional matter. The sunned sample released relatively little matter. Such findings are analogous to those in Amos et al. (1988).
6. Numerical Modelling Two process based models were developed to provide further supporting evidence for the hypothesis by demonstrating that the exposure of the lower mud banks to midday conditions could drive the temporal trends in the Brisbane River Estuary’s turbidity. The first process based model did not include the effects of midday exposure of the lower mud banks and is included to elucidate the findings. The process based models were forced by results obtained from a 2D flexible mesh model of the Brisbane River Estuary and various parameters selected by the user to represent the various relevant physical processes.
Figure 8. A cross section of the upper few centimeters of mud from the upper mud banks collected ~50 km upstream (Figure 2). The sample is held with a spade and the background set to a constant colour. The region of interest is outlined in white. Note the many worm holes and small worm. The worm holes are likely to allow surface water to drain downwards. Without a film of water on the mud’s surface the pore pressure is negative resulting in denser less erodible sediments compared to those in the lower banks.
Coastal Dynamics 2017 Paper No. 109
939
The 2D flexible mesh model was created using the finite volume numerical software package TUFLOW-FV (Teakle 2013). The 2D model simulated the tidal flows throughout the estuary using measured water levels at the estuary’s mouth. The hydrodynamic inputs (water level and bed shear stress) required by the two process based models were extracted from a point within the 2D model’s domain at a location adjacent to where the 2001 data was collected (figure 7).
The two process based models simulate the suspended sediment concentration representative of that over a cross section moving with the tidal flow. By assuming that suspended sediment travels with the horizontal velocity of the tidal flow the advection terms can be omitted. Model results are however compared directly to data collected from a location fixed in space. For an analysis using a moving reference frame to be equivalent to a reference frame fixed in space the conditions within the extents to which the reference frame moves must be uniform. Thus in the following analysis it is assumed that the instantaneous conditions representative of those over a cross section, such as the sediment flux from the bed or the suspended sediment concentration, are everywhere equal along the estuary for a distance of half the tidal excursion downstream of the data site and an equivalent distance upstream. Since the length of the tidal wave is much greater than the tidal excursion during spring tides (~250 km to ~8 km) hydrodynamic conditions over the tidal excursion are almost in phase, for instance the bed shear stress 4 km downstream of the site peaks less than 10 min prior to that 4 km upstream of the site. This shift can be considered insignificant when compared to the ~6 hrs between consecutive peaks in flood and ebb bed shear stresses. The estuary bends and is of variable width and depth over the ~8 km encompassing the data site however the banks are consistent with interspersed mangroves and waterfront properties (Figures 1 & 7).
The time varying bed shear stress used in the process based models has been extracted from the 2D model at the centre of the channel (~14 m depth) adjacent to the data site (Figure 7). It is not assumed that the bed shear stress is uniform across the estuary rather that the distribution of bed shear across the estuary is consistent within the limits of the tidal excursion encompassing the site. A multiplier is included with the bed shear terms in the models to achieve a sediment flux from the bed and a subsequent suspended sediment concentration representative of the cross section.
Within the two process based models the flux of sediment to and from the water column and the suspended sediment concentration is representative of the estuary’s cross section at the data site. In reality the flux of sediment is not uniform across the estuary with the settling and resuspension of fine sediments occurring predominantly over the banks (Figure 7).
Turbulent mixing and settling of suspended sediment throughout the water column is not explicitly handled by these models with the sediment concentration considered equal over the cross section. Thus an effective settling velocity is used when simulating the downward flux of sediment to the bed.
The data set for which the process based models are compared is turbidity, a measure of the extent to which light is scattered by suspended particles. The models simulate the settling and resuspension of sediment over a cross section and thus would otherwise represent the concentration of suspended sediment. The principal author has repeatedly found the relationship between turbidity and suspended sediment concentration to be linear in salt water in the range relevant in this study and thus these data and model results are compatible through the inclusion of the multipliers used for the resuspension and settling terms.
It is assumed that the bed sediments are entrained into the water column only once the bed shear stress exceeds a critical value - the critical bed shear stress for erosion. Once exceeded the flux of sediment into the water column increases linearly with increasing bed shear as
{ } 1t
t t cece
ce
C C tV
τ τατ ττ
− −≥ = + ∆ (1)
consistent with the data collected in (Partheniades 1962) and with the Ariathurai-Partheniades equation (Ariathurai 1974) as presented in Mehta (2013). The α term [kg/s] is a site specific multiplier representing the flux of sediment into the water column over 1 m length of estuary. The volume V [m3] of the section of estuary is assumed constant.
Experiments have demonstrated that cohesive sediments do not settle to the bed until the bed shear stress is below a threshold value - the critical bed shear stress for deposition. It then settles most efficiently when the bed shear stress is nil (Mehta 2013) giving
Coastal Dynamics 2017 Paper No. 109
940
{ }1
1 '1 t
t tt t s
cdcd
w CC C
W
ττ ττ
−−
< = − − ∆
(2)
Where the w’s term [m/s] is a site specific multiplier representing the settling of sediment to the bed from the water column. The width W [m] of the section of estuary is assumed constant.
The 24 hr average of the results from model 1 which is based on (1) and (2) are presented in the lower plot of figure 9 as the dashed brown line. It is evident that whilst there is a good match with these data during late March to early April the model over predicts the turbidity during other months except immediately following the rainfall event in February.
In addressing the limitations of the first process based model a second was developed. The physical processes on which the second model was based were as follows:
1) During months of high turbidity the mud in the lower banks is fluid like and readily eroded with an
overlying thin film of water. 2) Experiments demonstrated that two hours of midday sun was capable of evaporating the film of
water over freshly deposited mud resulting in a densification and subsequent resistance to erosion. 3) The times of year when the lower banks are exposed around midday is consistent between years and
correlates with the temporal trends in turbidity.
Thus the simulated suspended sediment signal was not only a function of the bed shear stress history but also the history of the eroding bed. Past works on the subject of the hydraulics of fine sediment transport have found this to be the case (Mehta 2013). The effects of solar exposure on the shear strength of intertidal mud banks has also been documented (Amos et al. 1988) although not, to the authors knowledge, correlated with turbidity.
Within the second model the mass of sediment readily available for resuspension is maximum during periods of highest turbidity and lowest during periods of lowest turbidity. The mass of sediment is reduced when the lower banks are exposed to midday conditions as
{ } 1& t tch h t midday m m m−< ≈ = − ∆ (3)
where hc is a water level below MWL. This represents the drying of the lower mud banks and the subsequent reduction in sediment available for resuspension. Sediment is reintroduced into the model when the mass of readily erodible sediments is exhausted and the bed shear stresses are capable of eroding the underlying consolidated sediments. Thus the erosion rate for the reintroduction of sediment is
{ }1 1& 0t
t t t cece
ce
fm C C t
V
τ τατ ττ
− − −≥ < = + ∆ (4)
where f is less than 1. This sediment is reintroduced to the bed when conditions are conducive to settling, similarly but of opposite sign to (2).
The results of the modelling are presented in Figures 9 and 10. As freshwater inflows are not included in the models nor the influx of associated sediment, the peak in
turbidity in early February is not replicated. Both models replicate the turbidity in late March to early April demonstrating how the impact from the rainfall event is insignificant within two months. This is because only a finite mass of sediment can be eroded between slack water conditions, even if the mass of sediment in the bed is infinite. Thus in a system already saturated with sediment, such as the Brisbane River Estuary in March and April, additional sediment in the bed do not result in additional sediment in the water column. Thus once the sediment associated with the rainfall event has settled out of the water column the turbidity cycle resumes to that had the rainfall event never occurred. As the densification of the lower mud banks occurs at the surface, introducing additional sediment before the lower banks begin to be exposed during midday has no effect on the turbidity throughout the remainder of the year. Had the rainfall event occurred in July however, introducing sediment to a system with mostly hardened sediments the impact would have been significant.
The two models are equivalent during April when the mass of readily erodible sediment is assumed at a
Coastal Dynamics 2017 Paper No. 109
941
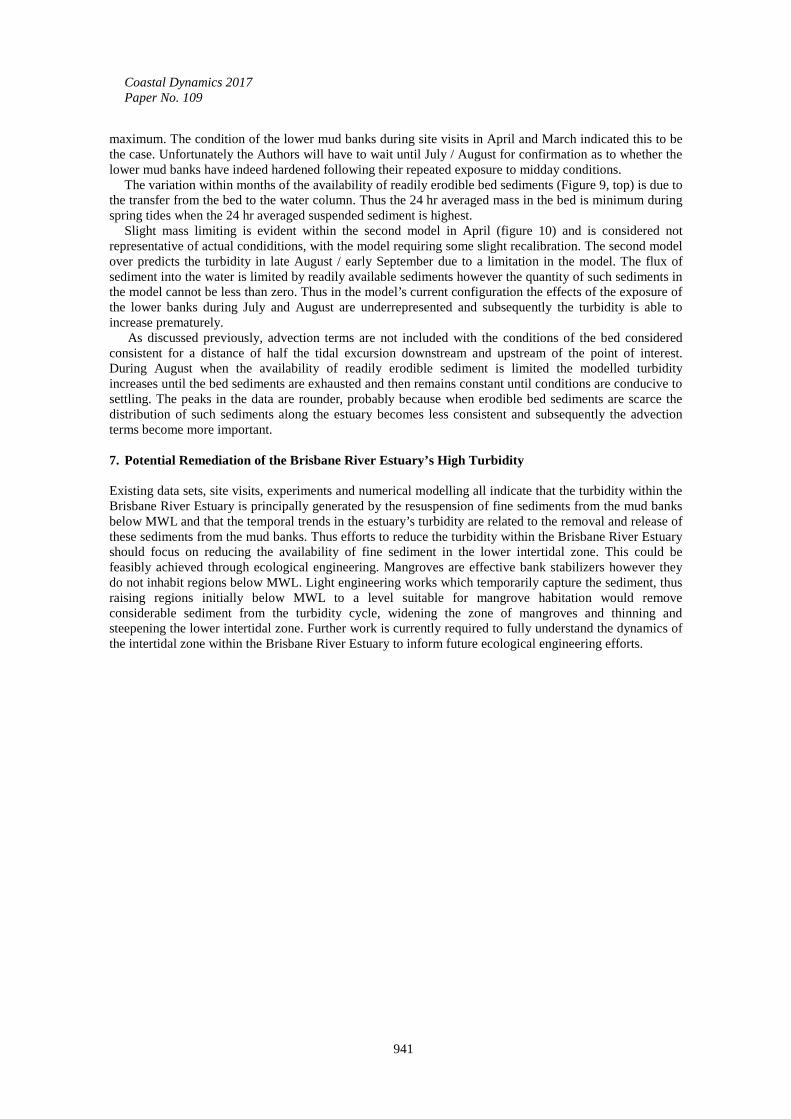
maximum. The condition of the lower mud banks during site visits in April and March indicated this to be the case. Unfortunately the Authors will have to wait until July / August for confirmation as to whether the lower mud banks have indeed hardened following their repeated exposure to midday conditions.
The variation within months of the availability of readily erodible bed sediments (Figure 9, top) is due to the transfer from the bed to the water column. Thus the 24 hr averaged mass in the bed is minimum during spring tides when the 24 hr averaged suspended sediment is highest.
Slight mass limiting is evident within the second model in April (figure 10) and is considered not representative of actual condiditions, with the model requiring some slight recalibration. The second model over predicts the turbidity in late August / early September due to a limitation in the model. The flux of sediment into the water is limited by readily available sediments however the quantity of such sediments in the model cannot be less than zero. Thus in the model’s current configuration the effects of the exposure of the lower banks during July and August are underrepresented and subsequently the turbidity is able to increase prematurely.
As discussed previously, advection terms are not included with the conditions of the bed considered consistent for a distance of half the tidal excursion downstream and upstream of the point of interest. During August when the availability of readily erodible sediment is limited the modelled turbidity increases until the bed sediments are exhausted and then remains constant until conditions are conducive to settling. The peaks in the data are rounder, probably because when erodible bed sediments are scarce the distribution of such sediments along the estuary becomes less consistent and subsequently the advection terms become more important.
7. Potential Remediation of the Brisbane River Estuary’s High Turbidity
Existing data sets, site visits, experiments and numerical modelling all indicate that the turbidity within the Brisbane River Estuary is principally generated by the resuspension of fine sediments from the mud banks below MWL and that the temporal trends in the estuary’s turbidity are related to the removal and release of these sediments from the mud banks. Thus efforts to reduce the turbidity within the Brisbane River Estuary should focus on reducing the availability of fine sediment in the lower intertidal zone. This could be feasibly achieved through ecological engineering. Mangroves are effective bank stabilizers however they do not inhabit regions below MWL. Light engineering works which temporarily capture the sediment, thus raising regions initially below MWL to a level suitable for mangrove habitation would remove considerable sediment from the turbidity cycle, widening the zone of mangroves and thinning and steepening the lower intertidal zone. Further work is currently required to fully understand the dynamics of the intertidal zone within the Brisbane River Estuary to inform future ecological engineering efforts.
Coastal Dynamics 2017 Paper No. 109
942
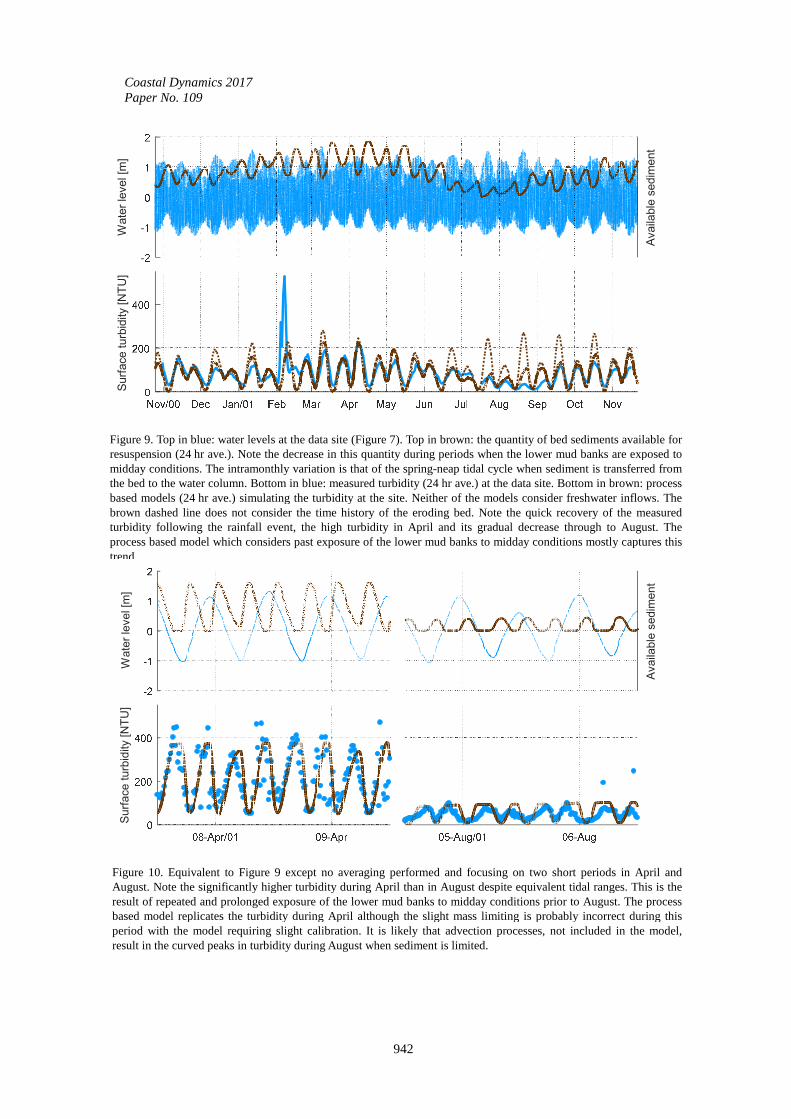
Figure 9. Top in blue: water levels at the data site (Figure 7). Top in brown: the quantity of bed sediments available for resuspension (24 hr ave.). Note the decrease in this quantity during periods when the lower mud banks are exposed to midday conditions. The intramonthly variation is that of the spring-neap tidal cycle when sediment is transferred from the bed to the water column. Bottom in blue: measured turbidity (24 hr ave.) at the data site. Bottom in brown: process based models (24 hr ave.) simulating the turbidity at the site. Neither of the models consider freshwater inflows. The brown dashed line does not consider the time history of the eroding bed. Note the quick recovery of the measured turbidity following the rainfall event, the high turbidity in April and its gradual decrease through to August. The process based model which considers past exposure of the lower mud banks to midday conditions mostly captures this trend.
Wate
r le
vel [m
]S
urf
ace turb
idity [N
TU
]
Availa
ble
sedim
ent
Figure 10. Equivalent to Figure 9 except no averaging performed and focusing on two short periods in April and August. Note the significantly higher turbidity during April than in August despite equivalent tidal ranges. This is the result of repeated and prolonged exposure of the lower mud banks to midday conditions prior to August. The process based model replicates the turbidity during April although the slight mass limiting is probably incorrect during this period with the model requiring slight calibration. It is likely that advection processes, not included in the model, result in the curved peaks in turbidity during August when sediment is limited.
Wate
r le
vel [m
]S
urf
ace turb
idity [N
TU
]
Availa
ble
sedim
ent
Coastal Dynamics 2017 Paper No. 109
943
8. Summary Field data, experiments and numerical modelling suggests that the high turbidity within the Brisbane River Estuary is principally a result of the easily eroded fine sediments on the mud banks below MWL. Temporal variations in the turbidity experienced every year are most likely the result of the exposure of the lower banks to midday conditions evaporating the film of water which would otherwise exist as the intertidal zone drains. Once the film of water is evaporated the pore water pressure becomes negative, resulting in a densification of the sediment and a subsequent reduction in the erodibility and a subsequent reduction of the turbidity in the estuary. Once exposure to midday conditions becomes less frequent the armoured sediment is progressively eroded and the sediment reintroduced to the system.
As it is now understood that the apparently seasonal variation in the turbidity within the Brisbane River Estuary is a result of sediment being stored and released from the mud banks an engineering / nature solution which stores the sediment permanently in the banks would result in significant improvements to the estuary’s clarity.
9. Acknowledgments
The work presented herewith, that which has come before and that which will follow during the PhD would not be possible without the kindly sponsorship afforded to Jesper by his previous employer BMT WBM.
The high performance computing was supported by Queensland Cyber Infrastructure Foundation and The University of Queensland
10. References
Amos, Carl L., Nancy A. Van Wagoner, and Graham R. Daborn. 1988. 'The influence of subaerial
exposure on the bulk properties of fine-grained intertidal sediment from Minas Basin, Bay of Fundy', Estuarine, Coastal and Shelf Science, 27: 1-13.
Ariathurai, Chita Ranjan. 1974. 'A finite element model for sediment transport in estuaries', University of California, Davis.
Choy, Darryl Low, Errol Stock, Peter Davie, and Society Australian Littoral. 1990. The Brisbane river: a source-book for the future (Australian Littoral Society in association with the Queensland Museum: Moorooka, Qld).
Howes, Tony. 2002. "Riverine Turbidity Processes." In Stage 3 South East Queensland Regional Water Quality Management Strategy Brisbane: Coastal Research Council.
HWL. 2000-2016. "Ecosystem Health Monitoring Program." In, edited by Healthy Waterways Ltd. Brisbane: Healthy Waterways Ltd
Mehta, AJ. 2013. "An Introduction to Hydraulics of Fine Sediment Transport, Advanced Series on Ocean Eng. Vol. 38." In.: World Scientific, 1060p.
NG, Eunice Min Yuan. 2011. 'Simple Rules Could Have Saved Brisbane in 2011', 4th Year, The University of Queensland.
Partheniades, Emmanuel. 1962. A study of erosion and deposition of cohesive soils in salt water (University of California, Berkeley).
Teakle, Ian. 2013. "TUFLOW FV Science Manual." In. Brisbane: BMT WBM.