1 Version 1, 2/21/02, DRAFT Medtronic InSync ® ICD Cardiac Resynchronization System FDA Advisory...
95
1 Version 1, 2/21/02, DRAFT Medtronic InSync ® ICD Cardiac Resynchronization System FDA Advisory Panel March 5, 2002
-
Upload
aldous-hodges -
Category
Documents
-
view
215 -
download
0
Transcript of 1 Version 1, 2/21/02, DRAFT Medtronic InSync ® ICD Cardiac Resynchronization System FDA Advisory...

1Version 1, 2/21/02, DRAFT
Medtronic InSync® ICDCardiac Resynchronization System
FDA Advisory PanelMarch 5, 2002

2Version 1, 2/21/02, DRAFT
Agenda
Background and Introduction Dr. William Abraham 10 minutes
Study Design and Methodology Dr. James Young 10 minutes
Safety and Lead Effectiveness Results
Dr. Angel Leon 20 minutes
Efficacy Results Dr. James Young 15 minutes
Comparison to InSync and Conclusions
Dr. William Abraham 10 minutes

3Version 1, 2/21/02, DRAFT
Introduction and Background
William T. Abraham, MD

4Version 1, 2/21/02, DRAFT
Introduction
• Over a third of moderate to severe heart failure patients (in NYHA Functional Class III or IV) have ventricular dysynchrony, evidenced by a QRS duration 130 ms1
• Associated with• Limited exercise tolerance• Impaired quality of life and functional capacity• Poor left ventricular systolic function2
1 Aaronson KD, et al. Circulation 1997; 95:2660-2667.2 Zardini M, et al. Eur Heart J 2000; 2(Suppl J): J16-J22

5Version 1, 2/21/02, DRAFT
InSync Study Design
BaselineImplantAttempt
SuccessfulImplant
Control CRT
Pre-dischargeRandomization
1, 3, 6 Month
Follow-up
1, 3, 6 Month
Follow-up
CRT
DoubleBlinded
StableMedicalTherapy
1week
CRT
Long term follow up every 6 months
• Control: VDI mode
• Treatment (CRT): VDD mode
6Version 1, 2/21/02, DRAFT
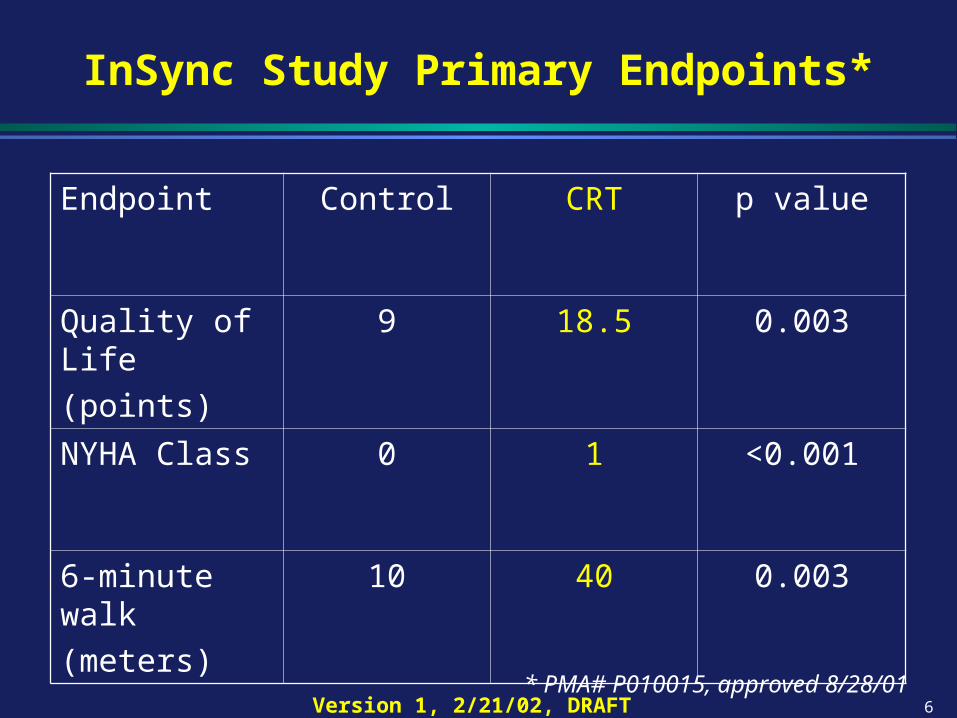
InSync Study Primary Endpoints*
Endpoint Control CRT p value
Quality of Life
(points)
9 18.5 0.003
NYHA Class 0 1 <0.001
6-minute walk
(meters)
10 40 0.003
* PMA# P010015, approved 8/28/01

7Version 1, 2/21/02, DRAFT
InSync Study Secondary Clinical Endpoints
<0.00166,20,1442,35,23Composite Response (%)
<0.0018512Exercise Time
(sec)
0.0381.00.1Peak VO2
(ml/kg/min)
P valueCRTControlEndpoint

8Version 1, 2/21/02, DRAFT
InSync Primary Safety Results Summary
Achieved all primary 6-month safety objectives including: Implant success
6-month device related complications attributed to:InSync Model 8040Attain Models 2187 and Model 2188 LV leadsInSync system
Attain Models 2187 and 2188 LV lead 6-month pacing threshold

9Version 1, 2/21/02, DRAFT
InSyncDeath or Worsening Heart Failure Requiring
Hospitalization or IV Medications
50%
60%
70%
80%
90%
100%
0 1 2 3 4 5 6Months Since Implant
Fre
edo
m f
rom
Eve
nt
Rat
e
Hazard Ratio = 0.5895% CI (0.37,0.92)
73157162184211219230— CRT
62150157178197209231— Control
Patients At Risk
P = 0.02
CRT
Control

10Version 1, 2/21/02, DRAFT
Model 7272 InSync ICD• Dual-chamber VT and VF detection• Antitachycardia (ATP) pacing,
cardioversion and defibrillation VT and VF therapies
• Simultaneous biventricular pacing• RV sensing only
Combining Resynchronization and ICD Function in a Single Device

11Version 1, 2/21/02, DRAFT
Study Design, Methodology andPatient Population
James B. Young, MD

12Version 1, 2/21/02, DRAFT
Entry Criteria
• Chronic heart failure
18 years of age
• NYHA Functional Class II, III or IV
• QRS duration 130 ms
• LVEF 35%
• LVEDD 55 millimeters (echo measure)
• Stable HF medical regimen for 1 month• ACE-I or substitute, if tolerated• β-blocker - stable regimen for 3 months
• Indication for an ICD
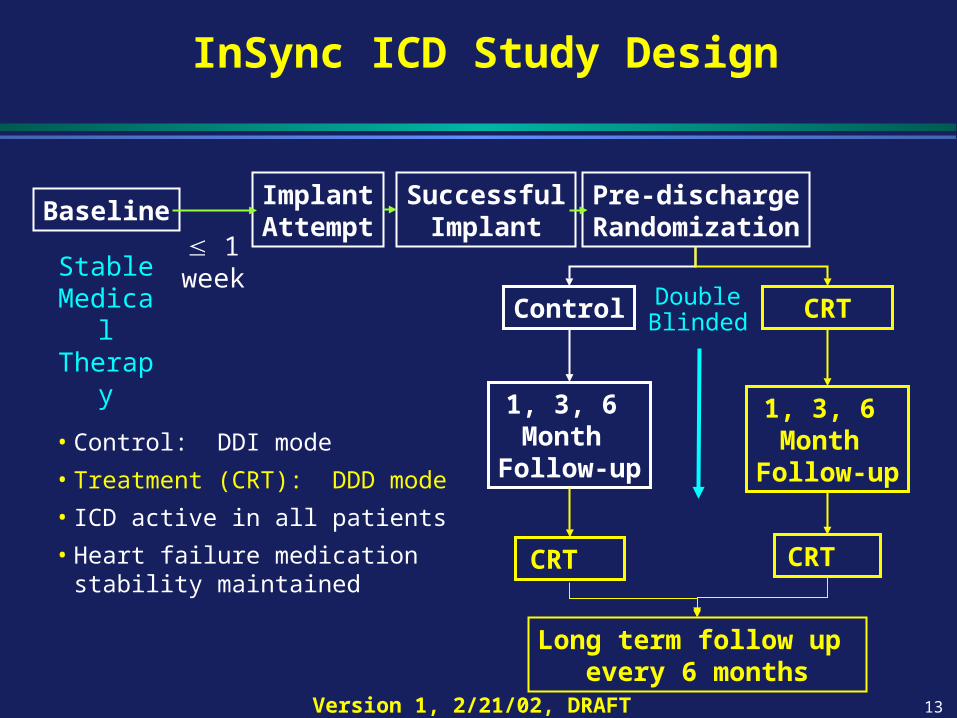
13Version 1, 2/21/02, DRAFT
InSync ICD Study Design
BaselineImplantAttempt
SuccessfulImplant
Control CRT
Pre-dischargeRandomization
1, 3, 6 Month
Follow-up
1, 3, 6 Month
Follow-up
CRT
DoubleBlinded
StableMedicalTherapy
1week
CRT
Long term follow up every 6 months
• Control: DDI mode
• Treatment (CRT): DDD mode
• ICD active in all patients
• Heart failure medication stability maintained

14Version 1, 2/21/02, DRAFT
Timing of Baseline Tests
Test InSync InSync ICD
6-Minute Hall Walk 0-7 days pre-implant
0-7 days pre-implant
Cardiopulmonary Exercise Test
0-7 days pre-implant
0-7 days post-implant
QOL Questionnaire
0-7 days pre-implant
0-7 days pre-implant
NYHA 0-7 days pre-implant
0-7 days pre-implant

15Version 1, 2/21/02, DRAFT
Study Features to Maintain the Blind
• Blinded: • Patients (study ID card)
• Heart failure staff
• Listed on study blinding log
• Blinded to ECGs
• Conducted QOL, 6 minute hall walk, patients global assessment, NYHA classification and HF exam
• Events Classification Committee
• Unblinded:• EP staff
• Listed on study blinding log
• Viewed ECGs, device printouts, etc
• Data placed into secure study envelopes

16Version 1, 2/21/02, DRAFT
Primary Safety Objectives
• InSync ICD-related complication-free survival at 3 months
• Attain Model 4189 LV lead-related complication-free survival at 6 months
• Attain Model 2187/2188 LV lead- related complication-free survival at 6 months
• InSync ICD system-related complication-free survival at 6 months

17Version 1, 2/21/02, DRAFT
Secondary Safety Objectives
• Characterize patient survival
• Characterize complication events
• Characterize observation events

18Version 1, 2/21/02, DRAFT
Lead Effectiveness Objectives
• Implant success• Evaluate the electrical performance of the
Model 4189 LV lead• Evaluate the electrical performance of the
Model 2187 and Model 2188 LV leads

19Version 1, 2/21/02, DRAFT
Evaluation of Integrity of ICD Function
• Spontaneous VT/VF therapy effectiveness
• Comparison of VT/VF event rates in the control and treatment arms
• ATP therapy efficacy with biventricular pacing
• Implant ventricular defibrillation criterion

20Version 1, 2/21/02, DRAFT
Primary Effectiveness Endpoints
• As pre-specified in the investigational plan for NYHA Class III and IV patients, the following change from baseline to 6-month visit between control and treatment groups in:
• Quality of life (MLWHF Questionnaire)• NYHA class• 6-minute hall walk distance
• As pre-specified in the investigational plan, all 3 endpoints must be met at P < 0.05, or 2 met at P < 0.025, or 1 met at P < 0.0167

21Version 1, 2/21/02, DRAFT
Secondary Effectiveness Endpoints
Clinical endpoints
• Exercise performance
• Clinical composite response
• Health care utilization
Physiological variables
• Echocardiographic variables
• QRS duration
• Neurohormonal variables

22Version 1, 2/21/02, DRAFT
Study Milestones
1999 2000 2001 2002
1st implantOctober 4, 1999
PMA submitted
May 3, 2001
100 NYHA Class III & IV
6-month visitsMarch, 2001
224 NYHA Class III & IV 6-month visitsOctober, 2001
PMA Update submittedNovember 9, 2001

23Version 1, 2/21/02, DRAFT
Patient Disposition
Implant Attemptsn=636
Randomizedn=362
NYHA Class III/IVn=421
Controln=176
CRTn=186
NYHA Class IIn=215
Randomizedn=192
Controln=106
CRTn=86
As pre-specified in the I.P., data from NYHA Class III/IV
patients are discussed in this presentation
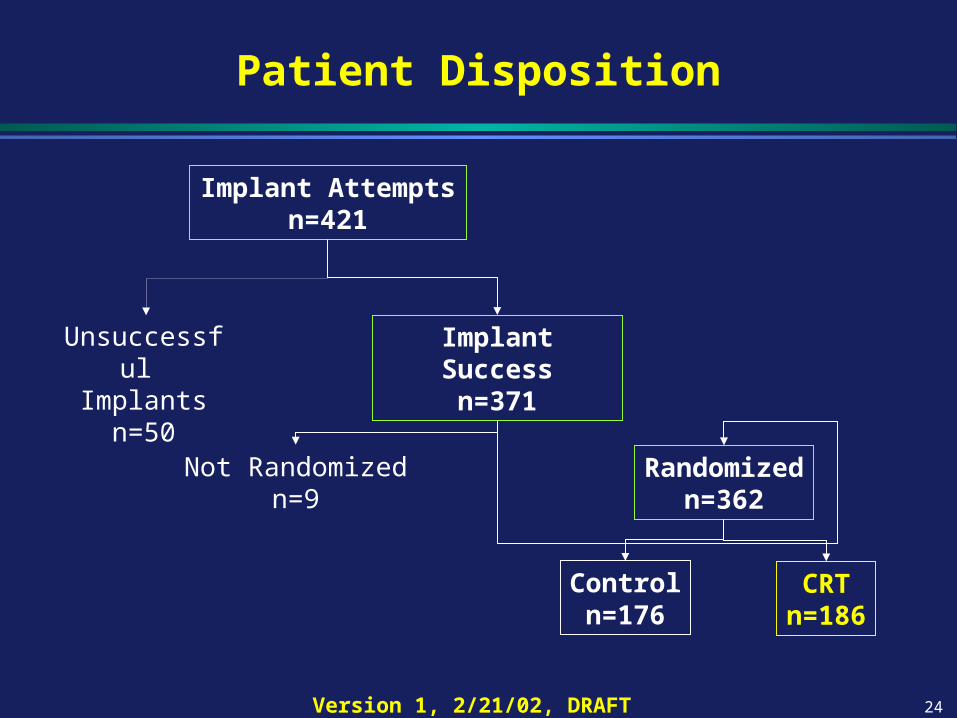
24Version 1, 2/21/02, DRAFT
Patient Disposition
Implant Attemptsn=421
Unsuccessful Implants
n=50
Randomizedn=362
Not Randomizedn=9
Implant Successn=371
Controln=176
CRTn=186

25Version 1, 2/21/02, DRAFT
Patient Disposition
Control n = 176 CRT n = 186
124 6 Month Dataset 133
35 Still in DB F/U 36
15 Death 12
2 6 month F/U Visit Missed 5

26Version 1, 2/21/02, DRAFT
Methodology Overview
• Safety Data• As pre-specified in the investigational plan, data
from NYHA Class II, III and IV patients were submitted to FDA for the primary safety objectives
• At FDA’s request, safety data from NYHA Class III and IV patients only are included in the Panel Pack and in this presentation

27Version 1, 2/21/02, DRAFT
Methodology Overview
• Efficacy Data• The investigational plan pre-specified that the primary
efficacy analysis was to be based on patients with paired data at 6 months, excluding crossovers
• Results presented are based on an intent-to-treat analysis for patients with paired data at 6 months, including crossovers
• Results of the pre-specified crossover excluded and last-observation-carried forward analyses will also be summarized

28Version 1, 2/21/02, DRAFT
Controln=176
CRTn=186
Age, years (mean ± sd) 68 ± 9 67 11
Gender (% male) 77% 76%
NYHA (% Class III) 89% 88%
QRS duration, ms (mean ± sd) 162 ± 22 165 ± 22
LVEF, % (mean ± sd) 20 ± 6 21 ± 7
LVEDD, mm (mean ± sd) 71 ± 9 70 ± 9
Heart Failure Etiology (% ischemic) 74% 63%
Patient Demographics

29Version 1, 2/21/02, DRAFT
Controln=176
CRTn=186
Peak VO2, ml/kg/min (mean ± sd) 13.5 ± 4.1 13.5 ± 3.7
6-Min Walk Distance, meters (mean ± sd) 247 ± 118 245 ± 127
Heart Rate, bpm (mean ± sd) 72 ± 13 71 ± 12
SBP, mmHg (mean ± sd) 111 ± 17 112 ± 20
DBP, mmHg (mean ± sd) 67 ± 13 66 ± 11
Diuretic Use 94% 93%
ACE-I or ARB Use 88% 91%
Beta-blocker Use 57% 63%
Patient Demographics

30Version 1, 2/21/02, DRAFT
Safety Results
Angel R. Leon, MD

31Version 1, 2/21/02, DRAFT
Primary Safety Objectives
• InSync ICD-related complication-free survival at 3 months
• Attain Model 4189 LV lead-related complication-free survival at 6 months
• Attain Model 2187/2188 LV lead- related complication-free survival at 6 months
• InSync ICD system-related complication-free survival at 6 months

32Version 1, 2/21/02, DRAFT
Secondary Safety Objectives
• Characterize patient survival
• Characterize complication events
• Characterize observation events
33Version 1, 2/21/02, DRAFT
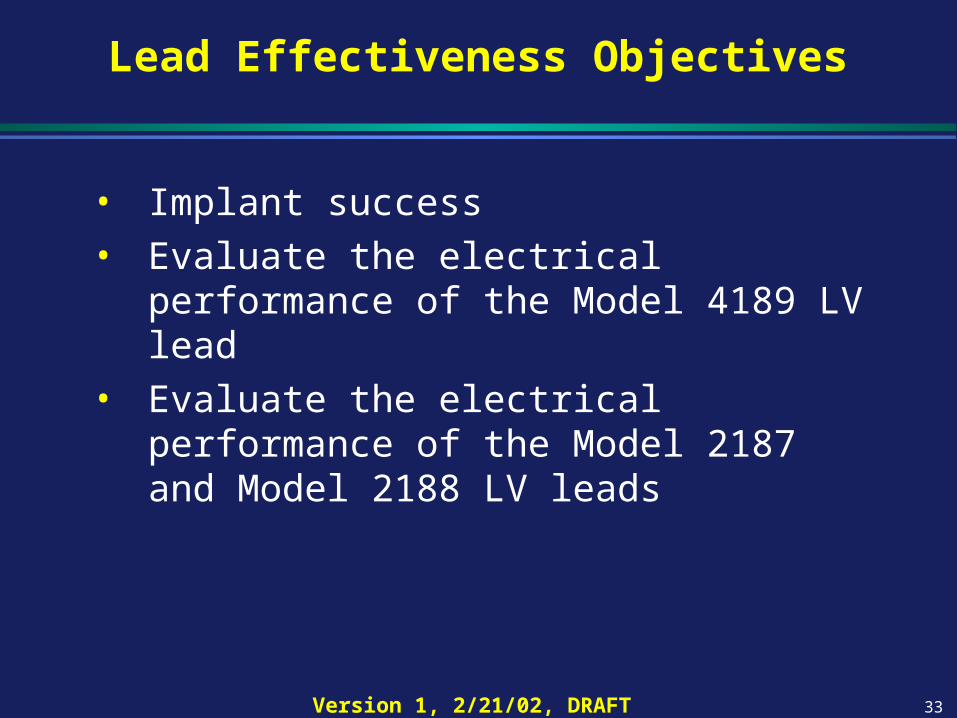
Lead Effectiveness Objectives
• Implant success• Evaluate the electrical performance of the
Model 4189 LV lead• Evaluate the electrical performance of the
Model 2187 and Model 2188 LV leads

34Version 1, 2/21/02, DRAFT
Evaluation of Integrity of ICD Function
• Spontaneous VT/VF therapy effectiveness
• Comparison of VT/VF event rates in the control and treatment arms
• ATP therapy efficacy with biventricular pacing
• Implant ventricular defibrillation criterion

35Version 1, 2/21/02, DRAFT
Lead Placement and LV Venous Anatomy
A. Lateral (marginal) cardiac vein
B. Postero-lateral cardiac vein
C. Posterior cardiac vein
D. Middle cardiac vein
E. Great cardiac vein
E
D
ABC
Attain LV Model 4189• Transvenous, 4 French• Stylet/catheter Delivered• Unipolar

36Version 1, 2/21/02, DRAFT
Adverse Event Definitions
• Complication: An adverse event requiring invasive intervention or that results in the death of or serious injury to the patient or in the termination of a significant device function
• Observation: An adverse event not requiring invasive intervention or resolves spontaneously
• System-related complication: A device-related complication that occurs after the initially implanted functioning system, comprised of: Model 7272 InSync ICD, a Model 4189, 2187 or 2188 LV lead, and RA and RV leads

37Version 1, 2/21/02, DRAFT
Implant Success
Patient Implant Attemptsn=421
Unsuccessful Implants
n=50
Implant Successn=371
Implant success defined per the protocol as a successfully placed LV lead.

38Version 1, 2/21/02, DRAFT
Unsuccessful Implants (n=50)
Reason* n
Dislodgement/unstable position 24
Unable to obtain distal location 18
Unable to cannulate coronary sinus ostium 16
Unacceptable pacing thresholds 13
Dissection/perforation 13
Unable to access coronary vein 8
Coronary vein too small 3
Patient decompensation during implant 3
Delivery system/tool problems 3
Patient venous anatomy 2
Diaphragmatic stimulation 2
Complete heart block 1
* Not mutually exclusive

39Version 1, 2/21/02, DRAFT
Adverse Events During the Implant Procedure
371 Successful
Implants
(53 Events)
50 Unsuccessful
Implants
(26 Events)
Coronary Sinus Dissection 5 12
Heart Block 9 3
Pericardial Effusion 2 3
Ventricular Tachycardia 2 3
Atrial Fibrillation 4 0
Cardiac Perforation 3 2
Heart Failure Decompensation 3 0
Hypotension 2 1
Atrial Flutter 2 0
Events Occurring One Time 21 2

40Version 1, 2/21/02, DRAFT
Resolution of Adverse Events During the Implant Procedure
Resolution*
371 Successful
Implants
(53 Events)
50 Unsuccessful
Implants
(26 Events)
No Intervention Required 11 9
Pharmacological Therapy 14 3
Reprogram Generator 6 0
Lead Repositioned 4 0
Lead Explanted 0 1
Other Treatment 31 16
*Categories not mutually exclusive.

41Version 1, 2/21/02, DRAFT
Resolution of Implant Dissection/Perforation Events
432 implant attempts22 events (22 patients)
Events Patients
No Intervention 8 8
Procedure Abandoned 7 7
Pericardiocentesis 2 2
Hospitalized for observation 2 2
Echocardiogram 1 1
LV lead explanted / port plugged 1 1
Lead repositioned 1 1
No patient deaths related to these events.

42Version 1, 2/21/02, DRAFT
Primary Safety Objective 1: Freedom From InSync ICD
Related Complications at 3 Months
50%
60%
70%
80%
90%
100%
0 1 2 3 4 5 6
Months Since Implant
Performance Objective• 371 patients implanted• 7 complications in 7 patients • Observed 3-month rate = 98.6%• Lower 95% confidence bound = 97.6%
• Performance objective: 95% LCB 89%

43Version 1, 2/21/02, DRAFT
Freedom From InSync ICD Related Complications at 3 Months
371 patients implanted7 events (7 patients)
Events Patients
Pocket seroma/hematoma 2 2
Pain at pocket site 1 1
Abnormal impedance measurement 1 1
Dizziness 1 1
Electrical reset of ICD 1 1
Pocket infection 1 1

44Version 1, 2/21/02, DRAFT
Primary Safety Objective 2: Freedom From Attain Model 4189
LV Lead-Related Complications at 6 Months
50%
60%
70%
80%
90%
100%
0 1 2 3 4 5 6
Months Since Implant
Performance Objective
• 315 patients implanted• 49 events (in 44 patients)• Observed 6-month rate = 85.1%• Lower 95% confidence bound = 81.7%• Performance objective: 95% LCB 75%

45Version 1, 2/21/02, DRAFT
Freedom From Attain Model 4189 LV Lead-Related Complications at 6 Months
315 patients implanted49 events (44 patients)
Events Patients*
Lead dislodgment 29 26
Extra cardiac stimulation 11 11
Elevated pacing thresholds 4 4
Failure to capture 3 3
Muscle stimulation – pectoral 1 1
Pericardial effusion 1 1
* Not mutually exclusive

46Version 1, 2/21/02, DRAFT
Attain Model 4189 LV Lead Related Complication Event Resolution
Resolution* Events* Patients*
Lead repositioned 32 30
Lead replaced 10 10
Lead explanted 7 7
ICD reprogrammed 4 4
None, continue to follow 4 4
Pericardiocentesis 1 1
Extend/change lead route 1 1
Lead setscrew retightened 1 1
ICD replacement 1 1* Not mutually exclusive

47Version 1, 2/21/02, DRAFT
Primary Safety Objective 3:Freedom From Attain Model 2187/2188
LV Lead-Related Complications at 6 Months
Performance Objective
• 56 patients implanted • 5 events in 5 patients• Observed 6-month rate = 89.9%• Lower 95% confidence bound = 82.9%• Performance objective: 95% LCB 75%
50%
60%
70%
80%
90%
100%
0 1 2 3 4 5 6
Months Since Implant

48Version 1, 2/21/02, DRAFT
Freedom From Attain Model 2187/2188 LV Lead-Related Complications at 6 Months
56 patients implanted5 events (5 patients)
Events Patients
Lead dislodgment 3 3
Failure to capture 1 1
Elevated pacing thresholds 1 1

49Version 1, 2/21/02, DRAFT
Primary Safety Objective 4:InSync ICD System-Related Complications at 6 Months
Events related to:
Left ventricular lead
Right atrial lead
54
11
InSync ICD 8
Right ventricular lead 4
System 2
50%
60%
70%
80%
90%
100%
0 1 2 3 4 5 6
Months Since Implant
Performance Objective
• 371 patients implanted • 79 events in 65 patients• Observed 6 month rate = 81.1%• Lower 95% confidence bound = 77.6%• Performance objective: 95% LCB 67%

50Version 1, 2/21/02, DRAFT
Primary Safety Results: Summary
All primary safety objectives satisfied Device-related complications attributed to:
InSync ICD Model 7272 Attain Models 4189, 2187 and 2188 leads InSync ICD system

51Version 1, 2/21/02, DRAFT
Secondary Safety Results

52Version 1, 2/21/02, DRAFT
Spontaneous VT/VF Therapy Effectiveness
Detection Zone
# Patients
# Episodes
# Successfully Terminated
# Unsuccessfully Terminated*
% Successfully Terminated
FVT 14 135 133 2 98.5%
VF 41 128 127 1 99.2%
VT 50 862 855 7 99.2%
Overall 78 1125 1115 10 99.1%
*
• VT terminated after all therapies were delivered (5 episodes)
• FVT/VT terminated after redetection but before additional therapies could be delivered (4 episodes)
• VF terminated after all therapies were delivered (1 episode)

53Version 1, 2/21/02, DRAFT
VT/VF Episodes Control vs. CRTPatients Completing 6 Months of Follow-up
Control (n=116)
CRT (n=125)
Number of Patients with VT/VF (P=0.21)
29 (25.0%) 22 (17.6%)
Total Number of Episodes (P=0.15)
285 156
Episodes per Month 0.42 0.21
54Version 1, 2/21/02, DRAFT
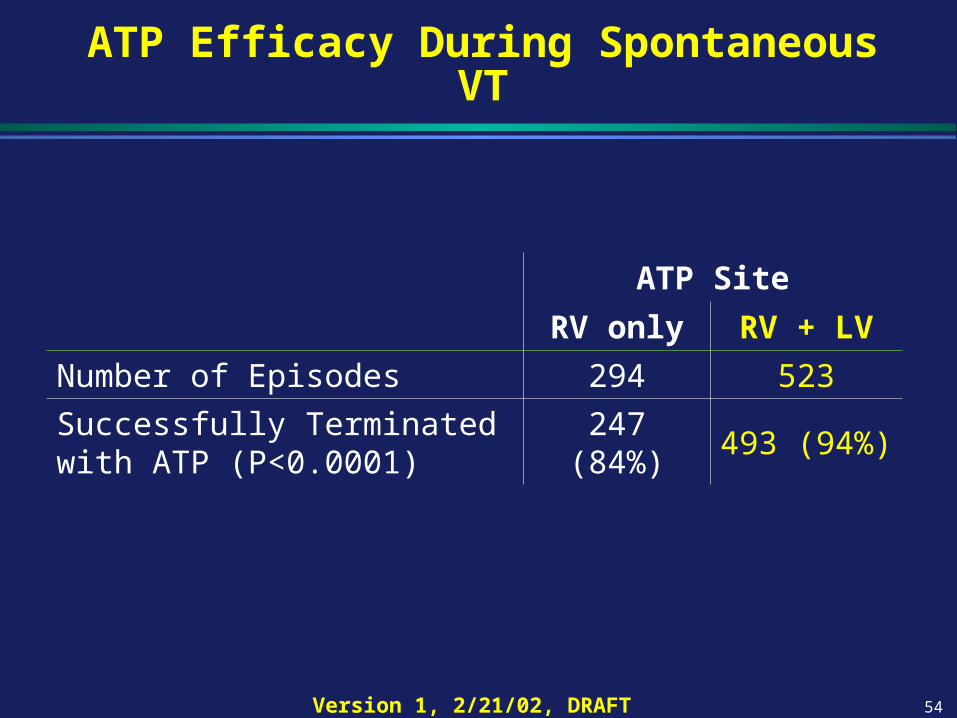
ATP Efficacy During Spontaneous VT
ATP Site
RV only RV + LV
Number of Episodes 294 523
Successfully Terminated with ATP (P<0.0001)
247 (84%) 493 (94%)

55Version 1, 2/21/02, DRAFT
Ventricular Defibrillation Testing
Implant Criterion
Used
n Percent (% )
2 at 24 joules
295 79.5%
Binary Search
52 14.0%
Other 24 6.5%

56Version 1, 2/21/02, DRAFT
Lead Effectiveness Results

57Version 1, 2/21/02, DRAFT
Lead Effectiveness Objective 1:Implant Success Results
• Performance Objective: • Lower 95% Confidence Limit > 83%
• Results: • Observed rate: 371 successes / 421 attempts = 88.1%• Lower Limit of 2-Sided 95% C.I. = 84.6%
Implant success defined per the protocol as a successfully placed LV lead.
58Version 1, 2/21/02, DRAFT
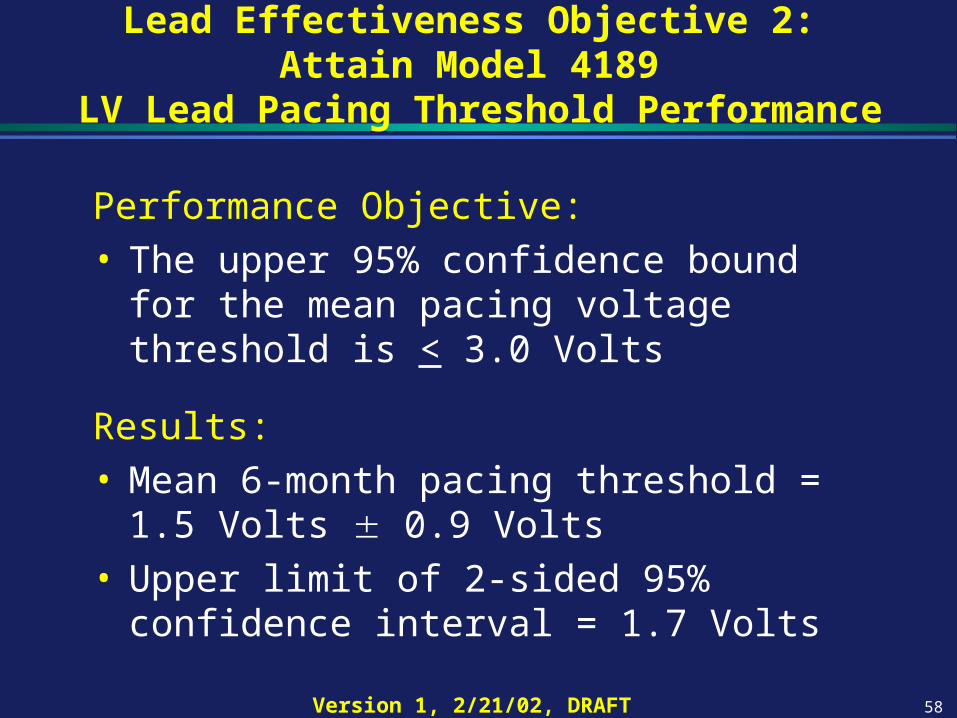
Lead Effectiveness Objective 2: Attain Model 4189
LV Lead Pacing Threshold Performance
Performance Objective:• The upper 95% confidence bound for the
mean pacing voltage threshold is < 3.0 Volts
Results:• Mean 6-month pacing threshold = 1.5 Volts
0.9 Volts• Upper limit of 2-sided 95% confidence
interval = 1.7 Volts

59Version 1, 2/21/02, DRAFT
Voltage Pacing Threshold for Attain Model 4189 LV Leads
0.0
1.0
2.0
3.0
4.0
5.0
6.0
7.0
Pac
ing
Th
resh
old
at
0.5
ms
(vo
lts)
Performance Objective
Implant PHD 1 Mo. 3 Mo. 6 Mo. 12 Mo. 18 Mo.
1.7 1.7 1.51.6 1.5 1.5 1.5
n=441 n=424 n=416 n=381 n=306 n=125 n=35

60Version 1, 2/21/02, DRAFT
Lead Effectiveness Objective 3: Attain Model 2187/2188
LV Lead Pacing Threshold Performance
Performance Objective:• The upper 95% confidence bound for the
mean pacing voltage threshold is < 3.0 Volts
Results:• Mean 6-month pacing threshold = 1.9 Volts
1.0 Volts• Upper limit of 2-sided 95% confidence
interval = 2.2 Volts

61Version 1, 2/21/02, DRAFT
Voltage Pacing Threshold for Attain Model 2187/2188 LV Leads
0.0
1.0
2.0
3.0
4.0
5.0
6.0
7.0
Pac
ing
Th
resh
old
at
0.5
ms
(vo
lts)
Performance Objective
Implant PHD 1 Mo. 3 Mo. 6 Mo. 12 Mo. 18 Mo.
1.7 1.7 1.92.3 1.9 1.7 1.6
n=79 n=82 n=79 n=74 n=62 n=29 n=18

62Version 1, 2/21/02, DRAFT
Effectiveness Results
James B. Young, MD

63Version 1, 2/21/02, DRAFT
Primary Efficacy Endpoints
• QOL score• NYHA class• 6 minute hall walk distance
Change from baseline to 6-month follow up between control and treatment groups in:

64Version 1, 2/21/02, DRAFT
Change in Quality of Life Score
10
20
30
40
50
60
70
80
Controln = 119
CRTn = 128
Baseline 6 Months
10
20
30
40
50
60
70
80
Base 1 M 3 M 6 M
Imp
rov
em
en
t
Control CRT
= -10 = -19
P=0.0098Score (Median)

65Version 1, 2/21/02, DRAFT
Change in NYHA Functional Class
47% 48%
5%
63%
34%
3%
0%
10%
20%
30%
40%
50%
60%
70%
Improved Stayed the Same Worsened
Control (n=123)Treatment (n=131)
P=0.028

66Version 1, 2/21/02, DRAFT
Change in NYHA Functional Class
6% 8%
38%
52%
90%
51%
90%
35%
10% 5% 10% 5%
0%
20%
40%
60%
80%
100%
Baseline 6-Months Baseline 6-Months
IVIIIIII
Control (n = 123) CRT (n = 131)

67Version 1, 2/21/02, DRAFT
Change in 6-Minute Hall Walk Distance
150
200
250
300
350
400
450
Controln = 118
CRTn = 122
Baseline 6 Months
150
200
250
300
350
400
450
Base 1 M 3 M 6 M
Control CRT
= 53 = 56
P=0.408Distance Walked (Median)

68Version 1, 2/21/02, DRAFT
Summary of Effect on Primary Endpoints
P-Values
EndpointIntention-to-Treat
Per Protocol
Intention-to-Treat Last Observation
Carried Forward
QOL 0.0098 0.0044 0.003
NYHA 0.028 0.0145 0.02
6 Minute Hall Walk 0.408 0.4993 0.25

69Version 1, 2/21/02, DRAFT
Secondary Effectiveness Results

70Version 1, 2/21/02, DRAFT
Secondary Effectiveness Endpoints
Clinical endpoints
• Exercise performance
• Clinical composite response
• Healthcare utilization
Physiological variables
• Echocardiographic variables
• QRS duration
• Plasma neurohormones

71Version 1, 2/21/02, DRAFT
Secondary Effectiveness Results:Clinical Endpoints

72Version 1, 2/21/02, DRAFT
Exercise PerformancePeak VO2 and Exercise Duration
Peak VO2 (ml/kg/min)
10
12
14
16
18
20
Baseline 6 Months
Controln = 93
CRTn = 96
= 0.0 = 1.1
P=0.05
Total Exercise Time (Seconds)
200
300
400
500
600
700
800
Controln = 96
CRTn = 97
= -26 = 58
P=<0.001

73Version 1, 2/21/02, DRAFT
Clinical Composite Response - Definition
• ImprovedImproved NYHA class or global assessment
• WorsenedDeath; worsening heart failure leading to hospitalization or permanent withdrawal of therapy; or worsening of NYHA class or global assessment
• No Change
Packer et al. J Cardiac Failure 2001;7:176-182.

74Version 1, 2/21/02, DRAFT
Clinical Composite Response Results
40%33%
26%26%
55%
19%
0%
10%
20%
30%
40%
50%
60%
70%
Improved No Change Worsened
Per
cent
age
of P
atie
nts
Control n=141 CRT n=150
P = 0.038

75Version 1, 2/21/02, DRAFT
Hospitalization ResultsTotal Days Hospitalized Through 6 Months
573
703
0100200300400500600700
257
374
0
100
200
300
All-Cause Hospitalization* Heart Failure Hospitalization#
Control (n=176) CRT (n=186)
* Control Group: 134 hospitalizations (79 pts) CRT Group: 127 hospitalizations (75 pts)
# Control Group: 70 hospitalizations (47 pts) CRT Group: 54 hospitalizations (39 pts)
P = 0.18 P = 0.11

76Version 1, 2/21/02, DRAFT
InSync ICDDeath or Worsening Heart Failure Requiring
Hospitalization or IV Medications
50%
60%
70%
80%
90%
100%
0 1 2 3 4 5 6Months Since Implant
Fre
edo
m f
rom
Eve
nt
Rat
e
Hazard Ratio = 0.6995% CI (0.46,1.04)
55102117137153170186— CRT
469396117137148176— Control
Patients At Risk
P = 0.07
CRT
Control

77Version 1, 2/21/02, DRAFT
Secondary Effectiveness Results:Physiological Variables
78Version 1, 2/21/02, DRAFT
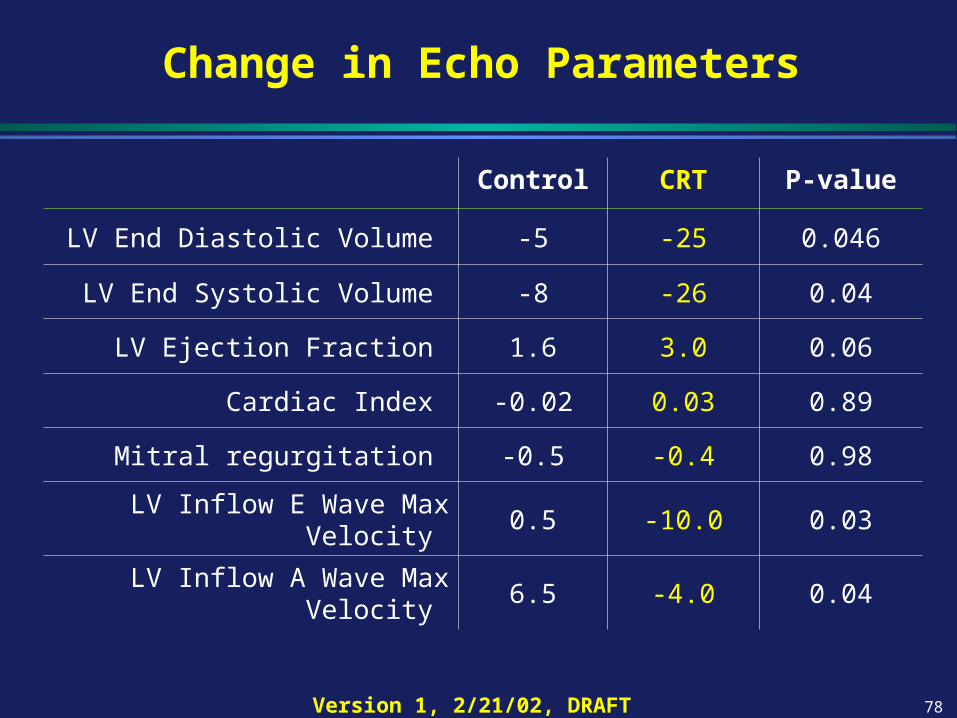
Change in Echo Parameters
Control CRT P-value
LV End Diastolic Volume -5 -25 0.046
LV End Systolic Volume -8 -26 0.04
LV Ejection Fraction 1.6 3.0 0.06
Cardiac Index -0.02 0.03 0.89
Mitral regurgitation -0.5 -0.4 0.98
LV Inflow E Wave Max Velocity 0.5 -10.0 0.03
LV Inflow A Wave Max Velocity 6.5 -4.0 0.04

79Version 1, 2/21/02, DRAFT
Change in Echo/ECG Parameters
Control CRT P-value
LV E-Wave/A-Wave Ratio -0.03 -0.06 0.82
Normalized LV Filling Time 0.01 0.05 0.001
LV Mass -6 -3 0.97
LV Diameter in Systole -0.3 -0.2 0.98
LV Diameter in Diastole -0.1 -0.3 0.85
Interventricular Mechanical Delay -2 -18 0.12
QRS Width -6 -20 0.01

80Version 1, 2/21/02, DRAFT
Change in Neurohormone Levels
Control CRT P-value
Brain Natriuretic Peptide (BNP)
-3 -38 0.41
Dopamine 0.0 0.0 0.56
Norepinephrine -38.0 10.5 0.24
Epinephrine -4.0 0.0 0.03
Big Endothelin -0.5 -0.5 0.88
81Version 1, 2/21/02, DRAFT
Comparison of InSync and InSync ICD
William T. Abraham, MD

82Version 1, 2/21/02, DRAFT
InSync ICD Study Design
BaselineImplantAttempt
SuccessfulImplant
Control CRT
Pre-dischargeRandomization
1, 3, 6 Month
Follow-up
1, 3, 6 Month
Follow-up
CRT
DoubleBlinded
StableMedicalTherapy
1week
CRT
Long term follow up every 6 months
• Control: DDI mode
• Treatment (CRT): DDD mode
• ICD active in all patients
• Heart failure medication stability maintained

83Version 1, 2/21/02, DRAFT
Timing of Baseline Tests
Test InSync InSync ICD
6-Minute Hall Walk 0-7 days pre-implant
0-7 days pre-implant
Cardiopulmonary Exercise Test
0-7 days pre-implant
0-7 days post-implant
QOL Questionnaire
0-7 days pre-implant
0-7 days pre-implant
NYHA 0-7 days pre-implant
0-7 days pre-implant

84Version 1, 2/21/02, DRAFT
InSync ICDn=362
InSyncn=532
Age, years (mean ± sd) 67 ± 10 64 11
Gender (% male) 77% 70%
NYHA (% Class III) 88% 90%
QRS duration, ms (mean ± sd) 164 ± 22 166 ± 21
LVEF, % (mean ± sd) 20 ± 7 22 ± 6
LVEDD, mm (mean ± sd) 71 ± 9 69 ± 10
Heart Failure Etiology (% ischemic) 69% 55%
Comparison of Patient Demographics – InSync and InSync ICD

85Version 1, 2/21/02, DRAFT
InSync ICDn=362
InSyncn=532
Peak VO2 , ml/kg/min (mean ± sd) 13.5 ± 3.9 13.8 ± 3.7
6-MW Distance, meters (mean ± sd) 246 ± 123 298 ± 97
Heart Rate, bpm (mean ± sd) 71 ± 13 74 ± 13
SBP, mmHg (mean ± sd) 111 ± 18 112 ± 19
DBP, mmHg (mean ± sd) 66 ± 12 68 ± 11
Diuretic Use 93% 93%
ACE-I or ARB Use 90% 91%
Beta-blocker Use 60% 56%
Comparison of Patient Demographics – InSync and InSync ICD

86Version 1, 2/21/02, DRAFT
Change in Quality of Life Score(InSync ICD vs. InSync)
P=0.010 P=0.003
InSyncInSync ICD
10
20
30
40
50
60
70
80
Base 1 M 3 M 6 M
Imp
rov
em
en
t
Control CRT
10
20
30
40
50
60
70
80
Base 1 M 3 M 6 M
Imp
rov
em
en
tControl CRT

87Version 1, 2/21/02, DRAFT
P=0.02 P<0.001InSyncInSync ICD
Change in NYHA Class(InSync ICD vs. InSync)
47%63%
38%
68%
48%34%
59%
30%
3% 4% 2%5%
0%
20%
40%
60%
80%
100%
InSyncICD
Control
InSyncICD
Treatment
InSyncControl
InSyncTreatment
Worsened
Stayed theSame
Improved

88Version 1, 2/21/02, DRAFT
Change in 6-Minute Hall Walk Distance (InSync ICD vs. InSync)
P=0.408 P=0.003InSyncInSync ICD
150
200
250
300
350
400
450
Base 1 M 3 M 6 M
Control CRT
150
200
250
300
350
400
450
Base 1 M 3 M 6 M
Control CRT

89Version 1, 2/21/02, DRAFT
InSync and InSync ICD Studies:Primary Endpoints
0.003
0.408
+40
+56
+10
+53
6-minute walk
(meters)
<0.001
0.027
-1
-1
0
0
NYHA Class
(class)
0.003
0.010
-18.5
-19
-9
-10
Quality of Life
(points)
P-valueCRTControlEndpoint
White = InSync Study; Yellow = InSync ICD Study

90Version 1, 2/21/02, DRAFT
InSync and InSync ICD Studies:Secondary Clinical Endpoints
<0.001
0.038
66,20,14
55,19,26
42,35,23
40,26,33
Composite Response (%)
<0.001
<0.001
85
58
12
-26
Exercise Time
(sec)
0.038
0.050
1.0
1.1
0.1
0.0
Peak VO2
(ml/kg/min)
P-valueCRTControlEndpoint
White = InSync Study; Yellow = InSync ICD Study

91Version 1, 2/21/02, DRAFT
InSync ICDDeath or Worsening Heart Failure Requiring
Hospitalization or IV Medications
50%
60%
70%
80%
90%
100%
0 1 2 3 4 5 6Months Since Implant
Fre
edo
m f
rom
Eve
nt
Rat
e
Hazard Ratio = 0.6995% CI (0.46,1.04)
55102117137153170186— CRT
469396117137148176— Control
Patients At Risk
P = 0.07
CRT
Control

92Version 1, 2/21/02, DRAFT
InSyncDeath or Worsening Heart Failure Requiring
Hospitalization or IV Medications
50%
60%
70%
80%
90%
100%
0 1 2 3 4 5 6Months Since Implant
Fre
edo
m f
rom
Eve
nt
Rat
e
Hazard Ratio = 0.5895% CI (0.37,0.92)
73157162184211219230— CRT
62150157178197209231— Control
Patients At Risk
P = 0.02
CRT
Control

93Version 1, 2/21/02, DRAFT
Hospitalization Results: InSync ICDTotal Days Hospitalized Through 6 Months
573
703
0100200300400500600700
257
374
0
100
200
300
All-Cause Hospitalization* Heart Failure Hospitalization#
Control (n=176) CRT (n=186)
* Control Group: 134 hospitalizations (79 pts) CRT Group: 127 hospitalizations (75 pts)
# Control Group: 70 hospitalizations (47 pts) CRT Group: 54 hospitalizations (39 pts)
P = 0.18 P = 0.11

94Version 1, 2/21/02, DRAFT
Hospitalization Results: InSyncTotal Days Hospitalized Through 6 Months
275
664
0100200300400500600700
56
302
050
100150200250300350
All-Cause Hospitalization* Heart Failure Hospitalization#
Control (n=231) CRT (n=230)
*Control Group: 99 hospitalizations (60 pts) CRT Group: 80 hospitalizations (57 pts)
#Control Group: 39 hospitalizations (27 pts) CRT Group: 20 hospitalizations (14 pts)
P=0.002 P=0.083

95Version 1, 2/21/02, DRAFT
The End