1 Thermally induced 4f – 5d transitions in LuAlO 3 :Ce (LuAP) A.J. Wojtowicz, S. Janus Institute...
27
A.J. Wojtowicz, SCINT 2007, J une 2007 1 Thermally induced 4f – 5d transitions in LuAlO 3 :Ce (LuAP) A.J. Wojtowicz , S. Janus Institute of Physics, N. Copernicus Univ. Toruń, POLAND IEEE 9th International Conference on Inorganic Scintillators and their Applications, Winston-Salem, NC USA
-
date post
20-Dec-2015 -
Category
Documents
-
view
215 -
download
2
Transcript of 1 Thermally induced 4f – 5d transitions in LuAlO 3 :Ce (LuAP) A.J. Wojtowicz, S. Janus Institute...
A.J. Wojtowicz, SCINT 2007, June 2007
1
Thermally induced 4f – 5d transitions in LuAlO3:Ce (LuAP)
A.J. Wojtowicz, S. JanusInstitute of Physics, N. Copernicus Univ. Toruń, POLAND
IEEE 9th International Conference on Inorganic Scintillators and their Applications,
Winston-Salem, NC USA
June 4 – 8, 2007

A.J. Wojtowicz, SCINT 2007, June 2007
2
INTRODUCTION
LuAP: 8.34 g/cm3, photofraction 0.3,
365 nm emission, 17 ns decay time,
LY over 2xBGO, yet problems
GOAL of this work
study, report and explain details of optical
transitions generating scintillation light
A.J. Wojtowicz, SCINT 2007, June 2007
3
SAMPLES
2 pixels 2x2x10 mm, grown in 2004 at Institute of
Electronic Materials Technology, Warsaw, Poland
by prof. Lukasiewicz et al
LuAlO3:0.07%at Ce, LuAlO3:0.15%at Ce
Emission and excitation spectra:
Superlumi station, I – beamline, Hasylab,
Hamburg, Germany (prof. Zimmerer)
A.J. Wojtowicz, SCINT 2007, June 2007
4
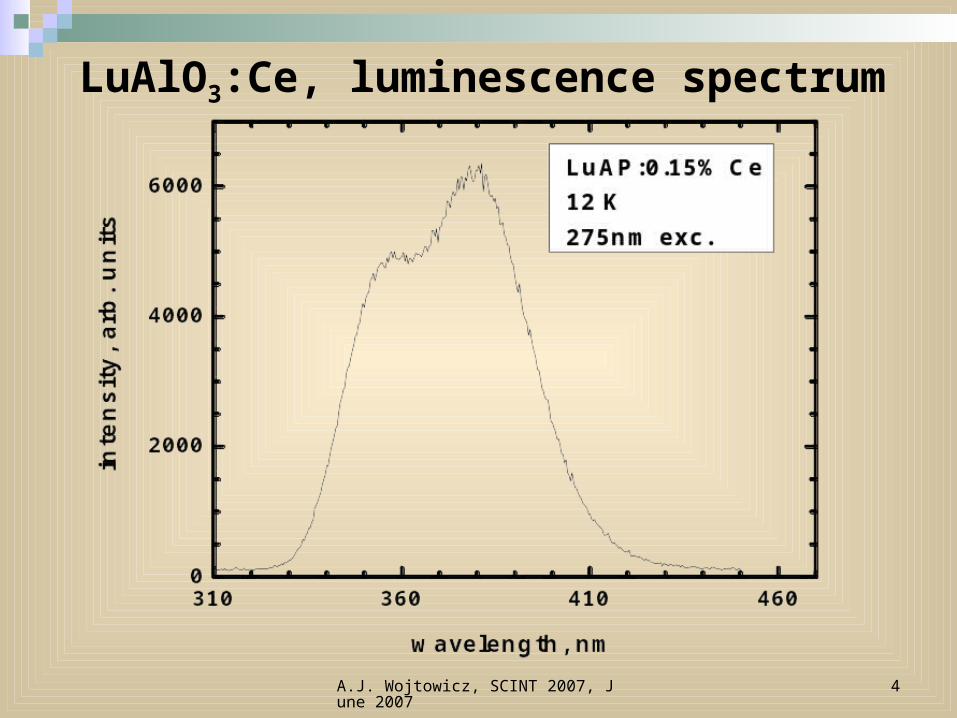
LuAlO3:Ce, luminescence spectrum
A.J. Wojtowicz, SCINT 2007, June 2007
5
Luminescence spectra, summary:
Two spin – orbit split bands (1600 cm-1)
lowest d → 2F5/2 357 nm
lowest d → 2F7/2 379 nm
Crystal field structure not resolved
more or less comparable intensities

A.J. Wojtowicz, SCINT 2007, June 2007
6
Corrected excitation spectra

A.J. Wojtowicz, SCINT 2007, June 2007
7
EXCITATION SPECTRA, summary:
Strong triple 2F → T2 band
two strong (306, 295 nm),
one weak transitions (276 nm)
34 000 ± 1800 cm-1
Weaker double 2F → E band
(226, 214 nm)
45 500 ± 1200 cm-1

A.J. Wojtowicz, SCINT 2007, June 2007
8
Stokes shift ~ 4700 cm-1
DOMINANT CUBIC FIELD (Oh);
10Dq ~ 11 500 cm-1
weak low symmetry field ~ 1500 cm-1
The intensity ratio of two d–bands
2F → T2 / 2F → E
12 K ~ 4.4
298 K ~ 3.8

A.J. Wojtowicz, SCINT 2007, June 2007
9
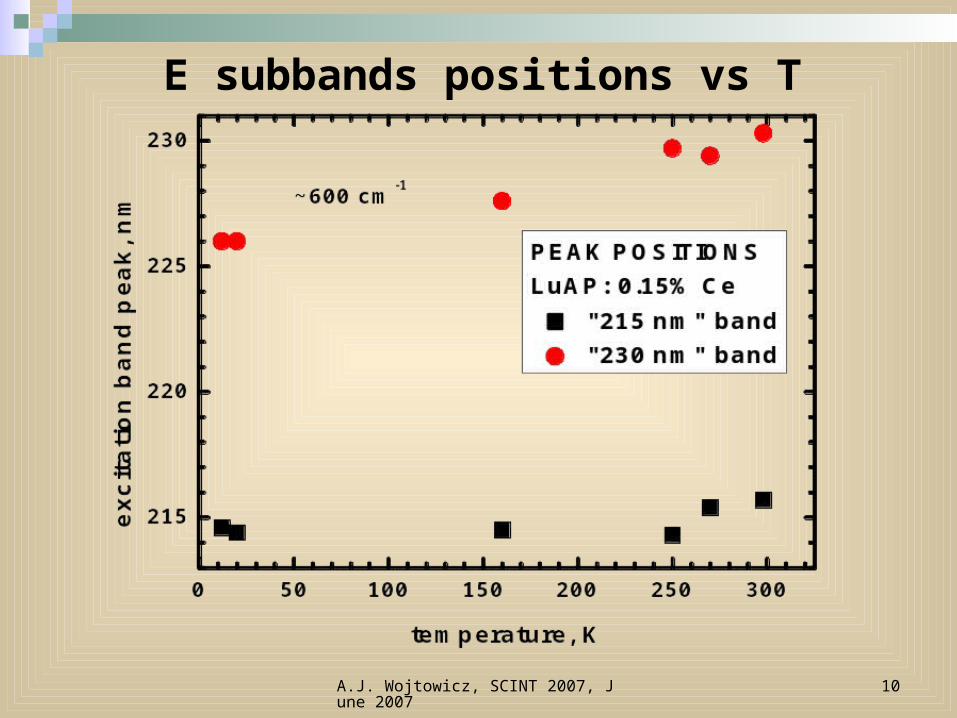
Both T2 and E d–bands strongly expand
toward longer wavelengths with increasing T
Intensities of 5d E subbands;
„230 nm” subband increases,
„215 nm” subband decreases with T,
„230 nm” subband peak shifts
toward lower λ
A.J. Wojtowicz, SCINT 2007, June 2007
10
E subbands positions vs T
A.J. Wojtowicz, SCINT 2007, June 2007
11
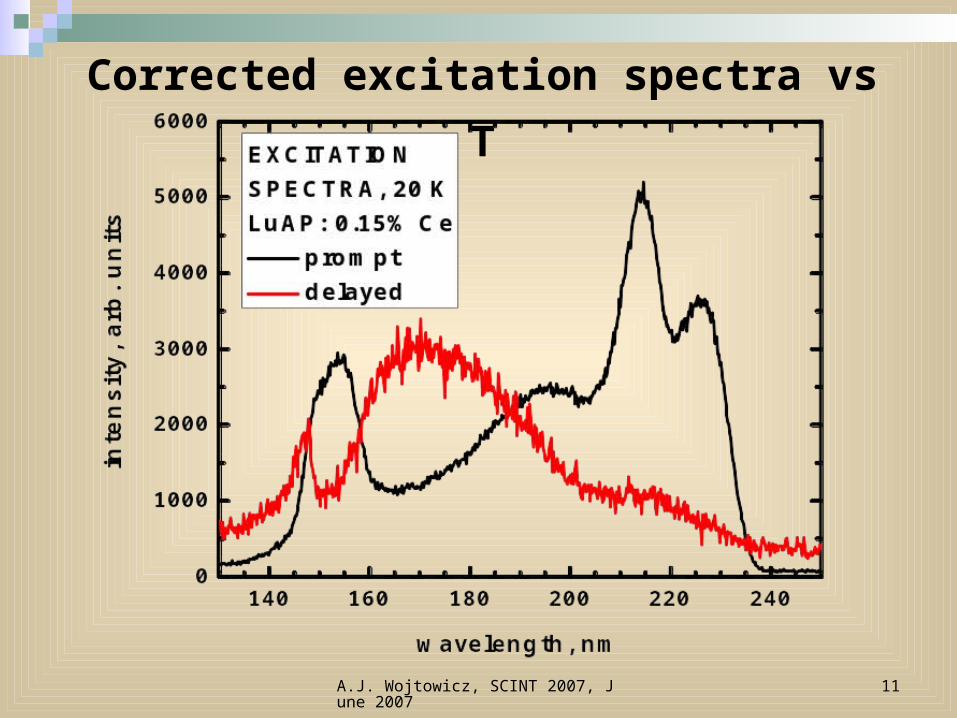
Corrected excitation spectra vs T
A.J. Wojtowicz, SCINT 2007, June 2007
12
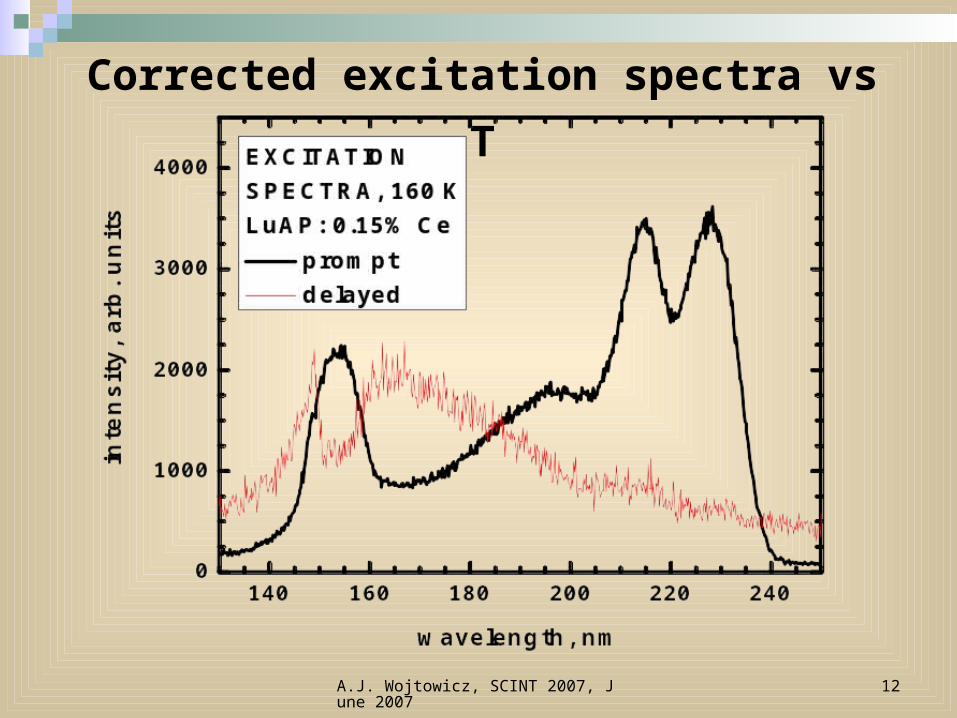
Corrected excitation spectra vs T
A.J. Wojtowicz, SCINT 2007, June 2007
13
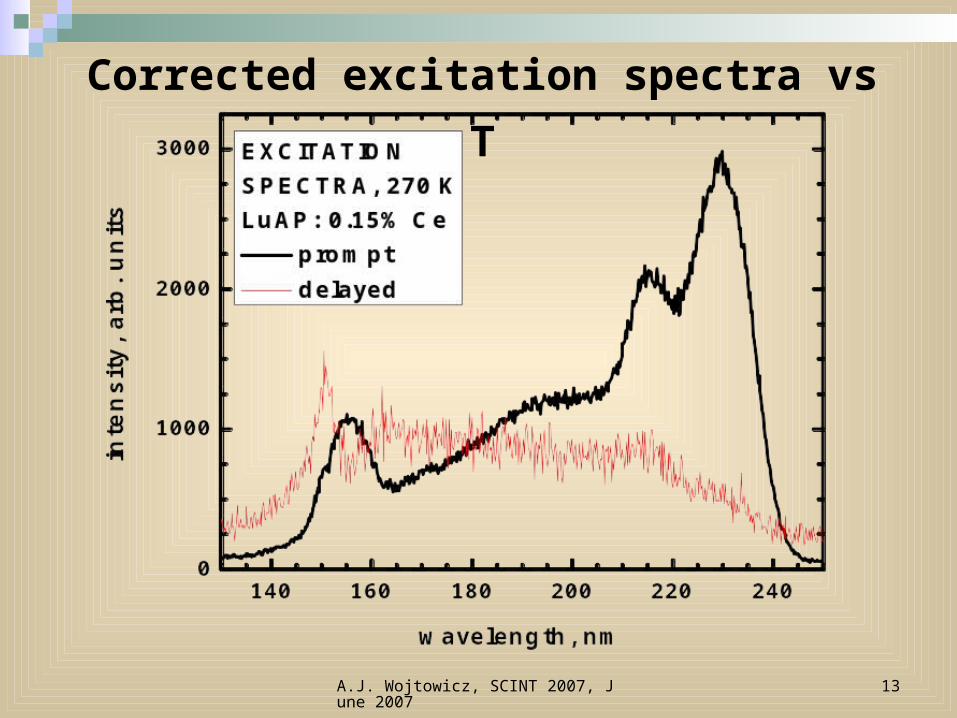
Corrected excitation spectra vs T

A.J. Wojtowicz, SCINT 2007, June 2007
14
THEORY - MODEL
D.J. Robbins, YAG J. Electrochem. Soc.
1979
Thermally activated transitions from the higher ground state
level
Different transition moments
BAND SHIFTS
p1 < p1’
p1 < p2
p2’ < p1
’
A.J. Wojtowicz, SCINT 2007, June 2007
15
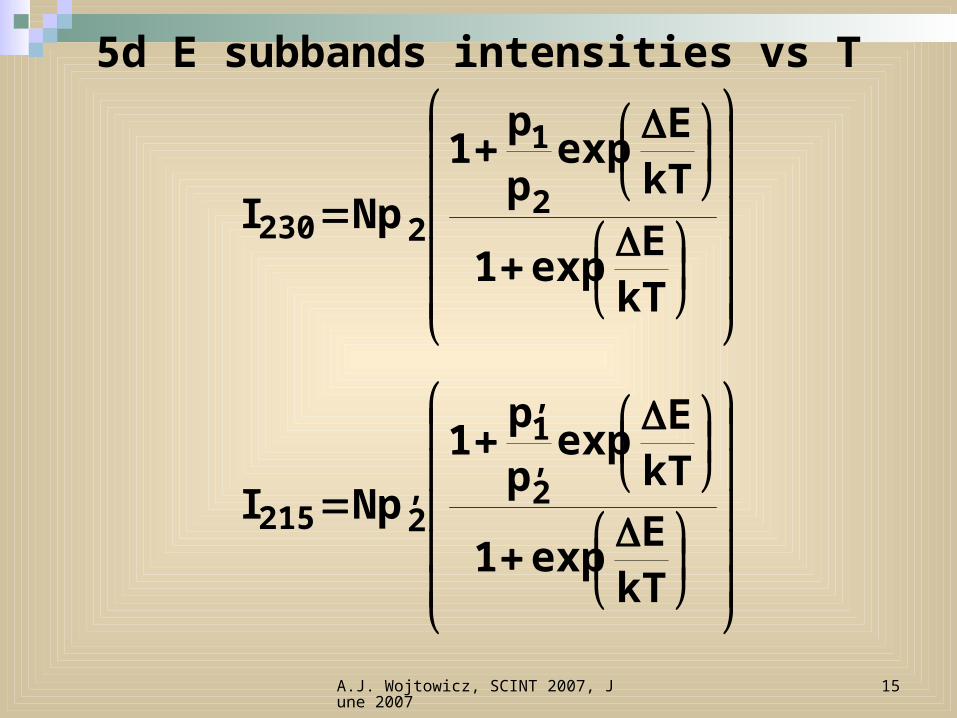
5d E subbands intensities vs T
kTE
exp1
kTE
expp
p1
NpI,2
,1
,2215
kTE
exp1
kTE
expp
p1
NpI 2
1
2230
A.J. Wojtowicz, SCINT 2007, June 2007
16
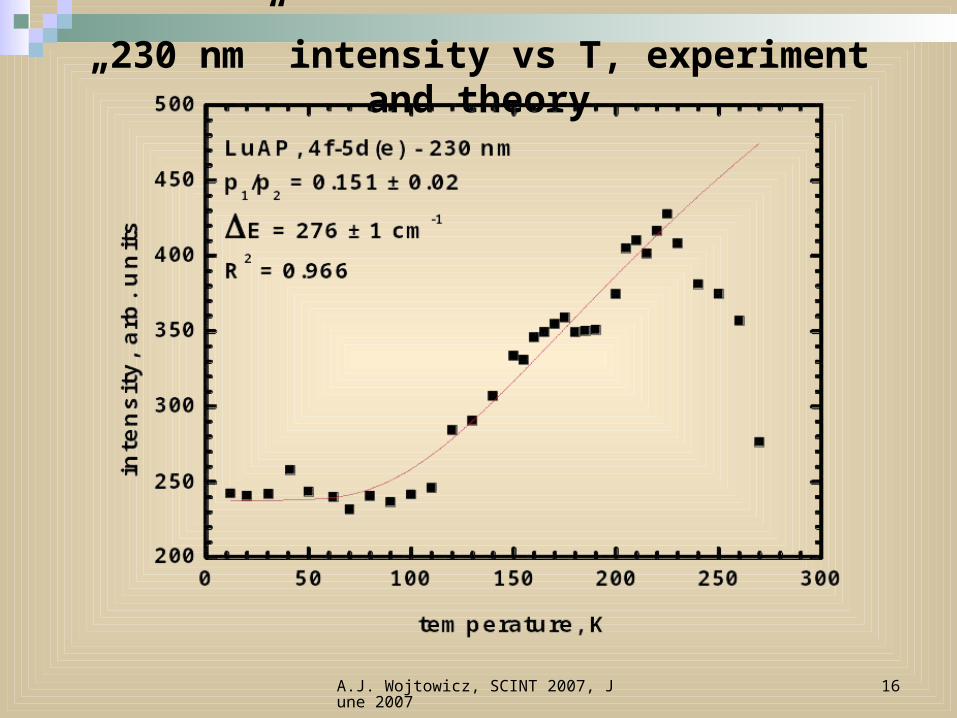
„230 nm” intensity vs T, experiment and theory

A.J. Wojtowicz, SCINT 2007, June 2007
17
„215 nm” intensity vs T, experiment and theory
A.J. Wojtowicz, SCINT 2007, June 2007
18
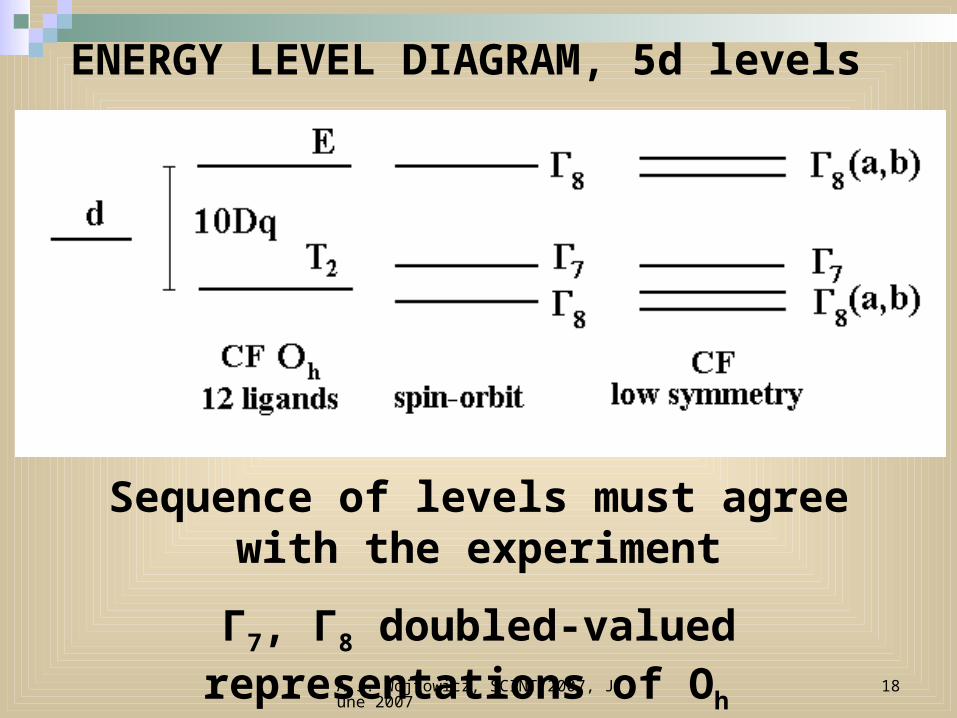
ENERGY LEVEL DIAGRAM, 5d levels
Sequence of levels must agree with the experiment
Γ7, Γ8 doubled-valued representations of Oh

A.J. Wojtowicz, SCINT 2007, June 2007
19
ENERGY LEVEL DIAGRAM, 4f levels
Sequence of levels must agree with the experiment
Γ6, Γ7, Γ8 doubled-valued representations of Oh

A.J. Wojtowicz, SCINT 2007, June 2007
20
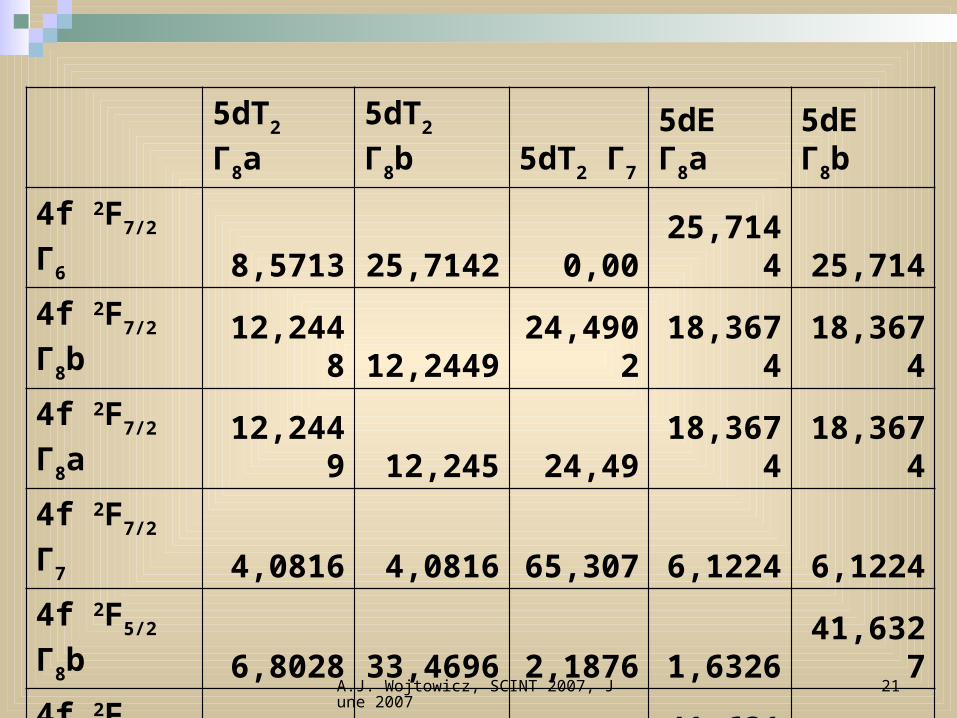
Transition moment matrix elements(line strenghts)
between
Γ6, Γ7, Γ8 states originating from 2F7/2 and Γ7, Γ8 states from 2F5/2 term of 4f configuration
and
Γ8, Γ7 states originating from T2 and E terms of 5d electron configuration
T. Hoshina, J. Phys. Soc. Jap., 1980
A.J. Wojtowicz, SCINT 2007, June 2007
21
5dT2 Γ8a 5dT2 Γ8b 5dT2 Γ7 5dE Γ8a 5dE Γ8b
4f 2F7/2 Γ6 8,5713 25,7142 0,00 25,7144 25,714
4f 2F7/2 Γ8b 12,2448 12,2449 24,4902 18,3674 18,3674
4f 2F7/2 Γ8a 12,2449 12,245 24,49 18,3674 18,3674
4f 2F7/2 Γ7 4,0816 4,0816 65,307 6,1224 6,1224
4f 2F5/2 Γ8b 6,8028 33,4696 2,1876 1,6326 41,6327
4f 2F5/2 Γ8a 33,469 6,8028 2,1768 41,6314 1,6326
4f 2F5/2 Γ7 34,014 34,0138 1,3605 8,1632 8,1632
A.J. Wojtowicz, SCINT 2007, June 2007
22
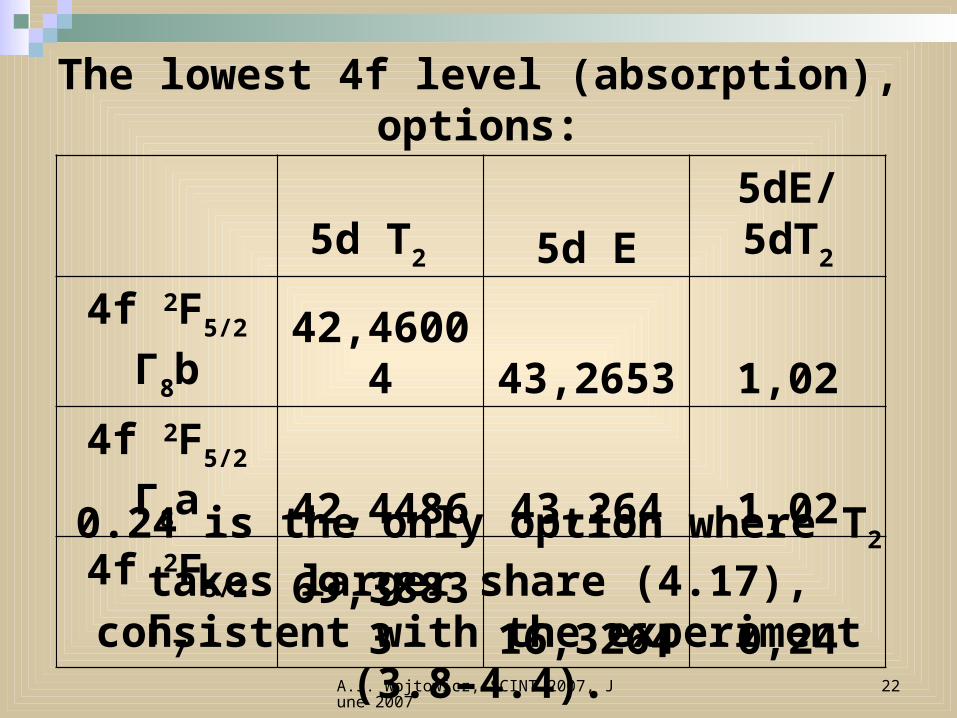
5d T2 5d E 5dE/5dT2
4f 2F5/2 Γ8b 42,46004 43,2653 1,02
4f 2F5/2 Γ8a 42,4486 43,264 1,02
4f 2F5/2 Γ7 69,38833 16,3264 0,24
The lowest 4f level (absorption), options:
0.24 is the only option where T2 takes larger share (4.17), consistent with the experiment
(3.8–4.4).

A.J. Wojtowicz, SCINT 2007, June 2007
23
The sequence of 5d T2 levels (absorption), relevant matrix elements:
Only 4f Γ7 ground state and 5d Γ8 below Γ7 are consistent with two strong and one weak
transitions generating 4f 2F5/2 → 5d T2 band
5dT2Γ8a 5dT2Γ8b 5dT2Γ7
4f2F5/2 Γ8b 6,8028 33,46962 2,18762
4f2F5/2 Γ8a 33,469 6,8028 2,1768
4f2F5/2 Γ7 34,014 34,0138 1,36053
A.J. Wojtowicz, SCINT 2007, June 2007
24
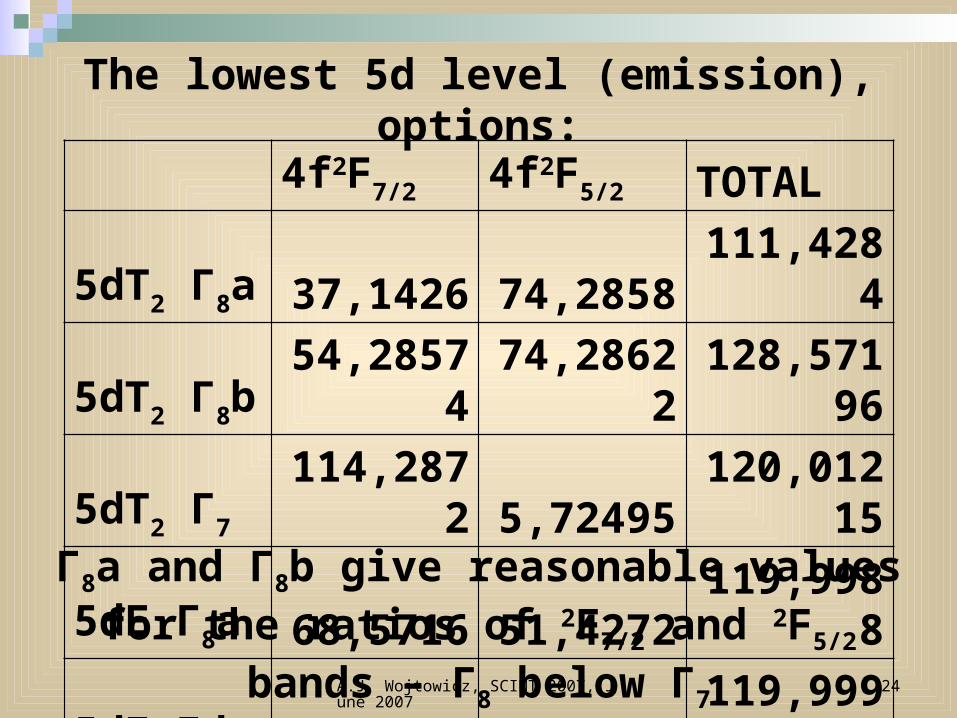
The lowest 5d level (emission), options:
Γ8a and Γ8b give reasonable values for the ratios of 2F7/2 and 2F5/2 bands – Γ8 below Γ7
4f2F7/2 4f2F5/2 TOTAL
5dT2 Γ8a 37,1426 74,2858 111,4284
5dT2 Γ8b 54,28574 74,28622 128,57196
5dT2 Γ7 114,2872 5,72495 120,01215
5dE Γ8a 68,5716 51,4272 119,9988
5dE Γ8b 68,5712 51,4285 119,9997
A.J. Wojtowicz, SCINT 2007, June 2007
25
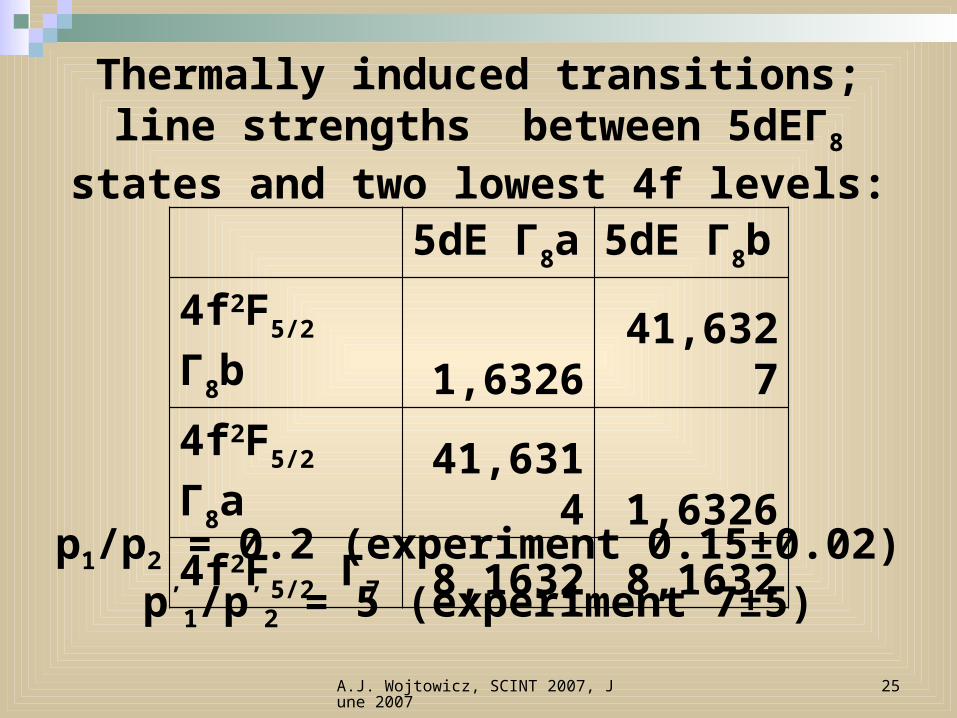
Thermally induced transitions; line strengths between 5dEΓ8 states and two lowest 4f levels:
5dE Γ8a 5dE Γ8b
4f2F5/2 Γ8b 1,6326 41,6327
4f2F5/2 Γ8a 41,6314 1,6326
4f2F5/2 Γ7 8,1632 8,1632
p1/p2 = 0.2 (experiment 0.15±0.02)p’
1/p’2 = 5 (experiment 7±5)

A.J. Wojtowicz, SCINT 2007, June 2007
26
SUMMARY
Dominant cubic and low symmetry crystal field components
determine the ground and excited states of the Ce3+ ion in LuAP,
in order of increasing energy:
4f 2F5/2: 2F5/2Γ7, 2F5/2Γ8a, 2F5/2Γ8b
5d 2D: T2Γ8a, T2Γ8b, T2Γ7, EΓ8a, EΓ8b
A.J. Wojtowicz, SCINT 2007, June 2007
27
The transition moment matrix elements between these states are consistent with the
observed emission and absorption intensities and their temperature dependences
In contrast to Ce–activated YAG and BaF2,
in LuAP, YAP and LuYAP sequence of ground and excited state energy levels may
enhance self–absorption of Ce emission;
consequences for scintillation of large crystals; radiation trapping and energy
migration