
1 The Elderly Populations and Levels of Aged Dependency in China and the United States: Past,...
37
1 The Elderly Populations and Levels of Aged Dependency in China and the United States: Past, Present and Future Dudley L. Poston, Jr., Hua Luo, & Heather K. M. Terrell Department of Sociology Texas A&M University College Station, TX 77843 [email protected]
-
Upload
cornelia-owen -
Category
Documents
-
view
213 -
download
0
Transcript of 1 The Elderly Populations and Levels of Aged Dependency in China and the United States: Past,...

11
The Elderly Populations and Levels ofAged Dependency in China and the United States:
Past, Present and Future
Dudley L. Poston, Jr.,
Hua Luo, &
Heather K. M. Terrell
Department of SociologyTexas A&M University
College Station, TX 77843
22
Introduction
Population Growth Over Time in China and the U.S.
Fertility Transitions in China and the U.S.
Aged Dependency in China and the U.S.
Age Dependency RatiosParent Support Ratios
Implications for China
33
China is the largest country in the world, with an estimated population size in 2004 of 1,298,848,000.
The United States is the third largest country in the world (after China and India) with a population in 2004 of 293,028,000

44
In the world in 2000, there were over 606 million older persons (60 years and older), and over 69 million oldest old (80 years and older).
Of the world’s older population in the year 2000, over 21 percent of them (or almost 129 million) live in China.
Almost 8 percent (or almost 46 million) of the world’s older population live in the U.S. in 2000.

55
Table 1. Total Population, Older Table 1. Total Population, Older Population, and Oldest Old Population: Population, and Oldest Old Population:
World, China, and the U.S., 2000 to 2050World, China, and the U.S., 2000 to 2050
Year Total Older Oldest Old2000 6,070,581,000 606,424,000 69,098,000
2010 6,830,283,000 759,750,000 102,875,000
2020 7,540,237,000 1,021,976,000 137,752,000
2030 8,130,149,000 1,348,294,000 188,623,000
2040 8,593,591,000 1,630,891,000 278,330,000
2050 8,918,724,000 1,907,249,000 377,270,000
Year Total Older Oldest Old2000 1,275,217,000 128,753,000 11,397,000
2010 1,364,876,000 167,329,000 18,171,000
2020 1,429,473,000 240,602,000 26,510,000
2030 1,450,521,000 342,299,000 39,335,000
2040 1,438,934,000 396,664,000 63,804,000
2050 1,395,182,000 418,232,000 97,698,000
Year Total Older Oldest Old2000 285,000,000 45,928,000 9,079,0002010 314,924,000 56,933,000 11,627,0002020 344,272,000 75,708,000 12,910,0002030 370,397,000 90,516,000 18,424,0002040 391,359,000 97,038,000 26,241,0002050 408,694,000 104,088,000 29,355,000
World
China
U.S.
66
If the older population of China in the
year of 2000 were a single country it
would be the eighth largest country in
the world, outnumbered only by the non-
elderly population of China (1.1 billion),
and the populations of India (almost 1.1
billion), the United States (285 million),
Indonesia (212 million), Brazil (172
million), Russia (146 million), and
Pakistan (143 million) .

77
Of the 69 million oldest old in the world in 2000, over 16 percent (or about 11.4 million) live in China.
Of the 69 million oldest old in the world in 2000, 13.1 percent (or 9 million) reside in the United States.
88
China and the U.S. experienced in the 1960s and 1970s very dramatic fertility declines.
These transitions have produced, and will continue to produce, unprecedented increases in the older populations of the two countries.
99
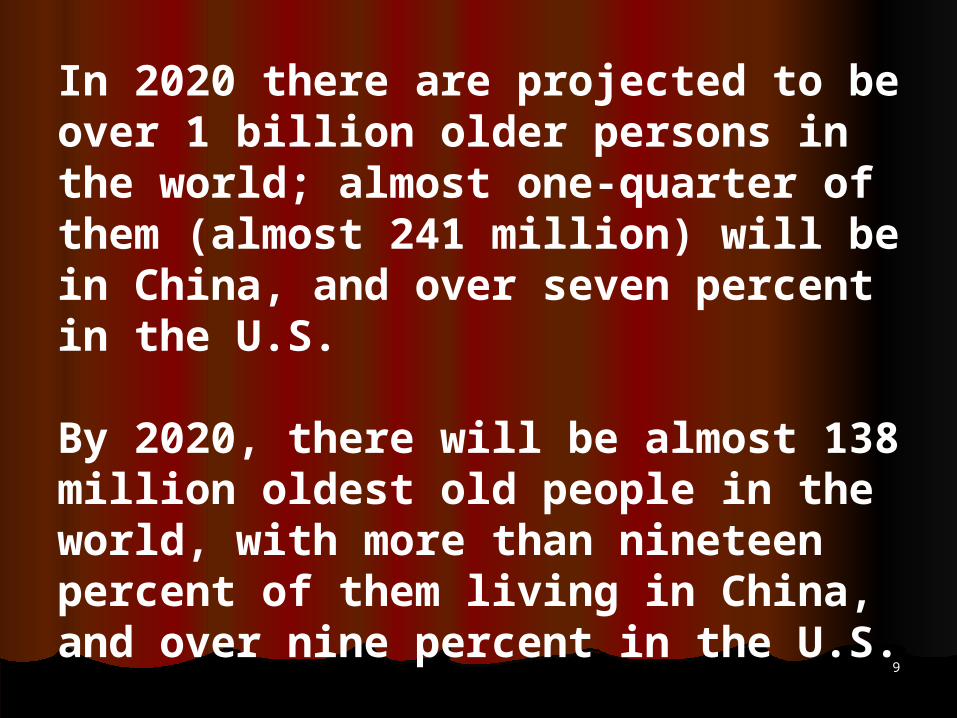
In 2020 there are projected to be over 1 billion older persons in the world; almost one-quarter of them (almost 241 million) will be in China, and over seven percent in the U.S.
By 2020, there will be almost 138 million oldest old people in the world, with more than nineteen percent of them living in China, and over nine percent in the U.S.

1010
By the mid-way point of this new century (in 2050), there are projected to be nearly two billion older persons in the world out of a total population of 8.9 billion.
Of these almost two billion older persons, 418 million of them (nearly 22 percent) will be residing in China, and 104 million (more than 5 percent) in the U.S.

1111
The projected number of 418 million older persons in China in 2050 is a remarkably large number.
The number of older persons alive in the world in 2000 (606 million) is only 188 million more than the total number of older persons projected to be living in China in 2050 (418 million).

1212
In the world in 2050, there are projected to be over 377 million oldest old people, with almost 26 percent (98 million) living in China, and nearly 8 percent (29 million) living in the U.S.
The almost 98 million oldest old projected to be living in China in 2050 is more than 1.4 times larger than the total number of 69 million oldest old living in the entire world in 2000.

1313
Most of China’s tremendous increases in the last half of the last century occurred between 1950 and 1980 and were due to imbalances between mortality and fertility.
China introduced fertility control programs in the 1970s causing the birth rate to plummet to below replacement levels in the 1990s.
This very rapid fertility reduction is the main cause of the unprecedented numbers of elderly people projected for China for the decades of the 21st century.

1414
Chinese population growth and declines over the almost twenty centuries since the time of Christ have almost always been associated with dynastic growth and decay.
The beginning of a new dynasty was followed by a period of peace and order, cultural development and population growth.
As population density increased, it often exceeded the availability of food and the struggle for existence was intensified. Then there would come a period of pestilence and famine and a consequent reduction in the size of the population.
1515
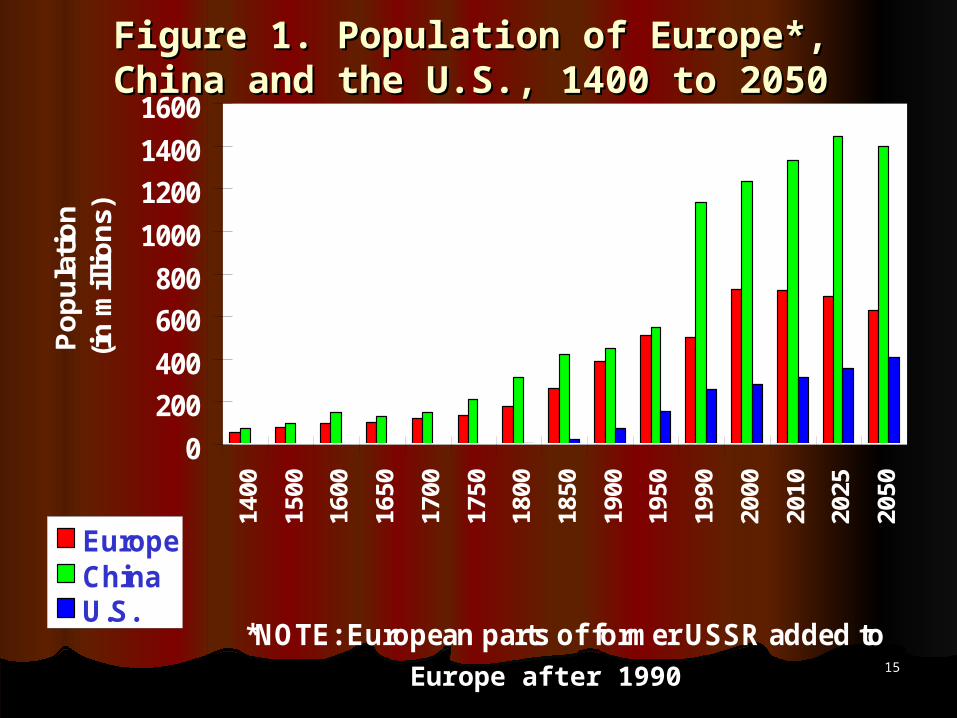
Figure 1. Population of Europe*, China Figure 1. Population of Europe*, China and the U.S., 1400 to 2050and the U.S., 1400 to 2050
0
200
400
600
800
1000
1200
1400
1600
1400
1500
1600
1650
1700
1750
1800
1850
1900
1950
1990
2000
2010
2025
2050
*NOTE: European parts of former USSR added to
Po
pu
lati
on
(i
n m
illio
ns)
EuropeChinaU.S.
Europe after 1990
1616
For all the dynasties up until China’s last dynasty, the Qing (1644-1911), China’s population swayed roughly with the rise and fall of a dynasty (most dynasties reigned for about 200-300 years).
The population grew at the initial years of the dynasty, but rarely exceeded 80 million. Population size would then fall so that one-third or sometimes one-half of the original population was decimated. Mortality then was too high to allow much of an increase in population.

China's Population Growth, A.D. 0 - 2050
Between A.D. 0 to 2000, China has grown from 60 million to nearly 1.3 billion.
1818
From 1400 to 1500, the size of the Chinese population did not change appreciably, growing only by 25 million.
It grew by another 50 million from 1500 to 1600

1919
Since the mid-1700s after the establishment of the Qing Dynasty, there were ever so slight reductions in mortality so that the population kept growing beyond the old limit of about 80 million.
The Qing was the first dynasty to bring about and to maintain a population size much above 100 million.
By 1850 there were over 420 million people in the country, six to eight times the traditional level (of 60-80 million) that was the demographic norm 200 years or so previously.

2020
The Qing was the only dynasty to live up to the perpetual Chinese ideal of “numerous descendants.”
It is ironic that by achieving this ideal, not only was the Qing wiped out, but China’s dynastic system of almost four thousand years was eradicated.
Previously, declines in population resulted in the collapse of the dynasties. The Qing fell in 1911 because the population became too large.
2121
When Mao Zedong and the Chinese Communists took over the country in 1949, the population numbered about 550 million, a figure 30 percent higher than 100 years earlier.
This figure of 550 million was about 10 times larger than China’s historical equilibrium population of around 60 million.
2222
Between 1950 and 1980, China added about another 433 million to its population (see Figure 2).
China’s population size of near 1.3 billion in 2000 is almost 10 times the size of the mid-17th century population of around 130 million.
2323
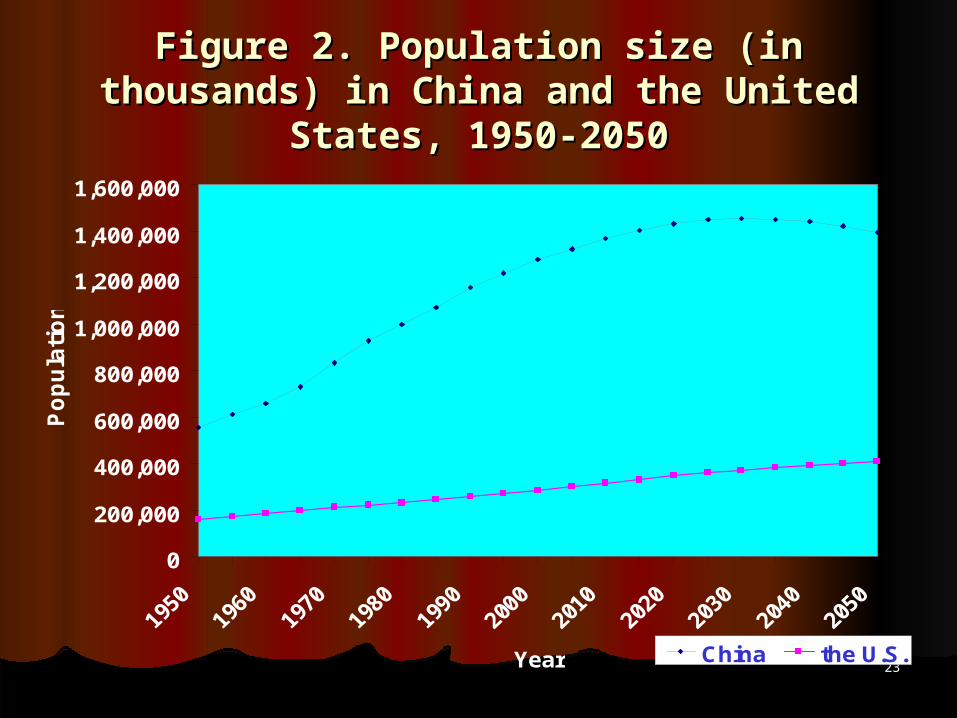
Figure 2. Population size (in thousands) Figure 2. Population size (in thousands) in China and the United States, 1950-in China and the United States, 1950-
20502050
0
200,000
400,000
600,000
800,000
1,000,000
1,200,000
1,400,000
1,600,000
Year
Po
pu
lati
on
China the U.S.

2424
Here is another comparison. In the 300 years from 1650 to 1950, the average annual increase of China’s population was around 1.5 to 1.6 million; this is 80-100 times greater than the annual increases in China before 1650. Since 1949, the average annual increase in population climbed to around 14 million per year. In the 1960s -– the high growth years –- average annual increase was as high as 22 million. Even with the reduction of the birth rate in the 1970s, the average annual population increases have been around 10 million.
2525
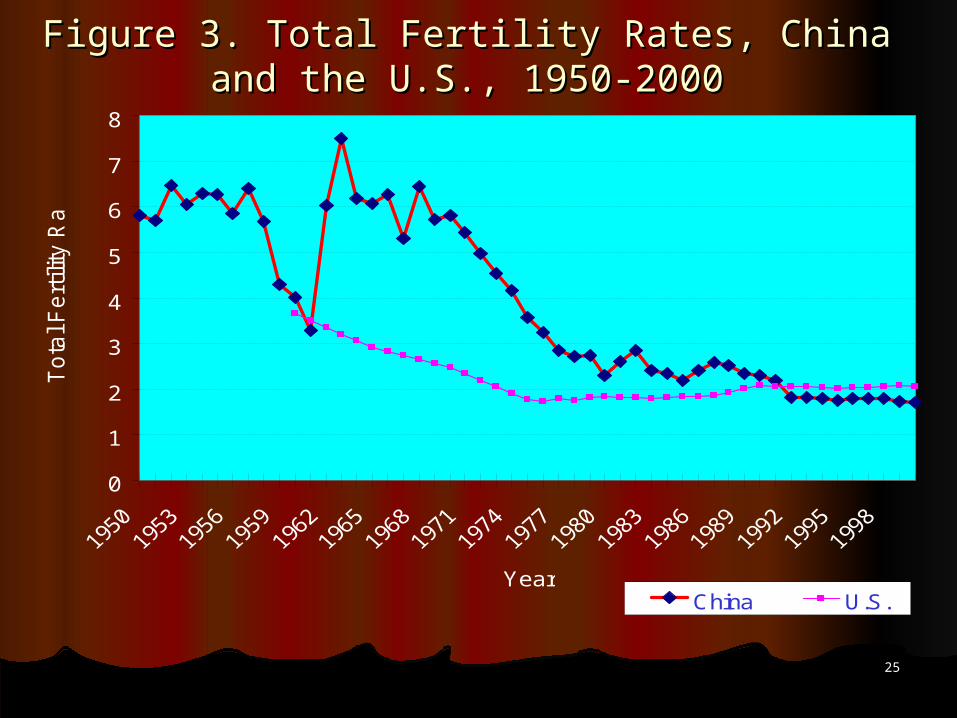
Figure 3. Total Fertility Rates, China and the Figure 3. Total Fertility Rates, China and the U.S., 1950-2000U.S., 1950-2000
0
1
2
3
4
5
6
7
8
Year
To
tal F
ert
ility
Ra
te
China U.S.

2626
In ancient China, an increase of 14 to 22 million people would took 700 to 1000 years.
In China in the 1960s, 1970s, and 1980s, a population increase of between 14 and 22 million occurred almost every year.

2727
Population size in China is projected to start tapering off in the second decade of this new century at about 1.4 billion.
The United Nations projects that China will reach its largest population size of about 1.45 billion in 2030, and will then begin to decline in size, falling back to almost 1.4 billion in the year 2050.

2828
The U.S. grew rapidly from 3.9 million in 1790 to 31.4 million in 1860. The population increased approximately 30 percent per decade from 1790 to 1860, which was amazing considering that the growth rate in Europe at the same time was less than half as large.
The numbers of the U.S. population more than quadrupled from 1800 to 1850, more than tripled from 1850 to 1900, and then almost doubled from 1900 to 1950. In 1950, the U.S. population exceeded 150 million.

2929
The main reasons for the fast increase of the U.S. population between 1790 and 1860 were high fertility rates, land availability and annexation, and immigration. Population growth was associated with increases in national territory.
The land area of the United States in 1790 comprised 889,000 square miles. The Louisiana Purchase in 1803 nearly doubled this territory. The accession of Florida in 1819 added still more land. Between 1840 and 1850, the territory of the United States was increased by two-thirds through the annexation of Texas in 1845, Oregon in 1846 and the cession by Mexico in 1848. The addition of these new states brought with them vast increases in the numbers of people.
3030
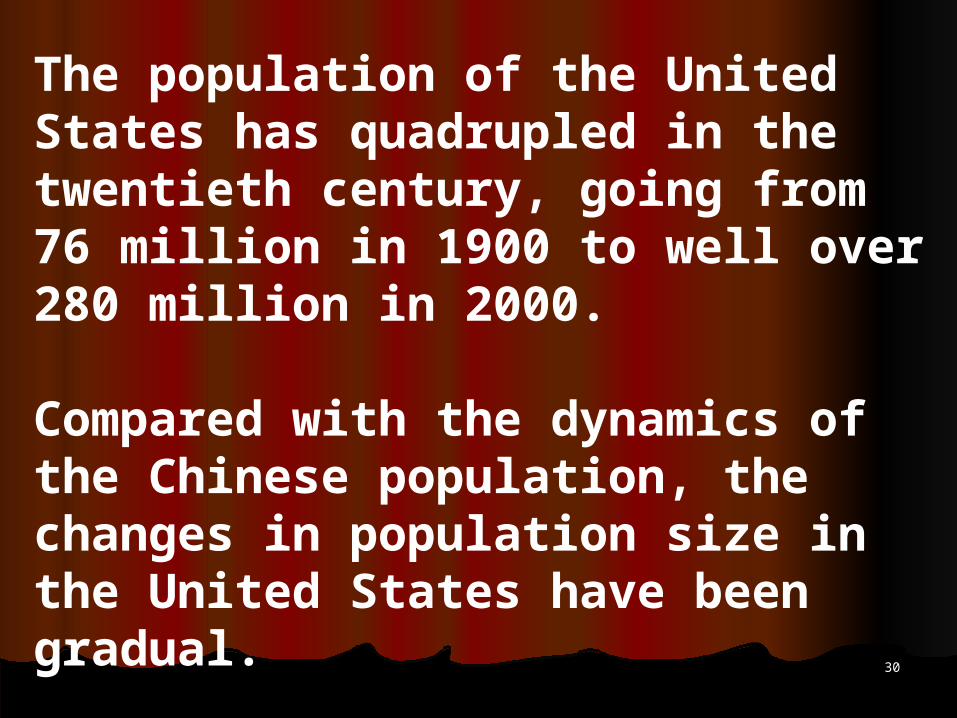
The population of the United States has quadrupled in the twentieth century, going from 76 million in 1900 to well over 280 million in 2000.
Compared with the dynamics of the Chinese population, the changes in population size in the United States have been gradual.
3131
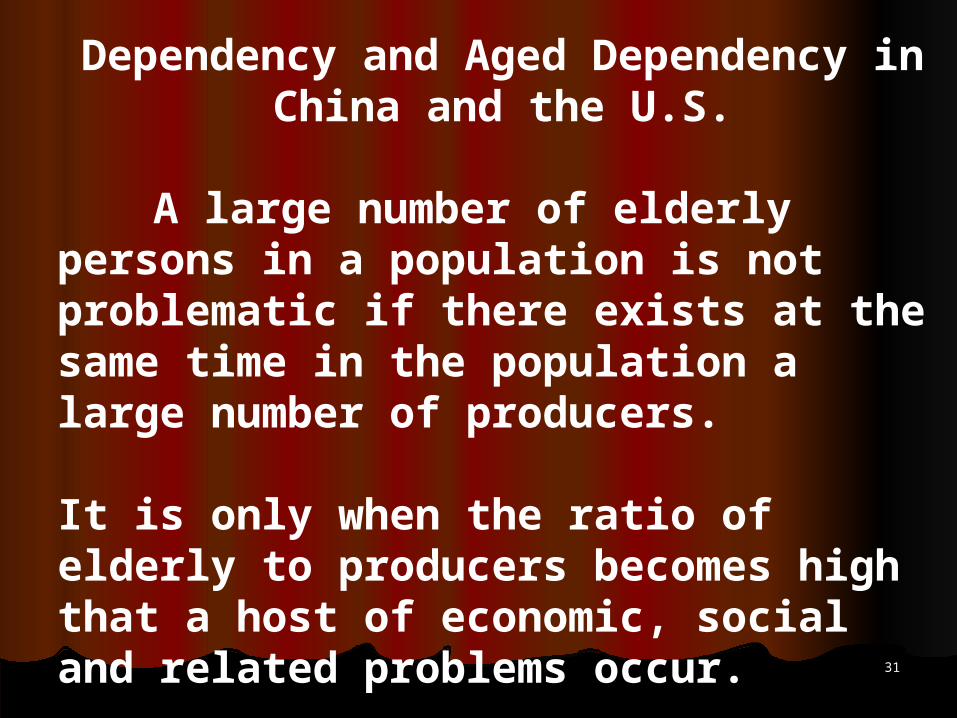
Dependency and Aged Dependency in China and the U.S.
A large number of elderly persons in a population is not problematic if there exists at the same time in the population a large number of producers.
It is only when the ratio of elderly to producers becomes high that a host of economic, social and related problems occur.

3232
Dependency in the population is measured using the ratio of persons aged 0-14 and persons aged 65 and over to persons aged 15-64.
The numerator consists of persons who typically are not employed, hence not serving actively as producers of goods, material resources and sustenance.
The denominator, persons aged 15-64, contains the productive members of the population, many of whom are in the labor force, all of whom, in varying ways, are producing foodstuffs, and related goods and services for the population; this ratio is multiplied by 100 and refers to the number of dependents in the population per 100 producers.
3333
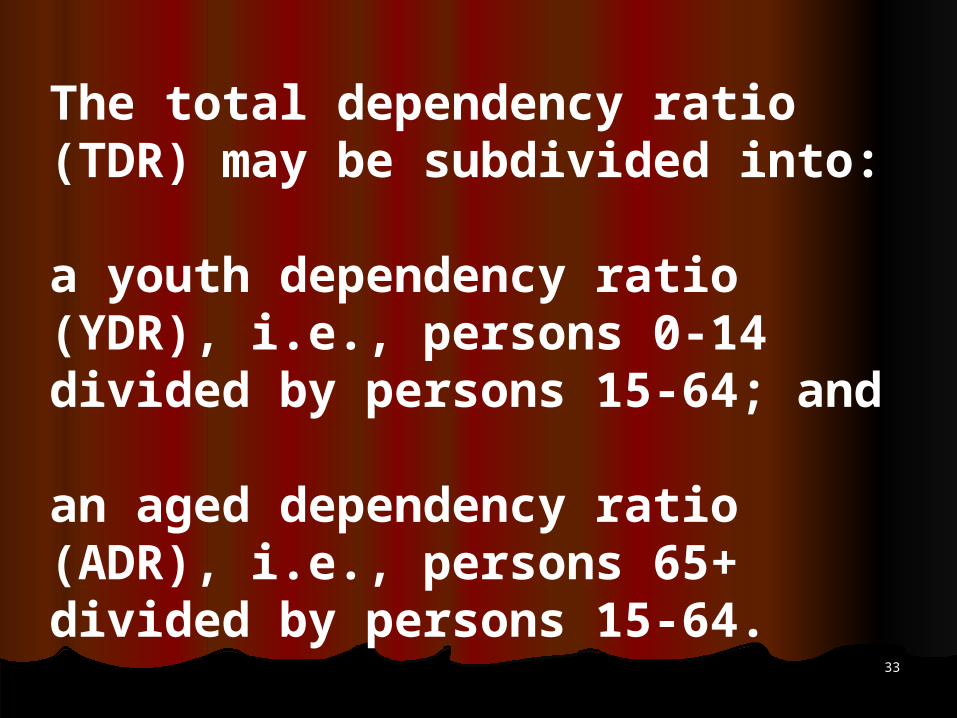
The total dependency ratio (TDR) may be subdivided into:
a youth dependency ratio (YDR), i.e., persons 0-14 divided by persons 15-64; and
an aged dependency ratio (ADR), i.e., persons 65+ divided by persons 15-64.

3434
Figure 4. Youth Dependency Ratios, Figure 4. Youth Dependency Ratios, China and the U.S., 1950-2050China and the U.S., 1950-2050
0
10
20
30
40
50
60
70
80
Year
YD
R
China the U.S.

3535
Figure 5. Aged Dependency Ratios, Figure 5. Aged Dependency Ratios, China and the U.S., 1950-2050China and the U.S., 1950-2050
0
5
10
15
20
25
30
35
40
Year
AD
R
China U.S.
3636
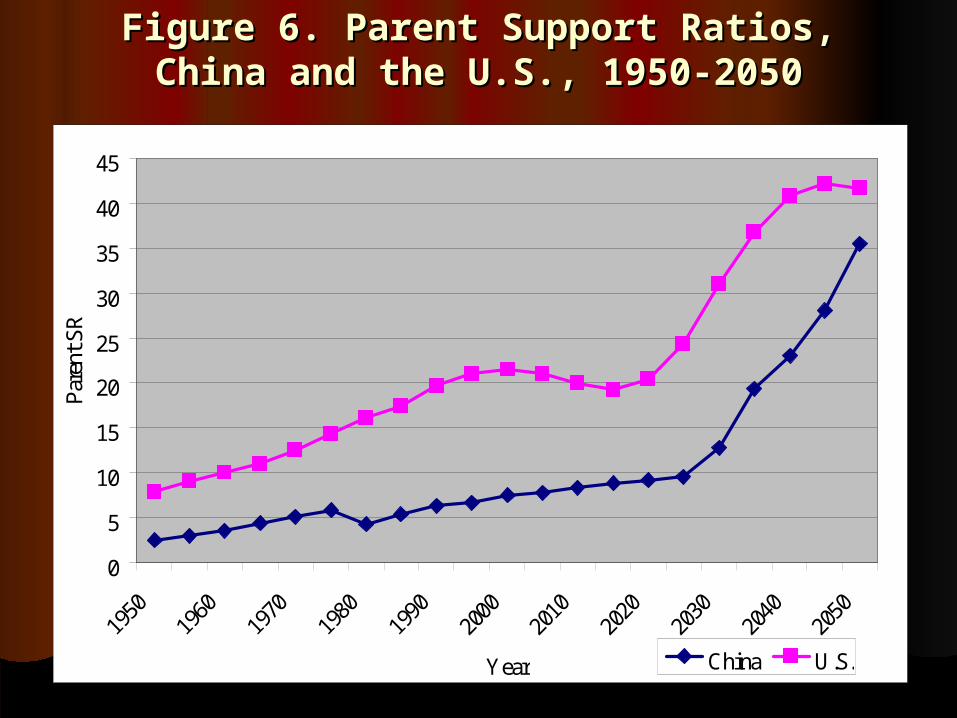
Figure 6. Parent Support Ratios, China Figure 6. Parent Support Ratios, China and the U.S., 1950-2050and the U.S., 1950-2050
0
5
10
15
20
25
30
35
40
45
Year
Par
ent S
R
China U.S.

3737
End of Presentation