1 | P a g e · 4.1 The Shire’s External Environment ... • Avon, with the town of Northam as its...
41
1 | Page
-
Upload
vuongnguyet -
Category
Documents
-
view
213 -
download
0
Transcript of 1 | P a g e · 4.1 The Shire’s External Environment ... • Avon, with the town of Northam as its...

1 | P a g e

2 | P a g e
CONTENTS
1.Executive Summary................................................................................................................................................................................. 4
2. Purpose .................................................................................................................................................................................................. 4
3. Integrated Workforce Planning ............................................................................................................................................................... 5
3.1 Integrated Planning and Reporting Framework ............................................................................................................................... 5
3.2 Aims of the Integrated Workforce Plan ............................................................................................................................................ 6
4. The Wheatbelt Region ............................................................................................................................................................................ 6
4.1 The Shire’s External Environment ................................................................................................................................................... 8
4.2 WA Local Government Environment ............................................................................................................................................... 9
4.3 Regional Planning Focus ................................................................................................................................................................. 9
4.4 Regional Environment Relative to Workforce Planning ................................................................................................................. 10
4.5 Demographics of the Shire of Yilgarn ............................................................................................................................................ 11
5. The Shire’s Internal Environment ......................................................................................................................................................... 12
5.1 Governance and Management ...................................................................................................................................................... 12
5.2 Current Organisational Structure ................................................................................................................................................... 12
5.3 Workforce Profile as at April 2013 ................................................................................................................................................. 14
5.4 Recruitment and Retention History ................................................................................................................................................ 16
5.5 Workforce Costs ............................................................................................................................................................................ 16
5.6 Human Resource Management ..................................................................................................................................................... 17
5.7 Organisational Development ......................................................................................................................................................... 17
5.8 Current Workforce Risk Profile ...................................................................................................................................................... 20
5.9 Organisational Capacity and Capability ......................................................................................................................................... 20
6.0 Workforce Implications (operatIonal) from the Strategic Community Plan ......................................................................................... 22
6.1 Operational Functions and Services - Changes / Growth.............................................................................................................. 23
7. Strategies to meet future workforce needs – Non operational ............................................................................................................. 25
7.1 Summary of Issues and Gaps – Non Operational ......................................................................................................................... 26
7.2 Organisational Structural Implications ........................................................................................................................................... 28
8. Integrated Workforce Plan – Action Plan and Timelines: ..................................................................................................................... 30
9. Workforce Costs and Budget Implications............................................................................................................................................ 37
10. Implementing the Workforce Plan ...................................................................................................................................................... 39

3 | P a g e
11. Change Management ......................................................................................................................................................................... 40
12. Monitoring and Evaluation of Outcomes............................................................................................................................................. 40

4 | P a g e
1. EXECUTIVE SUMMARY
The Shire is a significant employer within the Local Government Area, employing 50 people in full time, part time and
casual positions. Barriers to attracting and retaining skilled staff, in addition to the Shire of Yilgarn being classified as
a remote community continue to hinder the organisation’s ability to secure professional, specialist and technical
expertise across a broad range of services and activities.
Optimising the Shire’s full economic and social potential will be a challenge as the region is facing increased
challenges associated with ensuring the availability and accessibility of a flexible and skilled workforce. Key issues
that are affecting workforce capacity and capability include:
Economic growth and seasonal productivity
Employment demand and required skills
Inter-regional migration
An ageing workforce; and
Changes in the nature of education and training
For the Shire to remain sustainable and competitive in a shrinking and vulnerable labour market it must continue to
identify, understand and improve upon its organisational workplace attributes and the contribution that it makes to the
local government area, the region and equally as importantly, to the staff that deliver the services, programs and
projects to their community.
The Shire values its workforce and through the development of the revised Community Strategic Plan 2013-2023, the
Integrated Workforce Plan is a tangible commitment to developing its workforce and ensuring that the right people
are in the right place at the right time.
“staff are happy in their work environments, providing excellent communication and customer service to all
ratepayers and community members” Community Strategic Plan 2013-2023.
The Strategic Community Plan has also highlighted key outcomes and expectations in relation to governance and the
role of Council. Through the Integrated Workforce Plan, skills, experience and knowledge required of Councillors to
support the vision of the community are also addressed to ensure a holistic and strategic approach is achieved.
The Integrated Workforce Plan 2013 – 2017 has highlighted key risk areas and challenges and the need to ensure
regular and continuous analysis and action occurs to mitigate workforce risk and interruption to service delivery.
Workplace culture plays a big part in this challenge and through a structured and well managed strategy, the Shire
will ensure that a confident, skilled, professional and accountable workforce will be sustained long into the future.
The Integrated Workforce Plan is one of continuous improvement and long term commitment. The Shire does not
have the discretionary funds or capacity to resolve and address all challenges immediately, many of which are
outside the organisations ability to control or influence i.e. resource development. What the Shire can influence
though is a united and clear community vision, strong Council leadership and effective management and a long term
commitment to its greatest asset – its people, who will continue to develop, thrive and deliver. PURPOSE
The purpose of this document is to develop and implement a structure, systems and processes for workforce
planning that will be implemented across all aspects of the Shire’s planning activities, operations and service
delivery. This integrated approach to workforce planning will ensure the Shire of Yilgarn recruits, retains and
manages the human resource requirements needed to meet the strategic and operational objectives of the Shire, its
community and the organisation.

5 | P a g e
2. INTEGRATED WORKFORCE PLANNING
The workforce plan has been developed to address the requirements of the Local Government Act 1995 section
S5.56 (1) A “plan for the future” and Regulations S5.56(2):
That Local Governments develop a Strategic Community Plan that links community aspirations with the Council’s
long term strategy.
That the Local Government has a corporate business plan linking to long term financial planning that integrates asset
management, workforce planning and specific council plans (Informing Strategies) with the strategic plan.
Regulation changes were gazetted in August 2011 with full compliance required by 30 June 2013.
3.1 Integrated Planning and Reporting Framework
The Shire’s planning framework reflects that of the Department for Local Government (refer Diagram 1.) and
comprises of the following:
Strategic Community Plan – identifies the community’s main aspirations and priorities for the future and outlines
strategies for achieving these goals
Corporate Plan – describes the activities that will be
undertaken over the next four years to achieve the
agreed short and long term goals and outcomes.
Long Term Financial Plan (LTFP) – details the financial
resources needed to enact the corporate plan in the first
four years and potential revenue and expenses for the
next six years of the plan. This plan serves to inform
and resource all aspects of the integrated planning
activities as appropriate.
Asset Management Plan (AMP) – This plan identifies
and records the asset register, service level, activities
and strategies to ensure the physical assets and
infrastructure of the Shire are appropriately managed
and maintained over their lifecycle, and appropriately
disposed of or replaced at the end of that lifecycle.
Integrated Workforce Plan (WFP) – This plan identifies and reports on the internal capacity to meet current and
future needs of the goals and objectives of the Shire and the Community, both in capacity and capability.
It identifies the gaps or surplus in human, asset or financial resources and identifies strategies to ensure that the right
people are in the right place at the right time to deliver on expectations.
Diagram 1: DLG Integrated Planning and Reporting
Framework.

6 | P a g e
3.2 Aims of the Integrated Workforce Plan
As outlined above, the workforce plan aims to address the workforce needs of the Shire that arise from core function
operations, projects, strategic initiatives and priorities. It also aims to build capacity and resilience to allow the Shire
to respond to the changing environment and issues arising from external pressures and legislative compliance
issues.
The Workforce Plan aims to ensure the Shire’s workforce has the right skills, at the right time and in the right
quantities to ensure sustainable service delivery in the future. It will address gaps between current and future
workforce capability, identify areas of skills or capacity shortage, and outline strategies to address them. This
information will inform the LTFP and the AMP to ensure the financial and physical resources of the workforce plan
are included in those plans and planning activities.
Diagram 2: The 4 Stages of Integrated Workforce Planning
3. THE WHEATBELT REGION
The Wheatbelt region is situated in the south west of Western Australia and comprises an area of 154,862 square
kilometres, extending out to the north, east and south east of the Perth metropolitan area. The region is home to
72,856 people (2011 ABS census) making it the third most populous region in the State (refer Diagram 3).
The population of the Wheatbelt is dispersed over 43 Shires and approximately 160 towns and smaller settlements.
The Wheatbelt is divided in to four distinct but inter-connected sub regions each of which is serviced by a regional
centre. The four sub regions are:
• Avon, with the town of Northam as its commercial centre;
• Central Coastal and Central Midlands to the north, with Moora as its commercial centre;
• Central East, with Merredin as its commercial centre; and
• Central South, with Narrogin as its commercial centre
The Wheatbelt is a large, diverse region encompassing a range of environments, social and economic
characteristics. Opportunities and constraints differ greatly across the region, especially when comparing regions
supported by different industries, such as agricultural towns in the inner Wheatbelt with coastal cray-fishing towns.
Within the Central East sub-region is the Shire of Yilgarn which is 30,720 square km in area and has a population of
approximately 1,636. Yilgarn is known by many as the Gateway to the Wheatbelt and the Goldfields. Southern Cross
is the major town centre of the Shire of Yilgarn and is 370km east of Perth along the Great Eastern Highway.
Methodology:
The methodology used will follow the
practices and principles of the WA
Department of Local Government’s
Workforce Planning Guidelines Toolkit.
There are four distinct stages as
outlined in Diagram 2 from the toolkit.

7 | P a g e
Other townsites in the Shire include Bodallin, Bullfinch, Ghooli, Koolyanobbing, Marvel Loch, Moorine Rock and
Yellowdine. The main service centre closest to Yilgarn is Merredin.
As previously mentioned, the Wheatbelt is the Gateway to the Goldfields and as a result of the close proximity to
resource development, the Shire has a large population of residents who fly in and fly out of the region (FIFO) to
work off site in mines and associated services. This contingency of FIFO workers hovers around 1,700 and has a
significant impact upon the region including the provision of health services to mines, a safe and effective transport
network to support the sector and light commercial industry.
Diagram 3. Central-East Region.
Industry:
The Wheatbelt is so called because of its extensive agricultural industry. The region is the primary producer of cereal
crops in the state and produces other agricultural products such as canola, olives, vegetables, wine grapes, honey,
citrus fruits and livestock. Whilst agriculture remains the dominant industry, the economy of the region is also
supported by mining, commerce, retail, manufacturing, fishing and tourism.
Gold, gypsum, salt and iron are mined, while grain, wool, sheep, cattle and pigs are the focus of the rural industry.
The co-existence of mining and agriculture has balanced the Yilgarn economy, with the two activities supplementing
and complementing each other through their respective boom and bust cycles. Construction activities are mainly
focused on supporting mining and new infrastructure development and re-developments.
8 | P a g e
Key economic drivers impacting upon the region include its ability as a region to meet food demands globally,
transport and logistical requirements and an ageing population.
The Wheatbelt is positioned as a regional manufacturing and logistics hub and boasts affordable and quality housing.
Key economic opportunities for the region include broad acre agriculture, transport and industry, professional
services including health and aged care, retail and lifestyle and tourism.
4.1 The Shire’s External Environment
General Employment Environment:
2013 Economic Profile¹ states that Western Australia has 33% of Australia’s land area and 10.7% of its population.
The State’s share of the national population is projected by the ABS to grow to 11% (3.0 million) by 2026 and 12%
(4.3 million) by 2056. There were 1.31 million people employed in Western Australia in December 2012. The
Department of Training and Workforce Development estimates a potential shortfall of 76,000 workers by 2014-15.
Western Australia’s population rose 3.3% (78,037) to 2,430,252 in 2011-12. Net overseas migration contributed 60%
(47,147) of the population growth in 2011-12. Net interstate migration rose 80% to 11,085 in 2011-12. Population
growth has accelerated from 2.2% in 2009-10 and 2.4% in 2010-11 to 3.3% in 2011-12.
Western Australia’s employment rose 4.7% (59,400) over the twelve months to December 2012, with 9% of the
growth occurring in the latter three months. Australia’s employment rose 1.3% (148,400) over the year to December
2012. The State’s unemployment rate was 4.3% in December 2012; higher than the 4.1% in the previous month and
4.2% a year earlier. Australia’s unemployment rate was 5.4% Western Australia’s mining industry employed 108,900
workers directly in the December quarter 2012, 3% (3,600) more than a year earlier.
Table 1: Wheatbelt Regional Profile
Regional Labour Markets²and Population³ Region Employed Unemployed Unemployment
rate % Population Annual
Growth
Perth 997,444 39637 4.0 1726055 2.5
South West 8742 4137 4.6 158615 1.6
Peel 46673 2670 5.4 112677 4.4
Wheatbelt 44601 1100 2.4 72856 0.0
Goldfields-Esperance
35594 788 2.2 59489 1.1
Great Southern 32354 1656 4.9 56884 0.2
Mid-West 30407 817 2.6 55609 1.2
Pilbara 27477 607 2.2 62736 6.5
Kimberley 17532 931 5.0 37673 2.9
Gascoyne 5912 192 3.1 9621 1.1 ¹ Western Australian Government Department of State Development: Western Australian Economic Profile January 2013
²September quarter 2012.
³ 2010 – 11: Source Department of Education, Employment, and Workforce Relations Small Area Labour Markets and ABS Regional Population
Growth.
The 2011 ABS Census of Population and Housing records a labour workforce of 1,438 in the Shire of Yilgarn comprising of 1,053 males and 385 females across eighteen (18) main industries. Refer Table 2. for industry breakdown.

9 | P a g e
Table 2: Main Industry Employers – Shire of Yilgarn 2011.
INDUSTRY YILGARN 2011 YILGARN 2006
Agriculture, forestry and fishing 165 223
Mining 496 316
Manufacturing 28 20
Electricity, gas and water supply 11 10
Construction 343 35
Wholesale Trade 12 16
Retail Trade 60 44
Accommodation, cafes and restaurants 74 53
Transport, postal and warehousing 46 52
Communication Services 3 0
Finance and Insurance 7 16
Property and Business Services 0 0
Education and Training 48 42
Public Administration and Safety 37 39
Administration and Support Services 20 12
Health and Community Services 30 36
Professional, Scientific and Technical 8 14
Cultural and Recreational Services 3 0
Other Services 38 22
Inadequately described 9
TOTAL BUSINESSES 1,438 1064
4.2 WA Local Government Environment
The Department of Local Government is in the process of managing significant structural reform across the sector
that includes seeking amalgamation and collaborative resource sharing where possible and practical to ensure
sustainability and build for the future. Both the metropolitan and regional areas are experiencing change and
uncertainty that has potential to impact upon the workforce both positively and negatively in being an industry of
choice for employment.
Increasing workloads, exit of skilled staff to other employment sectors, ageing workforces and the levels of staff
turnover in some areas of the workforce are creating serious challenges in recruitment and retention as well as the
wellbeing of the employees. Increased service expectations and devolution of services from State Government in
some areas is also having an impact on the ability to attract, recruit and remunerate the appropriate workforce.
4.3 Regional Planning Focus
Due to the dynamic nature of the Wheatbelt region and its significant economic contribution to the State’s GDP,
numerous studies and planning activities have been undertaken recently addressing the current economic, social
and environmental standing and future state. One such planning report, Regional Development Australia Wheatbelt
Strategic Regional Plan 2010-2015 (2012 Revision), outlines three key areas of focus that flags regional issues and
challenges.
These areas are outlined below and include the need to address workforce skills, shortfalls and the transient nature
of workers.

10 | P a g e
1. Vibrant Economy
1.1. Attracting and retained skilled workers of all ages to meet state and regional needs.
1.2. Continuing to build upon the regions diversified economic base to ensure resilience.
1.3. Building capacity and capability within existing residents skill base – growing your own.
1.4. Strategic focus on identifying and maintaining key assets and opportunities for new infrastructure.
2. Liveable Communities
2.1. Communities are innovative, connected and value diversity
2.2. Professional services and agencies and other relevant stakeholders are collaborative, integrated and
strategic.
2.3. Cultural, recreational and sporting activities are aligned to community well-being outcomes.
2.4. Community safety, lifestyle and employment opportunities are enhanced by the community amenity.
3. Valued Natural Amenity
3.1. Climate change opportunities are pursed and risk minimised
3.2. Protect biodiversity and natural assets
3.3. Water management is improved
In 2012, the Department of Training and Workforce Development released a report titled Wheatbelt Workforce
Development Plan 2013 – 2016 which targets current and future demand for workforce skills, workforce gaps and
proposed future strategies to develop the Wheatbelt workforce. This report was developed in the context of the
Department’s Skilling WA – A Workforce Development Plan for WA.
Other areas driving regional planning is agriculture and farming. Due to poor seasonal farming conditions, low yields
and financial obligations, the WA State Government has recently announced the availability of aid packages for
struggling farmers (primarily in the eastern Wheatbelt). Farmers facing financial hardship in the eastern Wheatbelt
region have been offered the emergency aid package, providing grants of up to $25,000 for up to 400 farmers to
assist with immediate pressures such as creditors and household requirements, social support and counselling.
Although there are a significant number of farming properties for sale in the region in addition to some farmers within
the Shire of Yilgarn being affected, staff believe the community will be able to manage the current challenges and
being accustomed to cyclical farming conditions, are expecting the community to be resourceful and resilient in this
tough financial climate. One indication of this resilience is the outstanding Shire rates recovery percentage which is
at an acceptable industry level of 0.71% ($33K).
4.4 Regional Environment Relative to Workforce Planning
Optimising the Shire’s full economic and social potential will be a challenge as the region is facing increased
challenges associated with ensuring the availability and accessibility of a flexible and skilled workforce. Key issues
affecting workforce capacity and capability include¹:
Economic growth and seasonal productivity
Employment demand and required skills
Inter-regional migration
An ageing workforce; and
Changes in the nature of education and training

11 | P a g e
Labour force projections however indicate that many sub-regions in the Wheatbelt are likely to experience an
increase in labour demand in the short to medium term with an annual average growth rate to the year 2026
projected at 0.8% compared to the average of 2.0% for Western Australia. Projected growth within the Central East
sub-region is likely to be in the resource sector, particularly Yilgarn, while growth in the remaining areas will be very
slow¹(¹ Department of Training and Workforce Development – Wheatbelt Workforce Development Plan 2013 – 2016).
With significant major Wheatbelt projects already commenced and proposed for the region ranging from highway to
health and education services redevelopment, the impact to the current workforce and regional skill base will be felt
and will escalate the need to address supply and demand requirements. The out-migration of youth to other areas
and the transient nature of the Wheatbelt workforce will also exacerbate the situation.
As outlined above, increasing workloads; exit of skilled staff to other employment sectors (specifically mining); ageing
population and workforce; the pending wave of retirement; lack of capacity to meet demand; and the levels of staff
turnover in some areas are key factors affecting the Shire’s current and future workforce requirements and also that
of the region. As demand increases for professional services, mining and construction and the need to meet global
food demand, developing flexible, skilled and stable workforces across the region is a significant challenge.
4.5 Demographics of the Shire of Yilgarn
Following is a summary of the Yilgarn profile (ABS Census data as at 2010: National Regional Profile LGA59660
unless otherwise referenced):
Estimated residential population is 1,558.
Between the periods of 2001 and 2009, Yilgarn experienced a decline in the growth rate -1.9%² which appears
to have stabilised with the recent ABS data results supporting this.
Aboriginal and Torres Strait Islander people 50 (3.2%).
Males 868 (55.7%) and females 690 (44.3%)
Children aged 0 – 14 21.7% , 15 years to 34 years 19.9% 33 – 54 33.3%, 55 – 64 13%, >65 – 12.1%.
Approximate employment rates are 73% fulltime, 18% part time and 3% unemployed ³
Coupled families with two incomes – with children $1,694 and without children $1,926 ³.
Private dwellings were 39.8% (109) owned outright (29.5% WA), 21.4% were owned with a mortgage (37.8%
WA) and 34.0 were rented (29.2% WA) ³.
Top 3 occupations include Managers 31.3, machine operators and drivers 16.4%, Technicians and Trades
14.4%, Labourers 11.2%.
The four major industries of employment are: Mining (496 employees), Construction (343 employees),
Agriculture, forestry and fishing (165 employees); and Accommodation and Food Services (74 employees).
Median weekly income for people aged over 15 years is $945 (state median $662). Median weekly household
income $1118.
People with a post school qualification 38.6%
People who lived at a different address 1 year ago 22.5% and a different address 5 years ago 40.8%
¹Tonts, M, Davies, A and Haslam-McKenzie, F 2008. Regional Workforce Futures: An analysis of the Great Southern, SW and Wheatbelt Regions, Geowest No.
35, Institute for Regional Development, University of WA.
²ABS, 3218.0 Regional Population Growth: Commonwealth of Australia 2010.
³Census Quickstats 2011 All people – usual residents Yilgarn Code LGA59360
12 | P a g e
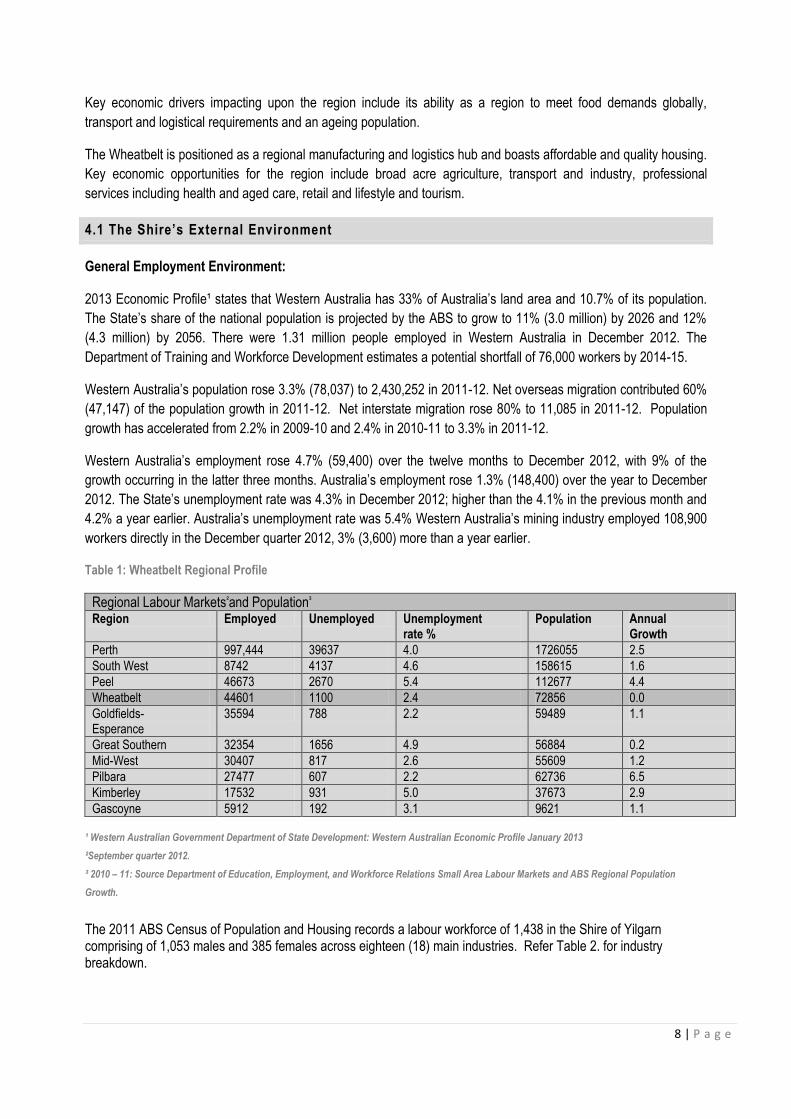
5. THE SHIRE’S INTERNAL ENVIRONMENT
Identifying and understanding the external issues and risks that impact upon the Shire is a critical step in planning for
the future. To further support the current and future context of workforce planning, the need to identify and consider
the internal or organisational environment that will also influence the way in which the Shire responds to workforce
planning also needs to be defined.
5.1 Governance and Management
The Shire is performing well in both government and management for a Shire of this size and location with systems
and processes continuing to evolve within the constraints of skills and resources. Community feedback through the
planning process indicates a general satisfaction with the performance of the Council and the Shire as a whole with a
concerted effort made by Council to seek input from the community at large, business and youth representatives.
Income from rates (rates distribution ratio) is approximately 51% which is within benchmarks set by government.
Reserves are utilised strategically with over $5m in cash backed reserves. The Shire has no borrowings or other
debts and recently completed construction of the new sporting complex ($2.6m) with no outstanding creditors. The
amount of State Government funding is on the increase reversing the trend over the previous years with the Financial
Assistance Grant and Royalties for Regions being the main contributor.
Primary areas of expenditure relate to transport infrastructure and maintenance of the road network which is to be
expected due to the locality of the Shire and its fundamental role in supporting the south eastern transport network.
There are no notable breeches of non-compliance across the Shire which is also supported by a rigid planning
schedule in place to achieve all legislative requirements under the Department of Local Government’s Integrated
Strategic Planning guidelines.
The reform agenda has now closed with no amalgamation with Shire of Westonia taking place. This was confirmed
mid 2012. A new CEO was appointed in August 2012 with one new Councillor appointed at the 2011 election.
Council is strong and stable with a wealth of knowledge and experience.
5.2 Current Organisational Structure
The Service Delivery Model:
The Shire of Yilgarn has a workforce of fifty (50) employees. No positions are shared with other Local Governments.
The Shire delivers a broad range of services and programs and is split into three divisions to facilitate service
provision with a fourth division supporting and enabling external delivery.
The Shire delivers external services which are front line or direct service delivery such as programs, projects, civil
works and day to operations through a workforce of 35 employees (70%).
Direct Service Delivery (front line services and internal services also referred to as back office services), are
delivered by a workforce of 15 (30%). This ratio of approximately 1:2.2 is acceptable with back : front office ratios
ranging from 1:2 to 1:4 across Australian operations with the latter primarily relating to sales environments. The Shire
utilises external contractors to undertake annual or one off projects such as asset management, strategic and
business planning. Contractors are procured to assist with civil works and are utilised on an as needs basis.
Although an acceptable ratio, it does present the organisation as lean and relying on the skills of staff and culture of
the organisation to ensure leave coverage and ‘back-up’ is adequate.

13 | P a g e
Diagram 4. Below outlines the internal services (back office) and direct service delivery (front line) model.
Diagram 4: Local Government Service Delivery Model.
Local Governments operate within considerable financial restraint and are required to deliver diverse services that at
times provide no or limited opportunities for achieving economies of scope or scale. Products and services are often
disparate with no commonality so efficiencies and productivity need to be sourced from the ‘back office’ or internal
operations, systems and processes. Diagram 5 below outlines the current organisation structure.
BACK OFFICE
Internal / Support
Human Resources
Finance and Grant submissions
IT and Records
Governance and Lobbying
Policy, Local Laws and Procedures
Asset Management
Strategic and Operational Planning
Procurement and Contract Mangement
Payroll
Strategic and Operational Objectives and Goals
Social
Environment
Civic Leadership
Organisational Development
Economic
FRONT LINE - External
Serivce Delivery
Rangers
Community Programs
Works and Services
Parks and Gardens
Environmental Management
Emergency Manangement
Public Health
Waste Management
Construction
Events
Diagram 5: Current Organisational Chart

14 | P a g e
5.3 Workforce Profile as at April 2013
The Shire has a total of 50 employees (43.5 full time equivalents) comprising of 48 full time and part time employees
and 2 casuals with gender percentages being 44% female and 56% male. The senior management team comprises
4 staff of which 75% are female. Of the 7 Councillors, 2 (29%) are female.
The administration team consists of 24 staff of which 2 are male officers. The outside Works area comprises of 26
staff with 1 female parks and gardens officer.
Average age is 43.5 yrs. Ages of employees range from 23yrs to 64 years.
Average age of the outside workforce is 45 years.
In 10 years 56% of the workforce will be over 55 years of age with 30% of those aged over 65 years.
The age profile of the organisation is indicative of the industry with 38% of Public Administration employees in WA
aged over 44 years / 45% nationally (DEEWR 2012). The Shire has an Equal Employment Opportunity Policy and
has acceptable gender ratios. The Shire has 2 employees that identify as Aboriginal or TSI decent.
Average length of service with the Shire is 7.5 years. Average length of service for the outside workforce is 9.5
years.
9 18% 2
4%
7 14%
10 20%
13 26%
9 18%
Age Categories of Employees
17 to 24 yrs
25 to 29 yrs
30 to 39 yrs
40 to 49 yrs
50 to 59 yrs
60 plus
0 10 20
Less than 1 yr
1 - 2 yrs
3 - 5 yrs
6 - 10 yrs
11 - 15 yrs
16 - 20 yrs
More than 21 yrs
Length of Service at the Shire
No. of Staff
0
2
4
6
8
<1yr
1 t
o 2
yrs
3 t
o 5
yrs
6 t
o 1
0 y
rs
10
to
15
yrs
16
to
20
yrs
0ve
r 2
0yr
s
Outside Workforce - Length of Service
Outside Workforce - Length of Service
30 60% 12
24%
6 12%
2 4%
Type of Employment
Full time
Part time
Fixed Contract
Casual

15 | P a g e
As part of the data gathering associated with the Workforce plan, staff completed a survey that covered position
responsibilities and capacity, training and development and staff satisfaction.
Survey results suggest that approximately 54% of employees have over 3 years experience in local government
(ranging to in excess of 21 years experience). This demonstrates a core understanding of the sector from
employees and an appreciation for the unique nuances of local government.
Overtime and Resource Allocation:
Over 30% of the workforce (Works crews) are working additional and agreed overtime to meet scheduled works
objectives and are operating effectively and at full capacity. The current Workplace Agreement states a minimum 76
ordinary hours plus 15 hours overtime per fortnight spread over 10 days Monday to Friday working between 6.00am
to 6.00pm.
In addition to capital and maintenance schedule requirements being achieved, agreed overtime is also an effective
retention strategy.
Approximately 20% of survey respondents advised that they complete overtime periodically with the main reason
being that they have too much work to undertake in the set hours. This appears to be seasonal / responding to peak
workloads with flexible workplace practices allowing for time off in lieu.
Four positions were highlighted as working excessive hours with over 100 hours a fortnight recorded due to workload
and the inability to complete the task in the hours allocated – two outside workers and two administration staff.
1. Upon investigation, additional resources had recently been appointed to one area in question which will see the
overtime reduce.
2. After interviewing one employee, tasks and activities that are being undertaken by the employee should be
delegated with the employee providing support and clarity/checking duties only. A task ‘n’ time activity is to be
undertaken to ensure all activities are in line with the position description and also with the desired outputs and
outcomes of the Community Strategic Plan 2013 - 2023.
3. Two outside roles will need to have a task ‘n’ time activity or be reviewed by senior management to ensure
activities are aligned and scheduled accordingly, training is current and plant is adequate.
Table 3 shows workforce growth since 2010/11. This is in response to legislative and planning requirements
associated with financial management, asset management and environmental health responsibilities and reporting.
Table 3: Workforce Growth 2010/11 to 2012/2013
2010/2011 2011/2012 2012/2013
47 staff 48 staff 50 staff
1 officer (Manager Finance)
x1 Part Time (Asset Management Co-ordinator x1 Part Time (Environment & Skeleton Weed officer)
Growth rate of 4% since 2010/11

16 | P a g e
5.4 Recruitment and Retention History
Attrition rates since 2010/11 are as follows: 2010/11: 8.5% (4 staff), 2011/12: 8.3% (4 staff), 2012/13: 16% (8 staff)
It should be noted that statistics includes a maternity leave resignation with the staff member returning to the Shire in
a different role (substantive role was forfeited due to change in employee situation). Key reasons for leaving the
Shire cannot be identified at present due to lack of data.
Current retention strategies:
The Shire has a suite of retention strategies (listed below) which demonstrates Councils commitment to attracting
and retaining staff within a financially constrained and remote environment. These strategies should form the basis
of a review of a staff retention plan which is included in the Workforce Plan Implementation Action Plan 2013/2014.
Fair and negotiated annual wages increases as per the current Workplace Agreement being: 1st July 2013 5%,
then 4% for the next 3 consecutive years.
Minimum overtime guarantee of at least 1.5 hours per day
Flexible working hours
Use of online and remote learning training methods to enable staff to undertake courses that would otherwise
only be available in Perth
Housing Incentive Payments
Water usage for staff housing
Salary sacrifice options
OSH, EEO and other health related policies
5.5 Workforce Costs
The 2012/13 Annual Budget has an employee cost allocation of $2.559m against an annual budget of $1.915m for
the previous financial year with actual expenditure for the 2011/12 financial year being $2.174m. Budget for
2010/2011 was $2.038m. From the period 2010/11 to current, employee costs have increased by approximately
25% as demonstrated below.
2010/2011 2011/2012 2012/2013 Annual Budget $2.038m
Annual Budget $1.915m
Annual Budget $2.559m
Actual $1.955m Actual $2.174m As at April 2013 $2.185m
25% growth
Increase in expenditure is primarily due to costs associated with the termination, resignation and recruitment of staff
(7) and wages adjustments. Current Workplace Agreements reflect a 5% increase in wages for 2013/2014 with a 4%
increase for the next three years.
Housing Costs:
The Shire owns eleven properties suitable for staff housing with Shire employees currently occupying six residences.
Five employees currently lease properties through the Shire. As a direct result of employee growth, housing costs
have increased approximately 33% over the period 2010/2011 to 2012/2013 as shown in Table 4 below.

17 | P a g e
In situations where the Shire owns housing properties, staff received a reduced rental of $55.00 pw with water
consumption costs also paid for by the employer. Where the house is rented privately by the Shire employee, staff
are eligible for $60.00 pw housing assistance.
Table 4: Maintenance and Renewal Costs – Staff Housing
2010/2011 2011/2012 2012/2013
Annual Budget $151,670 Annual Budget $167,280 Annual Budget $205,403
10% growth 23% growth
Long Service Leave:
The Shire uses a reserve account to fund Long Service Leave and demonstrates adequate coverage of the LSL
liability with a balance as of June 2012 $255,369 with nominal variance over the past 2 financial years with the
2010/2011 balance being $252,430.
Allocation of funds to cover current Employee Benefits Provision of $393k is adequate and stable with nominal
change to budget over the past 3 financial years.
5.6 Human Resource Management
Council has a suite of policies that addresses the strategic and day to day operations of the organisation to ensure a
safe, harmonious workplace environment supported by a fair and equitable approach to remuneration and benefits.
Council has also recognised and where possible rewarded staff for their tenure of employment and the contribution
that they have made to the organisation.
Current policies as follows:
Occupational Health and Safety
Employee Benefits
Gratuity Payment to Council Employees / Recognition of Long and Outstanding Leave
Awards – Salaries and Wages Representation
Motor Vehicle Use
Emergency Services Leave
Harassment within the Workplace
CEO Performance Review
Smoke Free
Equal Employment Opportunity
Drug & Alcohol
The Shire does not have a Human Resource Management Plan therefore strategies and activities developed are ad
hoc and inconsistent in delivery. Shire staff however are aware of this and are currently developing HR procedures.
5.7 Organisational Development
The Shire does not have a structured or strategically aligned organisational development plan that drives the growth
in organisational capability and skills although the Shire does recognise the need for investment in staff training and
development and allocates an annual budget for staff training and development.

18 | P a g e
The Chief Executive Officer is responsible for the management of funds allocated for staff training and development
and any expenditure may, subject to provision being made in the budget, be endorsed by the Chief Executive Officer
without reference to Council.
Forty one staff participated in the survey (82% of workforce) with the following summary outlining training and
development aspects:
17% of staff advised that they have not had any training on the job.
44% of staff advised that they would like to undertake training that is relevant to their job with 3 staff seeking
management/supervisory training specifically.
73% of staff surveyed believed that there are no barriers to undertaking their work duties however 17
respondents (43%) went on to state that to improve their role, team and function within the workplace, further
improvements were required with more training being the main factor (71%).
Barriers preventing staff from doing a good job include: training, communication skills, OSH issues, time
management, appropriate plant and equipment for the job, induction/orientation processes.
35 staff responded positively to the question of having a Position Description (PD) with 3 staff stating that they
have not had the PD reviewed regularly. 94% advised that the PD reflected what they actually did although 7
staff members did advise that they perform tasks outside of their PD from time to time ranging from project
management, to emergency management (bush fires), traffic control and OHS.
Approximately 25% of staff were identified as having a role that required management of staff.
12 staff (29%) hold degrees, diplomas or certificates. This is higher than industry state average of 22%
(nationally 40%).
Table 5: Current Training and Development
Work Area 2010/2011 2011/2012 2012/2013
Budget Actual Budget Actual Budget Actual
Administration $30,000 $16,421 $28,000 $21,908 $28,000 $18,075
Outside $25,000 $10,494 $25,000 $7,178 $32,000 $29,508
% of gross salaries
2.7% 1.3% 2.8% 1.52% 2.3% 1.9%
Current annual budget allocation for training and development is approximately 2.3% of the salaries and wages
budget which is below the recommended Human Resource Management gross wages: training and development
budget ratio benchmark of between 5 – 6%. Over the past three years, the average training and development spend
is approximately 1.6% which is typical of the levels reported by the ABS which suggests that Australian employers
average approximately 1.5% spend on employee development.
In line with staff requests for additional training and development and the number of new staff/internal transfers,
increased investment would be highly beneficial from a staff motivation and morale perspective and an organisational
capacity / capability building approach.
Staff Satisfaction:
The recent Workforce Plan Staff Survey included a question based on employee propensity to refer to their employer
as an employer of choice or contractor of choice. Responses indicated that 92.5% of respondents (37) definitely
would or might recommend the Shire to friends or colleagues as a good place to work with 7.5% (3) unsure or
definitely not recommending the Shire. Supporting this was the response relating to recommendations as a
contractor with 94% (17) of respondents stating that they would recommend the Shire as good place to work and
only 1 respondent unsure.

19 | P a g e
This demonstrates a good level of staff satisfaction and support for the Shire.
Table 6. below outlines the best and least liked aspects of working at the Shire of Yilgarn. This information was
sourced from the recent Staff Survey and has been amended to ensure anonymity for staff.
What is the best thing about working for this Organisation
What is the thing you least like about working for this organisation?
If you could change one thing about your role or the workplace what would it be?
Broad knowledge of community. Great training opportunity. Ability to learn on the job. Flexible and realistic hours. Opportunity to give something back to the community. I love doing my job, although it can be too much sometimes. The people that I work with and their eagerness to do a good job. I have a competent and friendly team. Providing a service to the community. Contact with people. Community service. Friendly, nurturing and supportive environment. Work at own pace. Learn something every day. Job security and good working conditions. After hours social life. Up to date machinery. Good working environment. Social life after hours. Reasonable pay. Working with others. Conditions and good plant. You have to enjoy what you do and be able to do it. Council and staff are supportive, encouraging and friendly. Flexibility in work time and helpful staff. Working independently. Weekends at home. Local govt awards. I love gardening. Interesting work normally. Doing a good job fixing the road.
Need to have a more even focus across all demographics – aged and youth. Keeping people accountable for their actions. Turnover of staff. Some of the negativity. Workload is too high. Sometimes the community don’t understand how much effort and planning can go into programs and events. When users don’t look after the facilities. Nothing I dislike. Need for more training - formal and informal. Lack of understanding from colleagues regarding others roles and duties. Wage parity. Rostering. Attitudes from people can improve.
Being more organised and effective work distribution. Refurbish the administration building. A community wide events calendar. Happy to work more hours. Happy the way things are. Improve the training program. Rotate and cross train staff more. Improve forward planning. Improve internal communications.
0
5
10
15
20
25
30
As an Employer As a Contractor
Definately Yes
May Do
Not Sure
Definately No
Would you recommend the Shire to
friends and colleagues as a good place
to work?
20 | P a g e
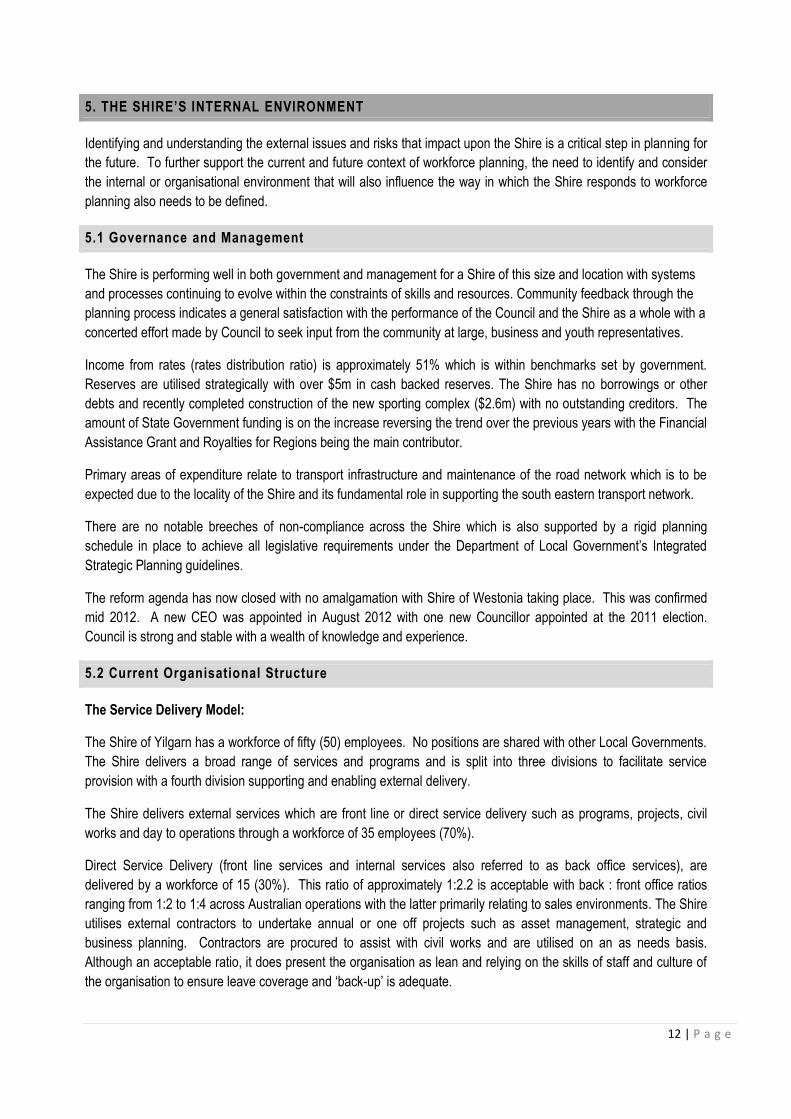
5.8 Current Workforce Risk Profile
As outlined in Section 4, the Wheatbelt Region faces numerous workforce issues which resonate across all industries
and sectors including local government. The Shire’s key risks are a reflection of the region and also unique to local
government and would normally be addressed through the Shire’s Human Resources Plan. Table 8. outlines key
risk and the impact to the Shire and possible strategies to mitigate/eliminate the risk. A more comprehensive risk
assessment will be undertaken during the development of the HR Plan.
Table 7: Key Workforce Risks.
KEY RISK IMPACT TO THE SHIRE ACTION
Diversity of skills and experience Broad range of services, functions and programs are delivered / facilitated by the Shire therefore ongoing focus on specific skills and experiences is required and cannot be developed in-house to match the rate of demand.
Through the HR Plan, identify supply and demand needs and develop pathways to mitigate impact and minimise service delivery interruption and vacancy period.
Wage parity Inability to compete on the open market with other industry salaries and benefits.
Acknowledge the wage parity issue and promote what LG has to offer i.e. lifestyle, flexibility, family friendly and professional development.
Ageing workforce and ageing population
In 10 years 56% of the workforce will be aged over 55 with 30% aged over 65 years. Occupational Safety and Health issues. Computer skills lacking and other training requirements not being met. Potential physical capacity constraints in manual tasks required
Through robust EEO, HR planning, capability assessment and monitoring in the workplace, the Shire will ensure it meets both employee and organisational needs and expectations.
Key Position Succession Planning
Long term vacancies, additional responsibilities on other staff to cover vacancies, drop in productivity and morale.
Through the HR Plan, identify supply and demand needs and develop pathways to mitigate impact and minimise service delivery interruption and vacancy period.
Training and Development Training and development is key to maintaining acceptable levels of service delivery, staff satisfaction and morale. Cost, resourcing and distance are factors affecting the Shires ability to deliver T&D programs effectively.
Develop a structure and flexible learning strategy that meets employee and organisational needs.
5.9 Organisational Capacity and Capability
Organisational capacity refers to the level of appropriate governance, management, administrative and financial
structures within the workplace that can support the implementation and monitoring of the organisation’s vision,
mission, goals and objectives.

21 | P a g e
Capacity also refers to the effectiveness of the human resource planning, systems and processes, tools and how
they support the regulatory and internal compliance and health of the organisation and its workforce. The method
used to assess the organisation capability and capacity comprises of an assessment tool (matrix), internal meetings,
observations, systems search and performance results.
Leadership:
With the appointment of a new CEO less than a year ago and the development of the new strategic plan and
corporate business plan, assessing the level of understanding of the vision, mission and supporting strategies
and actions is yet to be finalised and therefore unable to be measured. This can be further explored at the
review period for the Workforce Plan in 2014.
Management:
Data and observations suggest that staff responsible for supervising or managing staff endeavour to engage and
seek input from employees where possible. Team work is encouraged and feedback is evident. Further
assessment will need to occur once the current planning process is completed.
Human Resource Systems:
There is a clear need for increasing skills and capability across the organisation. Systems and processes are
limited with no evidence of targets or objectives in place, clear actions, task, responsibilities or time lines. There
is a suite of HR policies in place however implementation and continuous improvement strategies are limited.
There is no HR plan, OD plan, succession planning or organisational wide training and development schedule
evident. Day to day HR activities are shared across several positions which increases risk in some areas.
Tasks and accountability needs to be clarified for staff so that resources and time are optimised and effective.
Staff currently covering HR duties are committed and enthusiastic however strategy, clarity, training and
processes are required to ensure a consistent, standardised and more effective system is achieved in order to
comply with HR legislation and operational demands.
Communications:
The workplace is social and friendly however more structured strategic communication would assist in driving the
implementation of the new Strategic Community Plan and supporting documents. Ensuring face to face
communication continues across the organisation by management is essential as is the need to continue to drive
cross-departmental communications. With the current whirlwind of planning activity, employees can easily be
overwhelmed with the amount of information if context and a structured plan / schedule are not put into place
and consistently monitored to oversee the implementation.
Financial Resources:
Budgets are regularly reviewed with projects managed effectively. Audit and compliance levels are satisfactory.
Managers are consulted about operational budget planning and expenditure. Current integrated planning
requirements need to be utilised to support the ongoing improvement and development of internal procedures
and integration across the organisation.
Project Management:
Projects are managed within budget and capacity. Infrastructure projects are completed in line with the Forward
Capital Works Plan. An opportunity exists for formal project management training and the development of a
standardised PM procedure based tool kit to be developed that would assist in the overall capabilities and up-
skilling of employees across the organisation. The Shire operates in a project environment and expertise in this
area would benefit all facets of planning and implementation and enhance operations.

22 | P a g e
IT and Knowledge Management:
A centralised and systemised approach to data and records needs to be revisited with evidence of some
procedural requirements not being met. Records storage also needs to be reviewed and monitored with a re-
fresher training program required. Hardware is included in the asset management strategy with an audit of
software functionality and requirements due over the coming period.
Staff Facilities - The Administration Building:
Previously identified as unsatisfactory with the following issues identified:
No security and easy access to back office from front counter
CEO is physically located within the main administration area which does not allow for privacy or
confidentially of issues and results in constant minor distractions and raises the issue of access and
security.
Space is not maximised, with some areas cluttered.
Layout is not conducive to effective communications.
Staff Facilities – Depot:
No major refurbishments scheduled however the following works will be undertaken during 2013/2014 and are
included in the FCWP: upgrade existing nursery, upgrade existing dog pound, renewal of wash down bay shed
and installation of a new shed.
6.0 WORKFORCE IMPLICATIONS (OPERATIONAL) FROM THE COMMUNITY STRATEGIC PLAN
Recent community consultation and visioning workshops with Council, have resulted in the revised Strategic
Community Plan 2013 – 2023 and Corporate Business Plan development. These key documents are supported by
the revised Long Term Financial Plan and the 2013/2014 Annual Budget. A summary of the Community Strategic
Plan 2013 - 2023 themes and goals are outlined below:
Theme 1. Social - Our community, neighbourhoods, recreation and culture. Our Goals: Cultivating an inclusive, secure and welcoming community that encourages families, youth and the aged to remain and
contribute to our Shine in the long term. Cementing the Shire of Yilgarn as one of Western Australia’s tourist destinations Valuing and investing in educational opportunities for children and youth throughout the Shire Maintaining and improving our health structures and systems to ensure excellent health services are available for all groups
in our society. Theme 2. Environment – Protecting, utilising and enhancing our beautiful natural heritage. Our Goals: Establish and maintain environmentally sound regional waste facilities to cater for the Shire’s long term waste disposal
requirements. Investing in renewable energy projects to meet the future energy needs of the Shire. A Shire that has a valued natural environment where community members in all industries and government invest in land
care initiatives. A thriving agricultural sector that works in harmony with the mining and resources industry. Theme 3. Economic – Building a prosperous future for our community. Goals: Maintain existing infrastructure to ensure its suitability and useability for residents and community groups in the Shire. Invest in new infrastructure that meets the needs of our diverse community. Improved telecommunications infrastructure that provide metropolitan standard access to the internet and mobile phone
coverage. Maintain, invest and seek future funding for current and new transport infrastructure, recognising its importance to our local
industries and the impact on the health and safety of our residents. Encourage a thriving and vibrant local economy through programs that support and develop businesses in the Shire.

23 | P a g e
Theme 4. Civic Leadership – Dynamic and visionary leadership guiding our community into the future. Goals: A trustworthy and cohesive Council that functions efficiently and effectively to meet the needs of our community. Visionary civic leaders who can devise solutions for the challenges facing the community. A Council that adheres to good governance principals to ensure the long term financial viability of the Shire. Staff who are happy in their work environments, providing excellent communication and customer service to all ratepayers
and community members. A community that respects and values Council staff and elected members.
6.1 Operational Functions and Services - Changes / Growth
Analysis has been undertaken to determine the impact to the workforce and its capacity and levels of capability to be
able to respond to the Strategic Community Plan and its operational requirements. The section below entitled
Capability Risks refers to new and/or further development of skills and knowledge that is required to support the
changes to service delivery.
Project Name Description Approval Status
Cost HR Requirements Time Frame Financial Year(s)
New Services
1.Road Verge Maintenance
Private Works: Contracted by Leighton Opus to maintain road verges on main roads.
Initiative is at planning and contract negotiation stage.
Costs, resources and term of contract to be determined. Proposing a 3 year contract.
Full cost recovery model. Impact will be contract management requirements absorbed by the Manager for Works and Works Supervisor.
Negotiations completed by end of May. Procurement and Recruitment completed by end of June.
2013/14 2014/15 2015/16
Capability Risks
Further development is required in the following areas: Contract Management, position specific training and development, OSH, computer literacy.
2.Yilgarn Visitor Centre (YVC)
Development of a new Visitor Centre including the consolidation and relocation of existing services (Library and Community Resource Centre – CRC) into the new Visitor Centre.
Business case and planning is currently being undertaken.
$50k purchase of premises. $10k Feasibility Study (funded by Dept of Communities)
Transfer of existing staff (Library & CRC) to YVC. Possible increase in hours of the existing part time trainee position. Business case to determine full extent.
Feasibility 12/13 Fit Out commencing 14/15 Operating 14/15
2013/14 2014/15
Capability Risks
Further development is required in the following areas: Computer literacy and specific software training, Tourism Development and Sales Training. Possibility of job sharing and cross training opportunities across YVC, library and CRC to ensure leave is covered and development of new skills and experiences are gained. Will create opportunities for innovation and new ideas across aligned services.
3.Indoor Heated Pools
FCWP highlights 2015/2016 installation.
Not project ready. Planning occurring.
DSR funding to be pursued. Additional funding options to be explored.
Diversity of programming and opening hours will have an impact of staffing levels and rosters. Availability of appropriately skilled staff will need to be considered in HR planning.
18 months. 2014/14 2014/15
Capability Risks:
Will require relevant programming and scheduling before staffing can be confirmed. Pool managers currently work a total of 1120 hours over a 26 week period.

24 | P a g e
Project Name Description Approval Status
Cost HR Requirements Time Frame Financial Year(s)
Changes to Existing Services
3.Landfill Site remodelled to Transfer Station and New site WM Facility
Forecasted growth in waste management. Increase in staff – 1 FTE.
Planning stage
New officer level 5 $65K
1 new officer to undertake site tasks and works. Position includes 60% land fill, 40% parks and gardens and maintenance. Green waste to be mulched at landfill site for rehab and dust management.
Operational by late 2013.
2013/14
Capability Risks
Further development is required in the following areas: Computer literacy and specific software training, industry training i.e. Waste Management, OSH, position specific training and development and tickets, DEC licences and other regulatory requirements.
Precinct – Stage 3. Upgrade to Swimming Pool
FCWP highlights upgrade for 2014/2015. Includes kiosk, change rooms and day room.
Planning stage.
Funding to be determined which will include any works to be undertaken by the Shire.
Nil. Absorbed within existing costs.
Commence 2014/2015
2014/15 2015/16
Capability Risks
Works will be sub-contracted. Final impact to be determined once planning and funding strategy is complete.
Asset Management
Increase in legislative requirements and systems development internally.
Budget 2013/14
$10k approx Increase existing staff hours from 2 to 3 days.
asap 2013/14 ongoing
Capability Risk
Ongoing training is required for staff to ensure legislative, planning and financial implications are identified and actions. Possible need for IT/software solutions.
Ranger Services
Review of work outputs and outcomes in line with new legislative requirements to ensure staffing for service levels are adequate.
Business case required.
$10k approx
Increase existing staff hours by 3 hrs pw.
To be reviewed over the next 6 months.
2013/14
Capability Risk
With the introduction of the Cat Act and ongoing legislative requirements, opportunity to monitor position outputs and outcomes to determine staffing for service levels.
4.Library As above 2. YVC No change
Capability Risks
As above 2. YVC. Possibility of job sharing and cross training opportunities to ensure leave is covered and development of new skills and experiences are gained.
5.CRC As above 2. YVC No change
Capability Risks
As above YVC. Possibility of job sharing and cross training opportunities to ensure leave is covered and development of new skills and experiences are gained.
New Projects
6.Utilising Local Contractors - Works
Engagement of local farmers / resources to assist with service delivery ie plant and drivers for asset management purposes ie aggregate haulage. Cost neutral project that utilises local resources.
Business case and planning stage.
Nominal. Administration set up costs ie contract, policy, training and procedures.
Procurement and contract management resources/time will be absorbed internally.
Commence 2013/14 and ongoing
2013/14
Capability Risks
Further development is required in the following areas: Contract Management, OSH, position specific training and development, computer literacy.

25 | P a g e
7. STRATEGIES TO MEET FUTURE WORKFORCE NEEDS – NON OPERATIONAL
Section 6. above addressed the operational impact to workforce planning in line with the Plan for the Future
objectives.
This following section will address the non-operational or back office issues and gaps that will also need to be
actioned to support service delivery, legislative requirements and community expectation. Although these issues and
gaps can be intangible to community and other stakeholders, they are implicit to the success of the Strategic
Community Plan as they enable front line activities and service provision.

26 | P a g e
7.1 Summary of Issues and Gaps – Non Operational
ISSUE/GAP FUTURE DEMAND REQUIREMENTS RECOMMENDED ACTION
1. Strategic Planning and Reporting
Increasing workload in organisational planning, structural reform activities and legislative compliance. New planning requirements will continue to evolve over the coming years and will need to be resourced and monitored accordingly.
Develop a dedicated and resourced strategy to facilitate, drive and oversee new planning and reporting requirements of the new Integrated Planning and Reporting Framework and subsidiary/supporting activities.
2. Organisational Structure
CEO has limited lower level support therefore resulting in non-strategic administration duties. Review of responsibilities and relationship between CEO and senior management needs to be undertaken and clarified through position descriptions and in line with SCP and CBP expectations and requirements.
In line with prudent business management, when strategy is review so must the organisation structure be reviewed to support the objectives and goals of the organisation. Refer to revised Organisational Structure in Section 7 below.
3. Staff Accommodation and Security
Space optimisation, communications, security and confidentiality is being compromised under the current layout. A refurbishment is required in the short term and needs to consider the responsibilities of the CEO as currently this role is located in the centre of the front office which is not desirable.
Develop a business case and funding options for Council consideration as soon as possible.
4. Clarification of position and responsibilities
Refers to: - CEO, Exec Management and Finance Mgr roles. Refer to 2. above. - EM EH&BS, asset management and environmental / Skeleton Weed
Admin Officer roles.
Undertake a time ‘n’ task activity, review Position Descriptions and align to Strategic Community Plan / Corporate Business Plan objectives.
5. Systems and Processes
Need identified for standardisation of procedures including planning, HR, project management, legislative requirements and reporting.
Undertake a department audit and establish a prioritised schedule of required processes and procedures for the next two years.
6. Excessive Work Hours: Understanding outputs, outcomes and levels of service.
Four positions demonstrated excessive hours worked which is not sustainable. One area has been responded to however further analysis and understanding of the other three areas will need to occur to ensure satisfactory levels of service and hours of work are achieved.
Undertake a time ‘n’ task activity, review Position Descriptions and align to Strategic Community Plan / Corporate Business Plan objectives.
7. Human Resource Management
There is no Human Resource (HR) plan, Organisation Development plan, risk, succession planning or organisational wide training and
Clarify HR responsibility ie strategic responsibility and operational responsibility. Develop and implement a HR

27 | P a g e
ISSUE/GAP FUTURE DEMAND REQUIREMENTS RECOMMENDED ACTION
Compliance
Training and Development
Succession Planning and Talent Management
Performance Management
Workforce Planning
development schedule evident. Day to day HR activities are shared across several positions which increases risk in some areas. Limited evidence of strategic HR activities occurring at present. Tasks and accountability needs to be clarified for staff so that resources and time are optimised and effective. HR system and process gaps need to be addressed. The current ratio of HR staff to total employee numbers is currently at a ratio of 1 (0.5 HR FTE : 50 staff). HR Industry benchmark hovers around a ratio of 2.0. which equates to 1 HR FTE : 50 Staff. This flags the issue that current HR capacity is operating at maximum levels. The Shire also has a diverse range of services and programs, regulatory and community focused which introduces a need to create a fully customised HR approach which increases the complexity of HR planning within the current limited resources.
Plan. Consideration could be given to regional cooperation and resource sharing to address affordability and skill levels
8. Policy Review
With proposed changes to service delivery and the introduction of planning and reporting requirements, Council policy will need to reflect the same. One example is the review of the Private Works policy which does not provide adequate strategic direction or desired outcomes.
With reference to the outcomes of the recent planning activities, flag new / amendments/rescinding of policies for the next schedule policy review. Identify high priority new/amendments to policy and address within appropriate time frames.
9. Communications
With the changes to legislative requirements and the significant amount of strategic and operational planning taking place, effective external and internal communication pathways need to be reviewed and/or established to ensure Council and Shire management deliver on the expectations created.
Develop a stakeholder management plan for internal and external stakeholders and align to legislative requirements.
10. Project Management
The Shire operates in a project based environment. As there are no standardised business case/feasibility templates or processes for integrating project based initiatives, the risk profile increases in relation to financial, asset, and Strategic Community Plan objectives.
Develop a cost effective and localised training program with standardised templates and procedures for relevant employees.

28 | P a g e
7.2 Organisational Structural Implications
To support the direction of the revised Strategic Community Plan 2013-2023 and the Integrated Workforce Plan, five
changes are recommended to the existing organisational chart to improve clarity, accountability, output and
efficiencies. Key changes include:
1. Standardisation of Senior Management Roles:
Currently, there is a mismatch of titles and therefore responsibilities and accountability with senior and middle
management with the title of Manager referring to senior officers and middle management. Addressing this through
title change will provide more clarity with the following amendment:
DCEO Executive Manager, Corporate and Community (DCEO). This articulates the primary function of the role
with the added responsibility of undertaking / relieving responsibilities of the CEO in their absence.
Manager for Works Executive Manager, Works and Infrastructure. This describes the breadth of the role and the
associated accountability and risk.
Manager Environmental Health and Building Services Executive Manager, Environmental Health and Building
Services: Articulates the differentiation between the other manager positions and the level of accountability and risk.
2. Office of the CEO:
Realign the current Administration Services Officer to report directly to the CEO. This will relieve the CEO of low
level, non-strategic tasks, provide support to the CEO in the area of governance and improve confidentiality. This
role should also be trained to undertake Council minutes so that the Manager Finance is relieved of the task and can
focus on more strategic and management accounting tasks. The CEO currently does in excess of 100 hours a
fortnight which is unsustainable and incongruent with workplace practices alluded to in the Strategic Community
Plan.
3. Part Time Human Resource Officer:
Position currently reports to the Manager Finance and is responsible for Payroll and basic level HR tasks. Currently
there are no proactive strategic or developmental HR strategies occurring or an alignment with current plans, risks or
operational requirements. With the introduction of a dotted line reporting relationship to the Executive Manager,
Corporate and Community (EM C&C), day to day operational line management remains with the Manager Finance
however strategic and operational HR strategies and continuous improvement can begin to occur in a structured and
priorities manner under the guidance of the EM C&C. Human resource management is not a financial function and
requires a strategic approach. This will be achieved through the addition of senior management direction and
support. As the position outputs evolve, capacity would need to be reviewed in a year to ascertain future resourcing
requirements. Future resourcing and capacity risk has been noted in the Workforce Plan Implementation Plan and
Workforce Plan Budget.
4. Yilgarn Visitor Centre:
Due to the nature of the Visitor Centre outcomes and the alignment and proposed co-location of the existing Library
and CRC, this function would report to the EM C&C. Future planning of the function should also include the merging
of the three business streams of CRC, Library and YVC into one.

29 | P a g e
Future structure of the business streams could see one Manager overseeing the consolidated operations allowing for
cross training, diversification of responsibilities, leave coverage, opportunity for innovation and new learning with a
diverse background of skills coming together in an environment of aligned services. A business case will be
prepared in due course which will determine final resources and structure. It is proposed that the impact to the
workforce would be minimal with an opportunity to increase the hours of the existing part time trainee position.
5. Utilisation of External Contractors - Works
With the growth in contractor opportunities and the ability for the Shire to leverage assets and resources outside of
Shire control and ownership, a more structured approach to contract management needs to be established. This is
highlighted in the revised organisation chart and although this amendment does not require additional resources, it
highlights the function, accountability and reporting requirements. The Executive Manager, Works and Infrastructure
has the responsibility of ensuring policy is enacted, that contractual obligations continue to be achieved and
compliance and risk are managed.
In response to the recommendations above, the revised organisation chart below reflects the realignment of the
structure.
Diagram 6: Revised Shire of Yilgarn Organisational Chart – 2013 to 2017

30 | P a g e
8. INTEGRATED WORKFORCE PLAN – ACTION PLAN AND TIMELINES:
The following Action Plan has been developed in response to changes and growth in operational functions; the organisational capacity and capability assessment;
comparison with current service delivery and future demand expectations; and non-operational issues and gaps. The Action Plan is aligned to the Themes of the Strategic
Community Plan 2013 – 2023.
This Action Plan is for the period 2013 – 2017 and will be monitored and updated in accordance with the review timeframes of the Integrated Planning and Reporting
Framework - the Integrated Workforce Plan will be updated annually with a revised annual Action Plan included.
Action Item Description Responsible Officer
Stake-holders
Timeline KPI’s New Assets Required
Approximate Costs (TBC)
SOCIAL
1. Yilgarn Visitor Centre (YVC)
Development of a new Visitor Centre including the consolidation and relocation of existing services (Library and Community Resource Centre – CRC) into the new Visitor Centre. Business case and planning is currently being undertaken.
DCEO Community Corporate and Community
2013/2014 2014/2015
Feasibility Study completed by December 2013 Upgrade 2014/2015 Fit Out commencing 2014/15 Operating by 2015/16
Refurbishment and fit out. IT – workstations and telecoms. Asset register will be updated to reflect the CAPEX.
$10k Feasibility Study. Increase in hours of existing part time trainee. Additional hours to be confirmed.
2. CRC and Library
Refer to YVC. Relocation of services and securing of old premises.
DCEO Community Council Corporate and Community
2013/2014 2014/2015
Relocation of services to YVC in line with operational plan. Down time of services does not exceed advertised information.
Relocation of existing assets where possible. Asset register will be updated to reflect the CAPEX.
To be advised in Feasibility Study.
3. Indoor Heated Pool
FCWP highlights 2015/2016 installation. Programming will have an impact of staffing levels and rosters. Current Forward Capital Works Plan (2015/2016) includes the co-location of an Indoor Heated Pool with the existing swimming pool. This will provide a broader range of programs for the community including hydro-therapy pool, aqua aerobics, swimming and lessons in
MW Community Council
2015/2016 New programs established and communicated.
Not required. Existing staff resources utilised. Asset register will be updated to reflect the CAPEX.
To be determined once programming is complete.

31 | P a g e
Action Item Description Responsible Officer
Stake-holders
Timeline KPI’s New Assets Required
Approximate Costs (TBC)
cooler months and increase the utilisation of the facilities. Resources and programming will be reviewed at that time to determine staffing requirements. Current contractual arrangements allow for flexible rosters and hours which will assist in meeting the needs of the community.
4. Recreation Precinct – Stage 3. Upgrade of swimming pool amenities
FCWP highlights upgrade for 2013/2014. Funding to be determined which will include all works to be undertaken by the Shire. Current Forward Capital Works Plan (2014/2015) includes the upgrade of facilities at the pool and includes the Kiosk, Day Room, First Aid Room and Change Rooms. Funding has not been confirmed with possible funding streams including the Department of Sport and Recreation, LotteryWest or the CLGF. The Shire has Reserve funds which may be utilised to support the project. Workforce impact will be determined during the final planning stages and included in the Workforce Plan once
confirmed.
MW M EH&BS
Community Council
2014/2015 Funding sources to be confirmed and budget adopted. CAPEX and workforce implications identified and resourced.
Not required. Asset register will be updated to reflect the CAPEX.
To be determined.
ENVIRONMENTAL
5. Ranger Services
Ranger Services are provided by a part time officer (12.5 hours per week). With the introduction of new legislation such as the Cat Act, work load and outcomes will need to be monitored over the coming six months to ensure staffing for service levels are adequate. Review May 2014.
M EH&BS Community Council
2013/2014 No increases in non-compliance.
Not required.
To be determined.

32 | P a g e
Action Item Description Responsible Officer
Stake-holders
Timeline KPI’s New Assets Required
Approximate Costs (TBC)
ECONOMIC
6. Two New Residential Premises
Current Forward Capital Works Plan (2012/2013) includes the supply and installation of two new transportables (residential units) to be utilised for professional housing. Project is funded by State Government through the CLGF. Impact to the Shire workforce will be through the external requirements such as fencing, landscaping, driveway etc. Planning is currently being undertaken to determine what will be outsourced ie fencing and what works will be undertaken by the Shire. This will be minor projects for the Shire and will be factored into forward works schedules and resource allocation.
MW Community Council Works Health & Building
2012/2013 2013/2014
Supply and install with fit out, Commence August 2013/2014 Complete by June 2014
Not Required however staff will need to be allocated. Asset register will be updated to reflect the CAPEX.
Absorbed within existing budget. Reallocation of duties.
7. Asset Management
As a result recently introduced legislative requirements and the need to provide up to date data and planning for asset management, renewal costs and maintenance schedules across all asset groups, an Asset Management Officer (part time) has been appointed. This position is currently primarily focused on capturing and warehousing data and establishing an asset management framework. Recent asset data pick up, audit and planning undertaken by external consultants has resulted in the evolution of the position to the next level of analysis and processing of data, establishing plans and schedules and aligning with legislative requirements, the Long Term Financial Plan and the Annual Budget cycle. Due to work outputs required, it is recommended that the position extends to three days per week in lieu of two days per
M EH&BS Council Health & Building Works & Infrastructure
2012/2013 2013/2014
Legislative requirements met. Data management and warehousing completed. Renewal & Maintenance Schedules current.
Possible need for IT/software solutions. To be determined.
Increase existing staff hours from 2 to 3 days.

33 | P a g e
Action Item Description Responsible Officer
Stake-holders
Timeline KPI’s New Assets Required
Approximate Costs (TBC)
week (current). This position can report through various channels including Works however due to the effectiveness of current operations, realigning the role to Works is not necessary.
8. Road Verge Maintenance
Develop Private Works Contract with Leighton Opus Update Private Works Policy Recruit staff Procure assets Induction Program
MW Contractor Council Community Works and Infrastructure
2013/14 2014/15 2015/16
Negotiations completed by end of July. Develop an Induction Program by end of August 2013. Procurement and recruitment completed by end of Sept. Contract commences Sept 2013.
Fleet. Plant and Equipment. IT. (full cost recovery) Asset register will be updated to reflect the CAPEX.
$200K. Full cost recovery model. Contract Management absorbed by existing staff.
9. Transfer station (existing land fill site) New WM Facility Site
Forecasted growth and change in service delivery model for waste management. Increase in staff – 1 FTE. Position includes 60% land fill, 40% parks and gardens and maintenance. Remodel existing land fill site to transfer station. Ensure operational and compliance requirements are embedded into the new waste management site. Project is at planning stage.
MW M EH&BS
Community Council Works and Infrastructure
2013/14
Planning completed by June 2013. Operational by July 2013.
Plant and Equipment. Telecomms. Fleet. Accommod’n Asset register will be updated to reflect the CAPEX.
New officer Level 5 $65K
10. Utilising Local Contractors - Works
Engagement of local farmers / resources to assist with service provision. Business case currently being developed. Contract to be developed Risk management plan to be developed Procurement of contractors Induction Program to be developed
MW Contractor Council Works and Infrastructure
2013/2014 Completion of Contract by July 2013. Procurement and Inductions completed by August 2013. Operational by September 2013.
Not Required. Procurement and contract management resources/time will be absorbed internally.

34 | P a g e
Action Item Description Responsible Officer
Stake-holders
Timeline KPI’s New Assets Required
Approximate Costs (TBC)
CIVIC LEADERSHIP
11. Integrated Planning and Reporting Framework and Legislative requirements
Develop a dedicated and resourced framework to facilitate, drive and oversee new planning and reporting requirements of the new Integrated Planning and Reporting Framework and subsidiary/supporting activities.
CEO Council CEO Staff
2013/2014 New Planning and Reporting Framework implemented by July 2013.
Research planning software to facilitate planning and reporting requirements.
To be advised once research has been undertaken.
12. Organisational Structural Realignment
In line with prudent business management, organisation structure to be realigned to support the objectives and goals of the Strategic Community Plan.
CEO CEO Staff
2013/2014 Research and implementation of organisational realignment by August 2013
Not Required.
Nil.
13. Staff Accommodation
Develop a business case and funding options for existing Administration Building as soon as possible.
DCEO Council CEO Staff
2013/2014 Business Case including costs developed for consideration by Dec 2013.
Refurbishment and fit out. IT. Asset register will be updated to reflect the CAPEX.
Business case to be developed and fully costed
14. Clarification of position and responsibilities
CEO, Exec Mgrs and lower management: Undertake a time ‘n’ task activity, review Position Descriptions and align to Strategic Community Plan / Corporate Business Plan objectives.
CEO CEO Staff
2013/2014 Review of responsibilities is undertaken with changes made accordingly, PD’s updated and communicated organisational wide by Aug 2013.
Not Required.
Nil.
15. Systems and Processes
Undertake individual department audits and establish a prioritised schedule of required processes and procedures for the next two years.
Executive Managers
CEO Staff
2013/2014 Individual department audits completed by August 2013. Prioritised Action Plan developed and implemented by September 2013.
Not Required.
May require software solutions. TBA.
16. Overtime Understanding outputs, outcomes and levels of service. Undertake a time ‘n’ task activity, develop Action Plan to resolve. Review Position Descriptions and align to Strategic Community Plan / Corporate Business Plan objectives.
MW CEO
CEO Staff
2013/2014 Complete assessment by August 2013. Implement mitigating strategies by August 2013.
To be determined.
May require software solutions. TBA.

35 | P a g e
Action Item Description Responsible Officer
Stake-holders
Timeline KPI’s New Assets Required
Approximate Costs (TBC)
17. Human Resource Management
Clarify HR responsibility ie strategic responsibility and operational responsibility through organisational structure (refer Strategy 9). Develop and implement a HR Plan covering four key areas of Performance Management; Organisational Development; Workforce Planning; and Compliance. Review the capacity of dedicated HR resources in line with HR outputs, KPI’s and organisational requirements including future resourcing of the Workforce Plan (annual review).
DCEO Council CEO Staff
2013/2014 - Review of Performance Management Framework including review of PDs and development of KPI’s for all employees in line with the SCP and CBP - Review and implement staff induction programs for new staff. - Establish processes to ensure an ongoing and proactive workforce planning approach is maintained. - Develop an organisational wide and job specific training and development plan which includes: computer literacy and job specific software training, flexible learning options. - Review and revise staff retention strategy. - Key Position succession planning. - EEO strategy addressing the ageing workforce and impact.
To be determined. May require software.
To be determined. Annual training and development budget allocation via the Annual Budget to be increased to 3.0% (currently 2.3%) to assist initially. Training and consultancy support may be required.
18. Policy Review
Identify new/amendments/rescinding of policies for the next scheduled policy review. Identify high priority new/amendments to policy and address within appropriate time frames ie Private Works Policy.
CEO Community Council
2013/2014 Identify proposed policy amendments and address via scheduled policy review or immediately.
Not Required. Nil.
19. Communication
Develop a stakeholder management plan for internal and external stakeholders and align to legislative requirements.
DCEO
Community Council CEO Staff
2013/2014 Develop and implement a stakeholder management plan by end of August 2013.
Not Required. Nil.

36 | P a g e
Action Item Description Responsible Officer
Stake-holders
Timeline KPI’s New Assets Required
Approximate Costs (TBC)
20. Project Management
Develop a cost effective and localised training program for relevant employees.
DCEO CEO Staff
2013/2014 Research, cost and implement a localised and customised project management training schedule
To be determined. May require software.
To be determined. Training support may be required through external service providers.
21. Records Management
Data, information and records storage requirements need to be streamlined and communicated. Training program to be implemented. Records Management Strategy to be updated and implemented.
DCEO Council CEO Staff
2013/2014 Records Management Strategy updated and communicated by Oct 2013. Interim re-fresher training for all staff implemented by Sept 2013.
Not Required. Nil.
22. Consultancy and External Support
Increase consultancy services to address identified gaps and omissions across the organisation due to an inability to respond in a timely manner to conflicting priorities. Provide assistance and support with project development and implementation.
CEO CEO Executive Management
2013/2014 2014/2015
Prioritise Actions and resource accordingly via the Annual Budget and Long Term Financial Plan by End of June 2013. Allocate consultancy budget for 2013/2014 and 2014/2015 by end of June 2013.
Not Required.
$30,000

37 | P a g e
9. WORKFORCE COSTS AND BUDGET IMPLICATIONS
A summary of the funding required to implement the Workforce Plan recommendations are outlined below. This
information is aligned with the Annual Budget 2013/14 and the Long Term Financial Plan. It will be reviewed
annually in line with the legislative requirements and considered in the six monthly budget reviews.
STRATEGY
2013 to 2014
Source of Funds and %
2014 to 2015
Source of Funds and %
2015 to 2016
Source of Funds and %
2016 to 2017
Source of Funds and %
SOCIAL
Yilgarn Visitor Centre Feasibility Study YVC Fit Out and refurbishment (any works undertaken by Shire will be absorbed into normal business operations). Increase in existing PT Trainee hours.
$10k (Study) $360k
Dept of Communities 100% $350k Shire CAPEX
$10k wages
Shire 100% OPEX Possible external grant funding available for salaries. TBD.
$10k wages
Shire 100% OPEX
$10k wages
Shire 100% OPEX
Library and CRC relocation to YVC and decommissioning of existing facilities.
$10k Shire 100% CAPEX
Indoor Heated Pool $1.2m Funding has not been identified. Impact TBD.
Recreational Precinct – Stage 3. Upgrade of swimming pool amenities.
$800k CAPEX Shire Mixed grants
ENVIRONMENTAL
Ranger Services (increase in hours)
$11k Shire 100% OPEX
$12k Shire 100% OPEX
$12.5k Shire 100% OPEX
ECONOMIC
Two new professional premises (any works undertaken by Shire will be absorbed into normal business operations)
$473k Shire CAPEX $80K $393 other & CLGF
Asset Management (increase in hours)
$10k Shire 100% OPEX
$10k Shire 100% OPEX
$11k Shire 100% OPEX
$11k Shire 100% OPEX
Road Verge Maintenance (Leighton Opus). Cull cost recover
Plant and Equip $100k
Shire 100% OPEX
FTE (x2) Level 4 $49k
Shire 100% OPEX
Salary FTE (x2) Level 4
Shire 100% OPEX
Salary FTE (x2) Level 4
Shire 100% OPEX

38 | P a g e
STRATEGY
2013 to 2014
Source of Funds and %
2014 to 2015
Source of Funds and %
2015 to 2016
Source of Funds and %
2016 to 2017
Source of Funds and %
model. Salary FTE (x2) Level 4 $47k $47k
$49k $51k $51k
$53k $53k
Transfer Station Plant & Equip & IT New WM Site 1 Employee Plant & Equip & IT
Level 5 $65k $38k vehicle
Shire 100% OPEX
$15k $65k
CAPEX Shire 100% OPEX Shire 100%
$66k
Shire 100% OPEX
$66k
Shire 100% OPEX
CIVIC LEADERSHIP
Staff Accommodation Business Case Fit Out
$150k Shire 100% CAPEX
Consultancy and External Support
$30k Shire 100% OPEX
$30k Shire 100% OPEX
$30k Shire 100% OPEX
$30k Shire 100% OPEX
IT - software $10k Shire 100% Reserve
Human Resource Management Increase capacity PT HR L4 16hrs pw Training and Development Budget 2.5% of Wages Budget
$64k
Shire 100% OPEX
$21k $64k
Shire 100% OPEX
$22k $66k
Shire 100% OPEX
$23k $66k
Shire 100% OPEX
Total Funds Required CAPEX & OPEX, Grants, Reserves
$1.244m
$1.294m
$1.519m
$324.5k
APPROXIMATE ASSOCIATED WORKFORCE COSTS
$401k
$309k
$319k
$324.5k

39 | P a g e
10. IMPLEMENTING THE WORKFORCE PLAN
Sustaining workforce planning skills, activities and initiatives:
Workforce planning, similar to the annual budget cycle, is an ongoing process that requires resourcing, training and experience. To ensure that workforce planning skills and capacity are created and built upon over time, the senior management team will be responsible for the performance, maintenance and review of the Workforce Plan and will utilise an implementation plan.
INTEGRATED WORKFORCE PLAN 2013 - 2017
Implementation Plan (2013/2014)
RESPONSIBILITY
(Key Driver)
TIMELINE
Council and Executive commitment endorsed through an Integrated Planning and Reporting Policy.
CEO 30 July, 2013
Management and implementation resources assigned through the Annual Budget and Long Term Financial Plan – adopted by Council.
CEO Executive Team
31 July, 2013
Workforce planning data management systems developed / revised and implemented.
DCEO 31 December, 2013
Workforce planning review and reporting procedures established.
DCEO 30 September, 2013
Workforce Plan, KPI’s and reporting requirements communicated to all staff to ensure ownership and accountability across the organisation. Demonstration of benefits at every opportunity. Communicated and implemented using a change management approach.
CEO & DCEO 31 August, 2013
Orientation and training for managers and relevant key stakeholders.
DCEO 30 September, 2013
Workforce planning integrated into all planning (including the corporate business plan), business cases and decision making processes, including Council Agenda.
CEO 31 December, 2013
Organisational and individual performance requirements and KPI’s set, documented and monitored through the performance appraisal process.
DCEO 30 September, 2013
Relevant workforce planning activities and actions integrated into relevant PD’s.
Executive team 30 September, 2013
Embed workforce planning in all relevant frameworks, systems, policies and processes.
DCEO Sept 2013 and ongoing
Workforce planning training requirements identified and reviewed annually.
HR Officer Ongoing
Timelines and legislative requirements clearly scheduled and followed up.
DCEO 30 September, 2013
Commence review of Integrated Workforce Plan in preparation for IP & R Framework Requirements for 2014/15.
DCEO 1 March, 2014
Commence capacity review of HR resources and HR outputs and outcomes required for the coming financial year. Explore possible increase in part time hours.
CEO 1 March, 2014

40 | P a g e
11. CHANGE MANAGEMENT
Integrating workforce planning is a new initiative under the banner of the Integrated Planning and Reporting
Framework and is referred to in the amended Regulations under the LG Act 1995. As a new initiative, it will need to
be communicated and implemented within a change context of clear and concise information sharing, outlining new
actions and requirements and the benefits to staff and the organisation as whole.
Integration of workforce planning requirements will need to be consistent and thorough. Staff concerns will need to
be addressed and resourcing of the Workforce Plan adequate to ensure its effectiveness, timeliness and integrity.
12. MONITORING AND EVALUATION OF OUTCOMES
The Integrated Workforce Plan will be reviewed annually as part of the planning cycle, amended and reported on accordingly to ensure ongoing integration with the Annual Budget, Long Term Financial Plan and Asset Management Plan. Updates will be communicated to relevant stakeholders.
An overall organisational-wide reporting framework will be developed as part of the Integrated Planning and
Reporting Framework however in the interim, the following activities will be utilised to monitor and manage the
ongoing progress of the Workforce Plan and supporting processes. This will ensure that the Plan is a living
document that remains relevant and appropriate in guiding planning and decision making across the organisation.
Review of HR data and trends once HR data banks are established.
Review of staff and customer service survey results relevant to service delivery and human resources.
Review of workforce planning processes, principles and practices with inclusion in the annual planning cycle.
Review of workforce planning implications and included in Council decision making and project planning.
Annual review of Human Resource Plan, key result areas and KPI’s.
Annual review of HR risks and the effectiveness of their treatments and controls.
Inclusion of workforce planning outcomes in the Annual Report.

41 | P a g e
The Shire of Yilgarn thank and acknowledge that the WA Departments of Local Government and Regional Development and
Lands for providing skills development and funding to support the research and development for this Integrated Workforce Plan
2013 – 2017.
Prepared for the Shire of Yilgarn by LG People and Alchemy Corporate Consulting Services May 2013