Northam Platinum Ltd (NHMJ.J) - Marble Arch Research · Risk (3H) recommendation on Northam. This...
29
Citi Investment Research is a division of Citigroup Global Markets Inc. (the "Firm"), which does and seeks to do business with companies covered in its research reports. As a result, investors should be aware that the Firm may have a conflict of interest that could affect the objectivity of this report. Investors should consider this report as only a single factor in making their investment decision. Non-US research analysts who have prepared this report are not registered/qualified as research analysts with the NYSE and/or NASD. Such research analysts may not be associated persons of the member organization and therefore may not be subject to the NYSE Rule 472 and NASD Rule 2711 restrictions on communications with a subject company, public appearances and trading securities held by a research analyst account. 1 Citigroup Global Markets (Pty) Ltd Citigroup Global Markets Equity Research CEEMEA South Africa Precious Metals & Minerals (GICS) Precious Metals (Citi) Company Focus 18 September 2008 29 pages Northam Platinum Ltd (NHMJ.J) Booysendal, a Takeover Bid and a Blow to Earnings Metal prices and share dilution knock earnings — A 26% downgrade to the dollar PGM basket price is expected to compound a 34% increase in shares in issue, leading to a 50% decline in FY09E EPS to R3.10, from R6.21 in FY08. Evaluating options for Booysendal — We carefully consider different development scenarios for Booysendal in light of the water and power supply risks affecting the project, taking into account the impact of lower resource grades and benchmarking costs against actual industry performance. This points to an average NPV for Booysendal of R16.14/share. Impala's bid faces headwinds — Although a bid from Impala is likely to be value accretive for Northam, it could face objections from regulators. A value for Booysendal south — Following ongoing speculation regarding corporate activity relating to the southern portion of Booysendal, we estimate a value of R5/share. This value is not included in our target price. Transferring coverage — With this note, we transfer coverage of Northam from Gerhard Engelbrecht to Simon Anderssen. Target price upgraded but Sell recommendation maintained — Despite the earnings downgrades, we raise our target price to R44 to reflect the value underpin of our revised NPV estimate, and maintain a Sell/High Risk (3H) recommendation. Northam Platinum Ltd (ZAR) Year to 30 Jun 2007A 2008A 2009E 2010E 2011E Sales (RM) 3,739.8 3,886.1 3,689.2 3,724.4 3,880.6 Net Income (RM) 1,326.0 1,492.8 1,058.9 1,008.4 1,032.7 Diluted EPS (R) 5.48 6.21 3.10 2.78 2.85 Diluted EPS (Old) (R) 5.53 6.38 6.20 4.67 3.53 PE (x) 9.4 8.3 16.6 18.5 18.1 EV/EBITDA (x) 8.2 7.1 10.4 10.9 10.7 DPS (R) 5.26 4.25 1.55 1.39 1.43 Net Div Yield (%) 10.2 8.2 3.0 2.7 2.8 Sell/High Risk 3H Price (18 Sep 08) R51.51 Target price R44.00 from R41.26 Expected share price return -14.6% Expected dividend yield 3.2% Expected total return -11.4% Market Cap R18,528M US$2,241M Price Performance (RIC: NHMJ.J, BB: NHM SJ) See Appendix A-1 for Analyst Certification and important disclosures. Simon Anderssen 1 +27-11-944-0817 [email protected] Gerhard Engelbrecht 1 +27-11-944-0820 [email protected] Target price change Estimate change
Transcript of Northam Platinum Ltd (NHMJ.J) - Marble Arch Research · Risk (3H) recommendation on Northam. This...
Citi Investment Research is a division of Citigroup Global Markets Inc. (the "Firm"), which does and seeks to do business with companies covered in its research reports. As a result, investors should be aware that the Firm may have a conflict of interest that could affect the objectivity of this report. Investors should consider this report as only a single factor in making their investment decision. Non-US research analysts who have prepared this report are not registered/qualified as research analysts with the NYSE and/or NASD. Such research analysts may not be associated persons of the member organization and therefore may not be subject to the NYSE Rule 472 and NASD Rule 2711 restrictions on communications with a subject company, public appearances and trading securities held by a research analyst account. 1Citigroup Global Markets (Pty) Ltd
Citigroup Global Markets Equity Research
CEEMEA South Africa Precious Metals & Minerals (GICS) Precious Metals (Citi)
Company Focus
18 September 2008 29 pages
Northam Platinum Ltd (NHMJ.J) Booysendal, a Takeover Bid and a Blow to Earnings
Metal prices and share dilution knock earnings — A 26% downgrade to the dollar PGM basket price is expected to compound a 34% increase in shares in issue, leading to a 50% decline in FY09E EPS to R3.10, from R6.21 in FY08.
Evaluating options for Booysendal — We carefully consider different development scenarios for Booysendal in light of the water and power supply risks affecting the project, taking into account the impact of lower resource grades and benchmarking costs against actual industry performance. This points to an average NPV for Booysendal of R16.14/share.
Impala's bid faces headwinds — Although a bid from Impala is likely to be value accretive for Northam, it could face objections from regulators.
A value for Booysendal south — Following ongoing speculation regarding corporate activity relating to the southern portion of Booysendal, we estimate a value of R5/share. This value is not included in our target price.
Transferring coverage — With this note, we transfer coverage of Northam from Gerhard Engelbrecht to Simon Anderssen.
Target price upgraded but Sell recommendation maintained — Despite the earnings downgrades, we raise our target price to R44 to reflect the value underpin of our revised NPV estimate, and maintain a Sell/High Risk (3H) recommendation.
Northam Platinum Ltd (ZAR)
Year to 30 Jun 2007A 2008A 2009E 2010E 2011E
Sales (RM) 3,739.8 3,886.1 3,689.2 3,724.4 3,880.6
Net Income (RM) 1,326.0 1,492.8 1,058.9 1,008.4 1,032.7
Diluted EPS (R) 5.48 6.21 3.10 2.78 2.85
Diluted EPS (Old) (R) 5.53 6.38 6.20 4.67 3.53
PE (x) 9.4 8.3 16.6 18.5 18.1
EV/EBITDA (x) 8.2 7.1 10.4 10.9 10.7
DPS (R) 5.26 4.25 1.55 1.39 1.43
Net Div Yield (%) 10.2 8.2 3.0 2.7 2.8
Sell/High Risk 3HPrice (18 Sep 08) R51.51Target price R44.00
from R41.26 Expected share price return -14.6%Expected dividend yield 3.2%Expected total return -11.4%Market Cap R18,528M US$2,241M
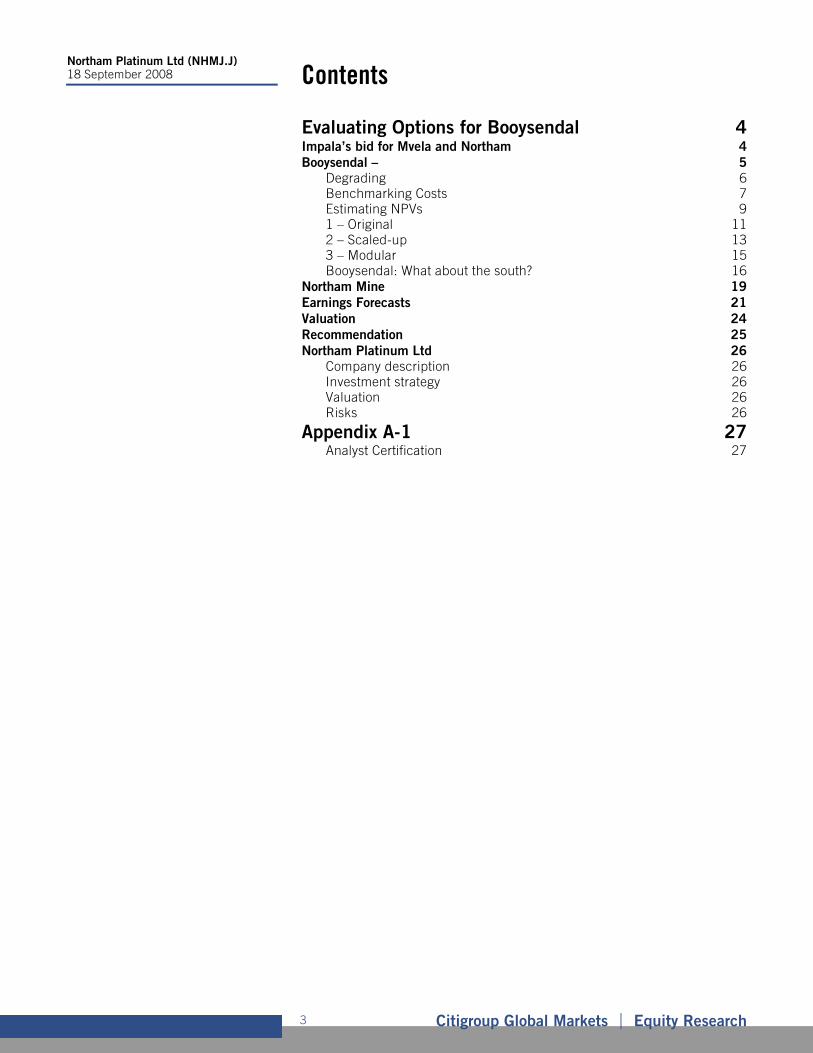
Price Performance (RIC: NHMJ.J, BB: NHM SJ)
See Appendix A-1 for Analyst Certification and important disclosures.
Simon Anderssen1 +27-11-944-0817 [email protected]
Gerhard Engelbrecht1 +27-11-944-0820 [email protected]
Target price change Estimate change
Northam Platinum Ltd (NHMJ.J) 18 September 2008
Citigroup Global Markets Equity Research 2
Fiscal year end 30-Jun 2007 2008 2009E 2010E 2011E
Valuation RatiosP/E adjusted (x) 9.4 8.3 16.6 18.5 18.1EV/EBITDA adjusted (x) 8.2 7.1 10.4 10.9 10.7P/BV (x) 5.1 4.2 1.9 1.9 1.8Dividend yield (%) 10.2 8.2 3.0 2.7 2.8Per Share Data (R)EPS adjusted 5.48 6.21 3.10 2.78 2.85EPS reported 5.48 6.21 3.10 2.78 2.85BVPS 10.06 12.20 26.82 26.68 28.13DPS 5.26 4.25 1.55 1.39 1.43
Profit & Loss (RM)Net sales 3,740 3,886 3,689 3,724 3,881Operating expenses -1,728 -1,609 -2,207 -2,327 -2,434EBIT 2,012 2,277 1,482 1,397 1,446Net interest expense 84 98 149 153 141Non-operating/exceptionals 5 -16 -60 -107 -110Pre-tax profit 2,101 2,359 1,571 1,443 1,477Tax -775 -866 -483 -404 -414Extraord./Min.Int./Pref.div. 0 0 -30 -31 -31Reported net income 1,326 1,493 1,059 1,008 1,033Adjusted earnings 1,326 1,493 1,059 1,008 1,033Adjusted EBITDA 2,141 2,427 1,638 1,556 1,606Growth Rates (%)Sales 56.7 3.9 -5.1 1.0 4.2EBIT adjusted 99.0 13.2 -34.9 -5.8 3.5EBITDA adjusted 90.2 13.4 -32.5 -5.0 3.2EPS adjusted 86.7 13.3 -50.1 -10.1 2.4
Cash Flow (RM)Operating cash flow 1,555 1,565 1,292 1,255 1,489Depreciation/amortization 129 149 155 159 159Net working capital -99 -230 212 -3 -14Investing cash flow -212 -264 -340 -656 -1,300Capital expenditure -188 -265 -340 -656 -1,300Acquisitions/disposals -24 1 -6,050 0 0Financing cash flow -965 -993 -909 -518 -510Borrowings 0 0 0 0 0Dividends paid -969 -1,009 -909 -518 -510Change in cash 379 309 43 82 -321
Balance Sheet (RM)Total assets 3,334 4,120 10,110 10,706 11,565Cash & cash equivalent 1,210 1,500 1,489 1,570 1,250Accounts receivable 269 359 185 186 194Net fixed assets 1,536 1,684 7,932 8,441 9,594Total liabilities 953 1,216 1,006 1,111 1,447Accounts payable 211 323 288 291 303Total Debt 0 0 0 0 0Shareholders' funds 2,381 2,905 9,105 9,595 10,118
Profitability/Solvency Ratios (%)EBITDA margin adjusted 57.2 62.4 44.4 41.8 41.4ROE adjusted 60.6 56.5 17.6 10.8 10.5ROIC adjusted 80.3 84.5 20.2 11.9 11.2Net debt to equity -50.8 -51.7 -16.4 -16.4 -12.4Total debt to capital 0.0 0.0 0.0 0.0 0.0
For further data queries on Citi's full coverage universe please contact CIR Data Services Europe at [email protected] or +44-207-986-4050
Northam Platinum Ltd (NHMJ.J) 18 September 2008
Citigroup Global Markets Equity Research 3
Evaluating Options for Booysendal 4 Impala’s bid for Mvela and Northam 4 Booysendal – 5
Degrading 6 Benchmarking Costs 7 Estimating NPVs 9 1 – Original 11 2 – Scaled-up 13 3 – Modular 15 Booysendal: What about the south? 16
Northam Mine 19 Earnings Forecasts 21 Valuation 24 Recommendation 25 Northam Platinum Ltd 26
Company description 26 Investment strategy 26 Valuation 26 Risks 26
Appendix A-1 27 Analyst Certification 27
Contents
Northam Platinum Ltd (NHMJ.J) 18 September 2008
Citigroup Global Markets Equity Research 4
This report evaluates, in detail, both Northam Mine and various options available to develop the company’s Booysendal project. We establish NPVs for these assets of R25.29/share and R16.14/share respectively, and an NPV for the company of R43.96. We set our target price at R44. In addition, we estimate corporate activity relating to the southern section of Booysendal could add a further R5/share to this value. We highlight that the 26% downgrade to the PGM basket price is expected to contribute to a 50% decline in EPS to R3.10 in FY09 and maintain a Sell/High Risk (3H) recommendation on Northam.
This report contains a detailed analysis of various development options for Booysendal, followed by a review of Northam Mine and the company’s financial position. However, we begin by addressing Impala’s pending bid for Northam and its parent Mvela Resources, and possible headwinds such an offer could face from regulators.
Impala’s bid for Mvela and Northam
On Friday 12 September, Impala Platinum, Mvela Resources (Mvela) and Northam Platinum issued cautionary announcements indicating that they were in discussions which could lead to Impala acquiring the entire share capital of Mvela and Northam. No further details were provided. Northam’s share price jumped 18.8% on the day, but has retracted slightly and currently trades at R51.51, a 12% premium to its closing level on Thursday 11 September.
Northam’s shares therefore trade at a premium to our target price (R44) and since an offer from Impala is likely to be at a premium to the current market price, a bid from Impala would probably be value accretive to Northam shareholders.
However, any transaction will need competition and DME approval and we anticipate the following factors will be relevant considerations:
Security of Anglo Platinum’s mining rights: Mvela Resources’ acquisition of Booysendal was subject to specific undertakings limiting changes to the company’s shareholder structure that could compromise Anglo Platinum’s security of tenure for its remaining mineral rights. It is unclear whether Anglo Platinum’s new order mining licences granted in April 2008, partly a result of the discounted sale of assets (including Booysendal) to HDP entities (including Mvela Resources), have been legally secured.
If Mvela were to breach any of its undertakings, it will be deemed to offer 50% of its Northam shares to Anglo Platinum at a 25-50% discount to their market value.
Competition and market concentration: Impala’s proposed acquisition would increase the concentration of control of PGM resources (and production) held by the industry’s three largest producers: Anglo Platinum, Impala and Lonmin. We estimate that the transaction would increase Impala’s control of PGM resources from 19% to 27% and the concentration of resource held by the three largest companies from 75% to 82%.
Evaluating Options for Booysendal
Mvela holds 62.8% of Northam
Northam Platinum Ltd (NHMJ.J) 18 September 2008
Citigroup Global Markets Equity Research 5
Objectives of MPRDA: The Mineral and Petroleum Resources Development Act (MPRDA) outlines the conditions for conversion of old-order minerals with a primary objective to “substantially and meaningful expand opportunities for HDPs”. Mvela Resources acquired Booysendal under the auspices of becoming “the only, full independent, black-owned and controlled, fully-integrated PGE producer, with substantial life”, in line with the MPRDA objectives. Regulatory approval of a bid from Impala, particularly a cash bid, could therefore be seen to undermine these objectives.
State of the industry: Although PGM prices have declined 40-55% since the beginning of July 2008, the rand basket price in the month preceding Mvela’s acquisition of control of Booysendal (4 September 2007) was only 4.4% lower than on the day Impala issued its cautionary. While capital costs have increased significantly (35%), we expect Northam to earn an EBIT margin of 40% in FY09 (from 59% in FY08), well above its historical average of 28%. We also anticipate Northam will be able to fund development of Booysendal using internal cash flows from Northam and limited bridging finance.
Booysendal – Where to from here?
As a new and shallow operation, Booysendal has the potential to redefine Northam’s existing risk and cost profile. However, after having scaled up its original production profile for Booysendal (from 240ktpm to 400ktpm), management appeared to backtrack somewhat at the recent results presentation suggesting that a “modular production build-up in 120ktpm units” would mitigate the water and power risks affecting this project.
While this may be true, from a valuation perspective, delayed production translated into delayed value which negatively impacts the project's NPV and, we would argue, the company’s fundamental value.
This is particularly relevant in the case of Booysendal, given that Northam will have the additional “sunk” cost considerations to evaluate as it will need to establish significant infrastructure (utilities, roads, housing) as the first major operation in the topographically challenging southern region of the eastern limb. This implies that the project’s value could benefit from economies of scale as a portion of the initial capital is fixed.
That being so, availability of water and power is a binding constraint, without which the mine cannot produce, irrespective of its “design capacity”. From this perspective, it is prudent to reduce the project's operational risk by phasing in production capacity in line with the commissioning of the De Hoop dam (expected 2013) and taking into account Eskom’s capacity build-up schedule.
Therefore, given the uncertainty of Booysendal’s exact project parameters, we evaluate three scenarios as a guide to the project's underlying value:
Scaled-up: At 480ktpm by 2017, this scenario in our view represents a cap to Booysendal’s valuation.
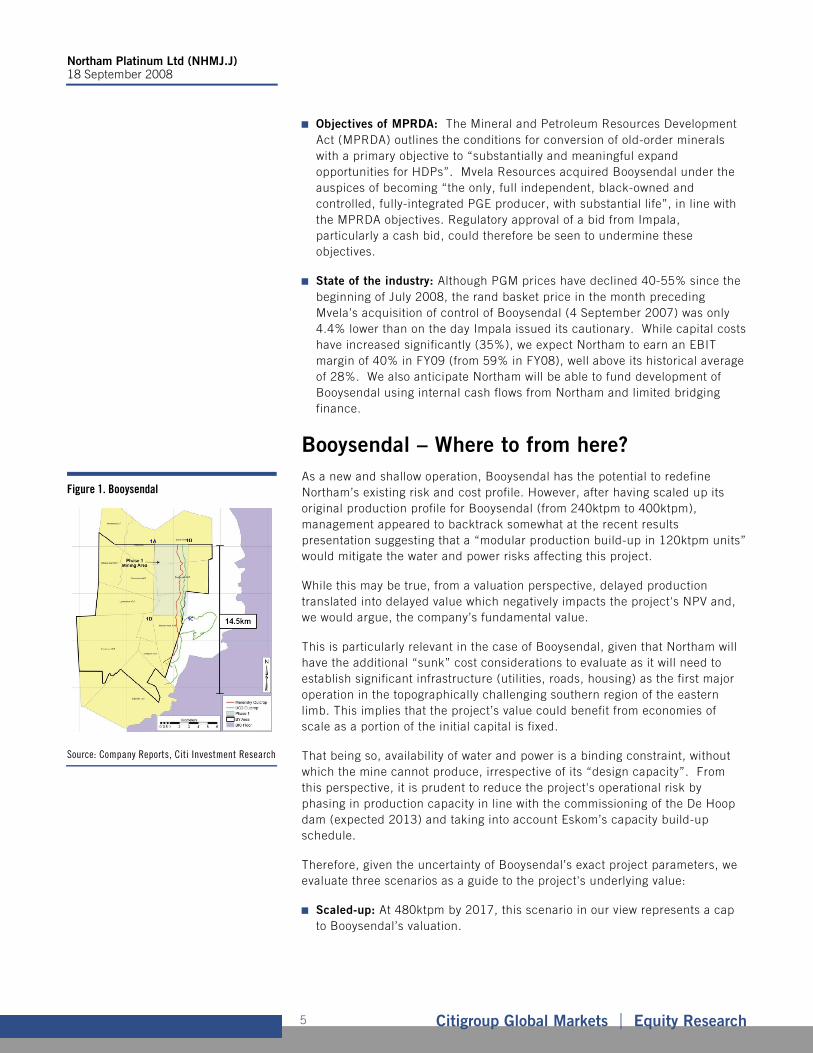
Figure 1. Booysendal
Source: Company Reports, Citi Investment Research
Northam Platinum Ltd (NHMJ.J) 18 September 2008
Citigroup Global Markets Equity Research 6
Original: Follows Northam’s initial guidance for a 240ktpm operation.
Modular: As mentioned above, Northam’s management recently alluded to a modular-type production build-up and we simulate such a scenario.
Degrading Resource
At the time the original transaction was announced in September 2007, Booysendal’s resource was estimated at 113m PGM ounces (89% Inferred). However, following an independent study1, the resource of the Booysendal area was estimated to be only 94m PGM oz due to greater geological losses in the southern portion of property. As a result, the property was augmented in the north by an additional strip of Der Brochen, adding 1.3km to the original strike length of the property and 9.8m PGM ounces.
Underlying the change in resource has been a material decline in grades. For instance, the average Measured resource grade has declined 23%: from 5.64g/t to 4.37g/t in Merensky and 5.02g/t to 3.82g/t in UG2.
This is significant and we estimate that in each of the NPV calculations below, this change alone almost halves the NPVs.
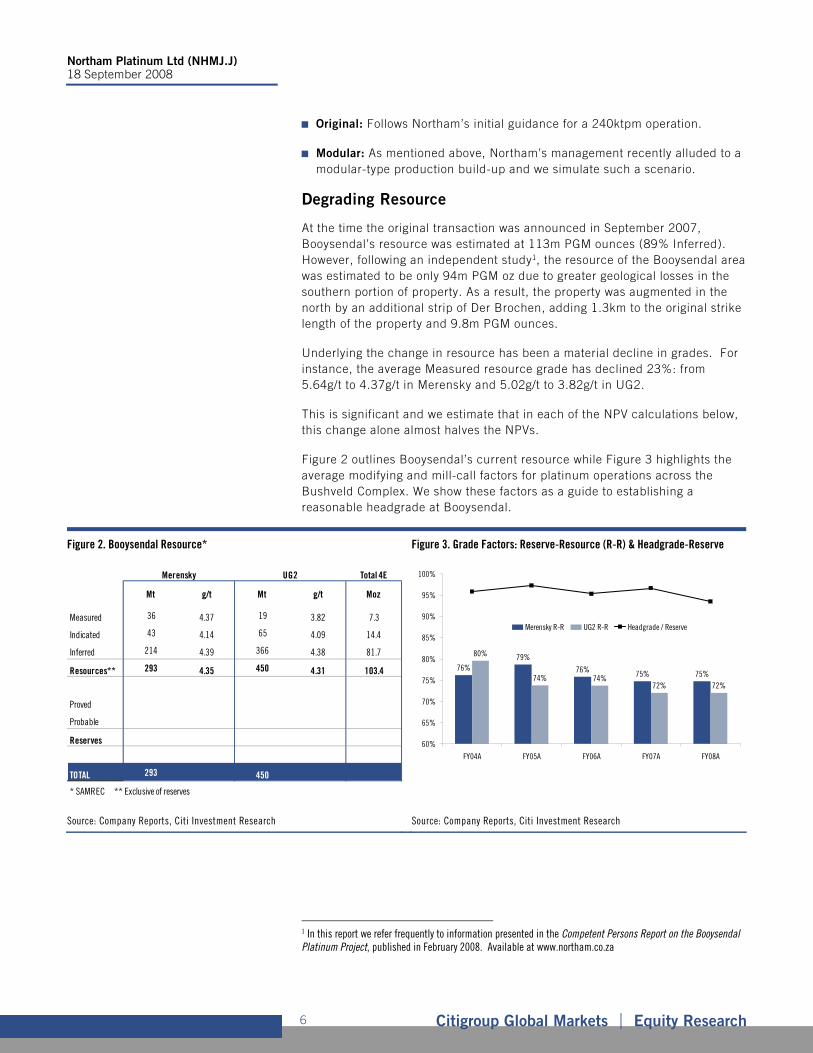
Figure 2 outlines Booysendal’s current resource while Figure 3 highlights the average modifying and mill-call factors for platinum operations across the Bushveld Complex. We show these factors as a guide to establishing a reasonable headgrade at Booysendal.
Figure 2. Booysendal Resource* Figure 3. Grade Factors: Reserve-Resource (R-R) & Headgrade-Reserve
Total 4E
Mt g/t Mt g/t Moz
Measured 36 4.37 19 3.82 7.3
Indicated 43 4.14 65 4.09 14.4
Inferred 214 4.39 366 4.38 81.7
Resources** 293 4.35 450 4.31 103.4
Proved
Probable
Reserves
TOTAL 293 450
* SAMREC ** Exclusive of reserves
Merensky UG2
76%79%
76% 75% 75%
80%
74% 74%72% 72%
60%
65%
70%
75%
80%
85%
90%
95%
100%
FY04A FY05A FY06A FY07A FY08A
Merensky R-R UG2 R-R Headgrade / Reserve
Source: Company Reports, Citi Investment Research Source: Company Reports, Citi Investment Research
1 In this report we refer frequently to information presented in the Competent Persons Report on the Booysendal Platinum Project, published in February 2008. Available at www.northam.co.za
Northam Platinum Ltd (NHMJ.J) 18 September 2008
Citigroup Global Markets Equity Research 7
For instance, in FY08 the average Merensky (UG2) reserve grade was only 75% (72%) of the resource grade and the headgrade was diluted by a further 6% (compared to the implied reserve grade). Therefore, if the average Merensky resource grade was 5g/t, the average headgrade would be only 3.53g/t.
Benchmarking Costs
Operating and capital costs are crucial considerations when calculating NPVs for the above scenarios. Although it is simplistic to commoditise concentrators or other capital items, we have little alternative given that a bankable feasibility study is only due 2H09. As such, we benchmark the three significant cost categories against recent performance and published information in order to estimate achievable costs targets. The three categories are: operating costs, ongoing capex and expansion capex.
Operating Costs
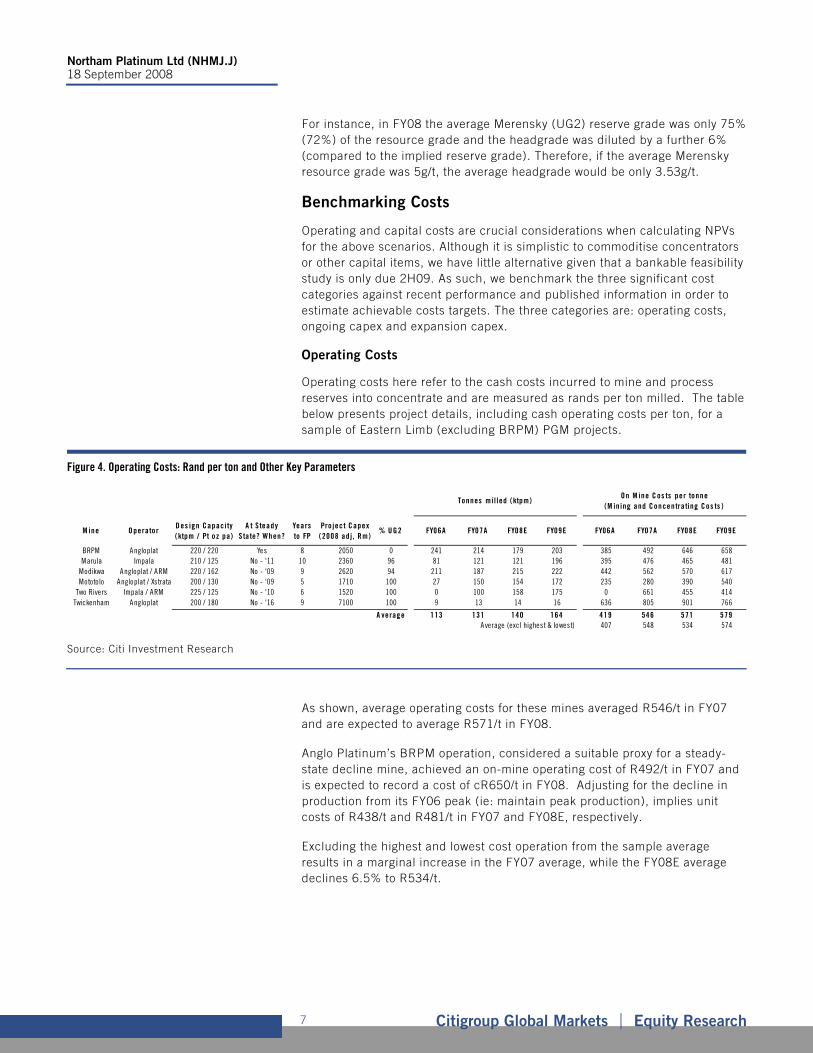
Operating costs here refer to the cash costs incurred to mine and process reserves into concentrate and are measured as rands per ton milled. The table below presents project details, including cash operating costs per ton, for a sample of Eastern Limb (excluding BRPM) PGM projects.
Figure 4. Operating Costs: Rand per ton and Other Key Parameters
M ine O peratorD es ign Capacity (ktpm / Pt oz pa)
A t S teady State? When?
Years to FP
Project Capex ( 2008 ad j, Rm)
% U G2 FY06A FY07A FY08E FY09E FY06A FY07A FY08E FY09E
BRPM Angloplat 220 / 220 Yes 8 2050 0 241 214 179 203 385 492 646 658Marula Impala 210 / 125 No - '11 10 2360 96 81 121 121 196 395 476 465 481
Modikwa Angloplat / ARM 220 / 162 No - '09 9 2620 94 211 187 215 222 442 562 570 617Mototolo Angloplat / Xstrata 200 / 130 No - '09 5 1710 100 27 150 154 172 235 280 390 540
Two Rivers Impala / ARM 225 / 125 No - '10 6 1520 100 0 100 158 175 0 661 455 414Twickenham Angloplat 200 / 180 No - '16 9 7100 100 9 13 14 16 636 805 901 766
A verage 113 131 140 164 419 546 571 579Average (excl highest & lowest) 407 548 534 574
On M ine C os ts per tonne (M in ing and Concentrating Cos ts )
Tonnes mi l led (ktpm)
Source: Citi Investment Research
As shown, average operating costs for these mines averaged R546/t in FY07 and are expected to average R571/t in FY08.
Anglo Platinum’s BRPM operation, considered a suitable proxy for a steady-state decline mine, achieved an on-mine operating cost of R492/t in FY07 and is expected to record a cost of cR650/t in FY08. Adjusting for the decline in production from its FY06 peak (ie: maintain peak production), implies unit costs of R438/t and R481/t in FY07 and FY08E, respectively.
Excluding the highest and lowest cost operation from the sample average results in a marginal increase in the FY07 average, while the FY08E average declines 6.5% to R534/t.
Northam Platinum Ltd (NHMJ.J) 18 September 2008
Citigroup Global Markets Equity Research 8
In presentations outlining the original (240ktpm) and then the 400ktpm proposed operations at Booysendal, Northam guided towards operating costs (in 2007 real terms) of R301/t and R378/t (including smelting and refining), respectively.
From the table above, these costs appear out of line with actual costs of production achieved across similar operations. We therefore suggest that realistic operating costs are likely to be higher than those indicated by the company.
We also highlight that the time from project approval to full production is typically longer than six years and that the average standalone operation is designed to operate at a capacity between 200 and 250ktpm.
Ongoing Capex
Ongoing, or maintenance, capex is capital expenditure on infrastructure or equipment necessary to sustain output at existing levels.
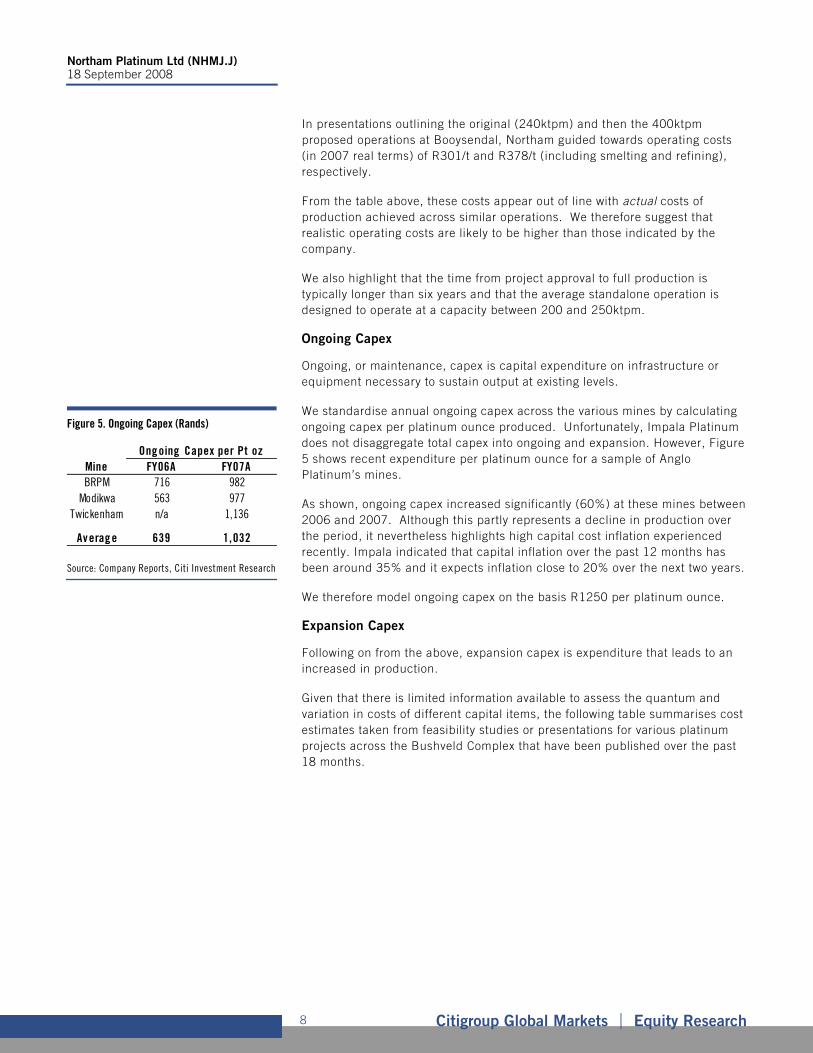
We standardise annual ongoing capex across the various mines by calculating ongoing capex per platinum ounce produced. Unfortunately, Impala Platinum does not disaggregate total capex into ongoing and expansion. However, Figure 5 shows recent expenditure per platinum ounce for a sample of Anglo Platinum’s mines.
As shown, ongoing capex increased significantly (60%) at these mines between 2006 and 2007. Although this partly represents a decline in production over the period, it nevertheless highlights high capital cost inflation experienced recently. Impala indicated that capital inflation over the past 12 months has been around 35% and it expects inflation close to 20% over the next two years.
We therefore model ongoing capex on the basis R1250 per platinum ounce.
Expansion Capex
Following on from the above, expansion capex is expenditure that leads to an increased in production.
Given that there is limited information available to assess the quantum and variation in costs of different capital items, the following table summarises cost estimates taken from feasibility studies or presentations for various platinum projects across the Bushveld Complex that have been published over the past 18 months.
Figure 5. Ongoing Capex (Rands)
Mine FY06A FY07ABRPM 716 982
Modikwa 563 977Twickenham n/a 1,136
Averag e 639 1,032
Ong oing Capex per Pt oz
Source: Company Reports, Citi Investment Research
Northam Platinum Ltd (NHMJ.J) 18 September 2008
Citigroup Global Markets Equity Research 9
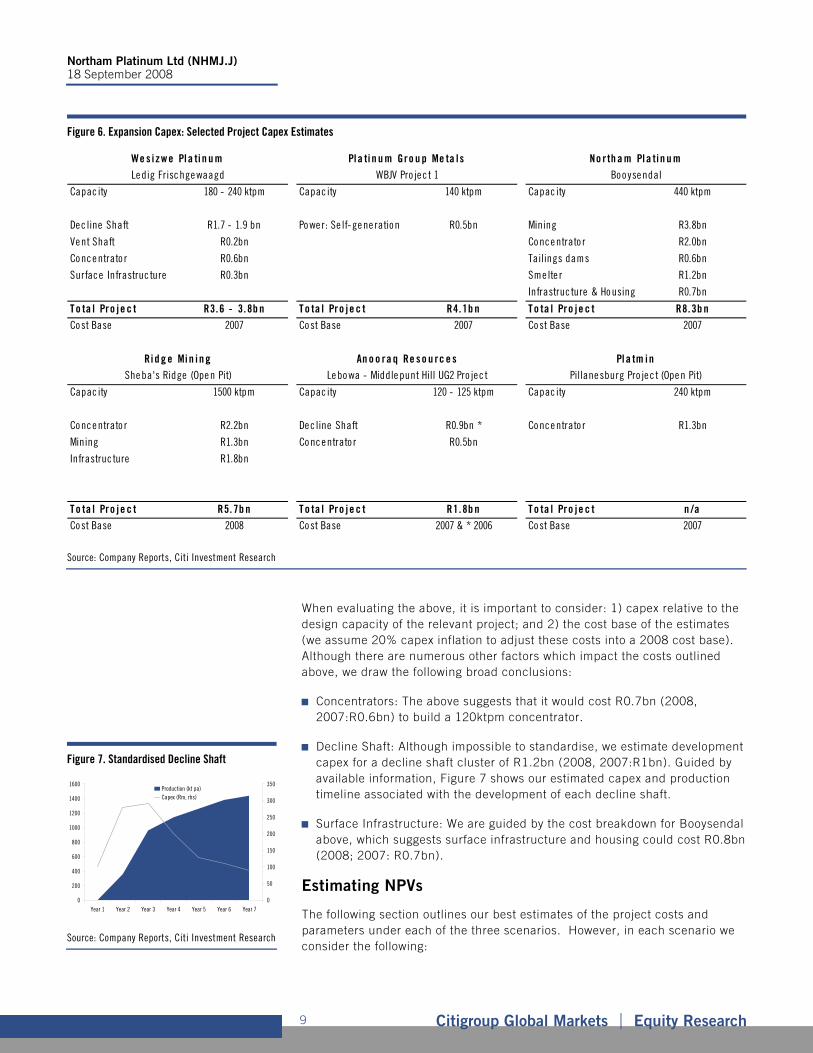
Figure 6. Expansion Capex: Selected Project Capex Estimates
Capac ity 180 - 240 ktpm Capac ity 140 ktpm Capac ity 440 ktpm
Dec line Shaft R1.7 - 1.9 bn Po we r: Se lf-ge ne ration R0.5bn Mining R3.8bn
Vent Shaft R0.2bn Co nce ntrato r R2.0bn
Conc e ntrato r R0.6bn Tailings dams R0.6bn
Surface Infrastruc ture R0.3bn Sme lte r R1.2bn
Infrastruc ture & Ho using R0.7bn
T o ta l Pro j e c t R3.6 - 3.8b n T o ta l Pro j e c t R4.1b n T o ta l Pro je c t R8.3b nCost Base 2007 Co st Base 2007 Co st Base 2007
Capac ity 1500 ktpm Capac ity 120 - 125 ktpm Capac ity 240 ktpm
Conc e ntrato r R2.2bn De c line Shaft R0.9bn * Co nce ntrato r R1.3bn
Mining R1.3bn Co nc e ntrato r R0.5bn
Infrastruc ture R1.8bn
T o ta l Pro j e c t R5. 7b n T o ta l Pro j e c t R1.8b n T o ta l Pro je c t n /aCost Base 2008 Co st Base 2007 & * 2006 Co st Base 2007
Pl a tm i nPillanesburg Pro je c t (Ope n Pit)
No rth a m Pl a tin u mBoo yse ndal
Ri d g e Mi n i n gShe ba's Ridge (Ope n Pit)
An o o ra q Re s o u rc e sLe bo wa - Middle punt Hill UG2 Pro jec t
We s iz we Pla ti n u mLe dig Frisc hge waagd
Pla ti n u m Gro u p Me ta l sWBJV Pro je c t 1
Source: Company Reports, Citi Investment Research
When evaluating the above, it is important to consider: 1) capex relative to the design capacity of the relevant project; and 2) the cost base of the estimates (we assume 20% capex inflation to adjust these costs into a 2008 cost base). Although there are numerous other factors which impact the costs outlined above, we draw the following broad conclusions:
Concentrators: The above suggests that it would cost R0.7bn (2008, 2007:R0.6bn) to build a 120ktpm concentrator.
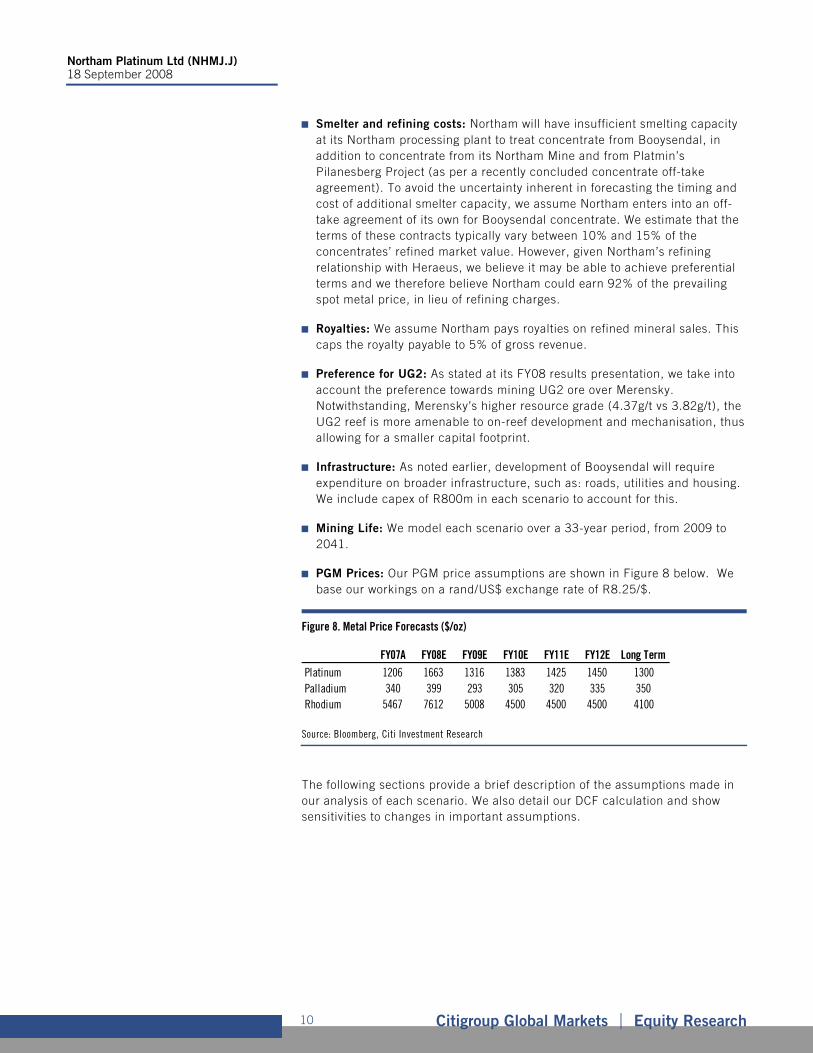
Decline Shaft: Although impossible to standardise, we estimate development capex for a decline shaft cluster of R1.2bn (2008, 2007:R1bn). Guided by available information, Figure 7 shows our estimated capex and production timeline associated with the development of each decline shaft.
Surface Infrastructure: We are guided by the cost breakdown for Booysendal above, which suggests surface infrastructure and housing could cost R0.8bn (2008; 2007: R0.7bn).
Estimating NPVs
The following section outlines our best estimates of the project costs and parameters under each of the three scenarios. However, in each scenario we consider the following:
Figure 7. Standardised Decline Shaft
0
200
400
600
800
1000
1200
1400
1600
Year 1 Year 2 Year 3 Year 4 Year 5 Year 6 Year 70
50
100
150
200
250
300
350Production (kt pa)Capex (Rm, rhs)
Source: Company Reports, Citi Investment Research
Northam Platinum Ltd (NHMJ.J) 18 September 2008
Citigroup Global Markets Equity Research 10
Smelter and refining costs: Northam will have insufficient smelting capacity at its Northam processing plant to treat concentrate from Booysendal, in addition to concentrate from its Northam Mine and from Platmin’s Pilanesberg Project (as per a recently concluded concentrate off-take agreement). To avoid the uncertainty inherent in forecasting the timing and cost of additional smelter capacity, we assume Northam enters into an off-take agreement of its own for Booysendal concentrate. We estimate that the terms of these contracts typically vary between 10% and 15% of the concentrates’ refined market value. However, given Northam’s refining relationship with Heraeus, we believe it may be able to achieve preferential terms and we therefore believe Northam could earn 92% of the prevailing spot metal price, in lieu of refining charges.
Royalties: We assume Northam pays royalties on refined mineral sales. This caps the royalty payable to 5% of gross revenue.
Preference for UG2: As stated at its FY08 results presentation, we take into account the preference towards mining UG2 ore over Merensky. Notwithstanding, Merensky’s higher resource grade (4.37g/t vs 3.82g/t), the UG2 reef is more amenable to on-reef development and mechanisation, thus allowing for a smaller capital footprint.
Infrastructure: As noted earlier, development of Booysendal will require expenditure on broader infrastructure, such as: roads, utilities and housing. We include capex of R800m in each scenario to account for this.
Mining Life: We model each scenario over a 33-year period, from 2009 to 2041.
PGM Prices: Our PGM price assumptions are shown in Figure 8 below. We base our workings on a rand/US$ exchange rate of R8.25/$.
Figure 8. Metal Price Forecasts ($/oz)
FY07A FY08E FY09E FY10E FY11E FY12E Long TermPlatinum 1206 1663 1316 1383 1425 1450 1300Palladium 340 399 293 305 320 335 350Rhodium 5467 7612 5008 4500 4500 4500 4100
Source: Bloomberg, Citi Investment Research
The following sections provide a brief description of the assumptions made in our analysis of each scenario. We also detail our DCF calculation and show sensitivities to changes in important assumptions.
Northam Platinum Ltd (NHMJ.J) 18 September 2008
Citigroup Global Markets Equity Research 11
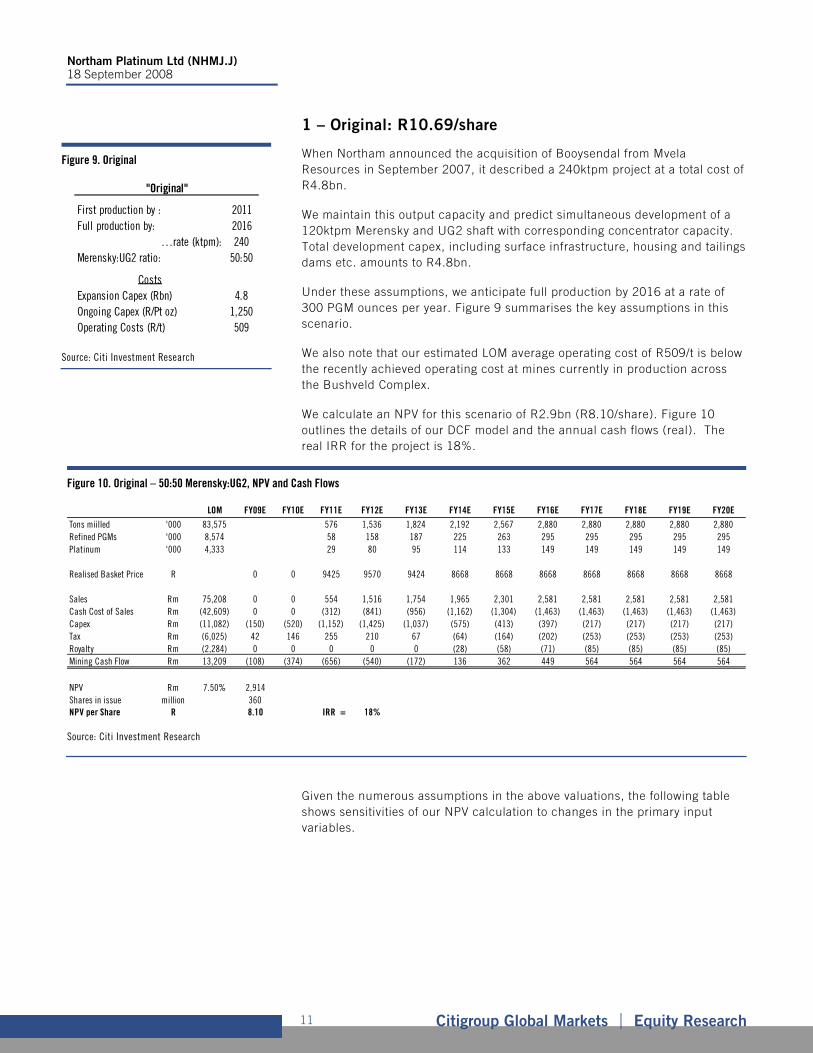
1 – Original: R10.69/share
When Northam announced the acquisition of Booysendal from Mvela Resources in September 2007, it described a 240ktpm project at a total cost of R4.8bn.
We maintain this output capacity and predict simultaneous development of a 120ktpm Merensky and UG2 shaft with corresponding concentrator capacity. Total development capex, including surface infrastructure, housing and tailings dams etc. amounts to R4.8bn.
Under these assumptions, we anticipate full production by 2016 at a rate of 300 PGM ounces per year. Figure 9 summarises the key assumptions in this scenario.
We also note that our estimated LOM average operating cost of R509/t is below the recently achieved operating cost at mines currently in production across the Bushveld Complex.
We calculate an NPV for this scenario of R2.9bn (R8.10/share). Figure 10 outlines the details of our DCF model and the annual cash flows (real). The real IRR for the project is 18%.
Figure 10. Original – 50:50 Merensky:UG2, NPV and Cash Flows
LOM FY09E FY10E FY11E FY12E FY13E FY14E FY15E FY16E FY17E FY18E FY19E FY20E
Tons miilled '000 83,575 576 1,536 1,824 2,192 2,567 2,880 2,880 2,880 2,880 2,880Refined PGMs '000 8,574 58 158 187 225 263 295 295 295 295 295Platinum '000 4,333 29 80 95 114 133 149 149 149 149 149
Realised Basket Price R 0 0 9425 9570 9424 8668 8668 8668 8668 8668 8668 8668
Sales Rm 75,208 0 0 554 1,516 1,754 1,965 2,301 2,581 2,581 2,581 2,581 2,581Cash Cost of Sales Rm (42,609) 0 0 (312) (841) (956) (1,162) (1,304) (1,463) (1,463) (1,463) (1,463) (1,463)Capex Rm (11,082) (150) (520) (1,152) (1,425) (1,037) (575) (413) (397) (217) (217) (217) (217)Tax Rm (6,025) 42 146 255 210 67 (64) (164) (202) (253) (253) (253) (253)Royalty Rm (2,284) 0 0 0 0 0 (28) (58) (71) (85) (85) (85) (85)Mining Cash Flow Rm 13,209 (108) (374) (656) (540) (172) 136 362 449 564 564 564 564
NPV Rm 7.50% 2,914Shares in issue million 360NPV per Share R 8.10 IRR = 18%
Source: Citi Investment Research
Given the numerous assumptions in the above valuations, the following table shows sensitivities of our NPV calculation to changes in the primary input variables.
Figure 9. Original
First production by : 2011Full production by: 2016
…rate (ktpm): 240Merensky:UG2 ratio: 50:50
CostsExpansion Capex (Rbn) 4.8Ongoing Capex (R/Pt oz) 1,250Operating Costs (R/t) 509
"Original"
Source: Citi Investment Research
Northam Platinum Ltd (NHMJ.J) 18 September 2008
Citigroup Global Markets Equity Research 12
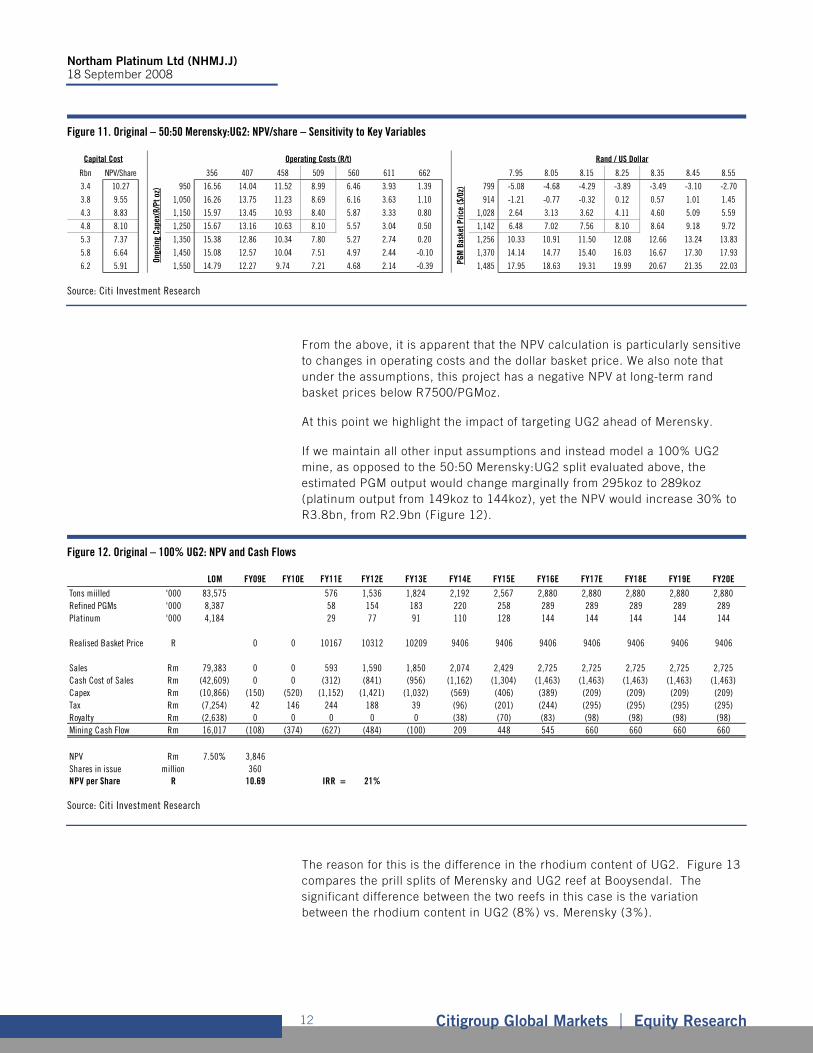
Figure 11. Original – 50:50 Merensky:UG2: NPV/share – Sensitivity to Key Variables
Rbn NPV/Share 356 407 458 509 560 611 662 7.95 8.05 8.15 8.25 8.35 8.45 8.55
3.4 10.27 950 16.56 14.04 11.52 8.99 6.46 3.93 1.39 799 -5.08 -4.68 -4.29 -3.89 -3.49 -3.10 -2.70
3.8 9.55 1,050 16.26 13.75 11.23 8.69 6.16 3.63 1.10 914 -1.21 -0.77 -0.32 0.12 0.57 1.01 1.45
4.3 8.83 1,150 15.97 13.45 10.93 8.40 5.87 3.33 0.80 1,028 2.64 3.13 3.62 4.11 4.60 5.09 5.59
4.8 8.10 1,250 15.67 13.16 10.63 8.10 5.57 3.04 0.50 1,142 6.48 7.02 7.56 8.10 8.64 9.18 9.72
5.3 7.37 1,350 15.38 12.86 10.34 7.80 5.27 2.74 0.20 1,256 10.33 10.91 11.50 12.08 12.66 13.24 13.83
5.8 6.64 1,450 15.08 12.57 10.04 7.51 4.97 2.44 -0.10 1,370 14.14 14.77 15.40 16.03 16.67 17.30 17.93
6.2 5.91 1,550 14.79 12.27 9.74 7.21 4.68 2.14 -0.39 1,485 17.95 18.63 19.31 19.99 20.67 21.35 22.03
Capital CostOn
goin
g Ca
pex(
R/Pt
oz)
Operating Costs (R/t) Rand / US Dollar
PGM
Bas
ket P
rice
($/0
z)
Source: Citi Investment Research
From the above, it is apparent that the NPV calculation is particularly sensitive to changes in operating costs and the dollar basket price. We also note that under the assumptions, this project has a negative NPV at long-term rand basket prices below R7500/PGMoz.
At this point we highlight the impact of targeting UG2 ahead of Merensky.
If we maintain all other input assumptions and instead model a 100% UG2 mine, as opposed to the 50:50 Merensky:UG2 split evaluated above, the estimated PGM output would change marginally from 295koz to 289koz (platinum output from 149koz to 144koz), yet the NPV would increase 30% to R3.8bn, from R2.9bn (Figure 12).
Figure 12. Original – 100% UG2: NPV and Cash Flows
LOM FY09E FY10E FY11E FY12E FY13E FY14E FY15E FY16E FY17E FY18E FY19E FY20E
Tons miilled '000 83,575 576 1,536 1,824 2,192 2,567 2,880 2,880 2,880 2,880 2,880Refined PGMs '000 8,387 58 154 183 220 258 289 289 289 289 289Platinum '000 4,184 29 77 91 110 128 144 144 144 144 144
Realised Basket Price R 0 0 10167 10312 10209 9406 9406 9406 9406 9406 9406 9406
Sales Rm 79,383 0 0 593 1,590 1,850 2,074 2,429 2,725 2,725 2,725 2,725 2,725Cash Cost of Sales Rm (42,609) 0 0 (312) (841) (956) (1,162) (1,304) (1,463) (1,463) (1,463) (1,463) (1,463)Capex Rm (10,866) (150) (520) (1,152) (1,421) (1,032) (569) (406) (389) (209) (209) (209) (209)Tax Rm (7,254) 42 146 244 188 39 (96) (201) (244) (295) (295) (295) (295)Royalty Rm (2,638) 0 0 0 0 0 (38) (70) (83) (98) (98) (98) (98)Mining Cash Flow Rm 16,017 (108) (374) (627) (484) (100) 209 448 545 660 660 660 660
NPV Rm 7.50% 3,846Shares in issue million 360NPV per Share R 10.69 IRR = 21%
Source: Citi Investment Research
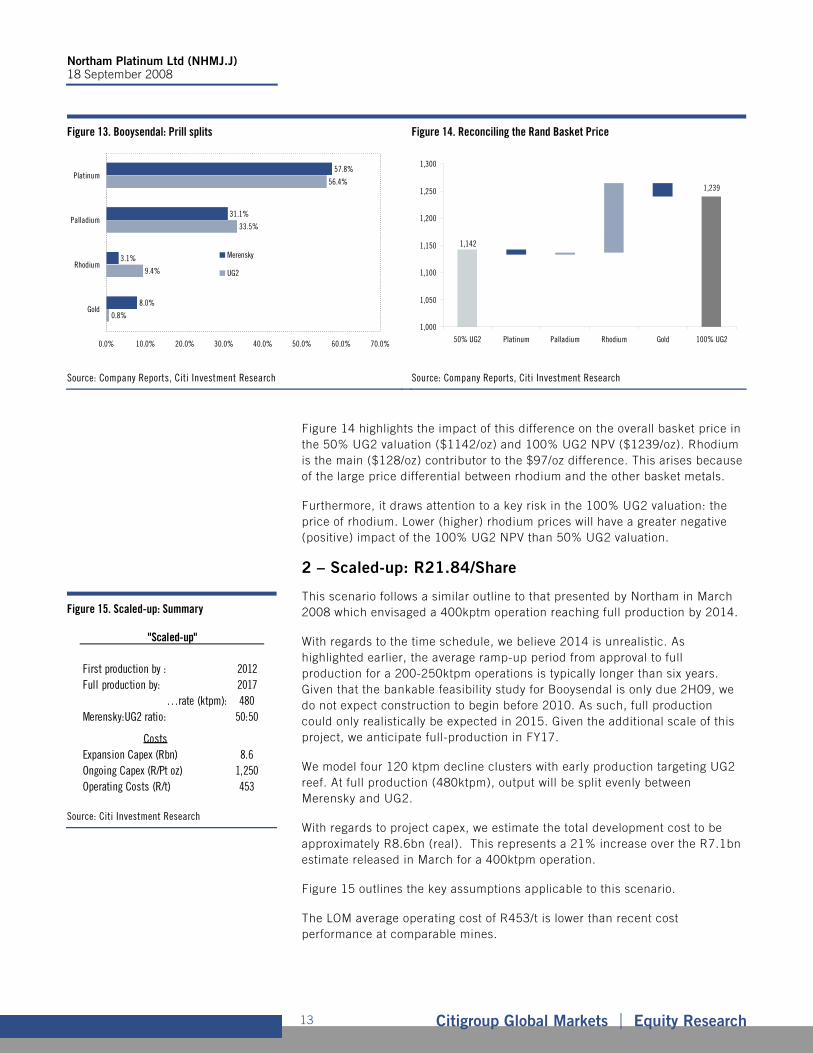
The reason for this is the difference in the rhodium content of UG2. Figure 13 compares the prill splits of Merensky and UG2 reef at Booysendal. The significant difference between the two reefs in this case is the variation between the rhodium content in UG2 (8%) vs. Merensky (3%).
Northam Platinum Ltd (NHMJ.J) 18 September 2008
Citigroup Global Markets Equity Research 13
Figure 13. Booysendal: Prill splits Figure 14. Reconciling the Rand Basket Price
57.8%
31.1%
3.1%
8.0%
56.4%
33.5%
9.4%
0.8%
0.0% 10.0% 20.0% 30.0% 40.0% 50.0% 60.0% 70.0%
Platinum
Palladium
Rhodium
Gold
Merensky
UG2
1,142
1,239
1,000
1,050
1,100
1,150
1,200
1,250
1,300
50% UG2 Platinum Palladium Rhodium Gold 100% UG2
Source: Company Reports, Citi Investment Research Source: Company Reports, Citi Investment Research
Figure 14 highlights the impact of this difference on the overall basket price in the 50% UG2 valuation ($1142/oz) and 100% UG2 NPV ($1239/oz). Rhodium is the main ($128/oz) contributor to the $97/oz difference. This arises because of the large price differential between rhodium and the other basket metals.
Furthermore, it draws attention to a key risk in the 100% UG2 valuation: the price of rhodium. Lower (higher) rhodium prices will have a greater negative (positive) impact of the 100% UG2 NPV than 50% UG2 valuation.
2 – Scaled-up: R21.84/Share
This scenario follows a similar outline to that presented by Northam in March 2008 which envisaged a 400kptm operation reaching full production by 2014.
With regards to the time schedule, we believe 2014 is unrealistic. As highlighted earlier, the average ramp-up period from approval to full production for a 200-250ktpm operations is typically longer than six years. Given that the bankable feasibility study for Booysendal is only due 2H09, we do not expect construction to begin before 2010. As such, full production could only realistically be expected in 2015. Given the additional scale of this project, we anticipate full-production in FY17.
We model four 120 ktpm decline clusters with early production targeting UG2 reef. At full production (480ktpm), output will be split evenly between Merensky and UG2.
With regards to project capex, we estimate the total development cost to be approximately R8.6bn (real). This represents a 21% increase over the R7.1bn estimate released in March for a 400ktpm operation.
Figure 15 outlines the key assumptions applicable to this scenario.
The LOM average operating cost of R453/t is lower than recent cost performance at comparable mines.
Figure 15. Scaled-up: Summary
First production by : 2012Full production by: 2017
…rate (ktpm): 480Merensky:UG2 ratio: 50:50
CostsExpansion Capex (Rbn) 8.6Ongoing Capex (R/Pt oz) 1,250Operating Costs (R/t) 453
"Scaled-up"
Source: Citi Investment Research
Northam Platinum Ltd (NHMJ.J) 18 September 2008
Citigroup Global Markets Equity Research 14
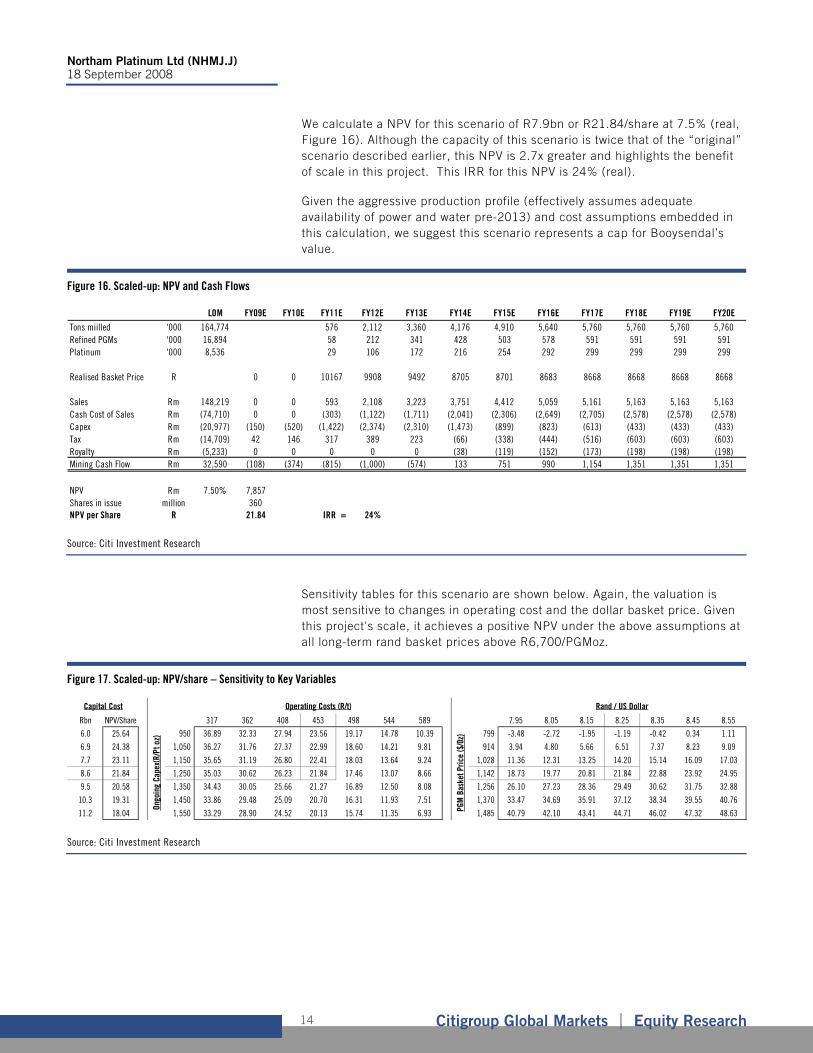
We calculate a NPV for this scenario of R7.9bn or R21.84/share at 7.5% (real, Figure 16). Although the capacity of this scenario is twice that of the “original” scenario described earlier, this NPV is 2.7x greater and highlights the benefit of scale in this project. This IRR for this NPV is 24% (real).
Given the aggressive production profile (effectively assumes adequate availability of power and water pre-2013) and cost assumptions embedded in this calculation, we suggest this scenario represents a cap for Booysendal’s value.
Figure 16. Scaled-up: NPV and Cash Flows
LOM FY09E FY10E FY11E FY12E FY13E FY14E FY15E FY16E FY17E FY18E FY19E FY20E
Tons miilled '000 164,774 576 2,112 3,360 4,176 4,910 5,640 5,760 5,760 5,760 5,760Refined PGMs '000 16,894 58 212 341 428 503 578 591 591 591 591Platinum '000 8,536 29 106 172 216 254 292 299 299 299 299
Realised Basket Price R 0 0 10167 9908 9492 8705 8701 8683 8668 8668 8668 8668
Sales Rm 148,219 0 0 593 2,108 3,223 3,751 4,412 5,059 5,161 5,163 5,163 5,163Cash Cost of Sales Rm (74,710) 0 0 (303) (1,122) (1,711) (2,041) (2,306) (2,649) (2,705) (2,578) (2,578) (2,578)Capex Rm (20,977) (150) (520) (1,422) (2,374) (2,310) (1,473) (899) (823) (613) (433) (433) (433)Tax Rm (14,709) 42 146 317 389 223 (66) (338) (444) (516) (603) (603) (603)Royalty Rm (5,233) 0 0 0 0 0 (38) (119) (152) (173) (198) (198) (198)Mining Cash Flow Rm 32,590 (108) (374) (815) (1,000) (574) 133 751 990 1,154 1,351 1,351 1,351
NPV Rm 7.50% 7,857Shares in issue million 360NPV per Share R 21.84 IRR = 24%
Source: Citi Investment Research
Sensitivity tables for this scenario are shown below. Again, the valuation is most sensitive to changes in operating cost and the dollar basket price. Given this project's scale, it achieves a positive NPV under the above assumptions at all long-term rand basket prices above R6,700/PGMoz.
Figure 17. Scaled-up: NPV/share – Sensitivity to Key Variables
Rbn NPV/Share 317 362 408 453 498 544 589 7.95 8.05 8.15 8.25 8.35 8.45 8.55
6.0 25.64 950 36.89 32.33 27.94 23.56 19.17 14.78 10.39 799 -3.48 -2.72 -1.95 -1.19 -0.42 0.34 1.11
6.9 24.38 1,050 36.27 31.76 27.37 22.99 18.60 14.21 9.81 914 3.94 4.80 5.66 6.51 7.37 8.23 9.09
7.7 23.11 1,150 35.65 31.19 26.80 22.41 18.03 13.64 9.24 1,028 11.36 12.31 13.25 14.20 15.14 16.09 17.03
8.6 21.84 1,250 35.03 30.62 26.23 21.84 17.46 13.07 8.66 1,142 18.73 19.77 20.81 21.84 22.88 23.92 24.95
9.5 20.58 1,350 34.43 30.05 25.66 21.27 16.89 12.50 8.08 1,256 26.10 27.23 28.36 29.49 30.62 31.75 32.88
10.3 19.31 1,450 33.86 29.48 25.09 20.70 16.31 11.93 7.51 1,370 33.47 34.69 35.91 37.12 38.34 39.55 40.76
11.2 18.04 1,550 33.29 28.90 24.52 20.13 15.74 11.35 6.93 1,485 40.79 42.10 43.41 44.71 46.02 47.32 48.63
Capital Cost
Ongo
ing
Cape
x(R/
Pt o
z)
Operating Costs (R/t) Rand / US Dollar
PGM
Bas
ket P
rice
($/0
z)
Source: Citi Investment Research

Northam Platinum Ltd (NHMJ.J) 18 September 2008
Citigroup Global Markets Equity Research 15
3 – Modular: R15.65/share
At the company’s recent results presentation, management discussed the possibility of adopting a modular approach to develop Booysendal in order to mitigate the risk of insufficient power and water. It indicated this may involve phased construction of 120ktpm “units” with a bias towards UG2 production.
Our model follows this approach. Given that power and water availability is only likely to be “secure” beyond 2013, we assume Northam will only have adequate power and water (partly from allocations granted by Anglo Platinum) to develop and bring into production one decline shaft, which will stockpile ore until a concentrator is commissioned in 2013. Beyond this, additional capacity will be added and the mine will ramp up to 480ktpm by FY21.
The average operating cost of R477/t is greater than the “Scaled-up” scenario, yet still well below recently achieved cost targets. Real capex for this project is estimated at R8.8bn.
We calculate an NPV of R5.6bn or R15.65/share under this scenario (Figure 19). The real IRR is 20%.
Figure 19. Modular: NPV and Cash Flows
LOM FY09E FY10E FY11E FY12E FY13E FY14E FY15E FY16E FY17E FY18E FY19E FY20E
Tons miilled '000 150,770 0 1,200 1,931 2,678 3,660 4,320 5,100 5,400 5,580Refined PGMs '000 15,436 0 120 194 269 369 439 520 552 572Platinum '000 7,793 0 60 97 135 185 221 262 279 289
Realised Basket Price R 0 0 10209 9406 9222 9019 8893 8763 8717 8692
Sales Rm 135,690 0 0 0 0 1,217 1,827 2,489 3,350 3,926 4,589 4,853 5,007Cash Cost of Sales Rm (71,455) 0 0 0 0 (611) (994) (1,323) (1,808) (2,134) (2,519) (2,667) (2,621)Capex Rm (20,101) 0 (320) (810) (960) (1,147) (1,080) (1,215) (1,249) (1,340) (1,190) (864) (639)Tax Rm (12,358) 0 90 227 269 151 69 14 (82) (127) (246) (370) (489)Royalty Rm (4,424) 0 0 0 0 0 0 (9) (40) (56) (93) (130) (165)Mining Cash Flow Rm 27,353 0 (230) (583) (691) (390) (178) (44) 171 270 540 821 1,094
NPV Rm 7.50% 5,630Shares in issue million 360NPV per Share R 15.65 IRR = 20%
Source: Citi Investment Research
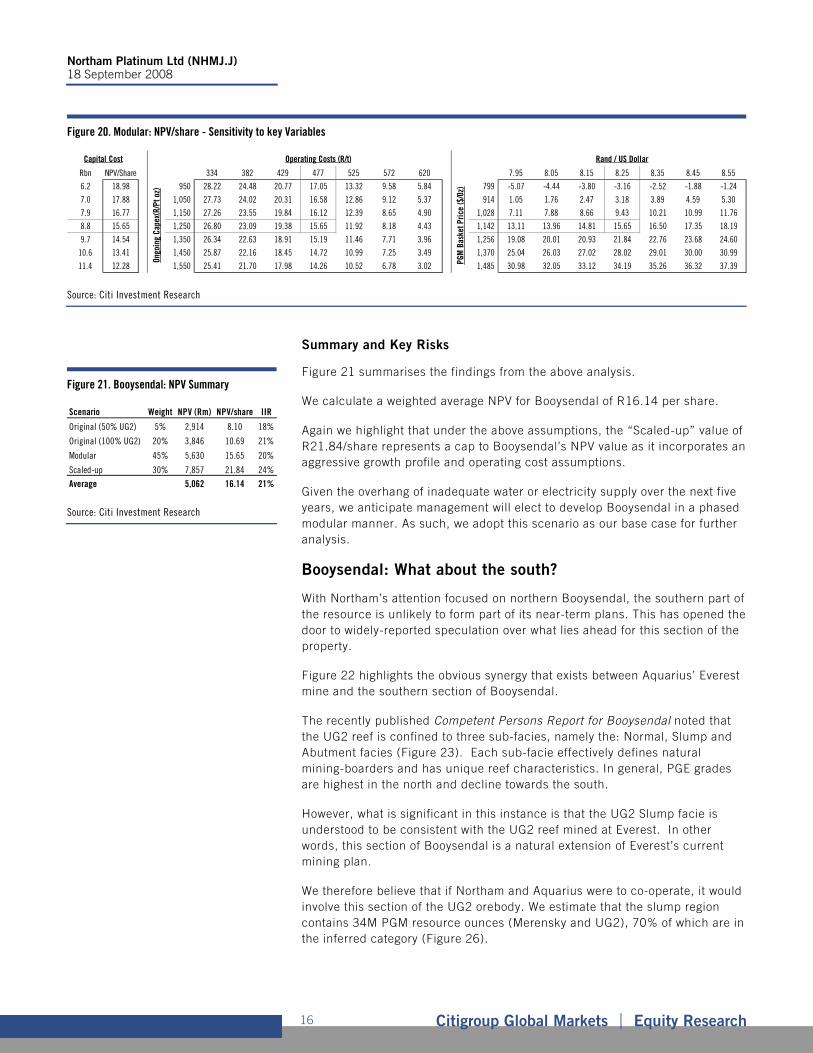
The sensitivity of this NPV to important input variables is shown below. The project has a negative NPV at long-term rand basket prices below R7,020/PGMoz.
Figure 18. Modular: Summary
First production by : 2013Full production by: 2021
…rate (ktpm): 480Merensky:UG2 ratio: 50:50Steady-State Headgrade (g/t)
CostsExpansion Capex (Rbn) 8.8Ongoing Capex (R/Pt oz) 1,250Operating Costs (R/t) 477
"Modular"
Source: Citi Investment Research
Northam Platinum Ltd (NHMJ.J) 18 September 2008
Citigroup Global Markets Equity Research 16
Figure 20. Modular: NPV/share - Sensitivity to key Variables
Rbn NPV/Share 334 382 429 477 525 572 620 7.95 8.05 8.15 8.25 8.35 8.45 8.55
6.2 18.98 950 28.22 24.48 20.77 17.05 13.32 9.58 5.84 799 -5.07 -4.44 -3.80 -3.16 -2.52 -1.88 -1.24
7.0 17.88 1,050 27.73 24.02 20.31 16.58 12.86 9.12 5.37 914 1.05 1.76 2.47 3.18 3.89 4.59 5.30
7.9 16.77 1,150 27.26 23.55 19.84 16.12 12.39 8.65 4.90 1,028 7.11 7.88 8.66 9.43 10.21 10.99 11.76
8.8 15.65 1,250 26.80 23.09 19.38 15.65 11.92 8.18 4.43 1,142 13.11 13.96 14.81 15.65 16.50 17.35 18.19
9.7 14.54 1,350 26.34 22.63 18.91 15.19 11.46 7.71 3.96 1,256 19.08 20.01 20.93 21.84 22.76 23.68 24.60
10.6 13.41 1,450 25.87 22.16 18.45 14.72 10.99 7.25 3.49 1,370 25.04 26.03 27.02 28.02 29.01 30.00 30.99
11.4 12.28 1,550 25.41 21.70 17.98 14.26 10.52 6.78 3.02 1,485 30.98 32.05 33.12 34.19 35.26 36.32 37.39
Capital CostOn
goin
g Ca
pex(
R/Pt
oz)
Operating Costs (R/t) Rand / US Dollar
PGM
Bas
ket P
rice
($/0
z)
Source: Citi Investment Research
Summary and Key Risks
Figure 21 summarises the findings from the above analysis.
We calculate a weighted average NPV for Booysendal of R16.14 per share.
Again we highlight that under the above assumptions, the “Scaled-up” value of R21.84/share represents a cap to Booysendal’s NPV value as it incorporates an aggressive growth profile and operating cost assumptions.
Given the overhang of inadequate water or electricity supply over the next five years, we anticipate management will elect to develop Booysendal in a phased modular manner. As such, we adopt this scenario as our base case for further analysis.
Booysendal: What about the south?
With Northam’s attention focused on northern Booysendal, the southern part of the resource is unlikely to form part of its near-term plans. This has opened the door to widely-reported speculation over what lies ahead for this section of the property.
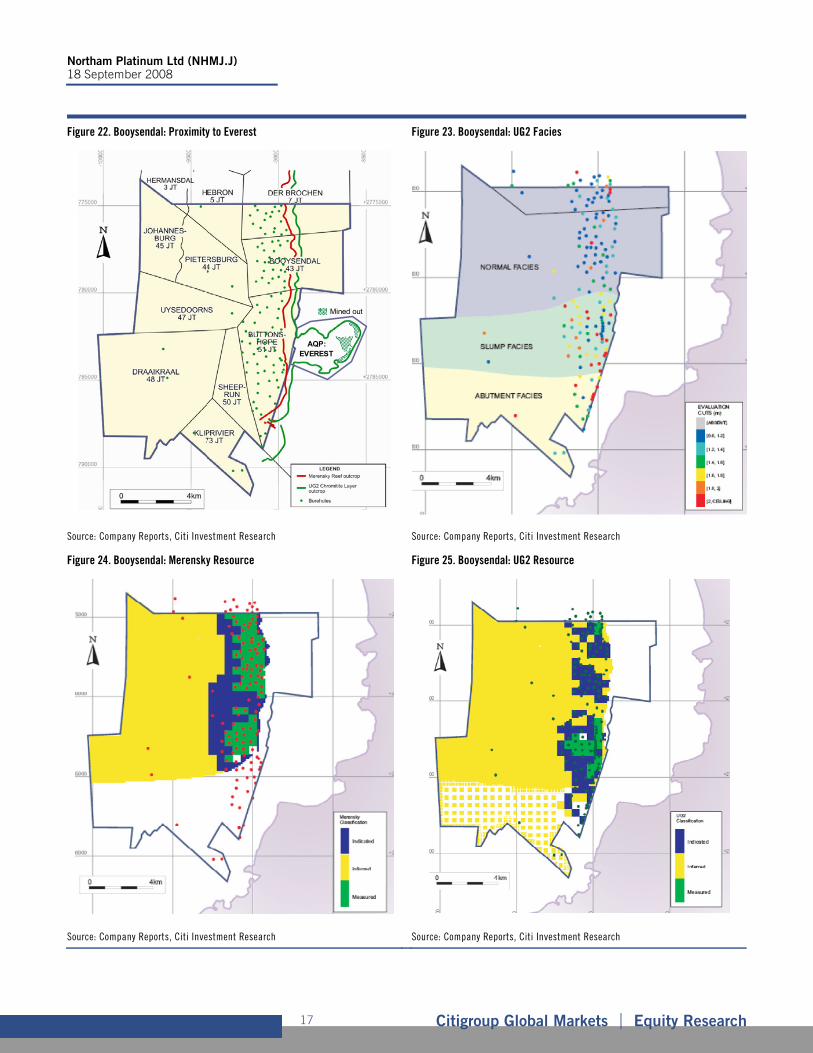
Figure 22 highlights the obvious synergy that exists between Aquarius’ Everest mine and the southern section of Booysendal.
The recently published Competent Persons Report for Booysendal noted that the UG2 reef is confined to three sub-facies, namely the: Normal, Slump and Abutment facies (Figure 23). Each sub-facie effectively defines natural mining-boarders and has unique reef characteristics. In general, PGE grades are highest in the north and decline towards the south.
However, what is significant in this instance is that the UG2 Slump facie is understood to be consistent with the UG2 reef mined at Everest. In other words, this section of Booysendal is a natural extension of Everest’s current mining plan.
We therefore believe that if Northam and Aquarius were to co-operate, it would involve this section of the UG2 orebody. We estimate that the slump region contains 34M PGM resource ounces (Merensky and UG2), 70% of which are in the inferred category (Figure 26).
Figure 21. Booysendal: NPV Summary
Scenario Weight NPV (Rm) NPV/share IIR
Original (50% UG2) 5% 2,914 8.10 18%
Original (100% UG2) 20% 3,846 10.69 21%
Modular 45% 5,630 15.65 20%
Scaled-up 30% 7,857 21.84 24%
Average 5,062 16.14 21%
Source: Citi Investment Research
Northam Platinum Ltd (NHMJ.J) 18 September 2008
Citigroup Global Markets Equity Research 17
Figure 22. Booysendal: Proximity to Everest Figure 23. Booysendal: UG2 Facies
AQP: EVEREST
Mined out
Source: Company Reports, Citi Investment Research Source: Company Reports, Citi Investment Research
Figure 24. Booysendal: Merensky Resource Figure 25. Booysendal: UG2 Resource
Source: Company Reports, Citi Investment Research Source: Company Reports, Citi Investment Research
Northam Platinum Ltd (NHMJ.J) 18 September 2008
Citigroup Global Markets Equity Research 18
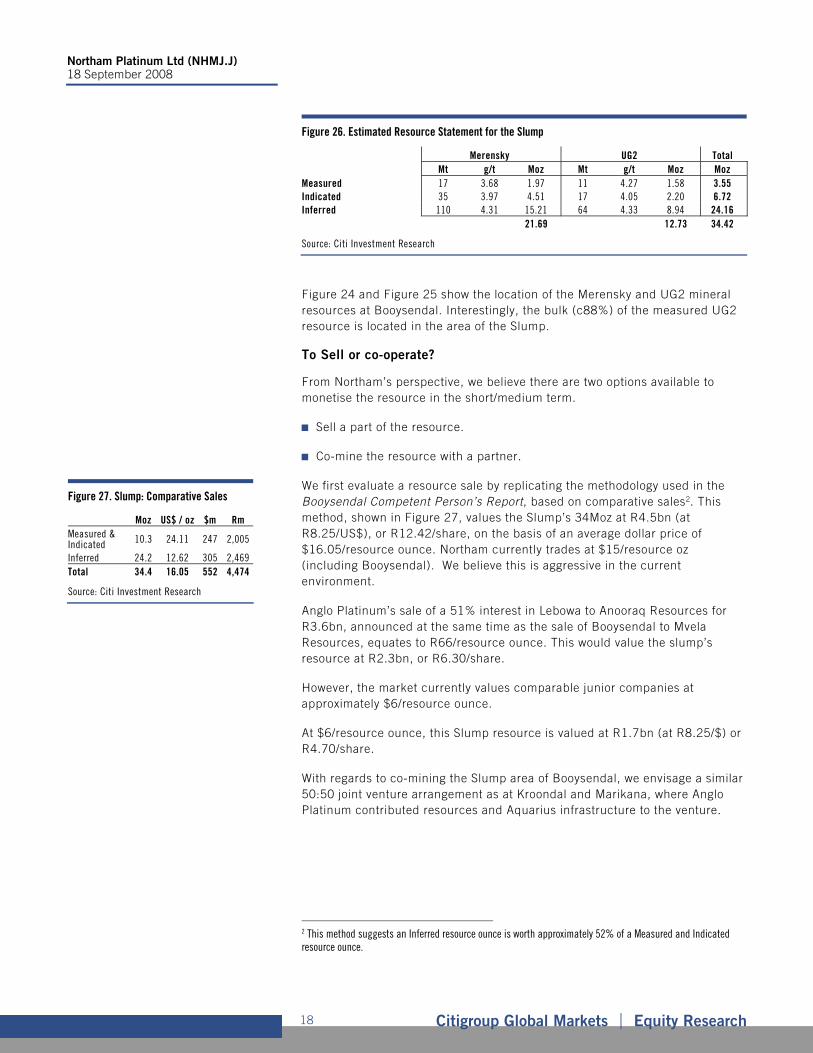
Figure 26. Estimated Resource Statement for the Slump
Merensky UG2 Total Mt g/t Moz Mt g/t Moz Moz Measured 17 3.68 1.97 11 4.27 1.58 3.55 Indicated 35 3.97 4.51 17 4.05 2.20 6.72 Inferred 110 4.31 15.21 64 4.33 8.94 24.16 21.69 12.73 34.42
Source: Citi Investment Research
Figure 24 and Figure 25 show the location of the Merensky and UG2 mineral resources at Booysendal. Interestingly, the bulk (c88%) of the measured UG2 resource is located in the area of the Slump.
To Sell or co-operate?
From Northam’s perspective, we believe there are two options available to monetise the resource in the short/medium term.
Sell a part of the resource.
Co-mine the resource with a partner.
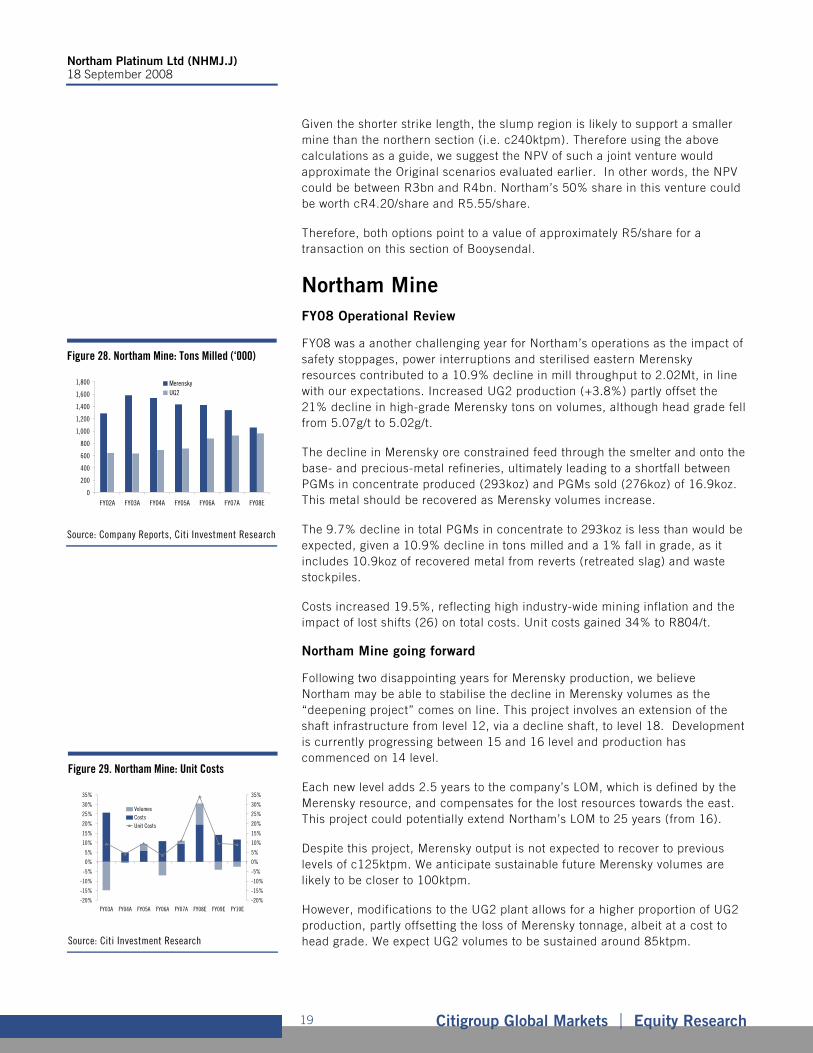
We first evaluate a resource sale by replicating the methodology used in the Booysendal Competent Person’s Report, based on comparative sales2. This method, shown in Figure 27, values the Slump’s 34Moz at R4.5bn (at R8.25/US$), or R12.42/share, on the basis of an average dollar price of $16.05/resource ounce. Northam currently trades at $15/resource oz (including Booysendal). We believe this is aggressive in the current environment.
Anglo Platinum’s sale of a 51% interest in Lebowa to Anooraq Resources for R3.6bn, announced at the same time as the sale of Booysendal to Mvela Resources, equates to R66/resource ounce. This would value the slump’s resource at R2.3bn, or R6.30/share.
However, the market currently values comparable junior companies at approximately $6/resource ounce.
At $6/resource ounce, this Slump resource is valued at R1.7bn (at R8.25/$) or R4.70/share.
With regards to co-mining the Slump area of Booysendal, we envisage a similar 50:50 joint venture arrangement as at Kroondal and Marikana, where Anglo Platinum contributed resources and Aquarius infrastructure to the venture.
2 This method suggests an Inferred resource ounce is worth approximately 52% of a Measured and Indicated resource ounce.
Figure 27. Slump: Comparative Sales
Moz US$ / oz $m Rm Measured & Indicated 10.3 24.11 247 2,005
Inferred 24.2 12.62 305 2,469 Total 34.4 16.05 552 4,474
Source: Citi Investment Research
Northam Platinum Ltd (NHMJ.J) 18 September 2008
Citigroup Global Markets Equity Research 19
Given the shorter strike length, the slump region is likely to support a smaller mine than the northern section (i.e. c240ktpm). Therefore using the above calculations as a guide, we suggest the NPV of such a joint venture would approximate the Original scenarios evaluated earlier. In other words, the NPV could be between R3bn and R4bn. Northam’s 50% share in this venture could be worth cR4.20/share and R5.55/share.
Therefore, both options point to a value of approximately R5/share for a transaction on this section of Booysendal.
Northam Mine
FY08 Operational Review
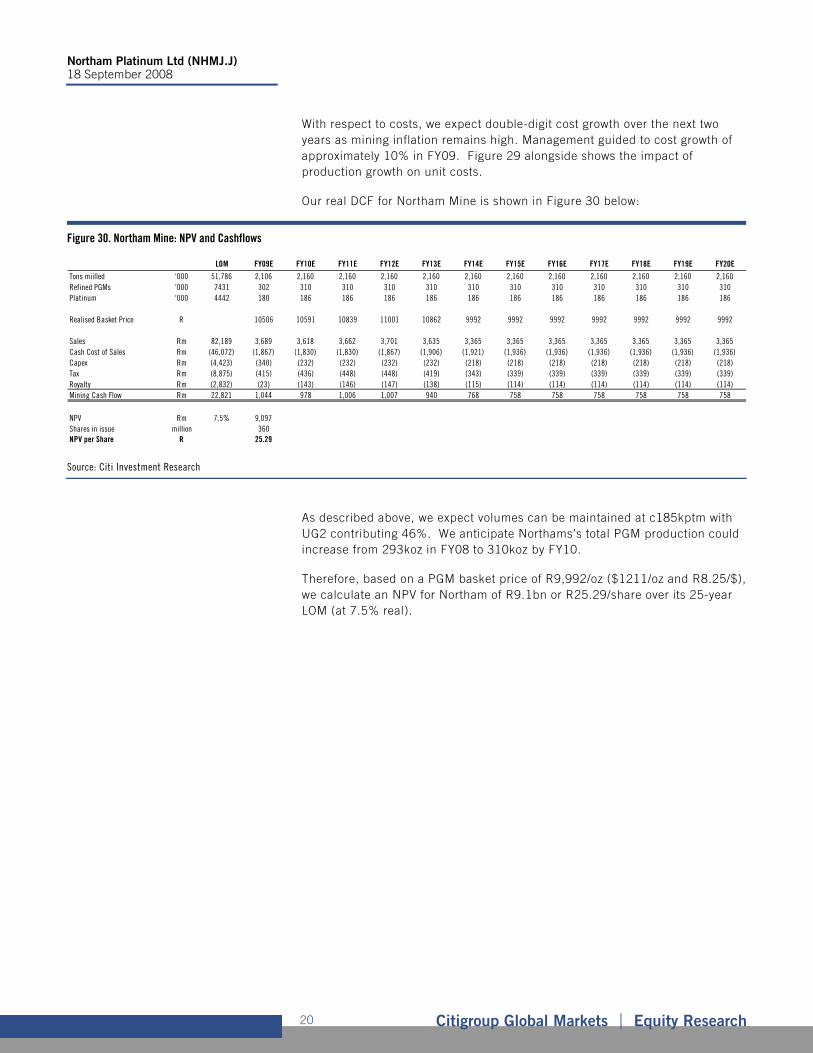
FY08 was a another challenging year for Northam’s operations as the impact of safety stoppages, power interruptions and sterilised eastern Merensky resources contributed to a 10.9% decline in mill throughput to 2.02Mt, in line with our expectations. Increased UG2 production (+3.8%) partly offset the 21% decline in high-grade Merensky tons on volumes, although head grade fell from 5.07g/t to 5.02g/t.
The decline in Merensky ore constrained feed through the smelter and onto the base- and precious-metal refineries, ultimately leading to a shortfall between PGMs in concentrate produced (293koz) and PGMs sold (276koz) of 16.9koz. This metal should be recovered as Merensky volumes increase.
The 9.7% decline in total PGMs in concentrate to 293koz is less than would be expected, given a 10.9% decline in tons milled and a 1% fall in grade, as it includes 10.9koz of recovered metal from reverts (retreated slag) and waste stockpiles.
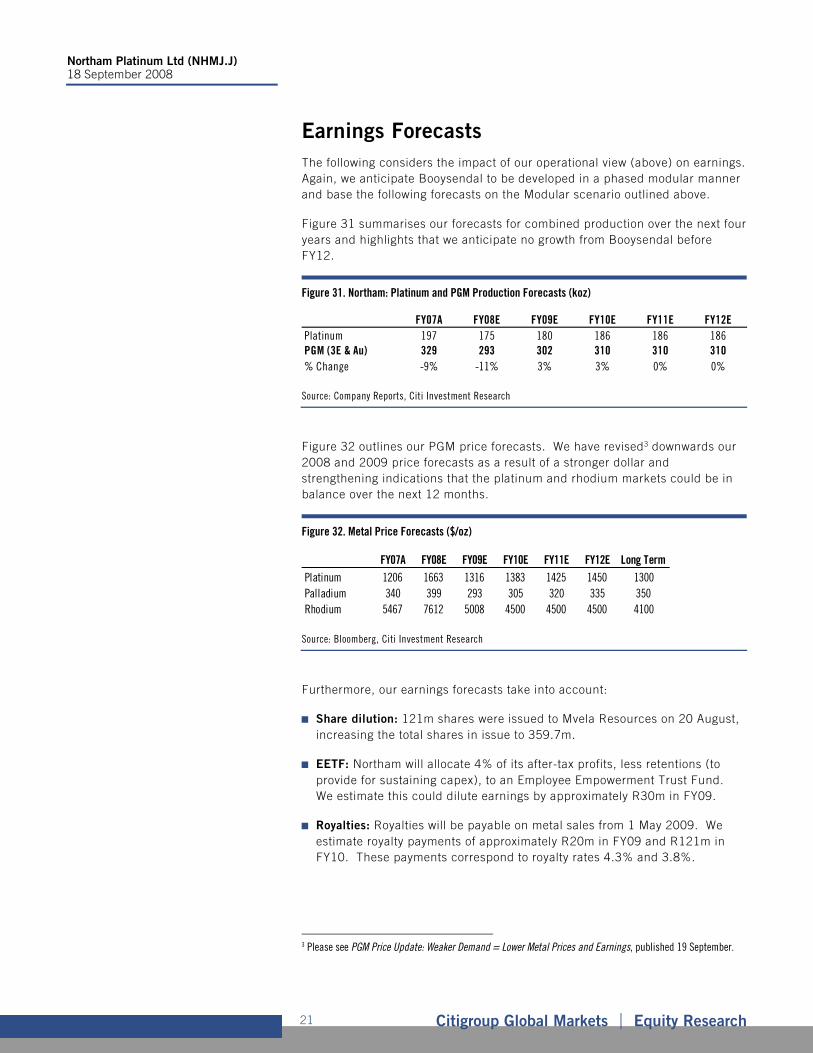
Costs increased 19.5%, reflecting high industry-wide mining inflation and the impact of lost shifts (26) on total costs. Unit costs gained 34% to R804/t.
Northam Mine going forward
Following two disappointing years for Merensky production, we believe Northam may be able to stabilise the decline in Merensky volumes as the “deepening project” comes on line. This project involves an extension of the shaft infrastructure from level 12, via a decline shaft, to level 18. Development is currently progressing between 15 and 16 level and production has commenced on 14 level.
Each new level adds 2.5 years to the company’s LOM, which is defined by the Merensky resource, and compensates for the lost resources towards the east. This project could potentially extend Northam’s LOM to 25 years (from 16).
Despite this project, Merensky output is not expected to recover to previous levels of c125ktpm. We anticipate sustainable future Merensky volumes are likely to be closer to 100ktpm.
However, modifications to the UG2 plant allows for a higher proportion of UG2 production, partly offsetting the loss of Merensky tonnage, albeit at a cost to head grade. We expect UG2 volumes to be sustained around 85ktpm.
Figure 28. Northam Mine: Tons Milled (‘000)
0
200
400
600
800
1,000
1,200
1,400
1,600
1,800
FY02A FY03A FY04A FY05A FY06A FY07A FY08E
MerenskyUG2
Source: Company Reports, Citi Investment Research
Figure 29. Northam Mine: Unit Costs
-20%
-15%
-10%
-5%
0%
5%
10%
15%
20%
25%
30%
35%
FY03A FY04A FY05A FY06A FY07A FY08E FY09E FY10E-20%
-15%
-10%
-5%
0%
5%
10%
15%
20%
25%
30%
35%
VolumesCostsUnit Costs
Source: Citi Investment Research
Northam Platinum Ltd (NHMJ.J) 18 September 2008
Citigroup Global Markets Equity Research 20
With respect to costs, we expect double-digit cost growth over the next two years as mining inflation remains high. Management guided to cost growth of approximately 10% in FY09. Figure 29 alongside shows the impact of production growth on unit costs.
Our real DCF for Northam Mine is shown in Figure 30 below:
Figure 30. Northam Mine: NPV and Cashflows
LOM FY09E FY10E FY11E FY12E FY13E FY14E FY15E FY16E FY17E FY18E FY19E FY20E
Tons miilled '000 51,786 2,106 2,160 2,160 2,160 2,160 2,160 2,160 2,160 2,160 2,160 2,160 2,160Refined PGMs '000 7431 302 310 310 310 310 310 310 310 310 310 310 310Platinum '000 4442 180 186 186 186 186 186 186 186 186 186 186 186
Realised Basket Price R 10506 10591 10839 11001 10862 9992 9992 9992 9992 9992 9992 9992
Sales Rm 82,189 3,689 3,618 3,662 3,701 3,635 3,365 3,365 3,365 3,365 3,365 3,365 3,365Cash Cost of Sales Rm (46,072) (1,867) (1,830) (1,830) (1,867) (1,906) (1,921) (1,936) (1,936) (1,936) (1,936) (1,936) (1,936)Capex Rm (4,423) (340) (232) (232) (232) (232) (218) (218) (218) (218) (218) (218) (218)Tax Rm (8,875) (415) (436) (448) (448) (419) (343) (339) (339) (339) (339) (339) (339)Royalty Rm (2,832) (23) (143) (146) (147) (138) (115) (114) (114) (114) (114) (114) (114)Mining Cash Flow Rm 22,821 1,044 978 1,006 1,007 940 768 758 758 758 758 758 758
NPV Rm 7.5% 9,097Shares in issue million 360NPV per Share R 25.29
Source: Citi Investment Research
As described above, we expect volumes can be maintained at c185kptm with UG2 contributing 46%. We anticipate Northams’s total PGM production could increase from 293koz in FY08 to 310koz by FY10.
Therefore, based on a PGM basket price of R9,992/oz ($1211/oz and R8.25/$), we calculate an NPV for Northam of R9.1bn or R25.29/share over its 25-year LOM (at 7.5% real).
Northam Platinum Ltd (NHMJ.J) 18 September 2008
Citigroup Global Markets Equity Research 21
Earnings Forecasts
The following considers the impact of our operational view (above) on earnings. Again, we anticipate Booysendal to be developed in a phased modular manner and base the following forecasts on the Modular scenario outlined above.
Figure 31 summarises our forecasts for combined production over the next four years and highlights that we anticipate no growth from Booysendal before FY12.
Figure 31. Northam: Platinum and PGM Production Forecasts (koz)
FY07A FY08E FY09E FY10E FY11E FY12EPlatinum 197 175 180 186 186 186PGM (3E & Au) 329 293 302 310 310 310% Change -9% -11% 3% 3% 0% 0%
Source: Company Reports, Citi Investment Research
Figure 32 outlines our PGM price forecasts. We have revised3 downwards our 2008 and 2009 price forecasts as a result of a stronger dollar and strengthening indications that the platinum and rhodium markets could be in balance over the next 12 months.
Figure 32. Metal Price Forecasts ($/oz)
FY07A FY08E FY09E FY10E FY11E FY12E Long TermPlatinum 1206 1663 1316 1383 1425 1450 1300Palladium 340 399 293 305 320 335 350Rhodium 5467 7612 5008 4500 4500 4500 4100
Source: Bloomberg, Citi Investment Research
Furthermore, our earnings forecasts take into account:
Share dilution: 121m shares were issued to Mvela Resources on 20 August, increasing the total shares in issue to 359.7m.
EETF: Northam will allocate 4% of its after-tax profits, less retentions (to provide for sustaining capex), to an Employee Empowerment Trust Fund. We estimate this could dilute earnings by approximately R30m in FY09.
Royalties: Royalties will be payable on metal sales from 1 May 2009. We estimate royalty payments of approximately R20m in FY09 and R121m in FY10. These payments correspond to royalty rates 4.3% and 3.8%.
3 Please see PGM Price Update: Weaker Demand = Lower Metal Prices and Earnings, published 19 September.
Northam Platinum Ltd (NHMJ.J) 18 September 2008
Citigroup Global Markets Equity Research 22
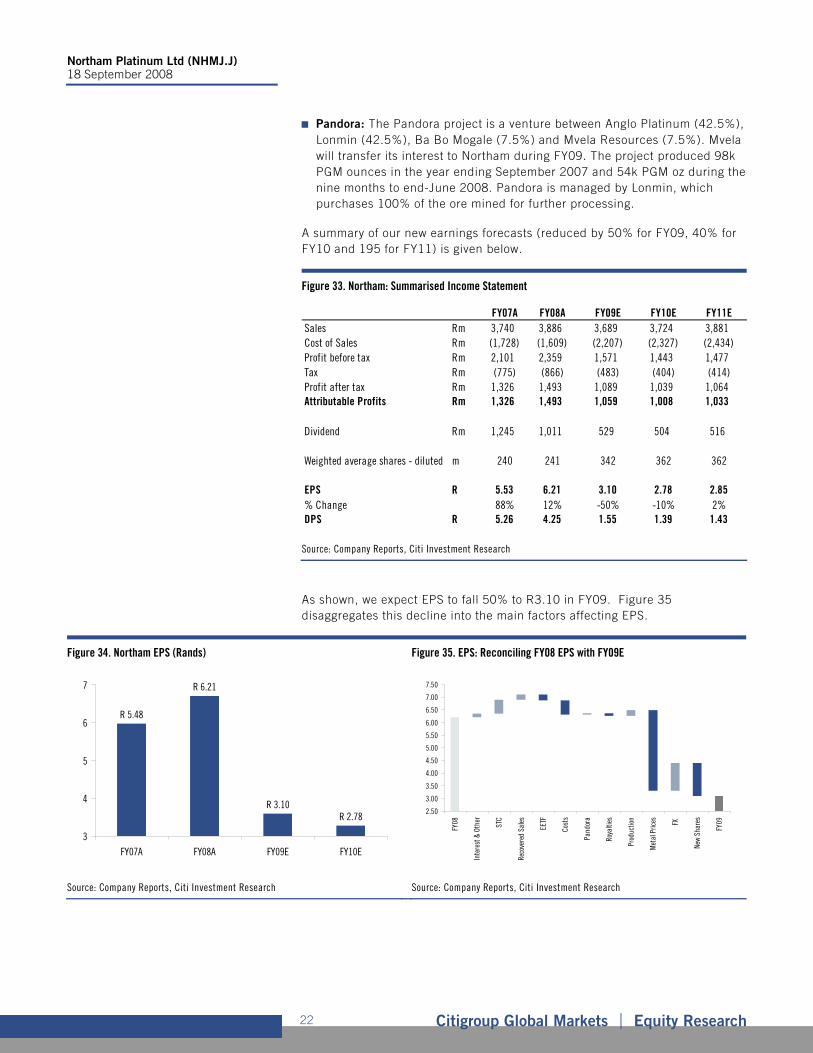
Pandora: The Pandora project is a venture between Anglo Platinum (42.5%), Lonmin (42.5%), Ba Bo Mogale (7.5%) and Mvela Resources (7.5%). Mvela will transfer its interest to Northam during FY09. The project produced 98k PGM ounces in the year ending September 2007 and 54k PGM oz during the nine months to end-June 2008. Pandora is managed by Lonmin, which purchases 100% of the ore mined for further processing.
A summary of our new earnings forecasts (reduced by 50% for FY09, 40% for FY10 and 195 for FY11) is given below.
Figure 33. Northam: Summarised Income Statement
FY07A FY08A FY09E FY10E FY11ESales Rm 3,740 3,886 3,689 3,724 3,881Cost of Sales Rm (1,728) (1,609) (2,207) (2,327) (2,434)Profit before tax Rm 2,101 2,359 1,571 1,443 1,477Tax Rm (775) (866) (483) (404) (414)Profit after tax Rm 1,326 1,493 1,089 1,039 1,064Attributable Profits Rm 1,326 1,493 1,059 1,008 1,033
Dividend Rm 1,245 1,011 529 504 516
Weighted average shares - diluted m 240 241 342 362 362
EPS R 5.53 6.21 3.10 2.78 2.85% Change 88% 12% -50% -10% 2%DPS R 5.26 4.25 1.55 1.39 1.43
Source: Company Reports, Citi Investment Research
As shown, we expect EPS to fall 50% to R3.10 in FY09. Figure 35 disaggregates this decline into the main factors affecting EPS.
Figure 34. Northam EPS (Rands) Figure 35. EPS: Reconciling FY08 EPS with FY09E
R 5.48
R 6.21
R 3.10R 2.78
3
4
5
6
7
FY07A FY08A FY09E FY10E
2.50
3.00
3.50
4.00
4.50
5.00
5.50
6.00
6.50
7.00
7.50
FY08
Inte
rest
& O
ther
STC
Reco
vere
d Sa
les
EETF
Cost
s
Pand
ora
Roya
lties
Prod
uctio
n
Met
al P
rices FX
New
Shar
es
FY09
Source: Company Reports, Citi Investment Research Source: Company Reports, Citi Investment Research
Northam Platinum Ltd (NHMJ.J) 18 September 2008
Citigroup Global Markets Equity Research 23
The primary reason for the fall in EPS is an anticipated 26% decline in the dollar PGM basket price and the impact of 121m new shares issued to Mvela Resources that increase the total shares in issue from 238m to 359m. In other words, these new shares automatically dilute earnings by 36%.
If we were to adjust for: shares in issue, metal prices and the rand/US dollar exchange rate (i.e. set their variables at FY08 levels), our FY09 EPS forecast would increase 4.5% to R6.49.
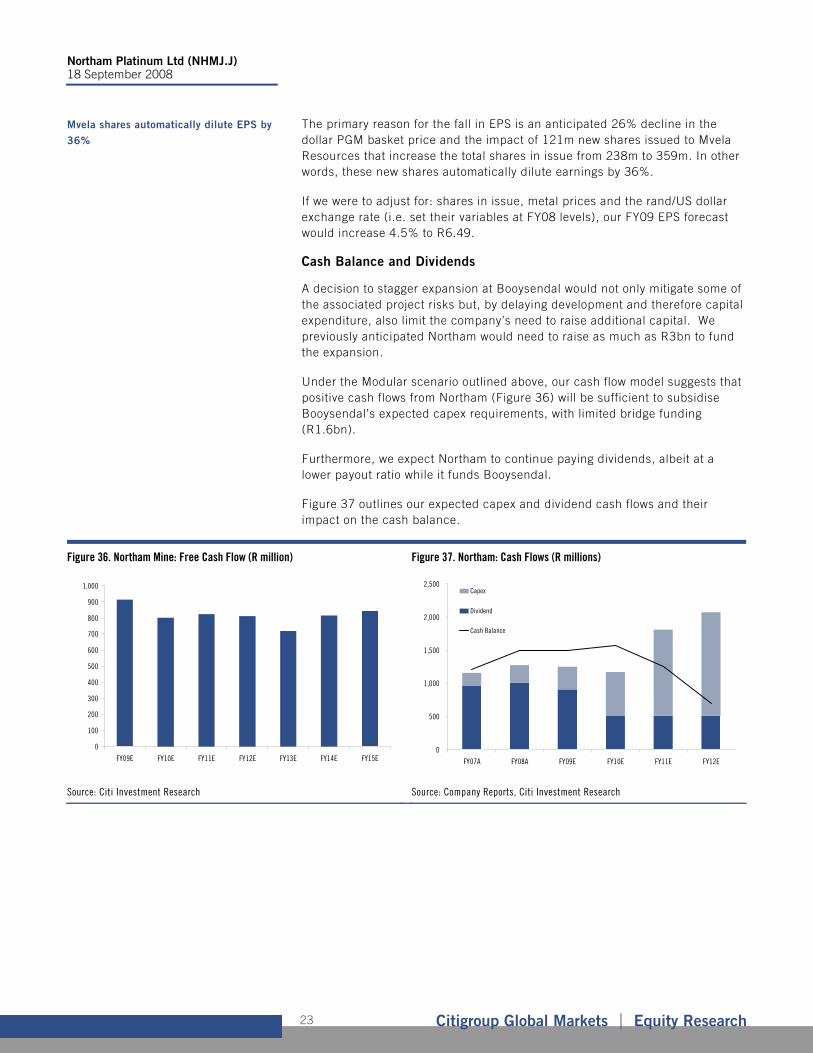
Cash Balance and Dividends
A decision to stagger expansion at Booysendal would not only mitigate some of the associated project risks but, by delaying development and therefore capital expenditure, also limit the company’s need to raise additional capital. We previously anticipated Northam would need to raise as much as R3bn to fund the expansion.
Under the Modular scenario outlined above, our cash flow model suggests that positive cash flows from Northam (Figure 36) will be sufficient to subsidise Booysendal’s expected capex requirements, with limited bridge funding (R1.6bn).
Furthermore, we expect Northam to continue paying dividends, albeit at a lower payout ratio while it funds Booysendal.
Figure 37 outlines our expected capex and dividend cash flows and their impact on the cash balance.
Figure 36. Northam Mine: Free Cash Flow (R million) Figure 37. Northam: Cash Flows (R millions)
0
100
200
300
400
500
600
700
800
900
1,000
FY09E FY10E FY11E FY12E FY13E FY14E FY15E
0
500
1,000
1,500
2,000
2,500
FY07A FY08A FY09E FY10E FY11E FY12E
Capex
Dividend
Cash Balance
Source: Citi Investment Research Source: Company Reports, Citi Investment Research
Mvela shares automatically dilute EPS by
36%
Northam Platinum Ltd (NHMJ.J) 18 September 2008
Citigroup Global Markets Equity Research 24
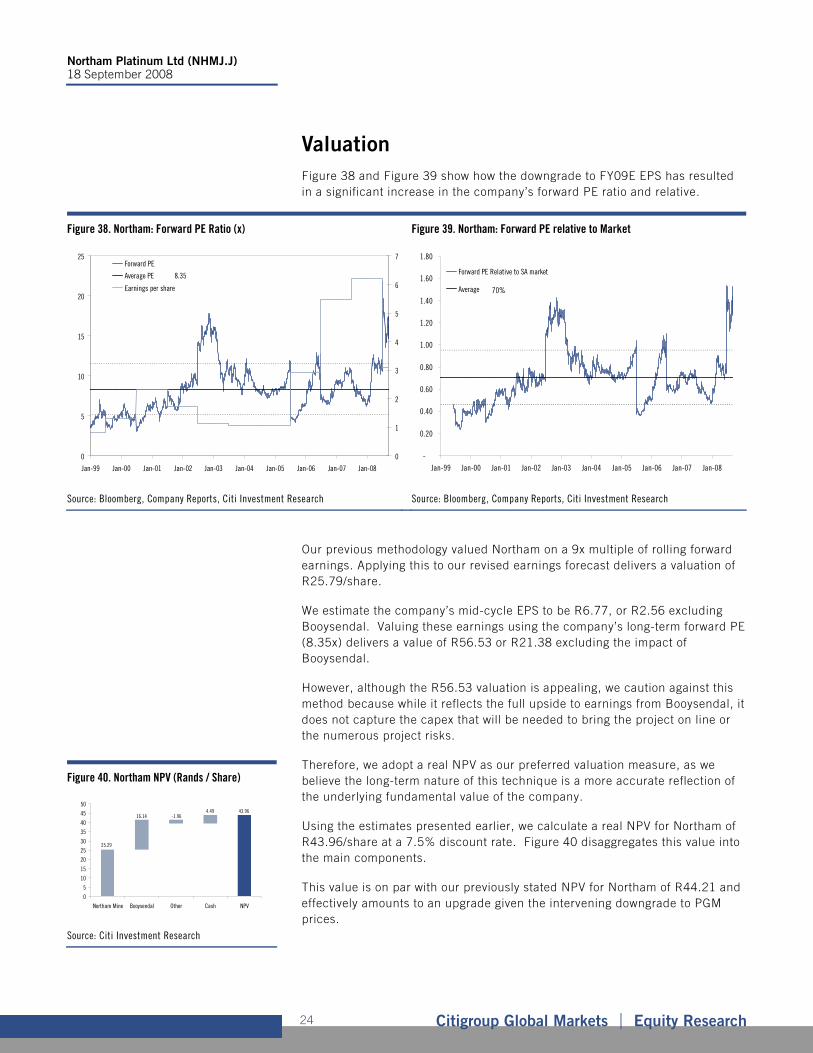
Valuation
Figure 38 and Figure 39 show how the downgrade to FY09E EPS has resulted in a significant increase in the company’s forward PE ratio and relative.
Figure 38. Northam: Forward PE Ratio (x) Figure 39. Northam: Forward PE relative to Market
8.35
0
5
10
15
20
25
Jan-99 Jan-00 Jan-01 Jan-02 Jan-03 Jan-04 Jan-05 Jan-06 Jan-07 Jan-08
0
1
2
3
4
5
6
7Forward PE
Average PE
Earnings per share 70%
-
0.20
0.40
0.60
0.80
1.00
1.20
1.40
1.60
1.80
Jan-99 Jan-00 Jan-01 Jan-02 Jan-03 Jan-04 Jan-05 Jan-06 Jan-07 Jan-08
Forward PE Relative to SA market
Average
Source: Bloomberg, Company Reports, Citi Investment Research Source: Bloomberg, Company Reports, Citi Investment Research
Our previous methodology valued Northam on a 9x multiple of rolling forward earnings. Applying this to our revised earnings forecast delivers a valuation of R25.79/share.
We estimate the company’s mid-cycle EPS to be R6.77, or R2.56 excluding Booysendal. Valuing these earnings using the company’s long-term forward PE (8.35x) delivers a value of R56.53 or R21.38 excluding the impact of Booysendal.
However, although the R56.53 valuation is appealing, we caution against this method because while it reflects the full upside to earnings from Booysendal, it does not capture the capex that will be needed to bring the project on line or the numerous project risks.
Therefore, we adopt a real NPV as our preferred valuation measure, as we believe the long-term nature of this technique is a more accurate reflection of the underlying fundamental value of the company.
Using the estimates presented earlier, we calculate a real NPV for Northam of R43.96/share at a 7.5% discount rate. Figure 40 disaggregates this value into the main components.
This value is on par with our previously stated NPV for Northam of R44.21 and effectively amounts to an upgrade given the intervening downgrade to PGM prices.
Figure 40. Northam NPV (Rands / Share)
0
5
10
15
20
25
30
35
40
45
50
Northam Mine Booysendal Other Cash NPV
25.29
16.14 -1.964.49 43.96
Source: Citi Investment Research
Northam Platinum Ltd (NHMJ.J) 18 September 2008
Citigroup Global Markets Equity Research 25
The DCF does not include proceeds from any transaction relating to the southern part of Booysendal. We estimated this could potentially add R5/share to our valuation.
We set our new target price at R44, in line with our DCF valuation.
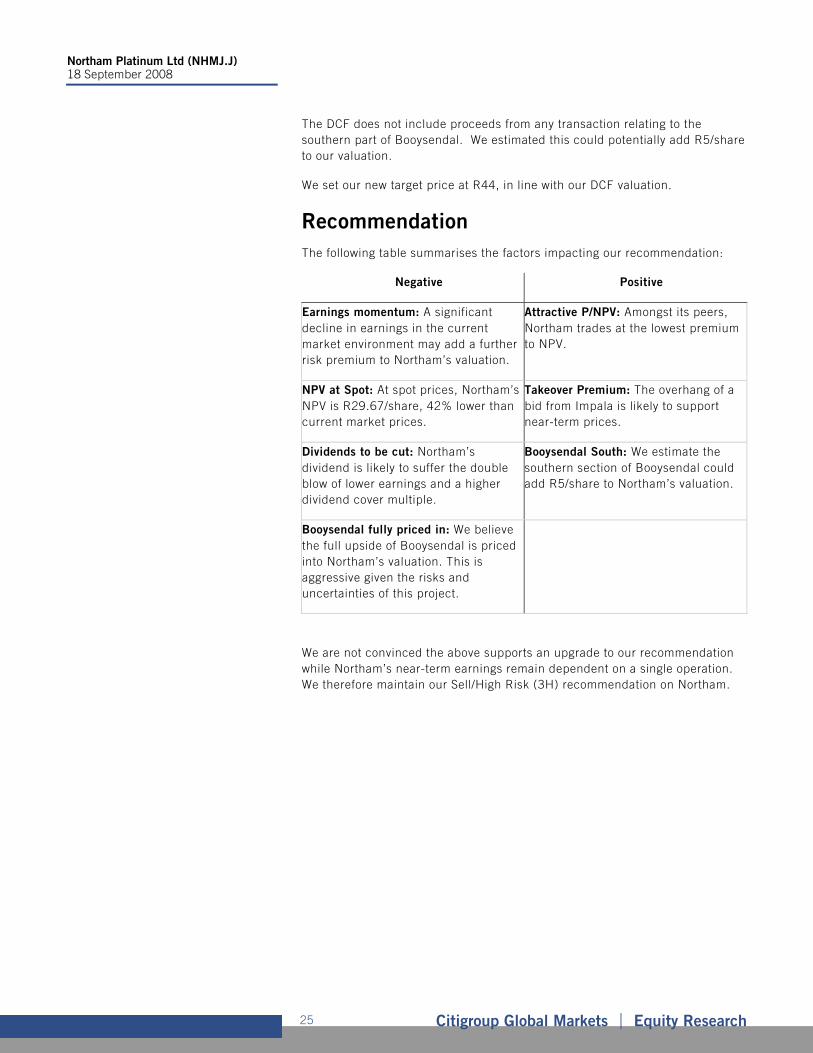
Recommendation
The following table summarises the factors impacting our recommendation:
Negative Positive
Earnings momentum: A significant decline in earnings in the current market environment may add a further risk premium to Northam’s valuation.
Attractive P/NPV: Amongst its peers, Northam trades at the lowest premium to NPV.
NPV at Spot: At spot prices, Northam’s NPV is R29.67/share, 42% lower than current market prices.
Takeover Premium: The overhang of a bid from Impala is likely to support near-term prices.
Dividends to be cut: Northam’s dividend is likely to suffer the double blow of lower earnings and a higher dividend cover multiple.
Booysendal South: We estimate the southern section of Booysendal could add R5/share to Northam’s valuation.
Booysendal fully priced in: We believe the full upside of Booysendal is priced into Northam’s valuation. This is aggressive given the risks and uncertainties of this project.
We are not convinced the above supports an upgrade to our recommendation while Northam’s near-term earnings remain dependent on a single operation. We therefore maintain our Sell/High Risk (3H) recommendation on Northam.
Northam Platinum Ltd (NHMJ.J) 18 September 2008
Citigroup Global Markets Equity Research 26
Northam Platinum Ltd
Company description
Northam Platinum is South Africa's fifth-largest platinum producer and operates the world's deepest platinum mine on the western limb of the Bushveld Complex. The company has its own processing capacity and outsources final refining under a long-term agreement to a third party.
Investment strategy
Northam's earnings are driven by international PGM metal prices and the rand/US dollar exchange rate. PGM prices have increased significantly over the past six years and, while we expect long-term prices to remain high, we believe the industry is discounting current spot prices. It is our view that this is unsustainable and that prices will moderate over the next three to four years. Furthermore, higher commodity prices have led Northam's earnings to cyclical highs while the company's earnings multiples, relative to the overall South African market, are in line with long-term averages. We therefore believe that earnings are at the top of their cycle while the market is showing mid-cycle valuations. We rate Northam Sell/High Risk (3H).
Valuation
We base our valuation of Northam on separate real discounted cash flow models for its Northam (R25.29/share) and Booysendal operations (R16.14/share). In our view, this method takes into account the long-term nature of a mining project. The DCF is discounted at 7.5% pa.
We also value Northam based on forward multiples of rolling earnings 12 months forward and mid-cycle earnings. However, we suggest this methodology fails to capture: (1) the benefit of future earnings from Booysendal; or (2) the capex necessary to bring Booysendal into production.
Risks
We rate Northam High Risk. As a single mine operation, Northam is exposed to numerous operational risk factors that may negatively impact the company's ability to maintain or grow production. Furthermore the company is the industry's highest-cost producer and is therefore vulnerable to falling commodity prices or an appreciation of the rand against the US dollar. While Northam is expected to start development of a new mine, Booysendal, which will in the long term diversify its operations and reduce overall costs, it is our opinion that the near-term execution risk outweighs these long-term benefits. The key risk to our target price would be PGM prices significantly above our forecasts or a weaker rand than expected.

Northam Platinum Ltd (NHMJ.J) 18 September 2008
Citigroup Global Markets Equity Research 27
Appendix A-1 Analyst Certification
Each research analyst(s) principally responsible for the preparation and content of all or any identified portion of this research report hereby certifies that, with respect to each issuer or security or any identified portion of the report with respect to an issuer or security that the research analyst covers in this research report, all of the views expressed in this research report accurately reflect their personal views about those issuer(s) or securities. Each research analyst(s) also certify that no part of their compensation was, is, or will be, directly or indirectly, related to the specific recommendation(s) or view(s) expressed by that research analyst in this research report.
IMPORTANT DISCLOSURES
0
20
40
60
80
O N D J2006
F M A M J J A S O N D J2007
F M A M J J A S O N D J2008
F M A M J J A S
12 3
4 56
78
9
10
# Date RatingTargetPrice
ClosingPrice
1: 18 Oct 05 3H *15.22 17.202: 8 Nov 05 3H *16.31 17.103: 16 Jan 06 3H *17.40 24.004: 25 Jan 06 3H *19.93 23.155: 31 Mar 06 *2H *29.45 31.006: 11 May 06 2H *40.46 38.007: 14 Jul 06 *3H *44.00 42.348: 1 Sep 06 Coverage suspended9: 4 Oct 07 *3H *38.95 47.97
10: 14 Apr 08 3H *41.26 69.50*Indicates change.
Northam Platinum Ltd (NHMJ.J)Ratings and Target Price History - Fundamental ResearchAnalyst: Gerhard Engelbrecht (covered since October 5 2007) ZAR
CoveredNot covered Rating/target price changes above reflect Eastern Standard Time
Chart current as of 13 S
eptember 2008
Analysts' compensation is determined based upon activities and services intended to benefit the investor clients of Citigroup Global Markets Inc. and its affiliates ("the Firm"). Like all Firm employees, analysts receive compensation that is impacted by overall firm profitability, which includes revenues from, among other business units, the Private Client Division, Institutional Sales and Trading, and Investment Banking.
For important disclosures (including copies of historical disclosures) regarding the companies that are the subject of this Citi Investment Research product ("the Product"), please contact Citi Investment Research, 388 Greenwich Street, 29th Floor, New York, NY, 10013, Attention: Legal/Compliance. In addition, the same important disclosures, with the exception of the Valuation and Risk assessments and historical disclosures, are contained on the Firm's disclosure website at www.citigroupgeo.com. Private Client Division clients should refer to www.smithbarney.com/research. Valuation and Risk assessments can be found in the text of the most recent research note/report regarding the subject company. Historical disclosures (for up to the past three years) will be provided upon request.
Citi Investment Research Ratings Distribution Data current as of 30 June 2008 Buy Hold SellCiti Investment Research Global Fundamental Coverage (3096) 50% 36% 14%
% of companies in each rating category that are investment banking clients 53% 52% 42%Guide to Fundamental Research Investment Ratings: Citi Investment Research's stock recommendations include a risk rating and an investment rating. Risk ratings, which take into account both price volatility and fundamental criteria, are: Low (L), Medium (M), High (H), and Speculative (S). Investment ratings are a function of Citi Investment Research's expectation of total return (forecast price appreciation and dividend yield within the next 12 months) and risk rating. For securities in emerging markets (Asia Pacific, Emerging Europe/Middle East/Africa, and Latin America), investment ratings are: Buy (1) (expected total return of 15% or more for Low-Risk stocks, 20% or more for Medium-Risk stocks, 30% or more for High-Risk stocks, and 40% or more for Speculative stocks); Hold (2) (5%-15% for Low-Risk stocks, 10%-20% for Medium-Risk stocks, 15%-30% for High-Risk stocks, and 20%-40% for Speculative stocks); and Sell (3) (5% or less for Low-Risk stocks, 10% or less for Medium-Risk stocks, 15% or less for High-Risk stocks, and 20% or less for Speculative stocks). Investment ratings are determined by the ranges described above at the time of initiation of coverage, a change in investment and/or risk rating, or a change in target price (subject to limited management discretion). At other times, the expected total returns may fall outside of these ranges because of market price movements and/or other short-term volatility or trading patterns. Such interim deviations from specified ranges will be permitted but will become subject to review by Research Management. Your decision to buy or sell a security should be based upon your personal investment objectives and should be made only after evaluating the stock's expected performance and risk.
Guide to Corporate Bond Research Credit Opinions and Investment Ratings: Citi Investment Research's corporate bond research issuer publications include a fundamental credit opinion of Improving, Stable or Deteriorating and a complementary risk rating of Low (L), Medium (M), High (H) or Speculative (S) regarding the credit risk of the company featured in the report. The fundamental credit opinion reflects the CIR analyst's opinion of the direction of credit fundamentals of the issuer without respect to securities market vagaries. The fundamental credit opinion is not geared to, but should be viewed in the context of, debt ratings issued by major public debt ratings companies such as Moody's Investors Service, Standard and Poor's, and Fitch Ratings. CBR risk ratings are approximately equivalent to the following matrix: Low Risk -- Triple A to Low Double A; Low to Medium Risk -- High Single A through High Triple B; Medium to High Risk -- Mid Triple B through High Double B; High to Speculative
Northam Platinum Ltd (NHMJ.J) 18 September 2008
Citigroup Global Markets Equity Research 28
Risk -- Mid Double B and Below. The risk rating element illustrates the analyst's opinion of the relative likelihood of loss of principal when a fixed income security issued by a company is held to maturity, based upon both fundamental and market risk factors. Certain reports published by Citi Investment Research will also include investment ratings on specific issues of companies under coverage which have been assigned fundamental credit opinions and risk ratings. Investment ratings are a function of Citi Investment Research's expectations for total return, relative return (relative to the performance of relevant Citi bond indices), and risk rating. These investment ratings are: Buy/Overweight -- the bond is expected to outperform the relevant Citigroup bond market sector index (Broad Investment Grade, High Yield Market or Emerging Market); Hold/Neutral Weight -- the bond is expected to perform in line with the relevant Citigroup bond market sector index; or Sell/Underweight -- the bond is expected to underperform the relevant Citigroup bond market sector index. Performance data for Citi bond indices are updated monthly, are available upon request and can also be viewed at http://sd.ny.ssmb.com/ using the "Indexes" tab.
OTHER DISCLOSURES The subject company's share price set out on the front page of this Product is quoted as at 18 September 2008 01:19 PM on the issuer's primary market.
For securities recommended in the Product in which the Firm is not a market maker, the Firm is a liquidity provider in the issuers' financial instruments and may act as principal in connection with such transactions. The Firm is a regular issuer of traded financial instruments linked to securities that may have been recommended in the Product. The Firm regularly trades in the securities of the subject company(ies) discussed in the Product. The Firm may engage in securities transactions in a manner inconsistent with the Product and, with respect to securities covered by the Product, will buy or sell from customers on a principal basis.
Securities recommended, offered, or sold by the Firm: (i) are not insured by the Federal Deposit Insurance Corporation; (ii) are not deposits or other obligations of any insured depository institution (including Citibank); and (iii) are subject to investment risks, including the possible loss of the principal amount invested. Although information has been obtained from and is based upon sources that the Firm believes to be reliable, we do not guarantee its accuracy and it may be incomplete and condensed. Note, however, that the Firm has taken all reasonable steps to determine the accuracy and completeness of the disclosures made in the Important Disclosures section of the Product. The Firm's research department has received assistance from the subject company(ies) referred to in this Product including, but not limited to, discussions with management of the subject company(ies). Firm policy prohibits research analysts from sending draft research to subject companies. However, it should be presumed that the author of the Product has had discussions with the subject company to ensure factual accuracy prior to publication. All opinions, projections and estimates constitute the judgment of the author as of the date of the Product and these, plus any other information contained in the Product, are subject to change without notice. Prices and availability of financial instruments also are subject to change without notice. Notwithstanding other departments within the Firm advising the companies discussed in this Product, information obtained in such role is not used in the preparation of the Product. Although Citi Investment Research does not set a predetermined frequency for publication, if the Product is a fundamental research report, it is the intention of Citi Investment Research to provide research coverage of the/those issuer(s) mentioned therein, including in response to news affecting this issuer, subject to applicable quiet periods and capacity constraints. The Product is for informational purposes only and is not intended as an offer or solicitation for the purchase or sale of a security. Any decision to purchase securities mentioned in the Product must take into account existing public information on such security or any registered prospectus.
Investing in non-U.S. securities, including ADRs, may entail certain risks. The securities of non-U.S. issuers may not be registered with, nor be subject to the reporting requirements of the U.S. Securities and Exchange Commission. There may be limited information available on foreign securities. Foreign companies are generally not subject to uniform audit and reporting standards, practices and requirements comparable to those in the U.S. Securities of some foreign companies may be less liquid and their prices more volatile than securities of comparable U.S. companies. In addition, exchange rate movements may have an adverse effect on the value of an investment in a foreign stock and its corresponding dividend payment for U.S. investors. Net dividends to ADR investors are estimated, using withholding tax rates conventions, deemed accurate, but investors are urged to consult their tax advisor for exact dividend computations. Investors who have received the Product from the Firm may be prohibited in certain states or other jurisdictions from purchasing securities mentioned in the Product from the Firm. Smith Barney clients can ask their Financial Advisor for additional details. Citigroup Global Markets Inc. takes responsibility for the Product in the United States. Any orders by US investors resulting from the information contained in the Product may be placed only through Citigroup Global Markets Inc.
The Citigroup legal entity that takes responsibility for the production of the Product is the legal entity which the first named author is employed by. The Product is made available in Australia to wholesale clients through Citigroup Global Markets Australia Pty Ltd. (ABN 64 003 114 832 and AFSL No. 240992) and to retail clients through Citi Smith Barney Pty Ltd. (ABN 19 009 145 555 and AFSL No. 240813), Participants of the ASX Group and regulated by the Australian Securities & Investments Commission. Citigroup Centre, 2 Park Street, Sydney, NSW 2000. The Product is made available in Australia to Private Banking wholesale clients through Citigroup Pty Limited (ABN 88 004 325 080 and AFSL 238098). Citigroup Pty Limited provides all financial product advice to Australian Private Banking wholesale clients through bankers and relationship managers. If there is any doubt about the suitability of investments held in Citigroup Private Bank accounts, investors should contact the Citigroup Private Bank in Australia. Citigroup companies may compensate affiliates and their representatives for providing products and services to clients. The Product is made available in Brazil by Citigroup Global Markets Brasil - CCTVM SA, which is regulated by CVM - Comissão de Valores Mobiliários, BACEN - Brazilian Central Bank, APIMEC - Associação Associação dos Analistas e Profissionais de Investimento do Mercado de Capitais and ANBID - Associação Nacional dos Bancos de Investimento. Av. Paulista, 1111 - 11º andar - CEP. 01311920 - São Paulo - SP. If the Product is being made available in certain provinces of Canada by Citigroup Global Markets (Canada) Inc. ("CGM Canada"), CGM Canada has approved the Product. Citigroup Place, 123 Front Street West, Suite 1100, Toronto, Ontario M5J 2M3. The Product is made available in France by Citigroup Global Markets Limited, which is authorised and regulated by Financial Services Authority. 1-5 Rue Paul Cézanne, 8ème, Paris, France. The Product may not be distributed to private clients in Germany. The Product is distributed in Germany by Citigroup Global Markets Deutschland AG & Co. KGaA, which is regulated by Bundesanstalt fuer Finanzdienstleistungsaufsicht (BaFin). Frankfurt am Main, Reuterweg 16, 60323 Frankfurt am Main. If the Product is made available in Hong Kong by, or on behalf of, Citigroup Global Markets Asia Ltd., it is attributable to Citigroup Global Markets Asia Ltd., Citibank Tower, Citibank Plaza, 3 Garden Road, Hong Kong. Citigroup Global Markets Asia Ltd. is regulated by Hong Kong Securities and Futures Commission. If the Product is made available in Hong Kong by The Citigroup Private Bank to its clients, it is attributable to Citibank N.A., Citibank Tower, Citibank Plaza, 3 Garden Road, Hong Kong. The Citigroup Private Bank and Citibank N.A. is regulated by the Hong Kong Monetary Authority. The Product is made available in India by Citigroup Global Markets India Private Limited, which is regulated by Securities and Exchange Board of India. Bakhtawar, Nariman Point, Mumbai 400-021. The Product is made available in Indonesia through PT Citigroup Securities Indonesia. 5/F, Citibank Tower, Bapindo Plaza, Jl. Jend. Sudirman Kav. 54-55, Jakarta 12190. Neither this Product nor any copy hereof may be distributed in Indonesia or to any Indonesian citizens wherever they are domiciled or to Indonesian residents except in compliance with applicable capital market laws and regulations. This Product is not an offer of securities in Indonesia. The securities referred to in this Product have not been registered with the Capital Market and Financial Institutions Supervisory Agency (BAPEPAM-LK) pursuant to relevant capital market laws and regulations, and may not be offered or sold within the territory of the Republic of Indonesia or to Indonesian citizens through a public offering or in circumstances which constitute an offer within the meaning of the Indonesian capital market laws and regulations. The Product is made available in Italy by Citigroup Global Markets Limited, which is authorised and regulated by Financial Services Authority. Foro Buonaparte 16, Milan, 20121, Italy. If the Product was prepared by Citi Investment Research and distributed in Japan by Nikko Citigroup Limited ("NCL"), it is being so distributed under license. If the Product was prepared by NCL and distributed by Nikko Cordial Securities Inc. or Citigroup Global Markets Inc. it is being so distributed under license. NCL is regulated by Financial
Northam Platinum Ltd (NHMJ.J) 18 September 2008
Citigroup Global Markets Equity Research 29
Services Agency, Securities and Exchange Surveillance Commission, Japan Securities Dealers Association, Tokyo Stock Exchange and Osaka Securities Exchange. Shin-Marunouchi Building, 1-5-1 Marunouchi, Chiyoda-ku, Tokyo 100-6520 Japan. In the event that an error is found in an NCL research report, a revised version will be posted on Citi Investment Research's Global Equities Online (GEO) website. If you have questions regarding GEO, please call (81 3) 6270-3019 for help. The Product is made available in Korea by Citigroup Global Markets Korea Securities Ltd., which is regulated by Financial Supervisory Commission and the Financial Supervisory Service. Hungkuk Life Insurance Building, 226 Shinmunno 1-GA, Jongno-Gu, Seoul, 110-061. The Product is made available in Malaysia by Citigroup Global Markets Malaysia Sdn Bhd, which is regulated by Malaysia Securities Commission. Menara Citibank, 165 Jalan Ampang, Kuala Lumpur, 50450. The Product is made available in Mexico by Acciones y Valores Banamex, S.A. De C. V., Casa de Bolsa, which is regulated by Comision Nacional Bancaria y de Valores. Reforma 398, Col. Juarez, 06600 Mexico, D.F. In New Zealand the Product is made available through Citigroup Global Markets New Zealand Ltd. (Company Number 604457), a Participant of the New Zealand Exchange Limited and regulated by the New Zealand Securities Commission. Level 19, Mobile on the Park, 157 Lambton Quay, Wellington. The Product is made available in Pakistan by Citibank N.A. Pakistan branch, which is regulated by the State Bank of Pakistan and Securities Exchange Commission, Pakistan. AWT Plaza, 1.1. Chundrigar Road, P.O. Box 4889, Karachi-74200. The Product is made available in Poland by Dom Maklerski Banku Handlowego SA an indirect subsidiary of Citigroup Inc., which is regulated by Komisja Papierów Wartosciowych i Gield. Bank Handlowy w Warszawie S.A. ul. Senatorska 16, 00-923 Warszawa. The Product is made available in the Russian Federation through ZAO Citibank, which is licensed to carry out banking activities in the Russian Federation in accordance with the general banking license issued by the Central Bank of the Russian Federation and brokerage activities in accordance with the license issued by the Federal Service for Financial Markets. Neither the Product nor any information contained in the Product shall be considered as advertising the securities mentioned in this report within the territory of the Russian Federation or outside the Russian Federation. The Product does not constitute an appraisal within the meaning of the Federal Law of the Russian Federation of 29 July 1998 No. 135-FZ (as amended) On Appraisal Activities in the Russian Federation. 8-10 Gasheka Street, 125047 Moscow. The Product is made available in Singapore through Citigroup Global Markets Singapore Pte. Ltd., a Capital Markets Services Licence holder, and regulated by Monetary Authority of Singapore. 1 Temasek Avenue, #39-02 Millenia Tower, Singapore 039192. The Product is made available by The Citigroup Private Bank in Singapore through Citibank, N.A., Singapore branch, a licensed bank in Singapore that is regulated by Monetary Authority of Singapore. Citigroup Global Markets (Pty) Ltd. is incorporated in the Republic of South Africa (company registration number 2000/025866/07) and its registered office is at 145 West Street, Sandton, 2196, Saxonwold. Citigroup Global Markets (Pty) Ltd. is regulated by JSE Securities Exchange South Africa, South African Reserve Bank and the Financial Services Board. The investments and services contained herein are not available to private customers in South Africa. The Product is made available in Spain by Citigroup Global Markets Limited, which is authorised and regulated by Financial Services Authority. 29 Jose Ortega Y Gassef, 4th Floor, Madrid, 28006, Spain. The Product is made available in Taiwan through Citigroup Global Markets Taiwan Securities Company Ltd., which is regulated by Securities & Futures Bureau. No portion of the report may be reproduced or quoted in Taiwan by the press or any other person. No. 8 Manhattan Building, Hsin Yi Road, Section 5, Taipei 100, Taiwan. The Product is made available in Thailand through Citicorp Securities (Thailand) Ltd., which is regulated by the Securities and Exchange Commission of Thailand. 18/F, 22/F and 29/F, 82 North Sathorn Road, Silom, Bangrak, Bangkok 10500, Thailand. The Product is made available in Turkey through Citibank AS which is regulated by Capital Markets Board. Tekfen Tower, Eski Buyukdere Caddesi # 209 Kat 2B, 23294 Levent, Istanbul, Turkey. The Product is made available in U.A.E. by Citigroup Global Markets Limited, which is authorised and regulated by Financial Services Authority. DIFC, Bldg 2, Level 7, PO Box 506560, Dubai, UAE. The Product is made available in United Kingdom by Citigroup Global Markets Limited, which is authorised and regulated by Financial Services Authority. This material may relate to investments or services of a person outside of the UK or to other matters which are not regulated by the FSA and further details as to where this may be the case are available upon request in respect of this material. Citigroup Centre, Canada Square, Canary Wharf, London, E14 5LB. The Product is made available in United States by Citigroup Global Markets Inc, which is regulated by NASD, NYSE and the US Securities and Exchange Commission. 388 Greenwich Street, New York, NY 10013. Unless specified to the contrary, within EU Member States, the Product is made available by Citigroup Global Markets Limited, which is regulated by Financial Services Authority. Many European regulators require that a firm must establish, implement and make available a policy for managing conflicts of interest arising as a result of publication or distribution of investment research. The policy applicable to Citi Investment Research's Products can be found at www.citigroupgeo.com. Compensation of equity research analysts is determined by equity research management and Citigroup's senior management and is not linked to specific transactions or recommendations. The Product may have been distributed simultaneously, in multiple formats, to the Firm's worldwide institutional and retail customers. The Product is not to be construed as providing investment services in any jurisdiction where the provision of such services would not be permitted. Subject to the nature and contents of the Product, the investments described therein are subject to fluctuations in price and/or value and investors may get back less than originally invested. Certain high-volatility investments can be subject to sudden and large falls in value that could equal or exceed the amount invested. Certain investments contained in the Product may have tax implications for private customers whereby levels and basis of taxation may be subject to change. If in doubt, investors should seek advice from a tax adviser. The Product does not purport to identify the nature of the specific market or other risks associated with a particular transaction. Advice in the Product is general and should not be construed as personal advice given it has been prepared without taking account of the objectives, financial situation or needs of any particular investor. Accordingly, investors should, before acting on the advice, consider the appropriateness of the advice, having regard to their objectives, financial situation and needs. Prior to acquiring any financial product, it is the client's responsibility to obtain the relevant offer document for the product and consider it before making a decision as to whether to purchase the product.
© 2008 Citigroup Global Markets Inc. (© Nikko Citigroup Limited, if this Product was prepared by it). Citi Investment Research is a division and service mark of Citigroup Global Markets Inc. and its affiliates and is used and registered throughout the world. Citi and Citi with Arc Design are trademarks and service marks of Citigroup Inc and its affiliates and are used and registered throughout the world. Nikko is a registered trademark of Nikko Cordial Corporation. All rights reserved. Any unauthorized use, duplication, redistribution or disclosure is prohibited by law and will result in prosecution. Where included in this report, MSCI sourced information is the exclusive property of Morgan Stanley Capital International Inc. (MSCI). Without prior written permission of MSCI, this information and any other MSCI intellectual property may not be reproduced, redisseminated or used to create any financial products, including any indices. This information is provided on an "as is" basis. The user assumes the entire risk of any use made of this information. MSCI, its affiliates and any third party involved in, or related to, computing or compiling the information hereby expressly disclaim all warranties of originality, accuracy, completeness, merchantability or fitness for a particular purpose with respect to any of this information. Without limiting any of the foregoing, in no event shall MSCI, any of its affiliates or any third party involved in, or related to, computing or compiling the information have any liability for any damages of any kind. MSCI, Morgan Stanley Capital International and the MSCI indexes are services marks of MSCI and its affiliates. The Global Industry Classification Standard (GICS) was developed by and is the exclusive property of Morgan Stanley Capital International Inc and Standard & Poor’s. GICS is a service mark of MSCI and S&P and has been licensed for use by Citi. The information contained in the Product is intended solely for the recipient and may not be further distributed by the recipient. The Firm accepts no liability whatsoever for the actions of third parties. The Product may provide the addresses of, or contain hyperlinks to, websites. Except to the extent to which the Product refers to website material of the Firm, the Firm has not reviewed the linked site. Equally, except to the extent to which the Product refers to website material of the Firm, the Firm takes no responsibility for, and makes no representations or warranties whatsoever as to, the data and information contained therein. Such address or hyperlink (including addresses or hyperlinks to website material of the Firm) is provided solely for your convenience and information and the content of the linked site does not in anyway form part of this document. Accessing such website or following such link through the Product or the website of the Firm shall be at your own risk and the Firm shall have no liability arising out of, or in connection with, any such referenced website.
ADDITIONAL INFORMATION IS AVAILABLE UPON REQUEST