1 Ohio Health Care Employment Labor Market Trends and Challenges.
36
1 Ohio Health Care Employment Labor Market Trends and Challenges
-
Upload
shannon-gibbs -
Category
Documents
-
view
220 -
download
2
Transcript of 1 Ohio Health Care Employment Labor Market Trends and Challenges.

1
Ohio Health Care EmploymentLabor Market Trends and Challenges
2
Health Care: Industries,Occupations & Training
Occupations
Industries
Training
3
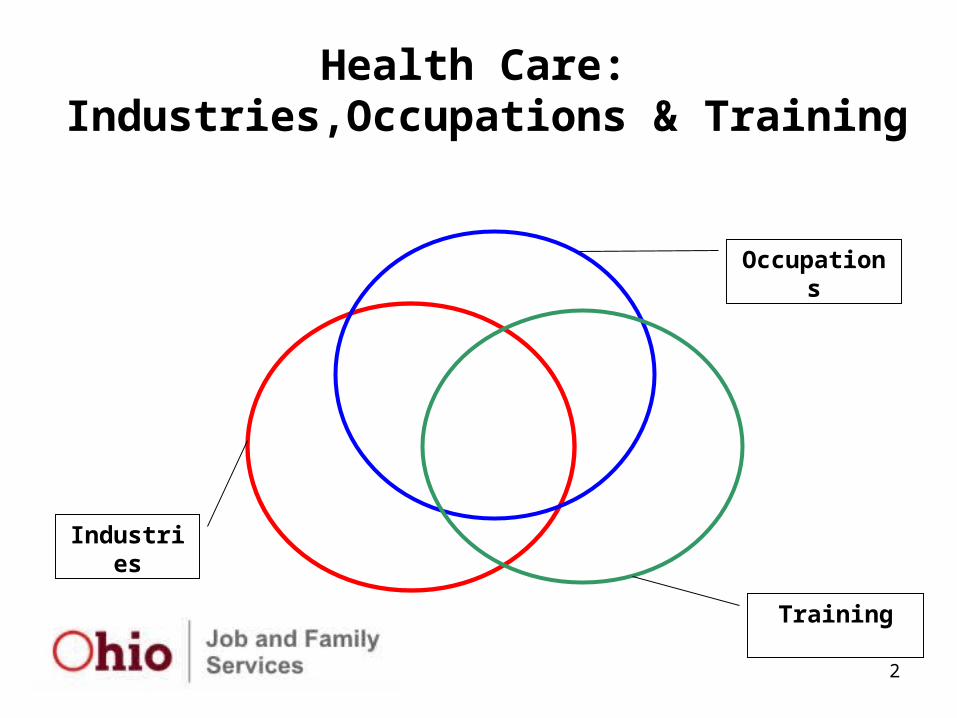
Ohio Employment Growth, 1976-2009
0
50
100
150
200
250
1976
1978
1980
1982
1984
1986
1988
1990
1992
1994
1996
1998
2000
2002
2004
2006
2008
Em
plo
ymen
t In
dex
(19
76=
100)
Health Care Total
4
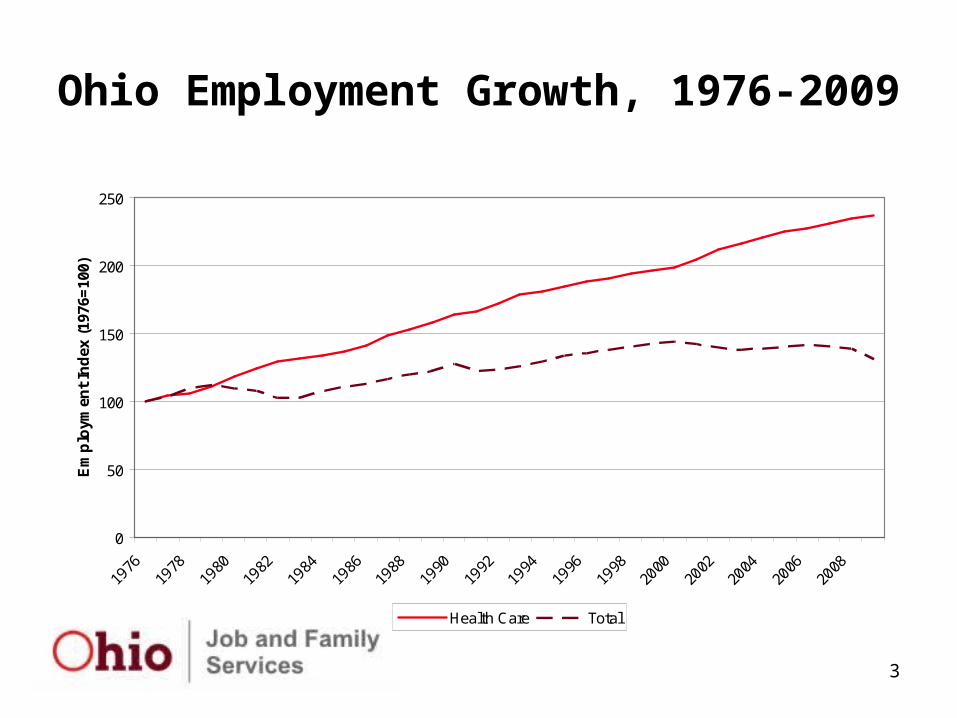
Ohio Nonfarm Wage and Salary Employment, 2007-2010
4,500
4,600
4,700
4,800
4,900
5,000
5,100
5,200
5,300
5,400
5,500
5,600
Jan Feb Mar Apr May Jun Jul Aug Sep Oct Nov Dec
Em
plo
ym
en
t (t
ho
us
an
ds
)
2007 2008 2009 2010
5
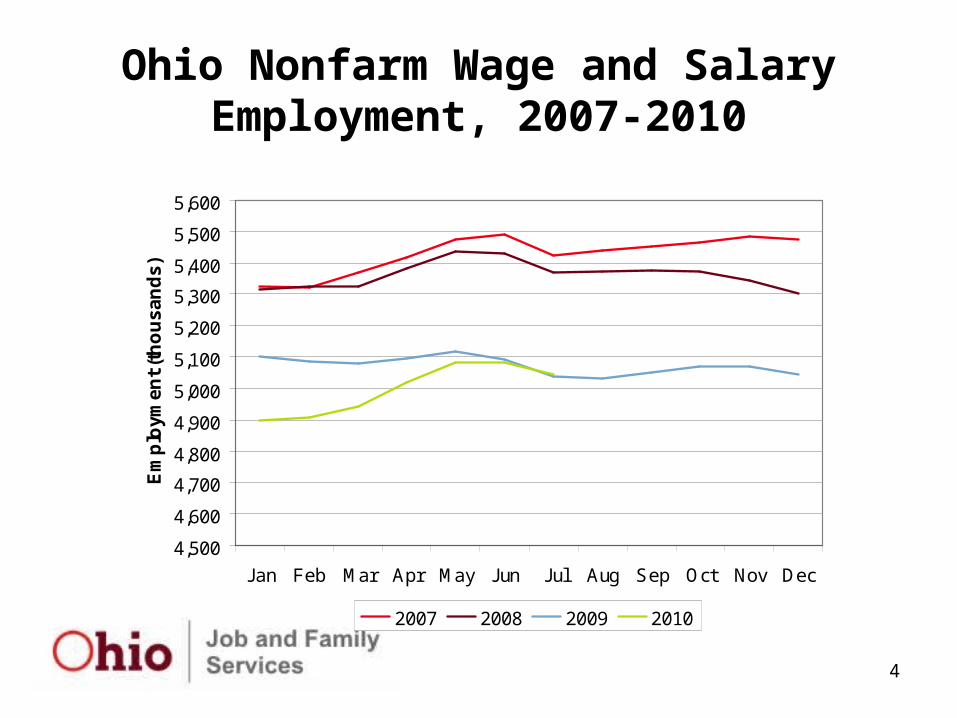
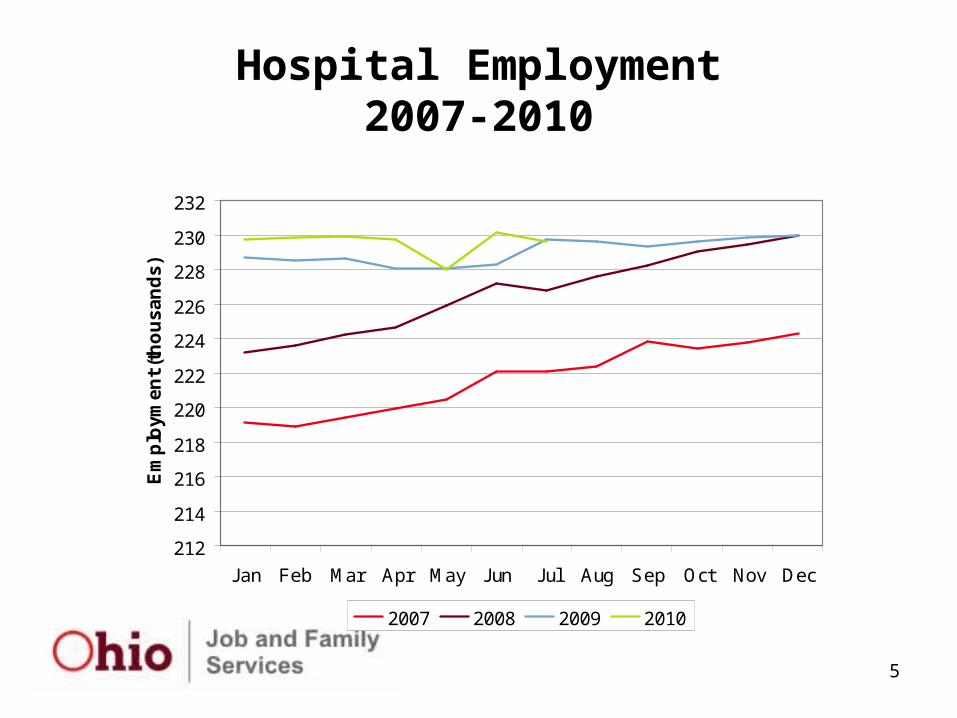
Hospital Employment2007-2010
212
214
216
218
220
222
224
226
228
230
232
Jan Feb Mar Apr May Jun Jul Aug Sep Oct Nov Dec
Em
plo
ym
en
t (t
ho
us
an
ds
)
2007 2008 2009 2010
6
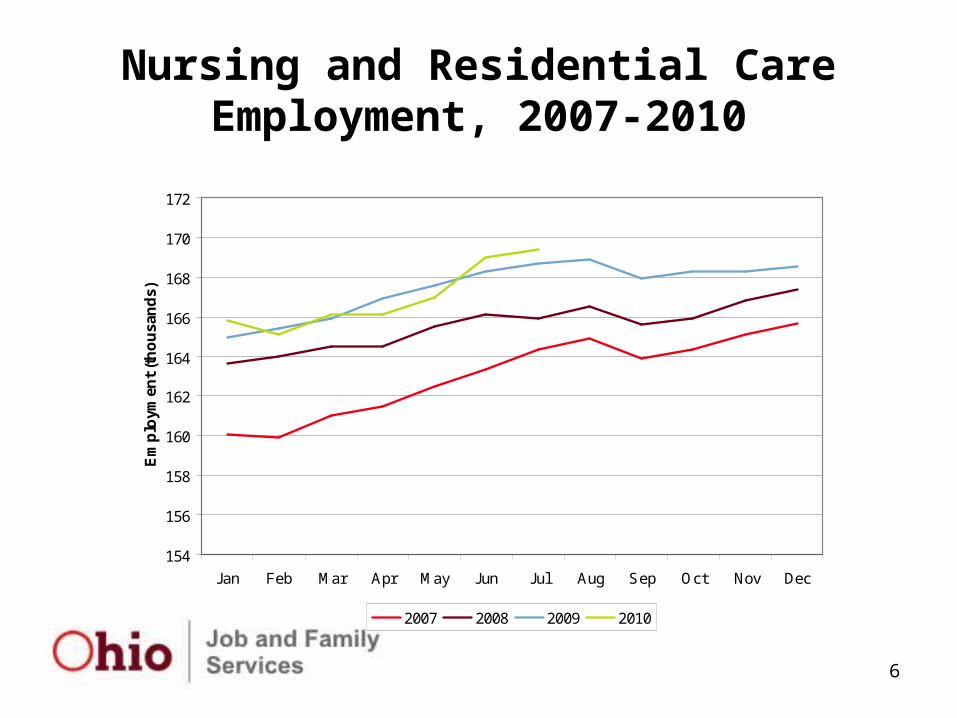
Nursing and Residential Care Employment, 2007-2010
154
156
158
160
162
164
166
168
170
172
Jan Feb Mar Apr May Jun Jul Aug Sep Oct Nov Dec
Em
plo
ymen
t (t
ho
usa
nd
s)
2007 2008 2009 2010
7
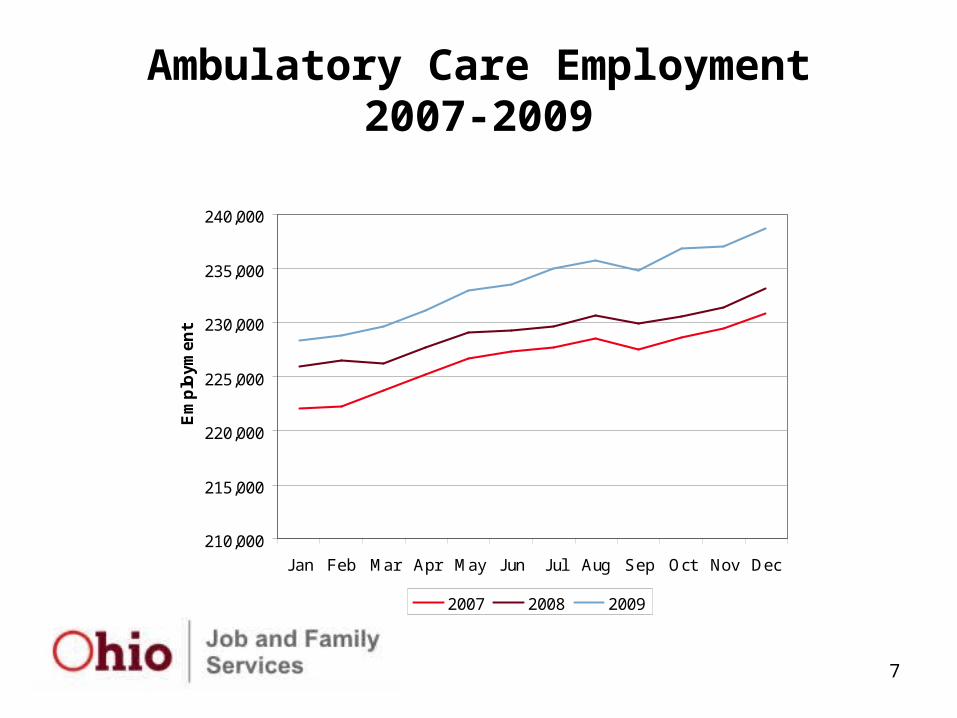
Ambulatory Care Employment2007-2009
210,000
215,000
220,000
225,000
230,000
235,000
240,000
Jan Feb Mar Apr May Jun Jul Aug Sep Oct Nov Dec
Em
plo
ym
en
t
2007 2008 2009
8
Growth Drivers
• Medical technology advances
• Aging population
• Expanded health care coverage
• Difficult to outsource
9
Health Care Industries
• Ambulatory health care services – (NAICS 621)
• Hospitals – (NAICS 622)
• Nursing and residential care facilities– (NAICS 623)
• Ambulatory health care services – (NAICS 621)
10
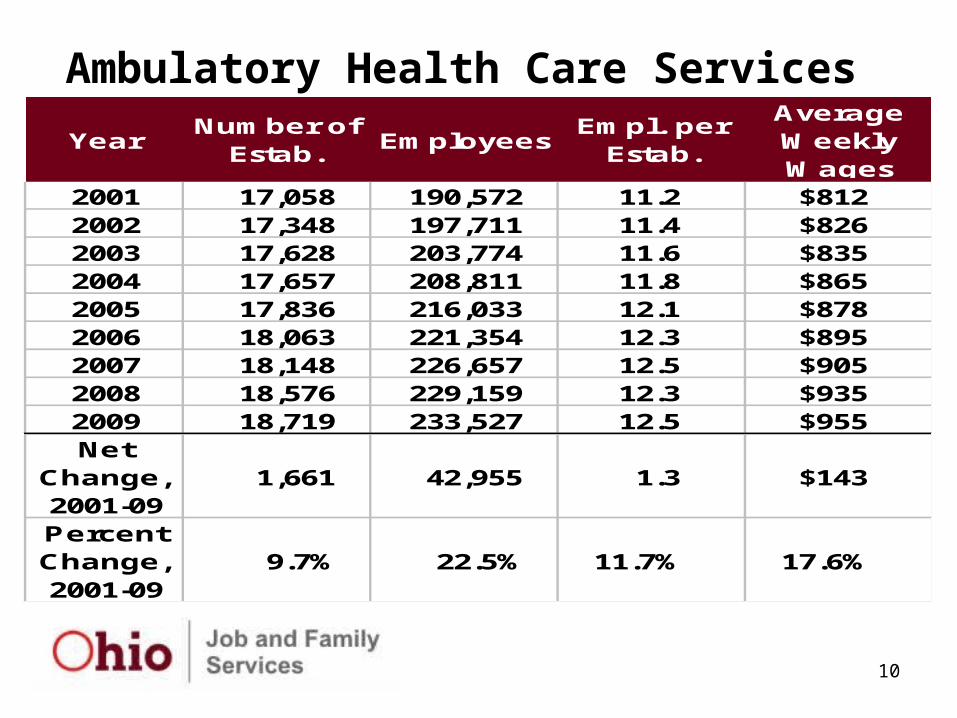
Ambulatory Health Care Services Year
Number of Estab.
EmployeesEmpl. per
Estab.
Average Weekly Wages
2001 17,058 190,572 11.2 $8122002 17,348 197,711 11.4 $8262003 17,628 203,774 11.6 $8352004 17,657 208,811 11.8 $8652005 17,836 216,033 12.1 $8782006 18,063 221,354 12.3 $8952007 18,148 226,657 12.5 $9052008 18,576 229,159 12.3 $9352009 18,719 233,527 12.5 $955Net
Change, 2001-09
1,661 42,955 1.3 $143
Percent Change, 2001-09
9.7% 22.5% 11.7% 17.6%
11
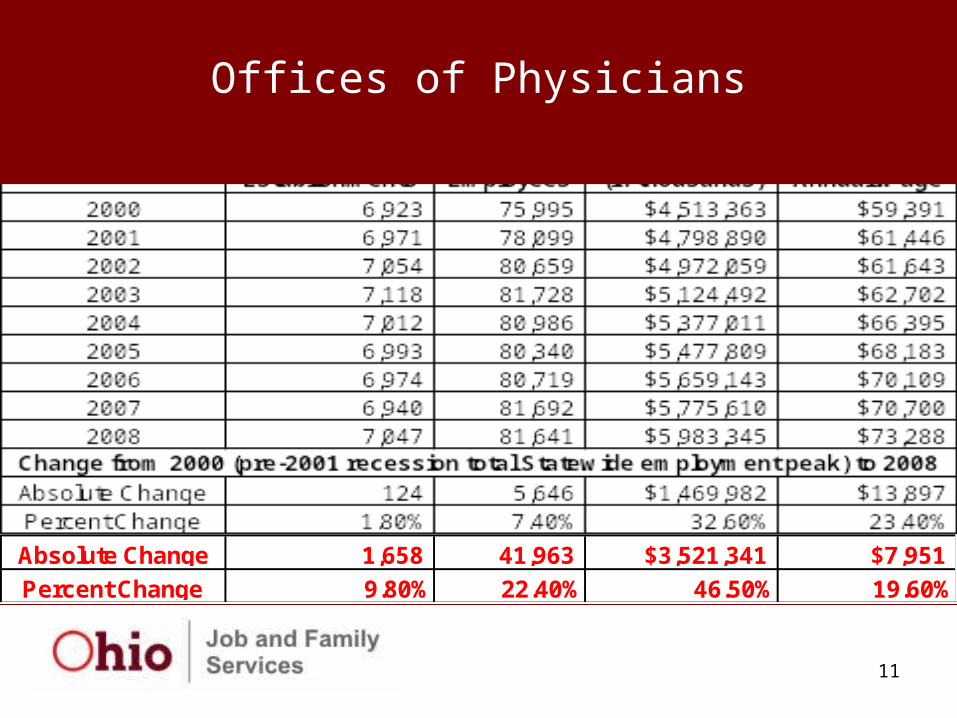
Offices of Physicians
Absolute Change 1,658 41,963 $3,521,341 $7,951
Percent Change 9.80% 22.40% 46.50% 19.60%
12
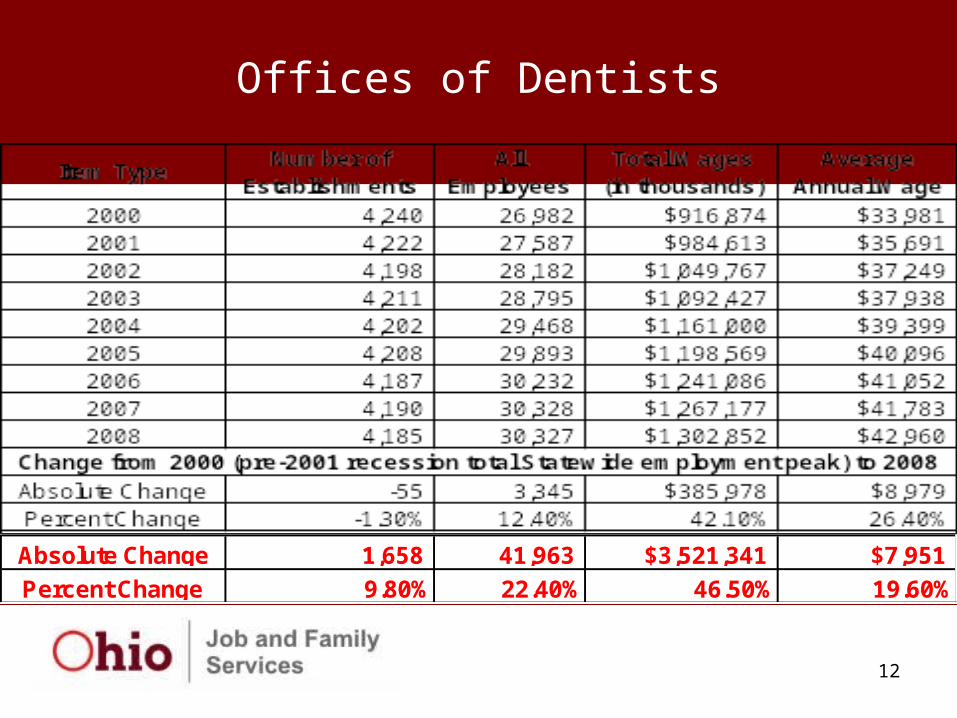
Offices of Dentists
Absolute Change 1,658 41,963 $3,521,341 $7,951
Percent Change 9.80% 22.40% 46.50% 19.60%
13
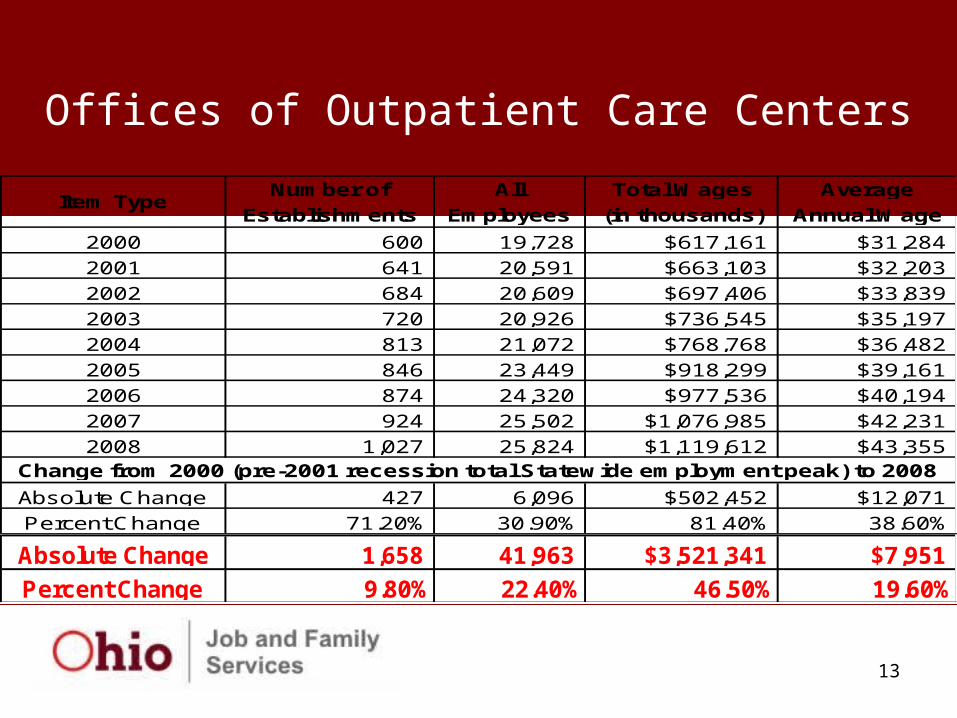
Offices of Outpatient Care Centers
Number of All Total Wages Average
Establishments Employees (in thousands) Annual Wage
2000 600 19,728 $617,161 $31,284
2001 641 20,591 $663,103 $32,203
2002 684 20,609 $697,406 $33,839
2003 720 20,926 $736,545 $35,197
2004 813 21,072 $768,768 $36,482
2005 846 23,449 $918,299 $39,161
2006 874 24,320 $977,536 $40,194
2007 924 25,502 $1,076,985 $42,231
2008 1,027 25,824 $1,119,612 $43,355
Absolute Change 427 6,096 $502,452 $12,071
Percent Change 71.20% 30.90% 81.40% 38.60%
Item Type
Change from 2000 (pre-2001 recession total Statewide employment peak) to 2008
Absolute Change 1,658 41,963 $3,521,341 $7,951
Percent Change 9.80% 22.40% 46.50% 19.60%
14
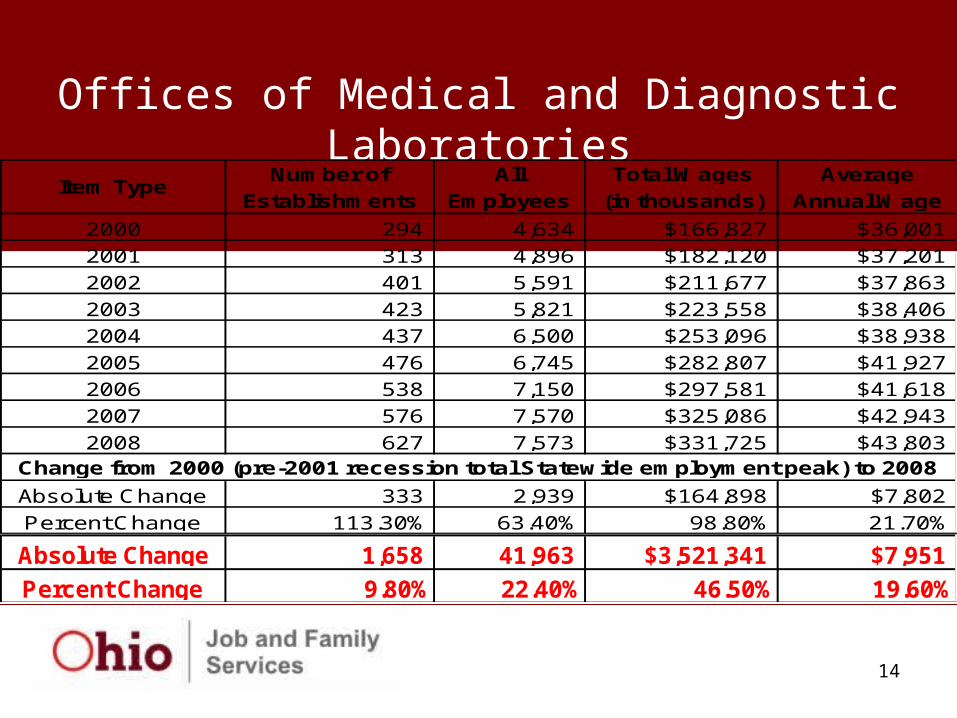
Offices of Medical and Diagnostic Laboratories
Number of All Total Wages Average
Establishments Employees (in thousands) Annual Wage
2000 294 4,634 $166,827 $36,001
2001 313 4,896 $182,120 $37,201
2002 401 5,591 $211,677 $37,863
2003 423 5,821 $223,558 $38,406
2004 437 6,500 $253,096 $38,938
2005 476 6,745 $282,807 $41,927
2006 538 7,150 $297,581 $41,618
2007 576 7,570 $325,086 $42,943
2008 627 7,573 $331,725 $43,803
Absolute Change 333 2,939 $164,898 $7,802
Percent Change 113.30% 63.40% 98.80% 21.70%
Item Type
Change from 2000 (pre-2001 recession total Statewide employment peak) to 2008
Absolute Change 1,658 41,963 $3,521,341 $7,951
Percent Change 9.80% 22.40% 46.50% 19.60%
15
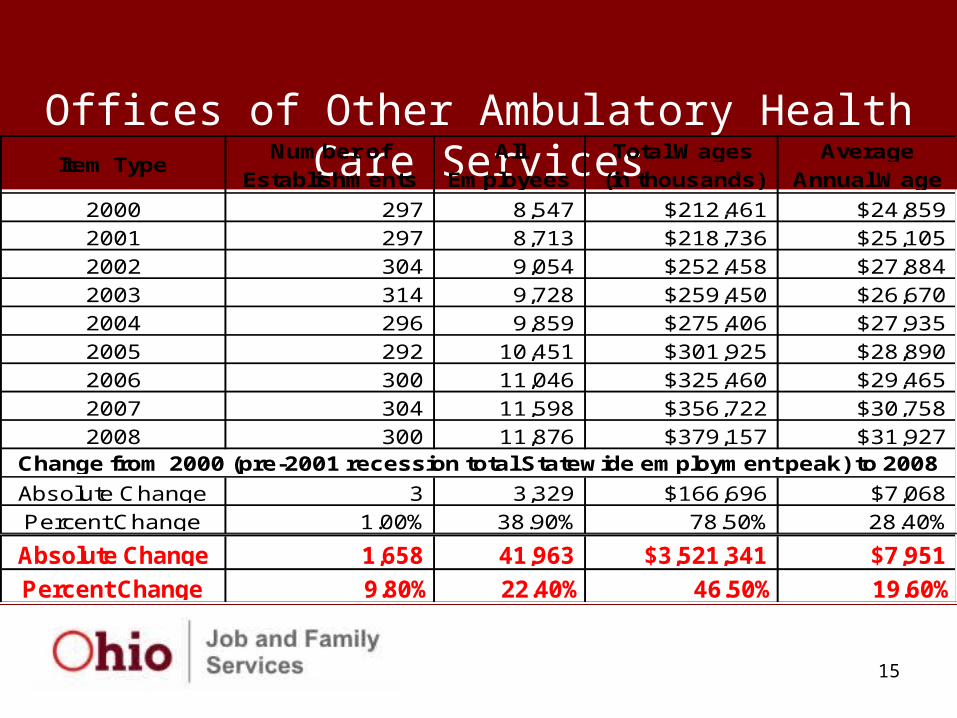
Offices of Other Ambulatory Health Care ServicesNumber of All Total Wages Average
Establishments Employees (in thousands) Annual Wage
2000 297 8,547 $212,461 $24,859
2001 297 8,713 $218,736 $25,105
2002 304 9,054 $252,458 $27,884
2003 314 9,728 $259,450 $26,670
2004 296 9,859 $275,406 $27,935
2005 292 10,451 $301,925 $28,890
2006 300 11,046 $325,460 $29,465
2007 304 11,598 $356,722 $30,758
2008 300 11,876 $379,157 $31,927
Absolute Change 3 3,329 $166,696 $7,068
Percent Change 1.00% 38.90% 78.50% 28.40%
Item Type
Change from 2000 (pre-2001 recession total Statewide employment peak) to 2008
Absolute Change 1,658 41,963 $3,521,341 $7,951
Percent Change 9.80% 22.40% 46.50% 19.60%
18
Occupations and Wages in Health Care Industries
• Staffing patterns in the health care industries are bi-modal: both high-skill/high-wage and low-skill/low-wage jobs.
19
Health Care Occupations
• 76 health care occupations • Projected growth of 20.4% between 2006 and
2016 –117,000 new jobs• 18 of the 30 fastest growing occupations in Ohio
are health care occupations• More than 21,000 openings annually• About 44% of openings will be for replacements,
not growth
20
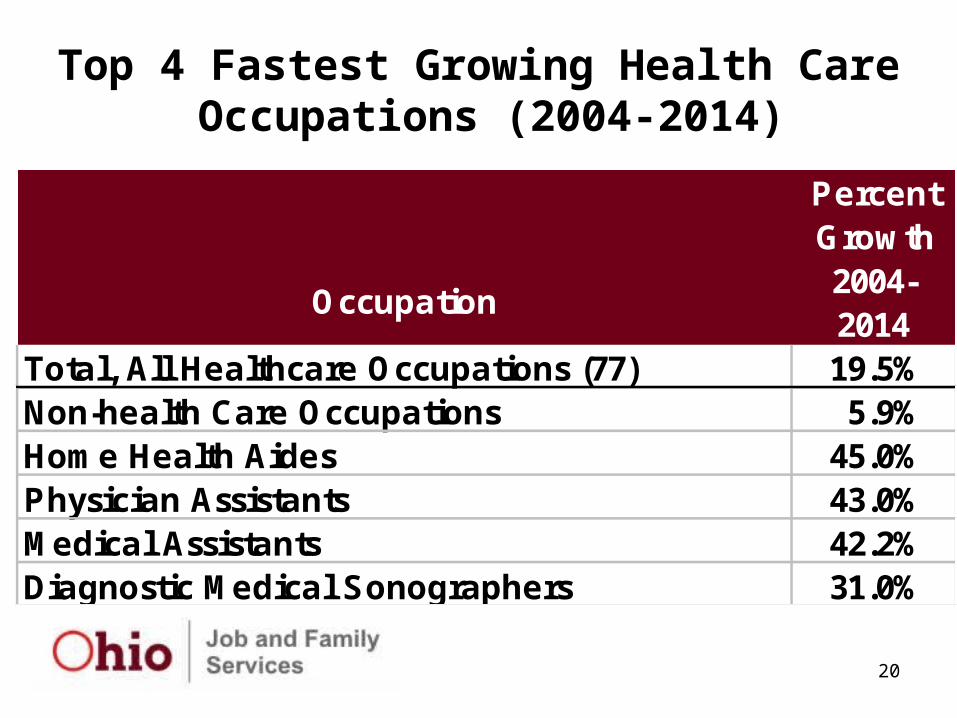
Top 4 Fastest Growing Health Care Occupations (2004-2014)
Percent Growth
Occupation2004-2014
Total, All Healthcare Occupations (77) 19.5%Non-health Care Occupations 5.9%Home Health Aides 45.0%Physician Assistants 43.0%Medical Assistants 42.2%Diagnostic Medical Sonographers 31.0%
21
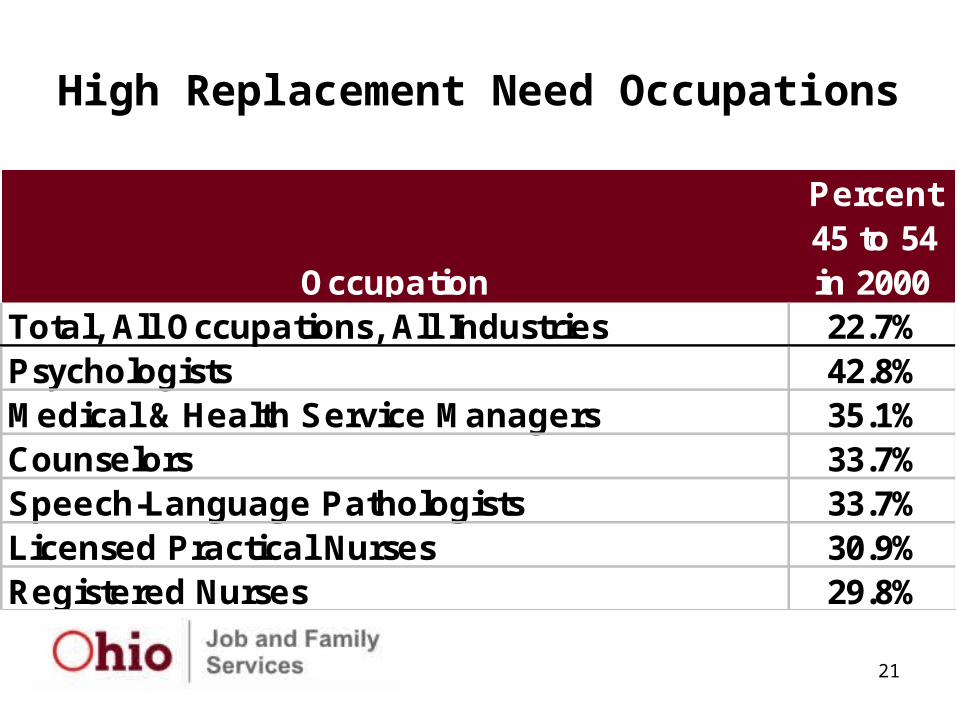
High Replacement Need Occupations
Percent 45 to 54
Occupation in 2000Total, All Occupations, All Industries 22.7%Psychologists 42.8%Medical & Health Service Managers 35.1%Counselors 33.7%Speech-Language Pathologists 33.7%Licensed Practical Nurses 30.9%Registered Nurses 29.8%
22
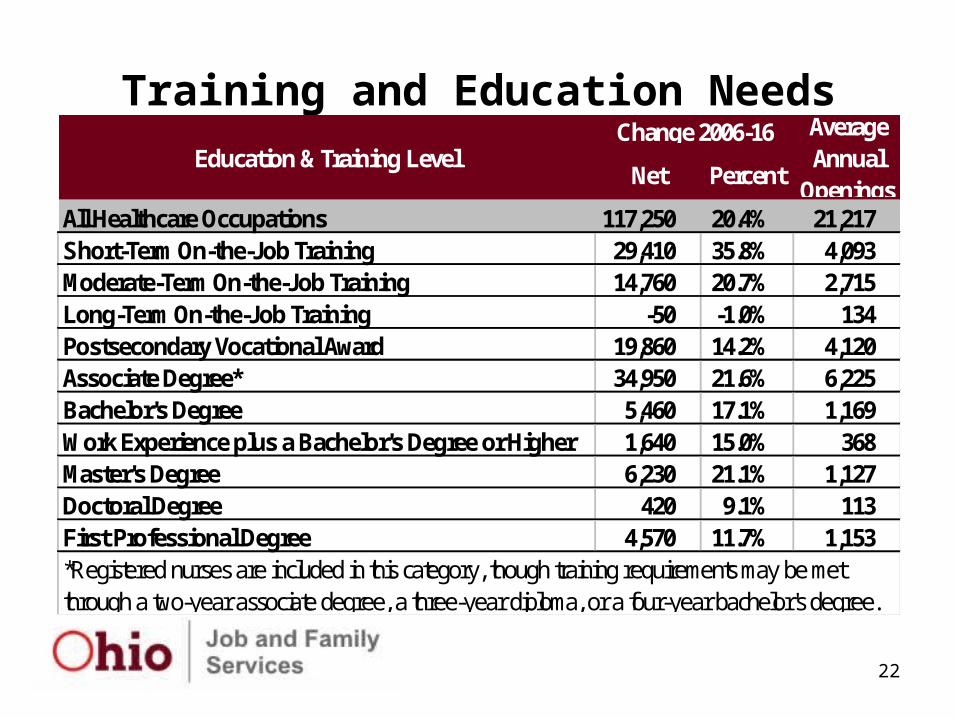
Training and Education Needs
Net Percent
All Healthcare Occupations 117,250 20.4% 21,217Short-Term On-the-Job Training 29,410 35.8% 4,093Moderate-Term On-the-Job Training 14,760 20.7% 2,715Long-Term On-the-Job Training -50 -1.0% 134Postsecondary Vocational Award 19,860 14.2% 4,120Associate Degree* 34,950 21.6% 6,225Bachelor's Degree 5,460 17.1% 1,169Work Experience plus a Bachelor's Degree or Higher 1,640 15.0% 368Master's Degree 6,230 21.1% 1,127Doctoral Degree 420 9.1% 113First Professional Degree 4,570 11.7% 1,153*Registered nurses are included in this category, though training requirements may be met through a two-year associate degree, a three-year diploma, or a four-year bachelor's degree.
Education & Training LevelChange 2006-16 Average
Annual Openings

23
Outlook for Key Occupations
Net PercentRegistered Nurses 25,590 22.6% 4,425 $28.72Nursing Aides, Orderlies, and Attendants 11,110 14.4% 1,801 $11.57Licensed Practical and Licensed Vocational Nurses 5,380 13.9% 1,593 $19.19Medical Secretaries 4,070 13.3% 895 $13.72Cooks, Institution and Cafeteria 0 0.0% 657 $12.21Medical Assistants 6,090 32.1% 845 $13.16Dental Assistants 2,090 20.8% 383 $15.54Radiologic Technologists and Technicians 1,300 13.3% 262 $23.91Social and Human Service Assistants 2,630 33.6% 354 $13.27Dental Hygienists 1,320 20.9% 253 $29.82
Occupational TitleGrowth, 2006-16 Avg. Ann.
Openings2009 Avg. Hr. Wage
24
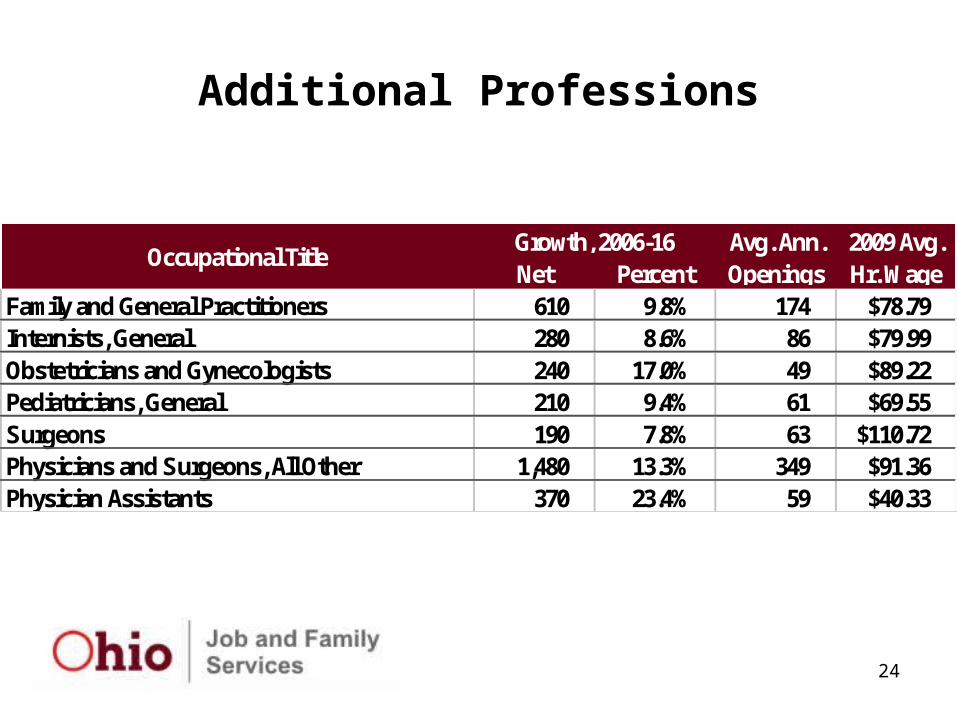
Additional Professions
Net PercentFamily and General Practitioners 610 9.8% 174 $78.79Internists, General 280 8.6% 86 $79.99Obstetricians and Gynecologists 240 17.0% 49 $89.22Pediatricians, General 210 9.4% 61 $69.55Surgeons 190 7.8% 63 $110.72Physicians and Surgeons, All Other 1,480 13.3% 349 $91.36Physician Assistants 370 23.4% 59 $40.33
Occupational TitleGrowth, 2006-16 Avg. Ann.
Openings2009 Avg. Hr. Wage
25
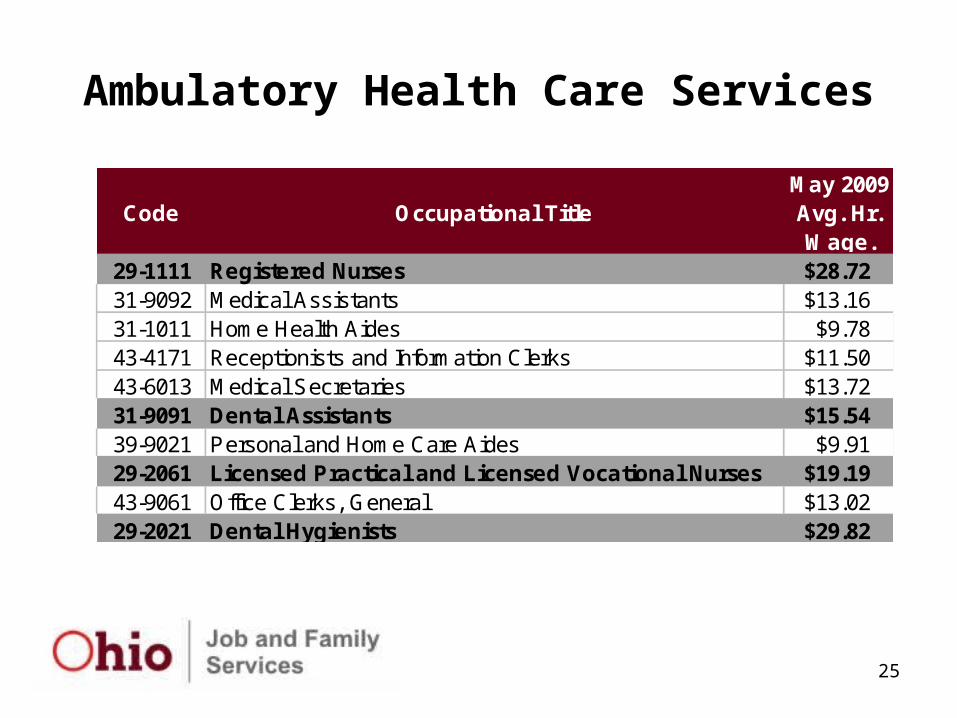
Ambulatory Health Care Services
Code Occupational TitleMay 2009 Avg. Hr. Wage.
29-1111 Registered Nurses $28.7231-9092 Medical Assistants $13.1631-1011 Home Health Aides $9.7843-4171 Receptionists and Information Clerks $11.5043-6013 Medical Secretaries $13.7231-9091 Dental Assistants $15.5439-9021 Personal and Home Care Aides $9.9129-2061 Licensed Practical and Licensed Vocational Nurses $19.1943-9061 Office Clerks, General $13.0229-2021 Dental Hygienists $29.82
28
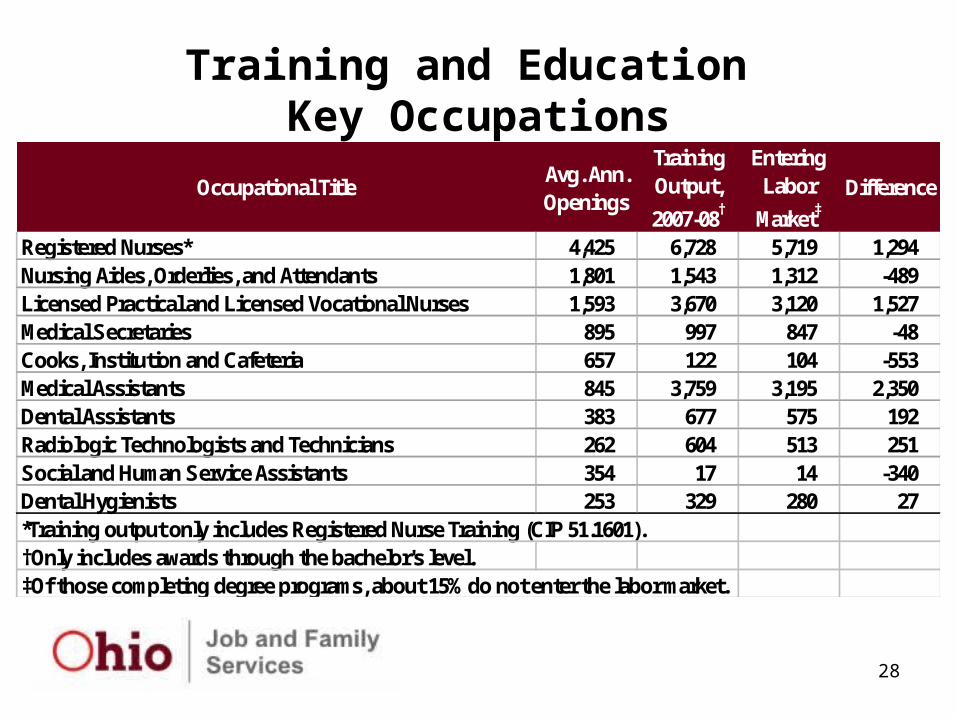
Training and Education Key Occupations
Occupational TitleAvg. Ann. Openings
Training Output,
2007-08†
Entering Labor
Market‡
Difference
Registered Nurses* 4,425 6,728 5,719 1,294Nursing Aides, Orderlies, and Attendants 1,801 1,543 1,312 -489Licensed Practical and Licensed Vocational Nurses 1,593 3,670 3,120 1,527Medical Secretaries 895 997 847 -48Cooks, Institution and Cafeteria 657 122 104 -553Medical Assistants 845 3,759 3,195 2,350Dental Assistants 383 677 575 192Radiologic Technologists and Technicians 262 604 513 251Social and Human Service Assistants 354 17 14 -340Dental Hygienists 253 329 280 27*Training output only includes Registered Nurse Training (CIP 51.1601).†Only includes awards through the bachelor's level.‡Of those completing degree programs, about 15% do not enter the labor market.

29
Health Care-Related Occupational Projections
by Training Needs

30
Health Care-Related Occupational Projections
by Training Needs
31
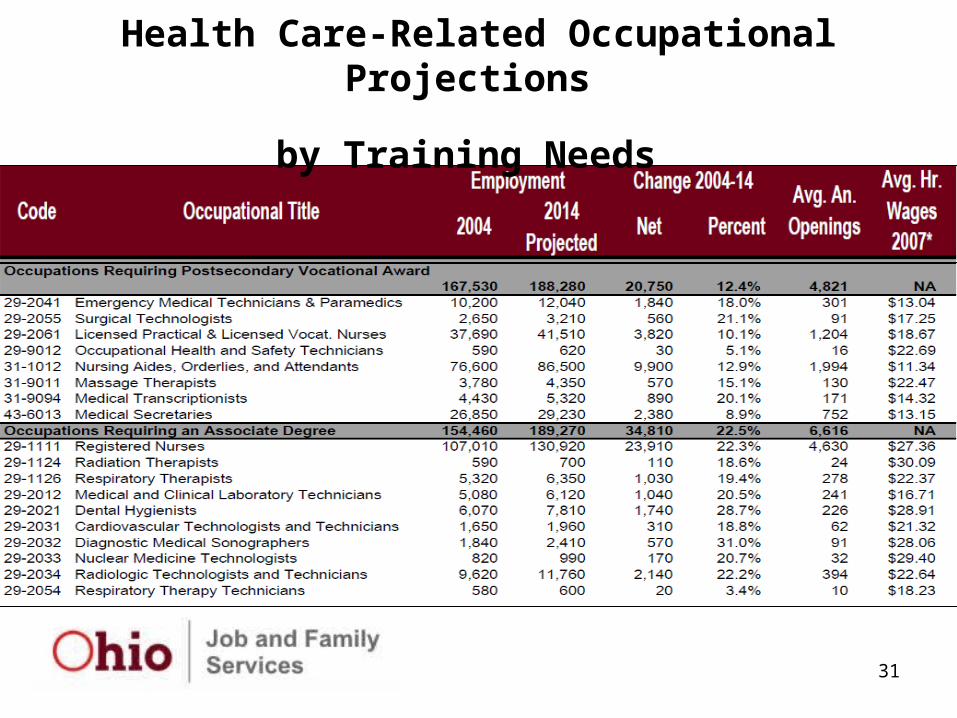
Health Care-Related Occupational Projections
by Training Needs
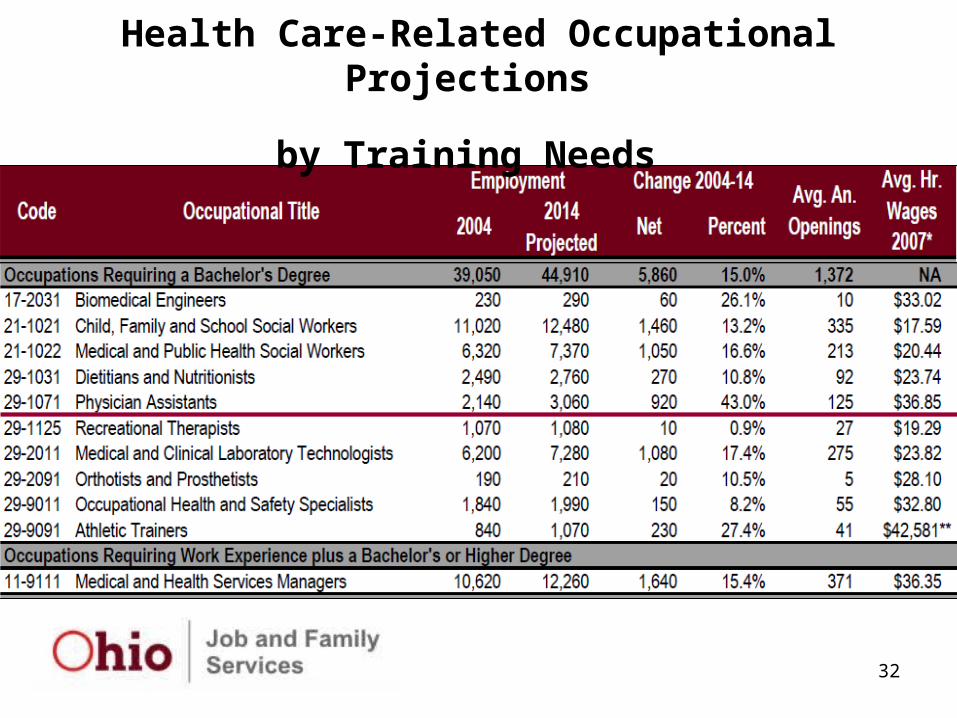
32
Health Care-Related Occupational Projections
by Training Needs
33
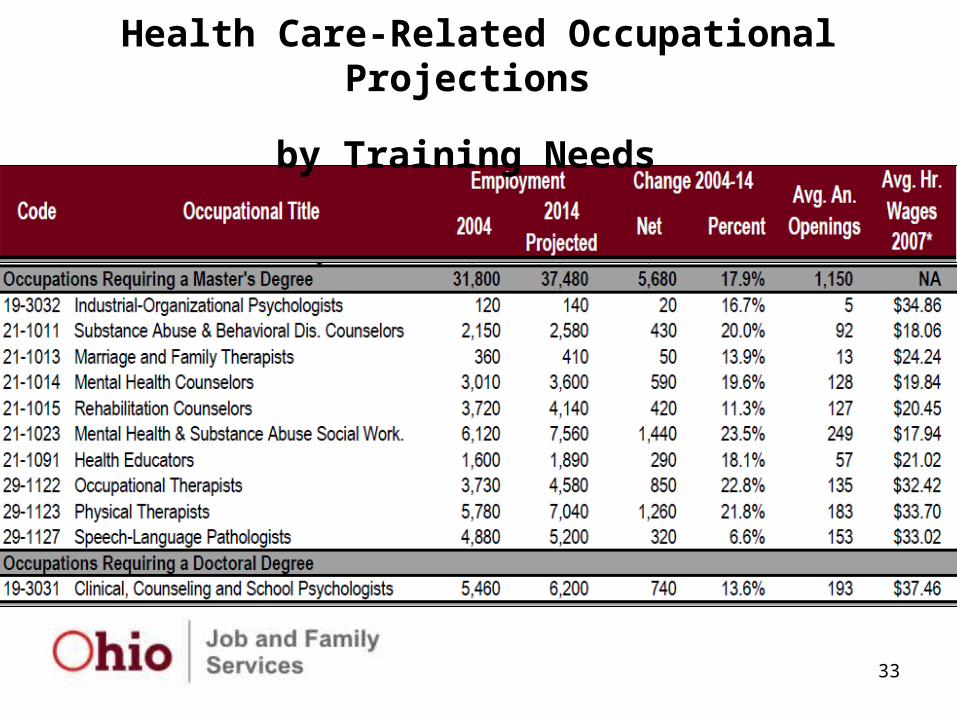
Health Care-Related Occupational Projections
by Training Needs
34
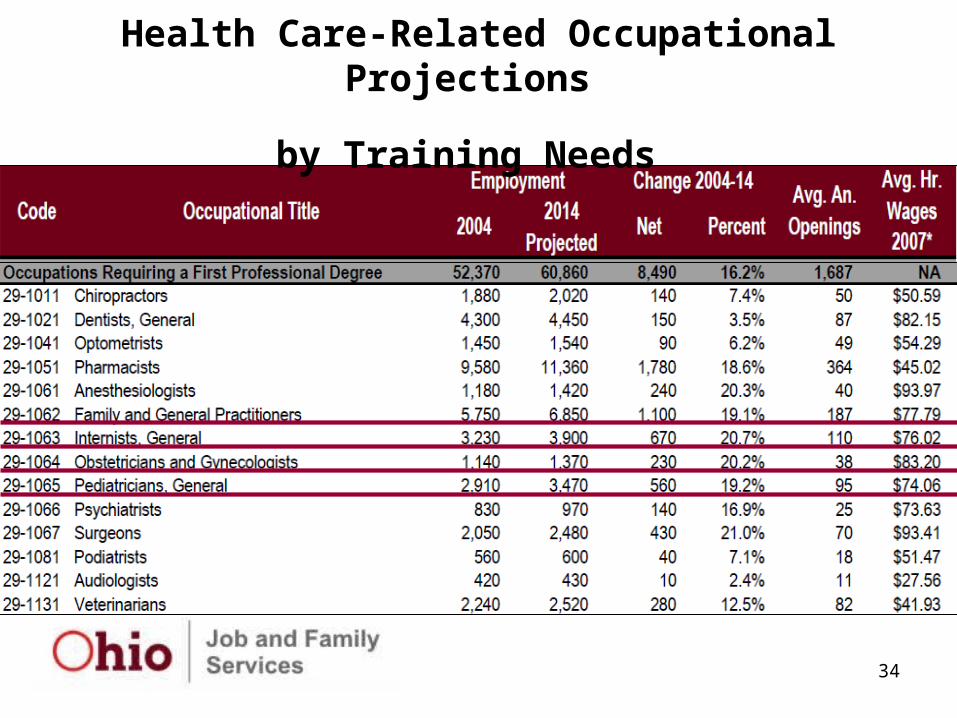
Health Care-Related Occupational Projections
by Training Needs
35
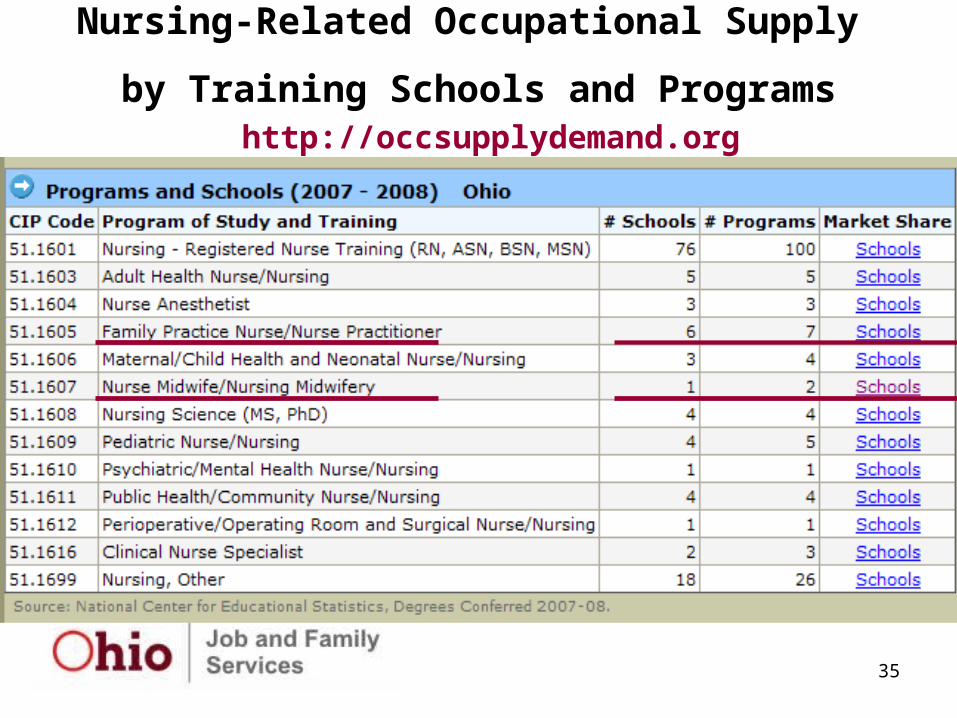
Nursing-Related Occupational Supply
by Training Schools and Programshttp://occsupplydemand.org
36
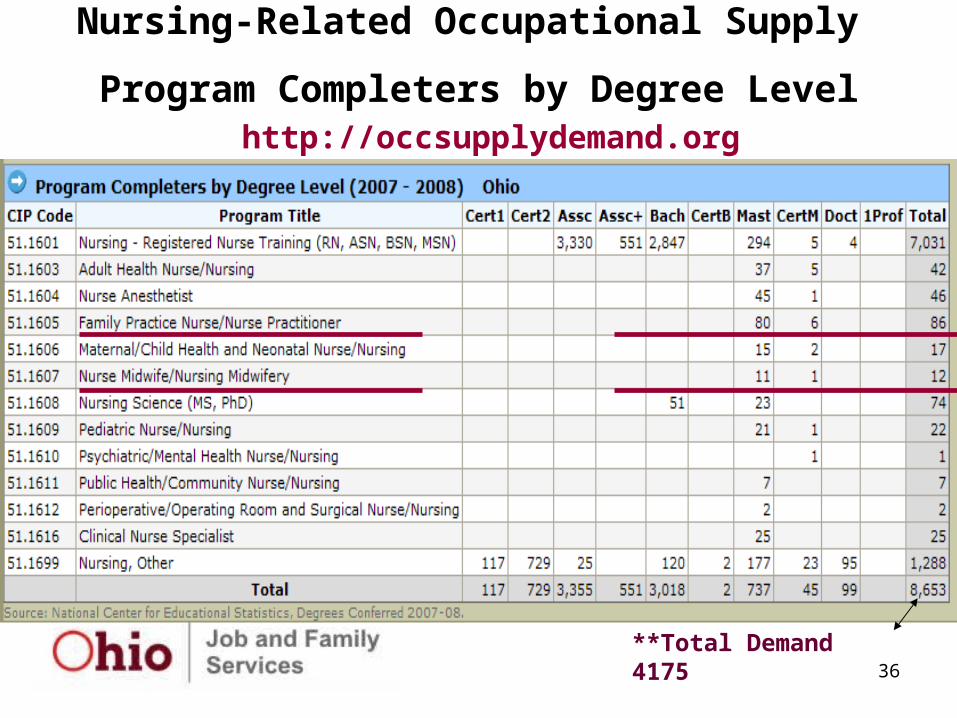
Nursing-Related Occupational Supply
Program Completers by Degree Levelhttp://occsupplydemand.org
**Total Demand 4175

39
Http://lmi.state.oh.us

40
41
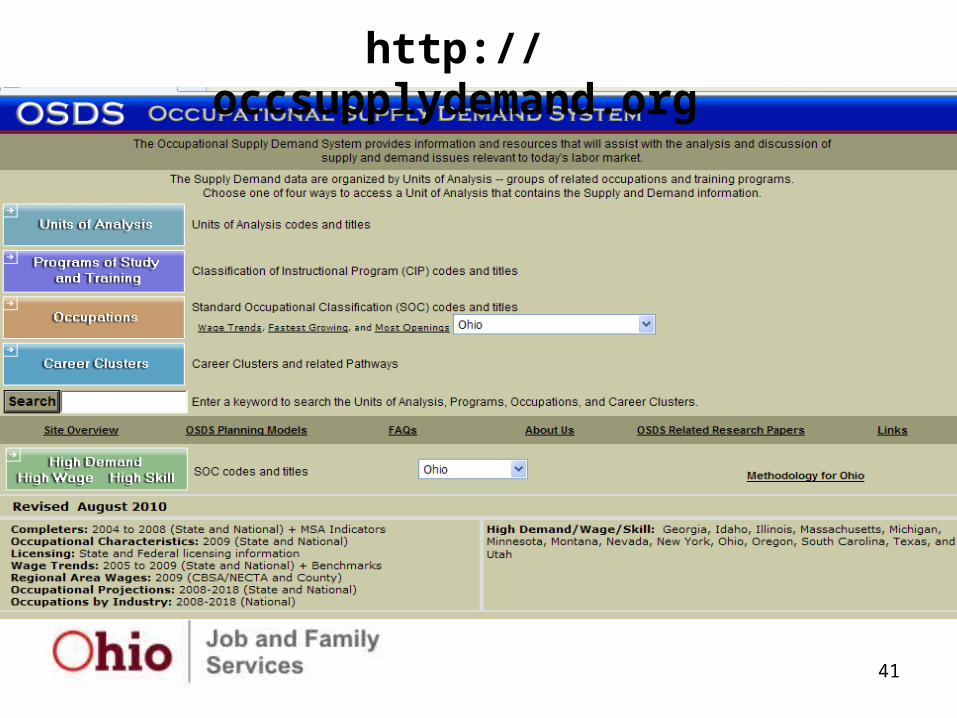
http://occsupplydemand.org

42
Ohio Bureau of Labor Market Information
•For further information contact:
Keith Ewald, Bureau ChiefBureau of Labor Market Information
Office of Workforce DevelopmentOhio Department of Job & Family
ServicesPhone:(614) 752-9494
E-mail: [email protected]